A Year of Journal of Open Humanities Data
I asked myself, "What can I learn by applying distant reading computing techniques against a single year of content from the
Journal of Open Humanities Data?" In a sentence, I learned a great deal about the Journal, and it very much lives up to is name.
Introduction
The
Journal of Open Humanities Data (JOHD) describes itself in the following way:
The Journal of Open Humanities Data (JOHD) aims to be a key part of a thriving community of scholars sharing humanities data. The journal features peer reviewed publications describing humanities research objects or techniques with high potential for reuse. Humanities subjects of interest to JOHD include, but are not limited to Art History, Classics, History, Library Science, Linguistics, Literature, Media Studies, Modern Languages, Music and musicology, Philosophy, Religious Studies, etc. Submissions that cross one or more of these traditional disciplines are particularly encouraged.
Well, being a librarian trained in the humanities and who has been practicing open access publishing and open source software distribution for longer than the phrases have been coined, the title "Journal of Open Humanities Data" piqued my interest. After all, sans one of the words in the title ("of"), all of the title words are personal favorites of mine. Thus, I wanted to know more. Where is the data? To what degree is the data open, and if to a large degree, then how is it accessible? If the data is open, then maybe I can work with it too, and maybe it can become part of a library collection? What questions is the data being used to address? I want to know more about JOHD.
To address my questions, I decided to apply distant reading computing techniques against one year's worth of JOHD content. The balance of this essay outlines what learned and how I learned it.
Creating the corpus and describing its basic characteristics
 I began by manually looping through
the whole of JOHD's volume 8 (2022) articles and locally caching PDF versions of each. [1] Along the way I created a rudimentary comma-separated values (CSV) file denoting the the author, initial title word, date, and type of each article in the volume. This part of the process was tedious. In fact, I had to do it twice because I did not do it correctly the first time.
I then fed both the cache as well as the CSV file to an (my) application called the Distant Reader. The Reader is a Python library and command-line application. It takes a folder of narrative content as input, and it outputs a data set (a "study carrel") intended for computation. Initially, each study carrel is a collection of rudimentary extracted features such as ngrams, parts-of-speech, named-entities, email addresses, URLs, and statistically computed keywords. [2] These extracted features, plus a few others, and then used to create different models ( think "views") of the original content. Much like the artists' life drawing sessions or plein art painting sessions, where artists set up their easels to manifest what they see, the modeling techniques I employ offer different perspectives on the same subject. None of the manifestations represent "the" truth, but instead, they offer perspectives intended for discussion and interpretation.
Size and readability
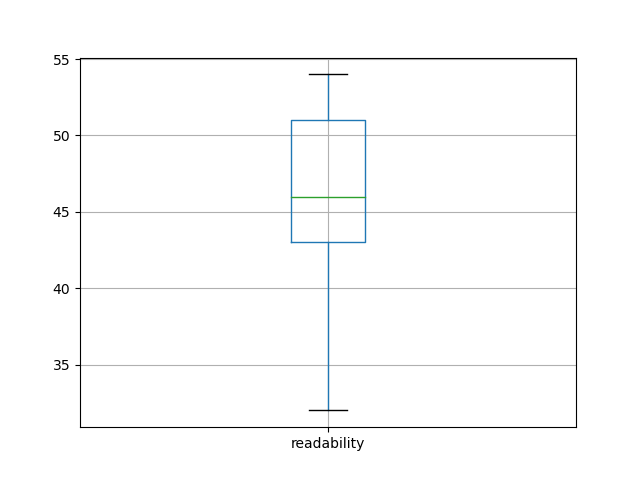
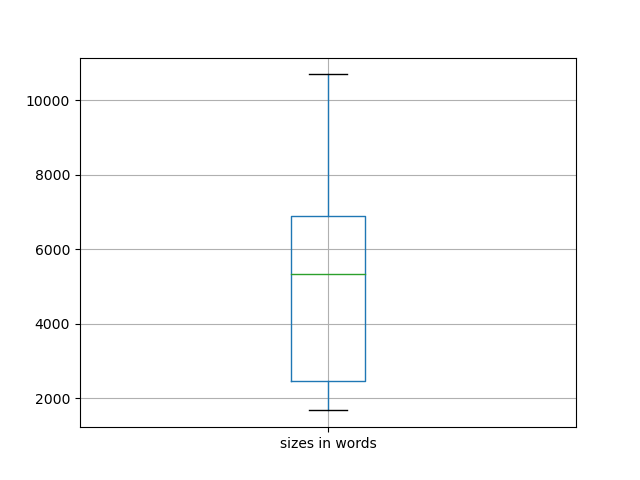 For example, volume 8 of JOHD is comprised of 29 articles for a total of 144,000 words. [3] Thus, the average size of each article is a little more than 5,000 words long, which jives with my personal experience. Why does size matter? It matters for a couple of reasons. First, it give me a sense of how long it would take me to read each article using traditional techniques. Second, different modeling techniques are easier (or more difficult) to employ depending on the size of the corpus. For example, if a corpus only contains two journal articles, then the traditional reading process will be more effective than computing techniques, but traditional reading does not scale when the corpus is measured in dozens of articles. When it comes to readability, volume 8 of JOHD is a bit more difficult to read than average. Readability can be measured in quite a number of different ways, but they all rely on similar factors: total size of document measured in words, total size of document measured in sentences, size of words (number of syllabus), and the ratio of unique words to non-unique words. The Reader employs a Flesch readability measure which is a scale from 0 to 100, where 0 means nobody can read the document to 100 meaning anybody can read the document. According to my observations, the average Flesch score is about 46, meaning the content is a bit more difficult than the average reader is able to consume. [4] Again, this jives with my experience. After all, the Journal's intended audience is not necessarily the layman, but rather the college educated person.
Ngrams and keywords
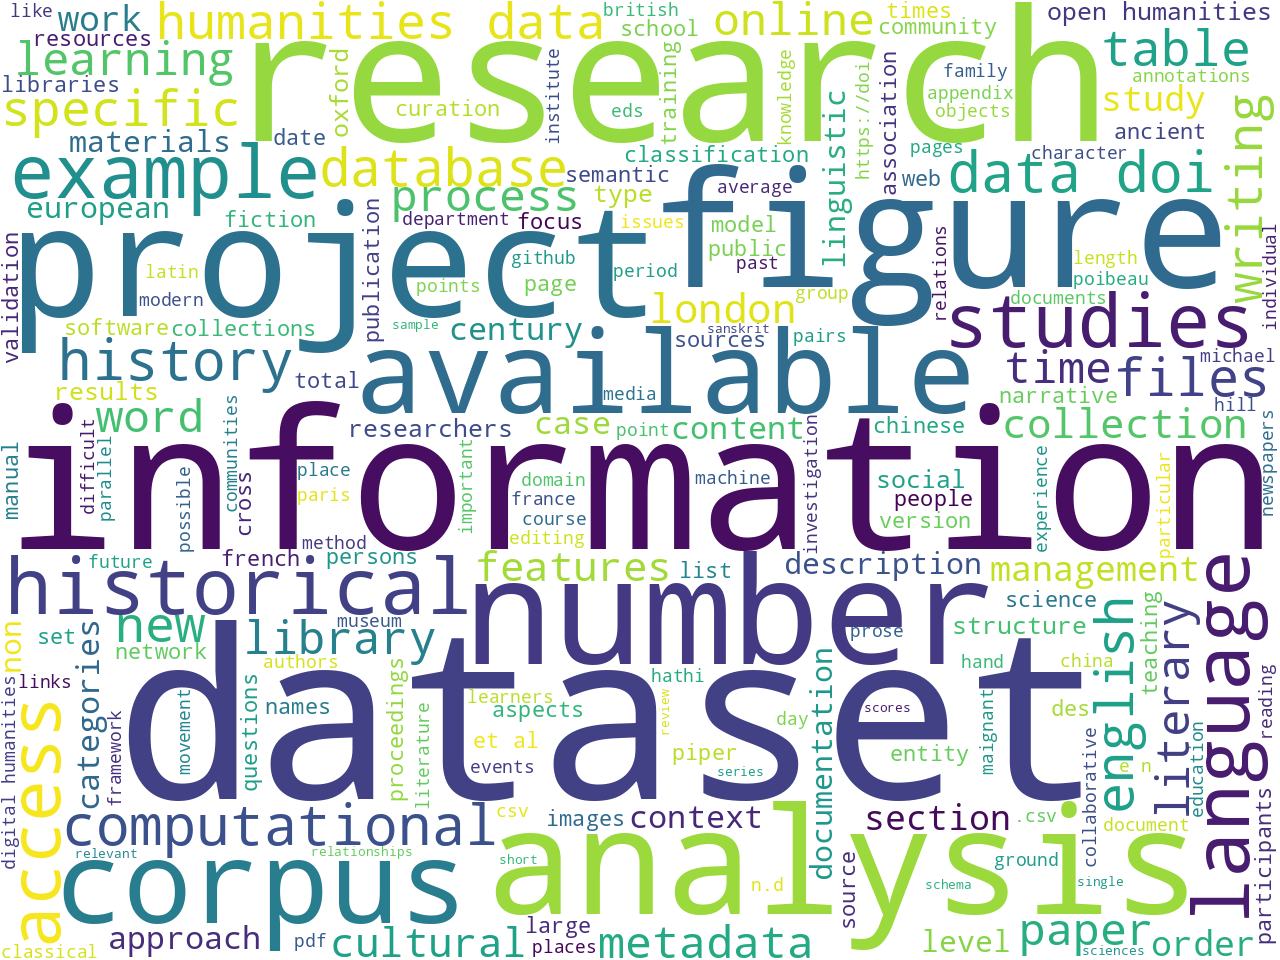
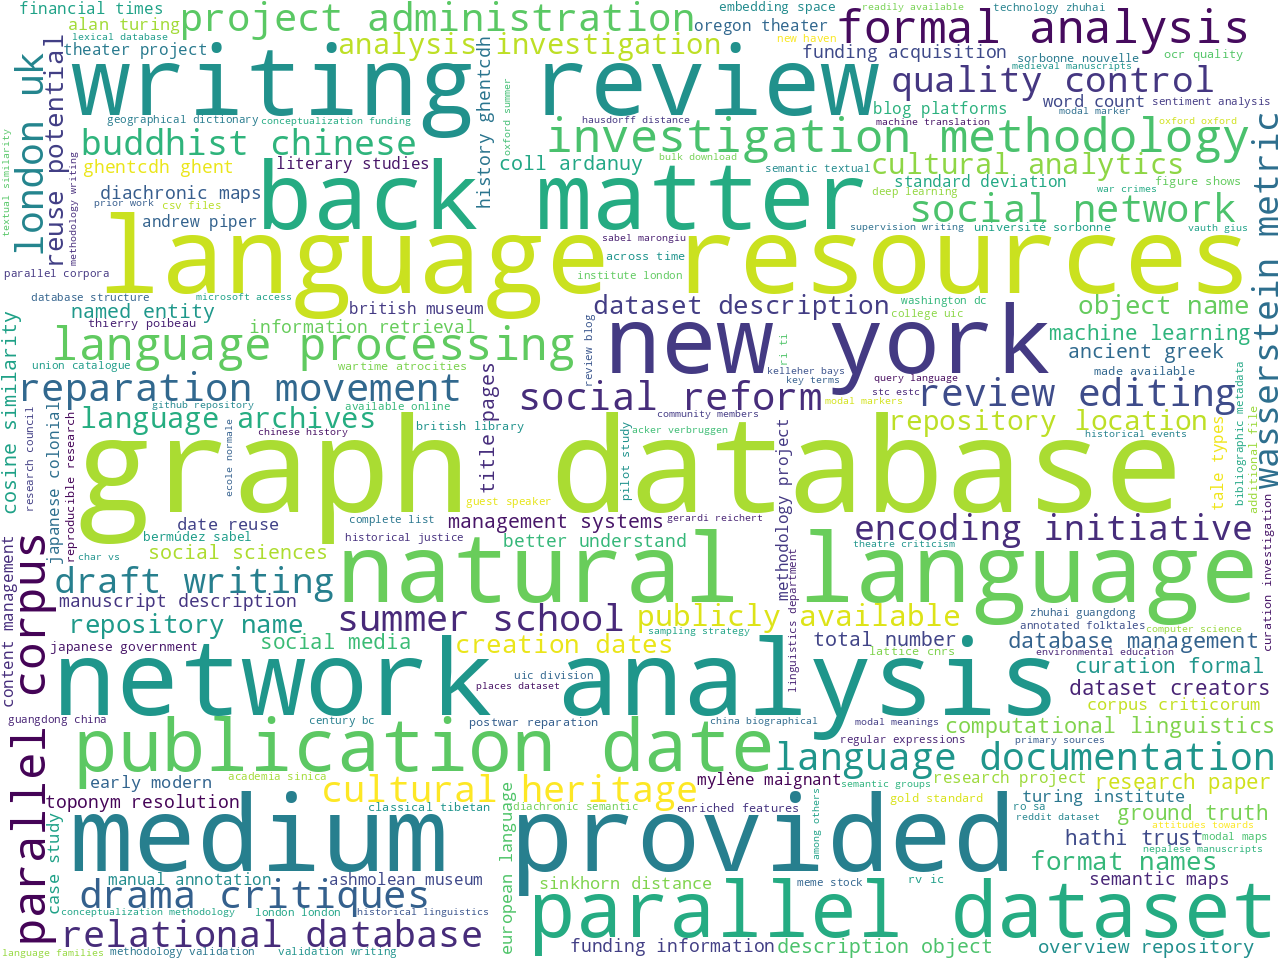
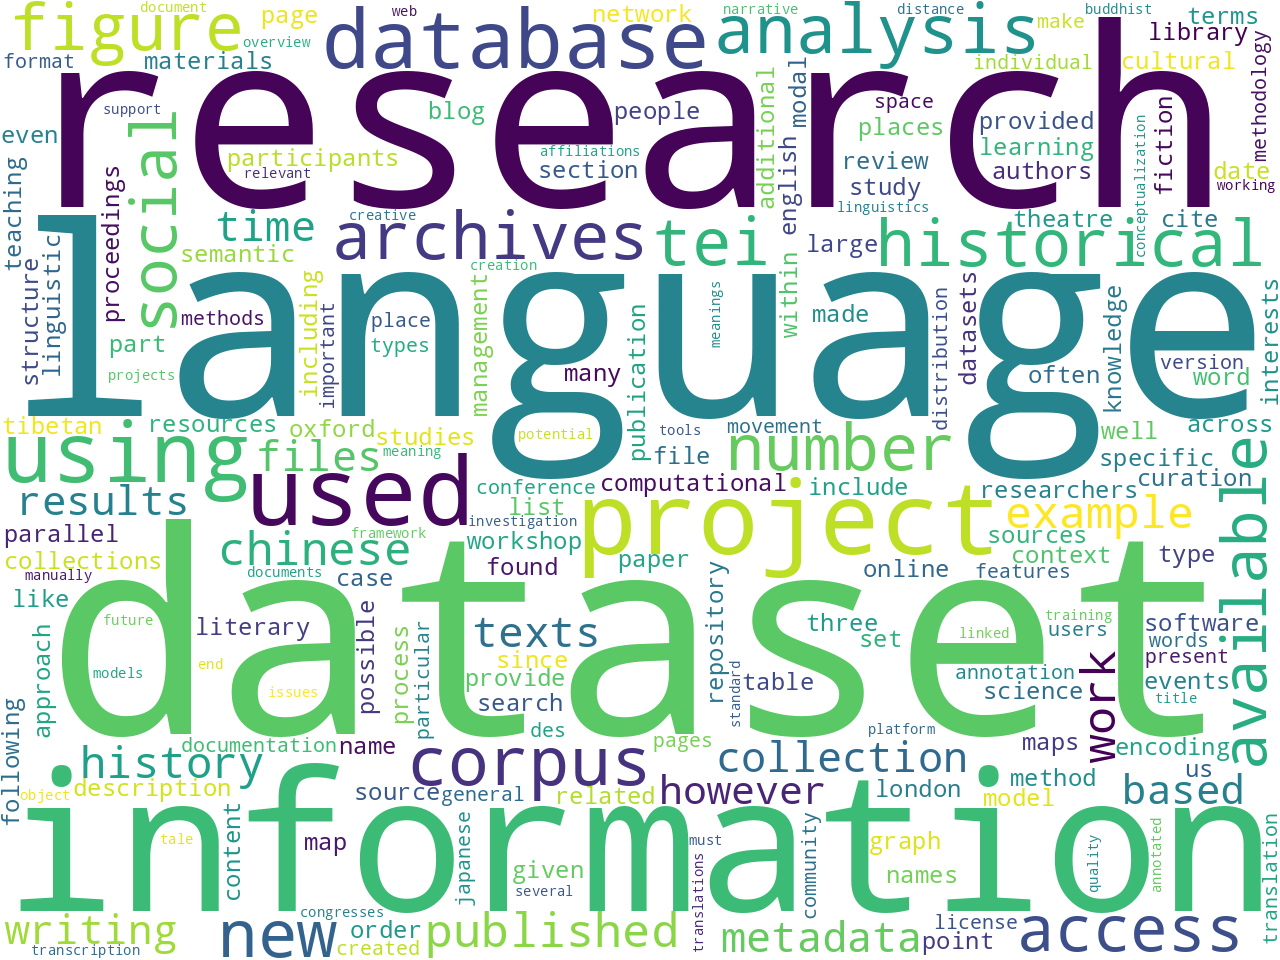 After fleshing out a
stopword list , counting & tabulating the frequency of unigrams and bigrams allude to the aboutness of the corpus. While often deemed sophomoric, such frequencies, manifested as word clouds, begin to tell a story. In this case, the Journal seems to be about, among other things, "language", "datasets", "graph databases", and "text encoding". Why is this important? Well, if I were to ask somebody what the Journal was about, I might be pointed to the introductory paragraph (above), and given a couple of well-meaning but vague sentences. On the other hand, unigram and bigram frequencies are more concrete, even if they lack context. Put another way, the word clouds enumerate many aboutness concepts, many more than a person would enumerate on their own. Thus, this modeling technique supplements the process of understanding the Journal.
Statistically significant computed keywords also allude to the aboutness of a corpus. In this case the Distant Reader employs an algorithm called YAKE, which is very similar to the venerable TF/IDF algorithm. By comparing the frequency of a word, to the size of the document, to the frequency of the word across the entire corpus, one can measure the significance of words. [5] Significant words are deemed as keywords by the Distant Reader, and apparently volume 8 of the Journal is about things like "database", "information", and "model".
Parts-of-speech, named-entities, and a bit more
Size, readability, ngram, and keyword visualizations are automatically generated by the Distant Reader software and manifested in a generic index page. The Reader also extracts parts-of-speech and named entities, which, in turn, are visualized as well. For more detail, see
the automatically generated index page for this study carrel. It echoes much of what has already been outlined.
Bibliography and full text search
Bibliography and full text search are additional ways to model a corpus, and thus make observations against it.
The Reader computes rudimentary bibliographies and manifests them in a few different data structures:
XHTML,
plain text, and
JSON. Given these structures, the student, researcher, or scholar can slice & dice the information to learn about the corpus and link to the cached content for the purposes of traditional reading. An example entry from the XHTML follows. While not in any traditional bibliographic format, the entry is completely usable and tells quite a lot about the given article. Note also the summary. It too is automatically generated by the Distant Reader software:
- faghihi-teaching-2022
- author: faghihi
- title: faghihi-teaching-2022
- date: 2022
- words: 9801
- flesch: 45
- summary: Oversight is provided by a board whose remit includes advice and training on the creation of TEI descriptions. Training was delivered in a series of structured workshops where the creation of TEI descriptions, with a particular focus on use of the authority files (lists of standard forms for certain entities in the data such as names and works), was embedded in a complete workflow involving collaborative working with GitHub.
- keywords: context; data; encoding; humanities; learning; manuscript; teaching; tei; text; text encoding
- versions:
original ;
plain text
A full text index is another type of model, and searching the index returns a subset of the corpus. The following form is an example interface to such an index, and unlike traditional full text indexes, this interface returns results in columnar formats enabling the student, researcher, or scholar to sort and filter the results before they are saved. Moreover, unlike many bibliographic indexes on the Web, links to articles do not point to "splash" nor "landing" pages, but instead point directly to the cached content:
[Form commented out.]
Many indexes expect the reader to begin from a cold start, but given things like the unigrams, bigrams, keywords, and bibliographic indexes described above, the reader is given insights (clues) into what might be actually found in the index, and thus they are empowered to submit more meaningful queries. Example queries include:
-
johd - returns all records in the index, and the results can be sorted by author, size, readability, etc.; this is a more interactive version of the XHTML bibliography and addresses questions like "Which item is the longest?", "Which item is the easiest to read?", "Which items were published when?", etc.
-
summary:research AND dataset* - returns items with the word "research" in the summary field and many different forms of the word "dataset" anywhere in the text
-
"graph database" - finds all items containing the phrase "graph database"
-
keyword:tei - returns the items the Reader software predicts are most about TEI, but the search for just
tei returns a number of items containing the word "tei" someplace in the document
More on aboutness: topic modeling
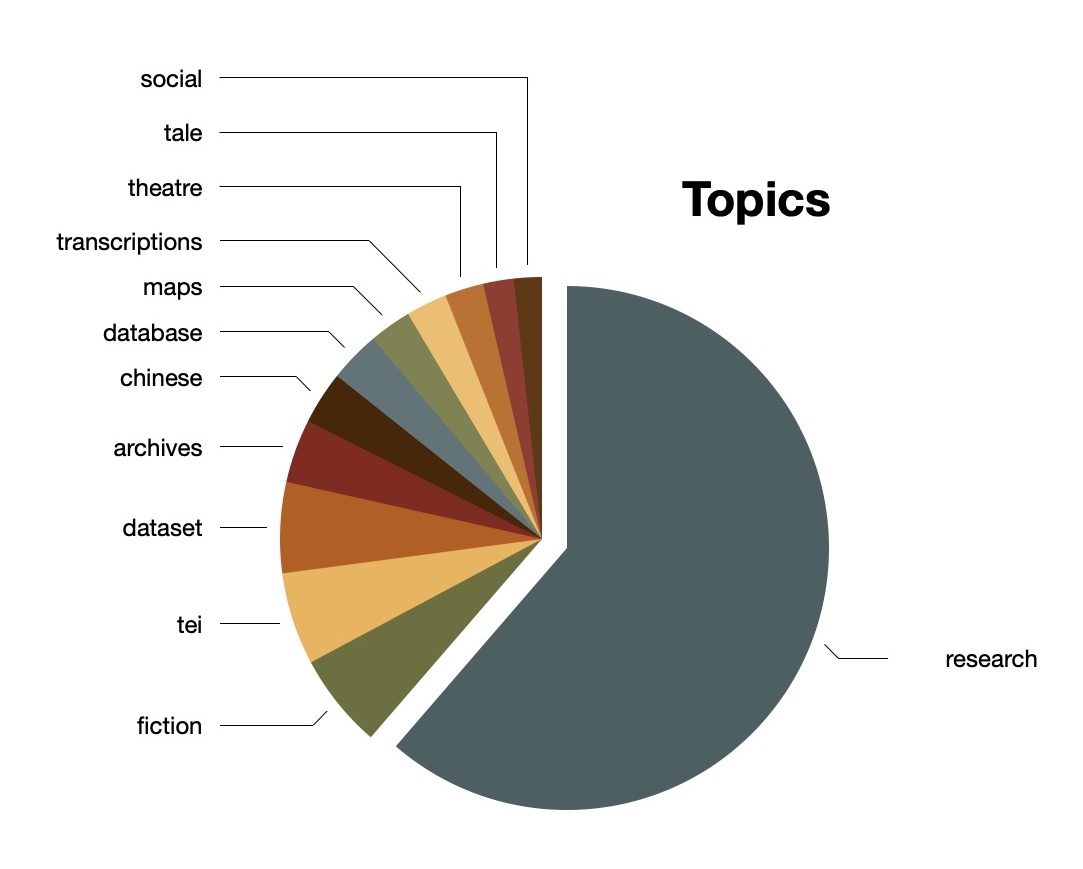
Topic modeling is an additional method for evaluating the aboutness of a study carrel. In a sentence, topic modeling is an unsupervised machine learning process used to enumerate latent themes in a corpus. Given an integer (T), the topic modeler will divide a corpus into T clusters of words, and each cluster can be denoted as a topic or theme. For better or for worse, there are zero correct values for T. [6] Instead, one might choose a value for T such that the results are plausible or tell a compelling story. One might also choose a value of T such that the results are easy to visualize.
For better or for worse, I denoted T equal to 12, ran the modeler until the model seemed to coalesce, and came up with the following topics:
topics  weights  features
          research  0.51906  research dataset project information used anal...
           fiction  0.04955  fiction distance computational study hathi pip...
               tei  0.04830  tei encoding participants teaching workshop le...
           dataset  0.04741  dataset newspapers wood variables annotated lo...
          archives  0.03326  archives language collections materials users ...
           chinese  0.02759  chinese parallel tibetan translation dataset b...
          database  0.02665  database graph network japanese movement lawsu...
              maps  0.02207  maps modal events meanings semantic modality m...
    transcriptions  0.02151  transcriptions transcription oregon pages thea...
           theatre  0.02031  theatre blog corpus reviews maignant gius vaut...
              tale  0.01601  tale places science research language nakala d...
            social  0.01453  social congresses organizations reform ghent v...
Luckily for me, the computed topics and features echo values from the ngram and keyword analysis. Moreover, they also echo, more or less, the
full titles listed on the Journal's home page . Visualizing the result allows me to predict the articles are mostly about research-dataset-project-information-used. Each of the smaller topics, I predict, are examples of the broader theme:
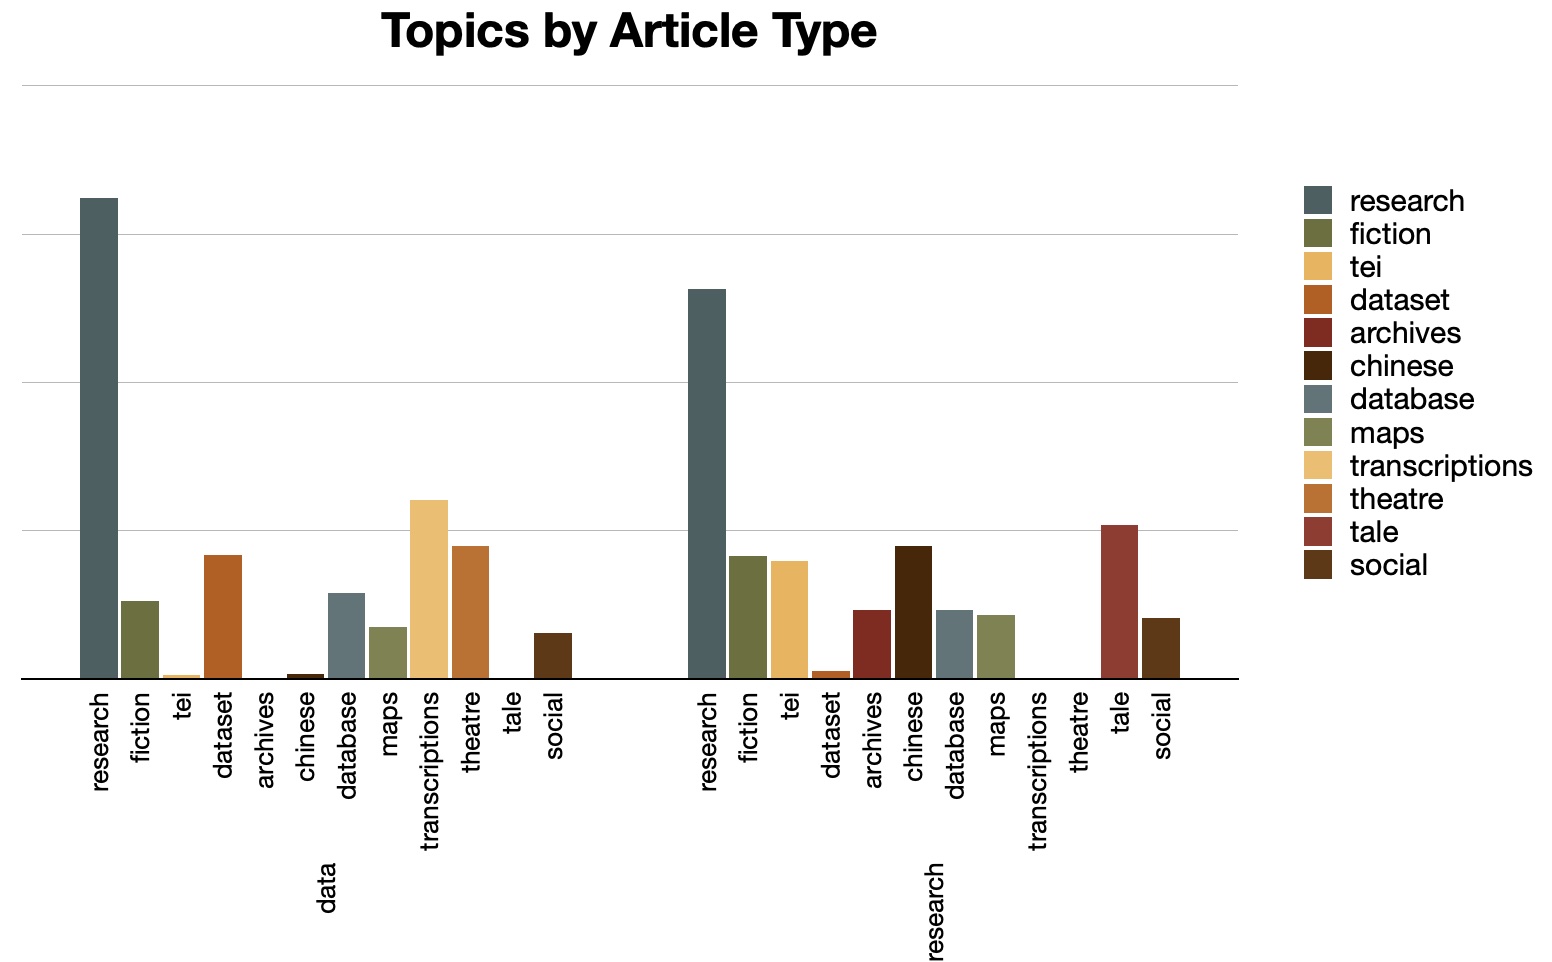
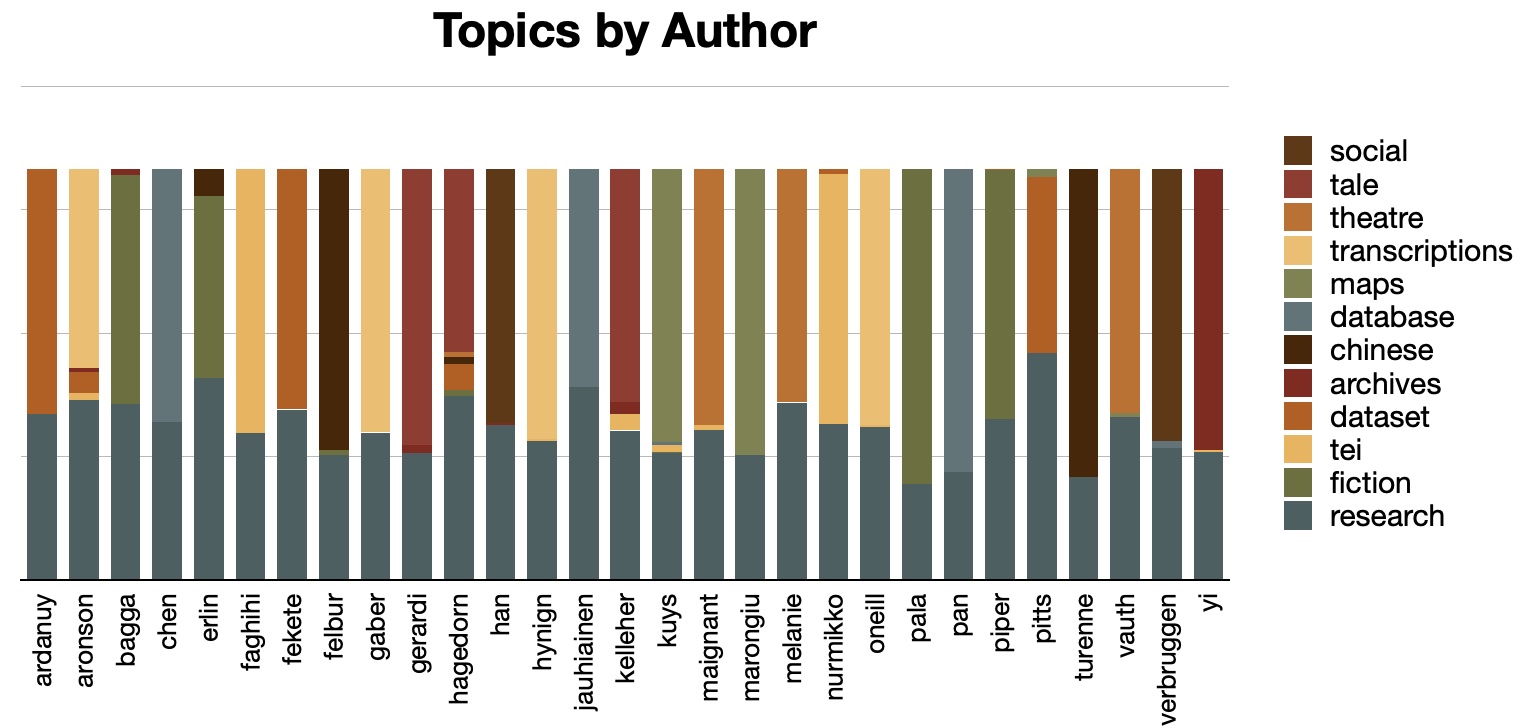
Topic modeling becomes much more interesting when it is supplemented with metadata and pivoted accordingly. For example, each article has been classified by the Journal as a data paper or a research paper. Taking this into account, I can see, for example, both types of papers concern themselves with "research" and "database", but the data papers are more about "transcription" and "theator" where the research papers are more about "tei" and "chinese". Similar comparisons can be made when it comes to author metadata values. In this case, each author writes about "research" and focuses on one other topic. Put another way, the articles by "aronson" and "hagadorn" are the most diverse, but just barely:
Network graphs and relationships
Authors write articles, and articles are described with keywords. Thus, there are inherent relationships between the authors, articles, and keywords. These relationships can be modeled as linked data, serialized in any number of resource description framework (RDF) formats, and visualized as network graphs. More specifically, the Distant Reader models the each study carrel's metadata as an
RDF/XML file . This file can then be queried to output a
Graph Modeling Language (GML) file. Finally, the GML file can be imported an application like Gephi for both evaluation and visualization.
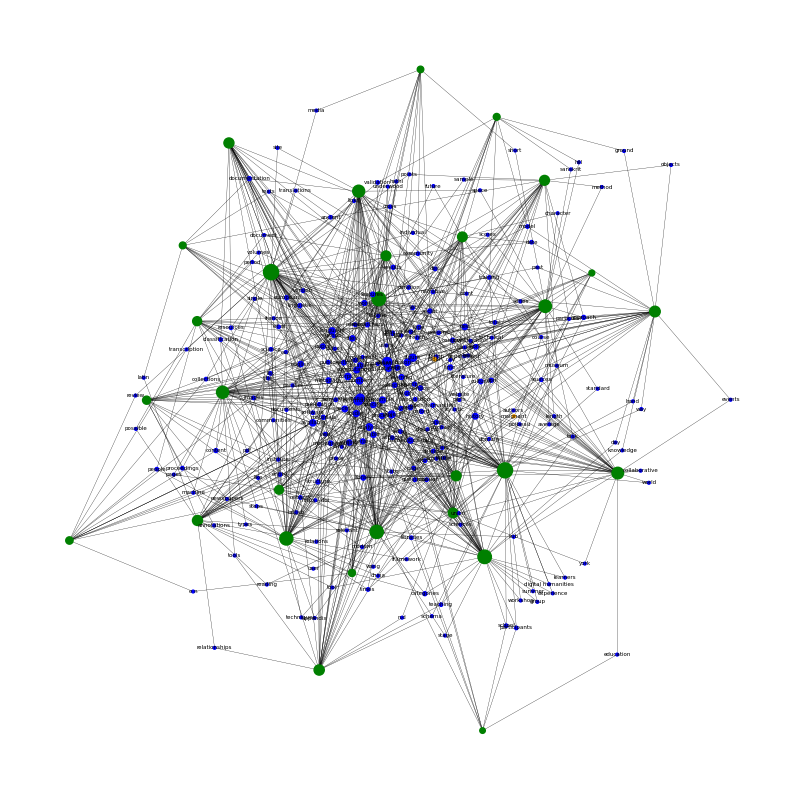
For example, the resulting GML file can be visualized as a simple force-directed diagram, and we can see that the articles are loosely joined; since the articles do not share very many keywords, the resulting graph is really a set of many smaller graphs. Furthermore, the betweenness value of each node can be calculated, and each node can be scaled accordingly. Since the range of betweenness values is relatively small, most of the nodes are of similar size:
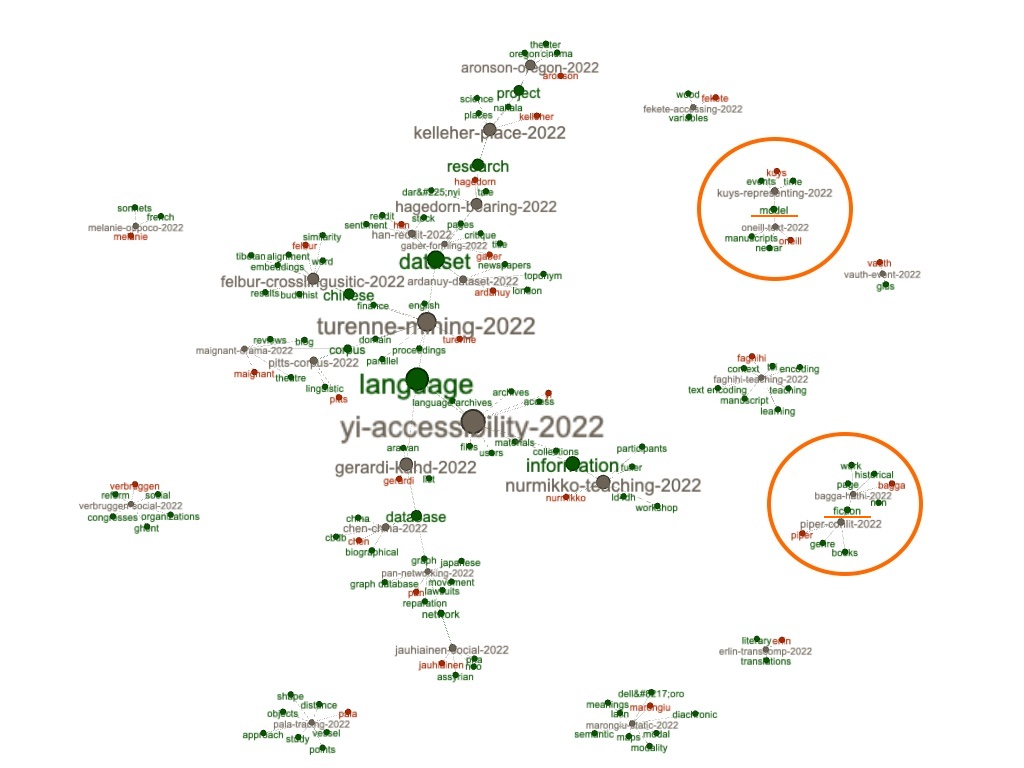
Colorizing the nodes based on author, title, and keyword allows us to see, in yet another way, the topics of each article and who wrote them. Notice how the keywords "model" and "fiction" are keywords for two different pairs of articles, and sure enough, when the full text index is queried for
keyword:model or
keyword:fiction , then only two articles are returned for each:
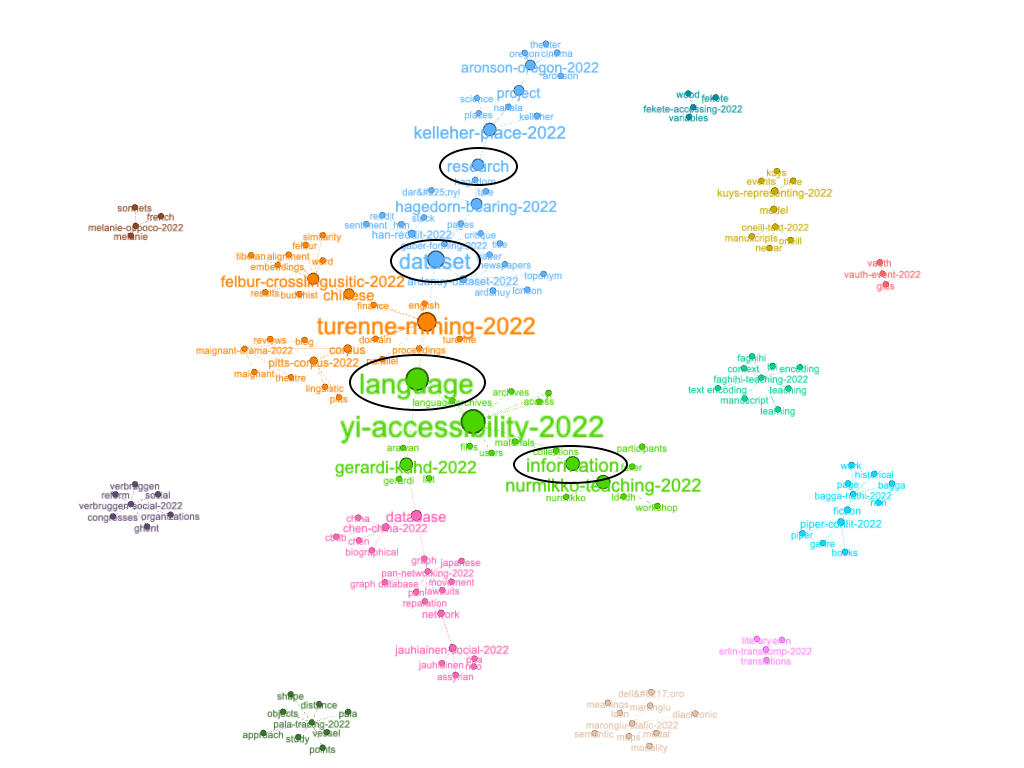
Network graphs have many properties, and one such property -- betweenness -- has already been mentioned. Another property is "modularity", which is a type of clustering similar to topic modeling. After applying modularity to the graph, the subgraphs group themselves and patterns emerge. From the result we can see that, more than the others, the keywords of "language", "dataset", "research", and "information" are more widely shared across the corpus:
"Yes, but what about the datasets!?"
I believe it has been established that the Journal's is content is very much aligned with its title; the Journal is very much about humanities data. So now, I want to know about the data. To address this issue, I first concordanced for the phrase "dataset" and more than 400 lines where returned. I then concordanced for "dataset is" and truncated the results by removing everything before the query, and the result is now a set of pseudo-definitions. Some of the more interesting results include:
[dataset is] a bilingual chinese-english parallel dataset of news in the domain of finance.
[dataset is] an additional tsv file that contains the metadata associated with each article:
[dataset is] a social network of over 17,000 individuals attested in cuneiform documents fro
[dataset is] available at https://doi.org/10.5281/zenodo.5591908 3.3 data statistics the dat
[dataset is] available in .csv creation dates the survey was carried out in april, may, and
[dataset is] comprised of 343 articles carefully sampled from a variety of provincial ninete
[dataset is] created by manual annotation using the catma tool (gius et al., 2022) for the m
[dataset is] designed to provide researchers with freely accessible derived data of a robust
[dataset is] freely available but named entities are anonymized. 2.2 building domain-specifi
[dataset is] located in a github repository within the fortext organisation: https://github.
[dataset is] made openly available, there is great potential for future collaboration to val
[dataset is] made with sinorama magazine articles with 50,000 sentences)7 but their conclusi
[dataset is] more easily and more efficiently queried than a written corpus, facilitating re
[dataset is] part of an ongoing collaborative research project by undergraduate students enr
[dataset is] protected by copyright, we are not able to release the full text of pages. meta
[dataset is] published in the british library shared research repository, and is especially
[dataset is] released under open license cc-by-nc-sa, available at https://creativecommons.
[dataset is] reusable for several natural language processing (nlp) tasks focused on the det
[dataset is] rich with name variations that are characteristic of historical data, such as s
[dataset is] still in-process and being added to on a regular basis. it is comprised of comp
[dataset is] stored in the british library shared research repository at https://doi.org/10.
[dataset is] suitable for teaching statistical representativeness. 5. dataset allows for fur
[dataset is] therefore distributed under a creative commons attribution-sharealike 4.0 inter
[dataset is] the study of neologisms. for example, to find the chinese equivalent to about a
[dataset is] thus designed to give researchers access to stylistic data of contemporary, pro
[dataset is] to give researchers a portable yet extensive representative sample of historica
[dataset is] too small to draw any conclusions about the historical or art historical trajec
[dataset is] useful for identifying the important concepts and actors of the domain. these c
Concordances are nice, but sentences can be better. Thus, I created a list of all the dataset's ("study carrel's") sentences, and filtered the result to include only sentences with the phrase "dataset is". Again, here are some of the more salient results:
- OVERVIEW REPOSITORY LOCATION https://doi.org/10.5281/zenodo.5862904 CONTEXT This
dataset is a social network of over 17,000 individuals attested in cuneiform documents from the Neo-Assyrian period, primarily in the eighth and seventh centuries BCE.
- A pioneering work in text mining and English-Chinese texts is probably C.-H. Lee and Yang (2000), who used a neural network clustering method called Self-Organizing maps to extract clusters from an English-Chinese parallel dataset (this parallel
dataset is made with Sinorama magazine articles with 50,000 sentences)7 but their conclusion only reveals the potential of the 5 https://www.ecb.europa.eu/press/key/html/downloads.en.html (last accessed: 01.03.2022).
- A usage case of the
dataset is the study of neologisms.
- Although the
dataset is too small to draw any conclusions about the historical or art historical trajectory of the objects analyzed here, it does serve to illustrate the value of the computational approach in comparing objects.
- Because the
dataset is made openly available, there is great potential for future collaboration to validate, correct, and expand it.
- Drama Critiques'
dataset is then the first corpus which not only offers so many contemporary reviews based on journalists and bloggers' publications, but which also proposes a study of its content (https://doi.org/10.5281/zenodo.6799656).
- https://doi.org/10.6084/m9.figshare.20055500 3Fekete and Kendöl Journal of Open Humanities Data DOI: 10.5334/johd.82 (3) DATASET DESCRIPTION OBJECT NAME The
dataset is called "Survey data of children's attitudes towards trees and the use of wood".
- It goes without saying that a digital
dataset is more easily and more efficiently queried than a written corpus, facilitating research results that would otherwise be difficult or impossible to achieve.
- Our
dataset is designed to provide researchers with freely accessible derived data of a robust collection of professionally published writing in English produced since 2001, which spans 12 different genre categories.
- Our
dataset is thus designed to give researchers access to stylistic data of contemporary, professionally published writing that spans a range of genre definitions and institutional frameworks.
- REPOSITORY NAME The
dataset is stored in the British Library shared research repository at https://doi.org/10.23636/ r7d4-kw08.
- Since most of the
dataset is protected by copyright, we are not able to release the full text of pages.
- The
dataset is available at https://doi.org/10.5281/zenodo.5591908 3.3 DATA STATISTICS The dataset contains various metadata, such as title and text body both in English and Chinese, the time of publication, and some topic tags.
- The
dataset is published in the British Library shared research repository, and is especially of interest to researchers working on improving semantic access to historical newspaper content.
- The logical structure of our
dataset is straightforward.
- The Places
dataset is designed to promote continuing investigation.
- The whole
dataset is stored in eight CSV files and four HTML files.
- This
dataset is a bilingual Chinese-English parallel dataset of news in the domain of finance, and is open access.
- This
dataset is comprised of 343 articles carefully sampled from a variety of provincial nineteenth-century newspapers based in four different locations in England.
My main take-away from this is two-fold. First and for the most part, the datasets are freely available, someplace. Second, all of those "someplaces" are associated with URLs. Fortunately, URLs are one of the features extracted by the Distant Reader, and they are available from both a command-line interface as well as
a set of delimited files . [7]
More specifically, the study carrel included about 1,200 URLs. After removing duplicates, running them through a link checker, removing items used as citations to papers, removing URLs which obviously pointed to the roots of larger domains (like https://github.com), and removing URLs obviously not pointing to data sets (like https://www.loc.gov/standards/mads/rdf), the
resulting set of URLs totaled just less than 300 items. Some of the more interesting URLs, where the items linked to zenodo and the items associated with the Library of Congress. Some of them include:
Summary and conclusion
To summarize, as a set of PDF files, I downloaded the whole of Journal of Open Humanities Data (volume 8), and then I processed them with a tool called the Distant Reader. Against the resulting dataset I did some analysis -- "reading". Through this process I learned, confirmed, and can verify with many examples that the Journal's contents very much live up to the Journal's title. (Not that I had any doubts, but I often do not take things on face value.) I then did my best to take a closer look at the URLs included in the articles in an effort to learn about the datasets being studied. There are zero Earth-shattering results here, but I did become much more aware of an interesting journal.
"Thank you!", and fun with distant reading.
Notes
[1] Each article in volume 8 of JOHD has also been encoded in XML, which, in my humble opinion, ought to be the canonical distribution format for scholarly journal articles. XML is timeless, and if you are unable to open and make sense of a file encoded as XML, then you have bigger computing problems with which to concern yourself. Kudos to the editors and publishers of JOHD.
[2] For more information about the Distant Reader, see its home page:
https://distantreader.org .
[3] By comparison, the
Bibleis about 800,000 words long, and
Moby Dickis about 275,000 words long.
[4] By comparison, Moby Dick's Flesch score is in the 70s, and Shakespeare's
Sonnets, which is comprised of many short "sentences" and many short words (like "eyes" and "love") has a score in the 90s.
[5] When processes such as YAKE and TF/IDF are applied to Moby Dick, then words such as "whale", "man", and "ship" are returned as significant.
[6] There are zero correct values for T. After all, how many topics are the whole of Shakespeare's works about?
[7] Extracting URLs from plain text files derived from PDF documents is notoriously difficult. This is true because the formatting of the PDF files adds unpredictable carriage returns, etc to the output, and since URL's can not contain carriage returns, some of the extracted URLs are bogus. The extraction of URLs from plain text files is functional but not perfect.
Epilogue
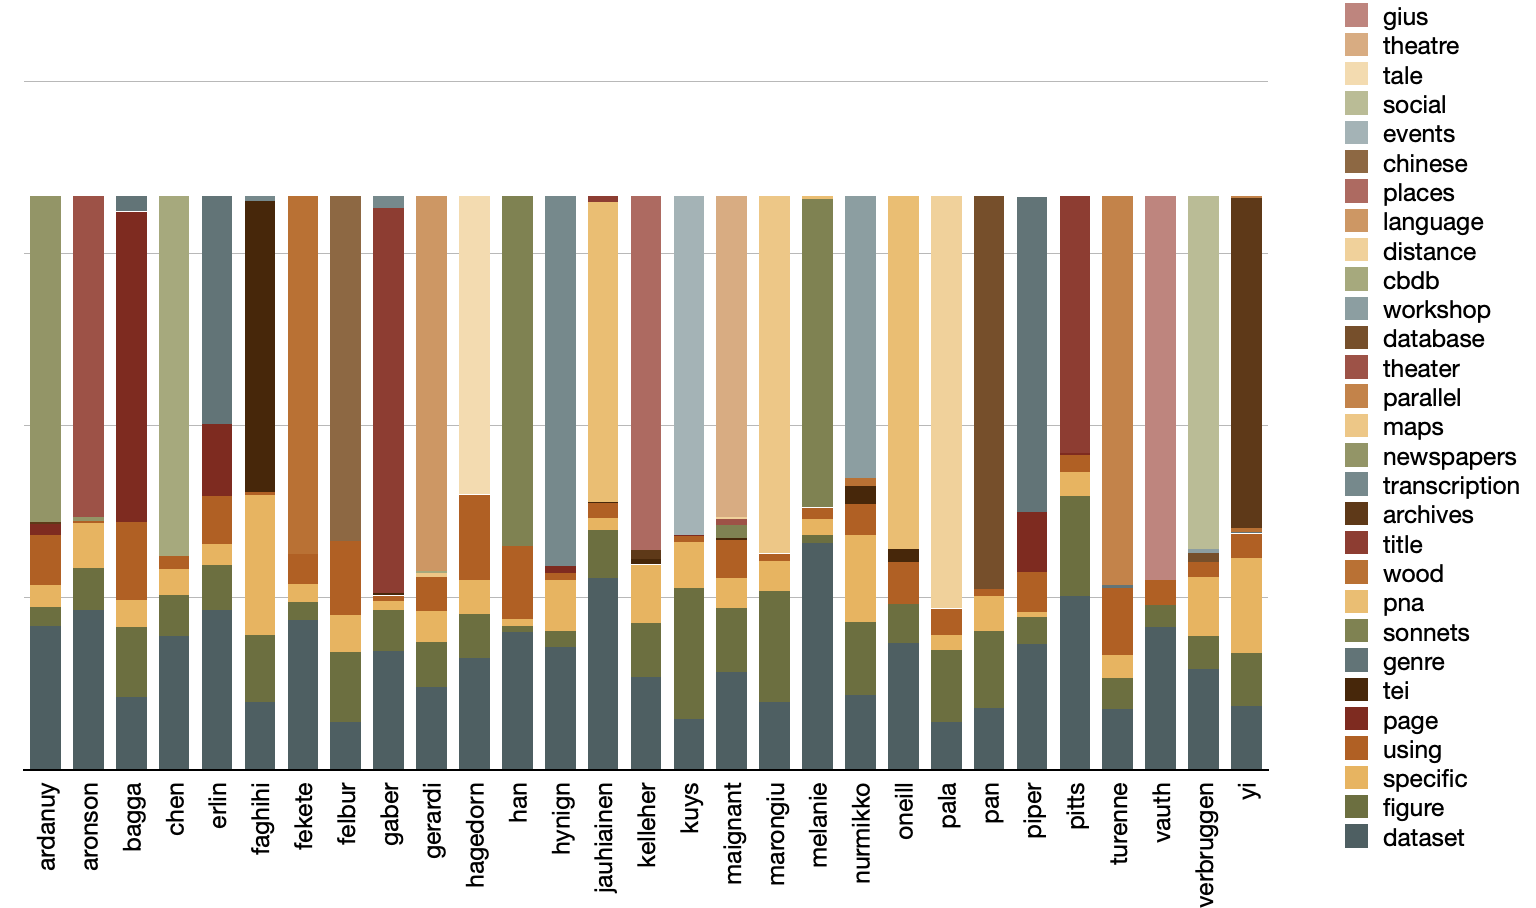
This epilogue contains two notes. First, on a whim, I went back and topic modeled the corpus using a value of T equal to the number of author's in the collection, 29. I then pivoted the model on author names to see the degree each author discussed something unique. Not to my surprise and as alluded to previously, each author discusses something rather unique. This is visualized below; notice how each author is, more or less, dominated by a single color:
Second,
this entire missive and its associated dataset has been compressed into a single zip file so others can do their own evaluations. See the bottom of the
automatically generated index.htm for suggestions on how to use it.
Eric Lease Morgan <
emorgan@nd.edu >
Navari Family Center for Digital Scholarship
University of Notre Dame
Date created: July 13, 2023
Date updated: May 30, 2024
 I began by manually looping through
the whole of JOHD's volume 8 (2022) articles and locally caching PDF versions of each. [1] Along the way I created a rudimentary comma-separated values (CSV) file denoting the the author, initial title word, date, and type of each article in the volume. This part of the process was tedious. In fact, I had to do it twice because I did not do it correctly the first time.
 For example, volume 8 of JOHD is comprised of 29 articles for a total of 144,000 words. [3] Thus, the average size of each article is a little more than 5,000 words long, which jives with my personal experience. Why does size matter? It matters for a couple of reasons. First, it give me a sense of how long it would take me to read each article using traditional techniques. Second, different modeling techniques are easier (or more difficult) to employ depending on the size of the corpus. For example, if a corpus only contains two journal articles, then the traditional reading process will be more effective than computing techniques, but traditional reading does not scale when the corpus is measured in dozens of articles. When it comes to readability, volume 8 of JOHD is a bit more difficult to read than average. Readability can be measured in quite a number of different ways, but they all rely on similar factors: total size of document measured in words, total size of document measured in sentences, size of words (number of syllabus), and the ratio of unique words to non-unique words. The Reader employs a Flesch readability measure which is a scale from 0 to 100, where 0 means nobody can read the document to 100 meaning anybody can read the document. According to my observations, the average Flesch score is about 46, meaning the content is a bit more difficult than the average reader is able to consume. [4] Again, this jives with my experience. After all, the Journal's intended audience is not necessarily the layman, but rather the college educated person.

 After fleshing out a


