establishing seasonal and alert influenza thresholds in cambodia using the who method: implications for effective utilization of influenza surveillance in the tropics and subtropics
original research
sovann ly,a takeshi arashiro,b,c,d vanra ieng,b reiko tsuyuoka,b amy parry,b paul horwood,e seng heng,a sarah hamid,f katelijn vandemaele,g savuth chin,h borann sar,i yuzo arimac
a communicable disease control department, ministry of health, phnom penh, cambodia.
b who representative office in cambodia, phnom penh, cambodia.
c infectious disease surveillance center, national institute of infectious diseases, tokyo, japan.
d school of medicine, tokyo medical and dental university, tokyo, japan.
e virology unit, institut pasteur in cambodia, phnom penh, cambodia.
f emerging disease surveillance and response, world health organization regional office for the western pacific, manila, philippines.
g global influenza programme, world health organization, geneva, switzerland.
h national public health laboratory, national institution of public health, phnom penh, cambodia.
i influenza program, united states centers for disease control and prevention, phnom penh, cambodia.
correspondence to yuzo arima (email:arima@niid.go.jp).
to cite this article:
ly s, arashiro t, ieng v, tsuyuoka r, parry a, horwood p, et al. establishing seasonal and alert influenza thresholds in cambodia using the who method: implications for effective utilization of influenza surveillance in the tropics and subtropics. western pac surveill response j. 2017 mar;8(1). doi:10.5365/wpsar.2017.8.1.002.
objective: to establish seasonal and alert thresholds and transmission intensity categories for influenza to provide timely triggers for preventive measures or upscaling control measures in cambodia.
methods: using cambodia's influenza-like illness (ili) and laboratory-confirmed influenza surveillance data from 2009 to 2015, three parameters were assessed to monitor influenza activity: the proportion of ili patients among all outpatients, proportion of ili samples positive for influenza and the product of the two. with these parameters, four threshold levels (seasonal, moderate, high and alert) were established and transmission intensity was categorized based on a world health organization alignment method. parameters were compared against their respective thresholds.
results: distinct seasonality was observed using the two parameters that incorporated laboratory data. thresholds established using the composite parameter, combining syndromic and laboratory data, had the least number of false alarms in declaring season onset and were most useful in monitoring intensity. unlike in temperate regions, the syndromic parameter was less useful in monitoring influenza activity or for setting thresholds.
conclusion: influenza thresholds based on appropriate parameters have the potential to provide timely triggers for public health measures in a tropical country where monitoring and assessing influenza activity has been challenging. based on these findings, the ministry of health plans to raise general awareness regarding influenza among the medical community and the general public. our findings have important implications for countries in the tropics/subtropics and in resource-limited settings, and categorized transmission intensity can be used to assess severity of potential pandemic influenza as well as seasonal influenza.
introduction
influenza poses a substantial health and economic burden with high morbidity and mortality in temperate regions.1-4 the burden of influenza in the tropics and subtropics is not well understood, although growing evidence suggests that it is comparable to that of temperate regions.3-7 furthermore, while yearly variations may occur, seasonality also appears to exist in most tropical and subtropical regions.8-11 therefore, it is essential to analyse influenza surveillance data in a practical and efficient manner to inform decision-making regarding influenza in the tropics and subtropics.
recently, based on sentinel surveillance data from cambodia's national influenza center established in 2006, distinct seasonality for influenza in cambodia was demonstrated.12,13 using the proportion of influenza-like illness (ili) patient samples positive for influenza, the influenza season appeared to be between june and december, coinciding with the rainy season. however, such findings have not yet been fully used for routine public health practice. establishing specific influenza thresholds at the national level for season onset and intensity levels could provide timely triggers for public health measures, such as awareness-raising for prevention, upscaling control measures and resource allocation. various methods such as visual inspection, pre-set constant values and the moving epidemic method have been implemented in countries to signal season onset.8,14-16
in the present study, a simple method proposed by the world health organization (who) was used to establish seasonal and alert influenza thresholds for cambodia to better inform public health decision-making regarding influenza.17 the who method allows for monitoring intensity of not only seasonal influenza but also potential pandemics. a key lesson learnt from the 2009 pandemic was that who and most countries were not sufficiently prepared to assess the severity of a mild pandemic to inform timely risk management and communications. following the international health regulations review committee recommendations, who is developing the pandemic influenza severity assessment (pisa) framework.18 to assess severity of a pandemic, comparison with historical data is important. establishing influenza alert thresholds allows for the comparison of data during a pandemic relative to historical seasonal data. to our knowledge, this is one of the first documented assessments and applications of the who method for threshold setting in the tropics or subtropics.
methods
influenza surveillance system in cambodia
cambodia's influenza surveillance system has two key components: (1) weekly syndromic ili surveillance; and (2) laboratory testing of specimens collected from ili patients for influenza virus, both of which come from sentinel sites. while there is also a surveillance system for severe acute respiratory illness (sari), it was not included because only the past three years' data were available with too few sari cases to establish thresholds.
there were eight sentinel sites in operation during the study period of week 1 of 2009 to week 25 of 2015, including four health centres (hcs) in battambang, kampong cham, kampot and mundol kiri provinces; two paediatric hospitals in phnom penh and siem reap provinces; and two general hospitals in svay rieng and takeo provinces. not all sentinel sites provided data during the entire study period. the following contributed data during shorter periods: hcs in kampot and mundol kiri provinces (since 2010), svay rieng referral hospital (since mid-2009) and takeo provincial hospital (2009-2012). thus, there were six to eight sentinel sites contributing data at a given time.
an ili case was defined as a person presenting with sudden onset of fever (temperature >38ºc) and cough and/or sore throat in the absence of other diagnosis. although the number of samples collected varied yearly due to minor protocol changes, approximately 5-10 nasopharyngeal swabs per site per week were collected from ili patients. collected specimens were laboratory tested for influenza virus at the national institute of public health and/or institut pasteur in cambodia, except for the site in battambang province where the testing facility is in the province. viral rna was extracted using commercial extraction kits and amplified with reverse transcription polymerase chain reaction (rt-pcr) using standard protocols.12,13
data sources and parameters to monitor influenza activity
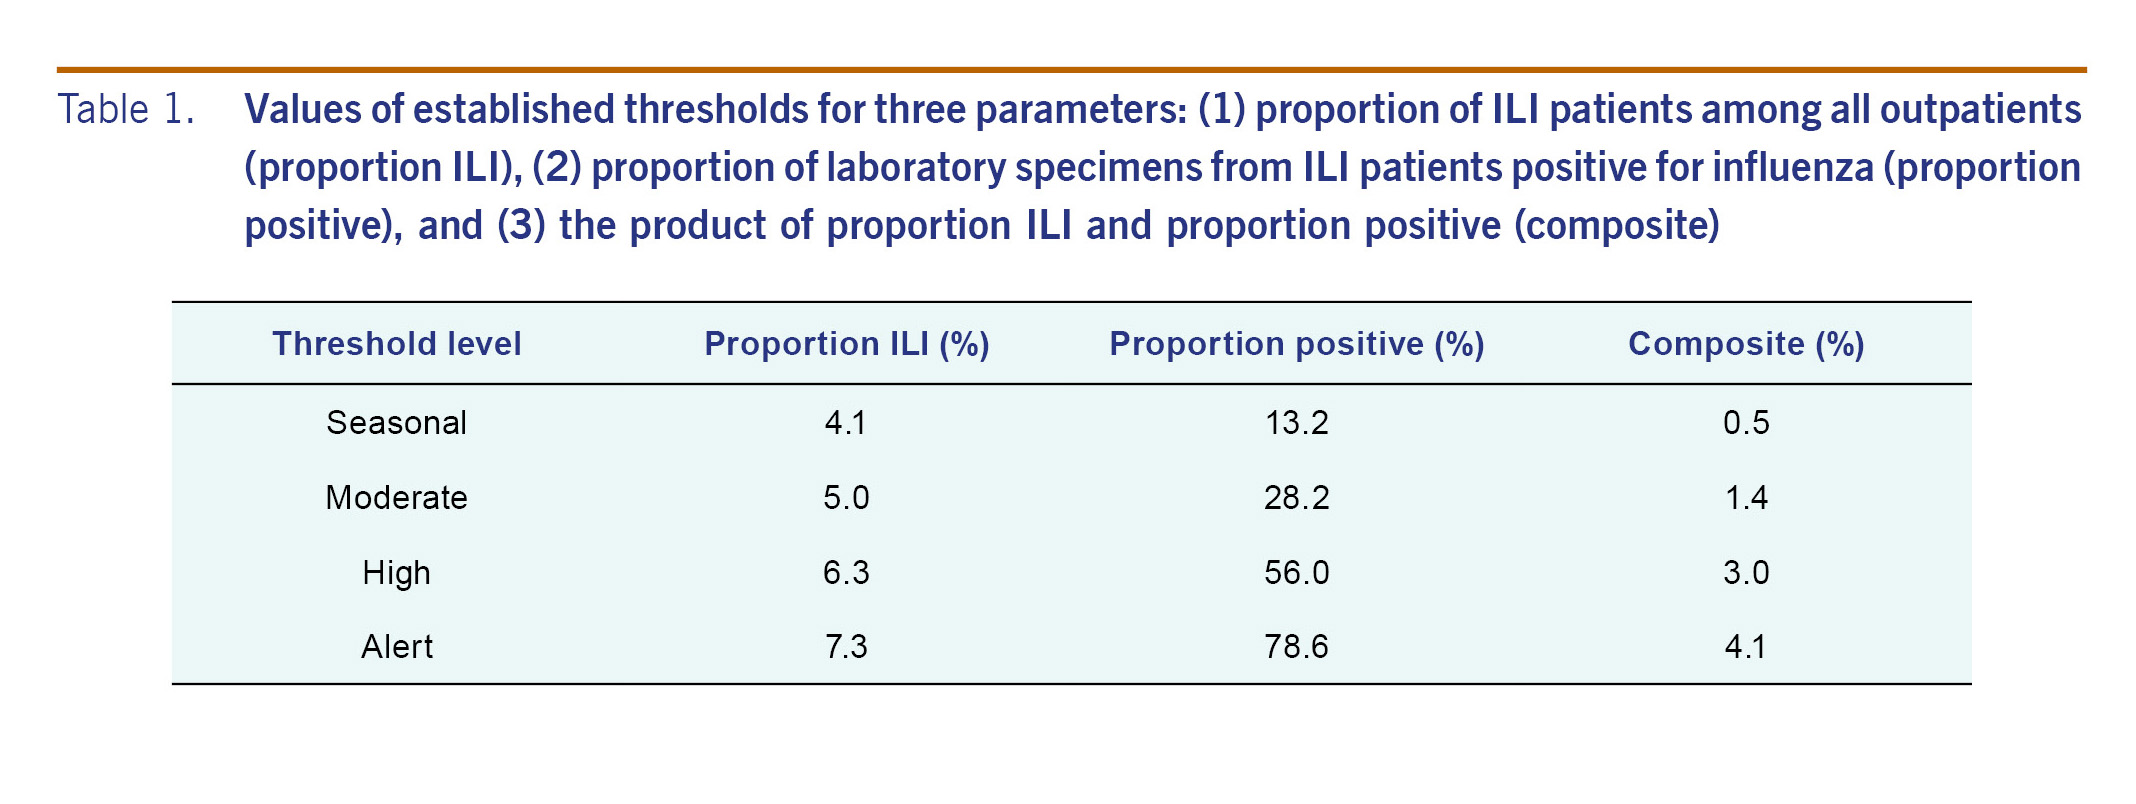
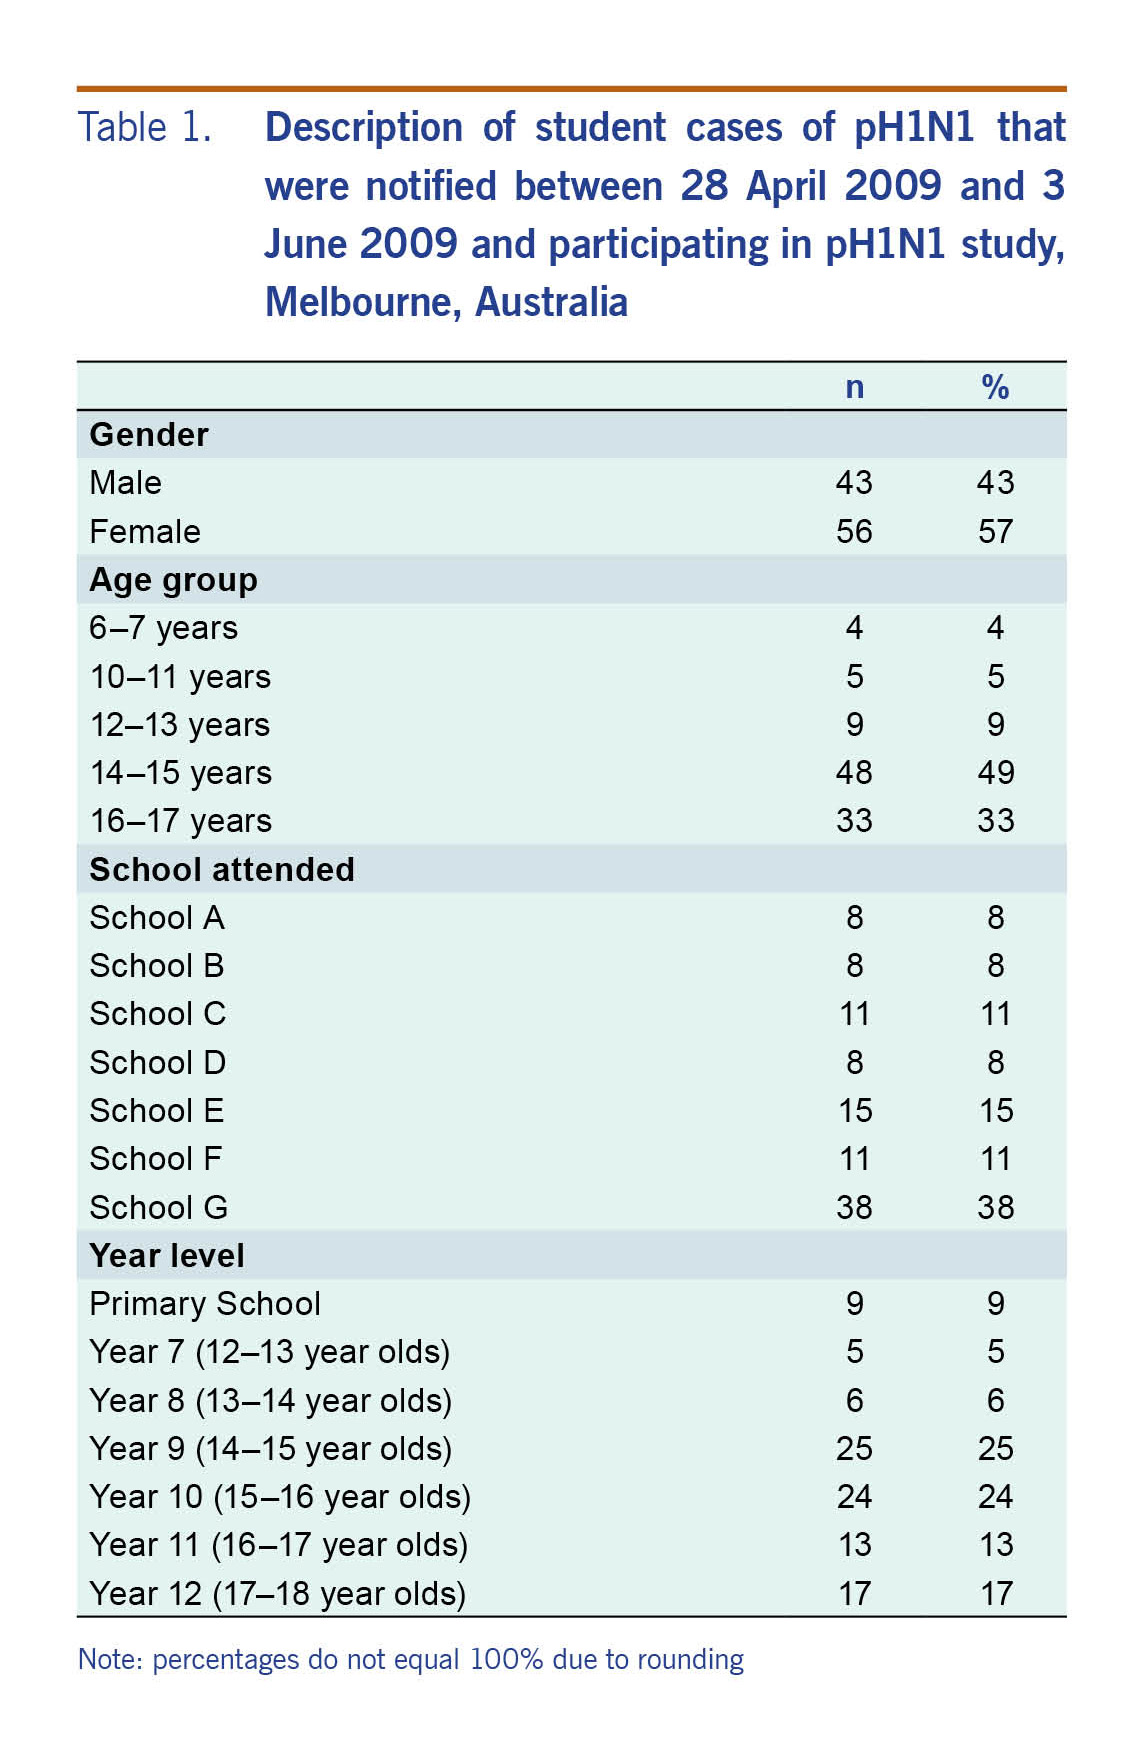
the following data were extracted from the sentinel surveillance system from four data sources: number of (1) new outpatients, (2) ili patients, (3) specimens collected among ili patients for laboratory testing, and (4) influenza positives among specimens collected. to establish thresholds, data from week 18 of 2010 to week 17 of 2014 were used, totalling 867 266 outpatients, 36 885 ili patients, 9136 laboratory specimens from ili patients and 1482 laboratory-confirmed influenza cases. data before week 18 of 2010 were not used for threshold setting due to the 2009 pandemic. three parameters were calculated for each week: (1) proportion of ili patients among all outpatients (proportion ili); (2) proportion of laboratory specimens from ili patients positive for influenza (proportion positive); and (3) an ili-influenza composite variable (composite), the product of proportion ili and proportion positive proposed by tay et al.19
establishing seasonal and alert thresholds and categorizing transmission intensity
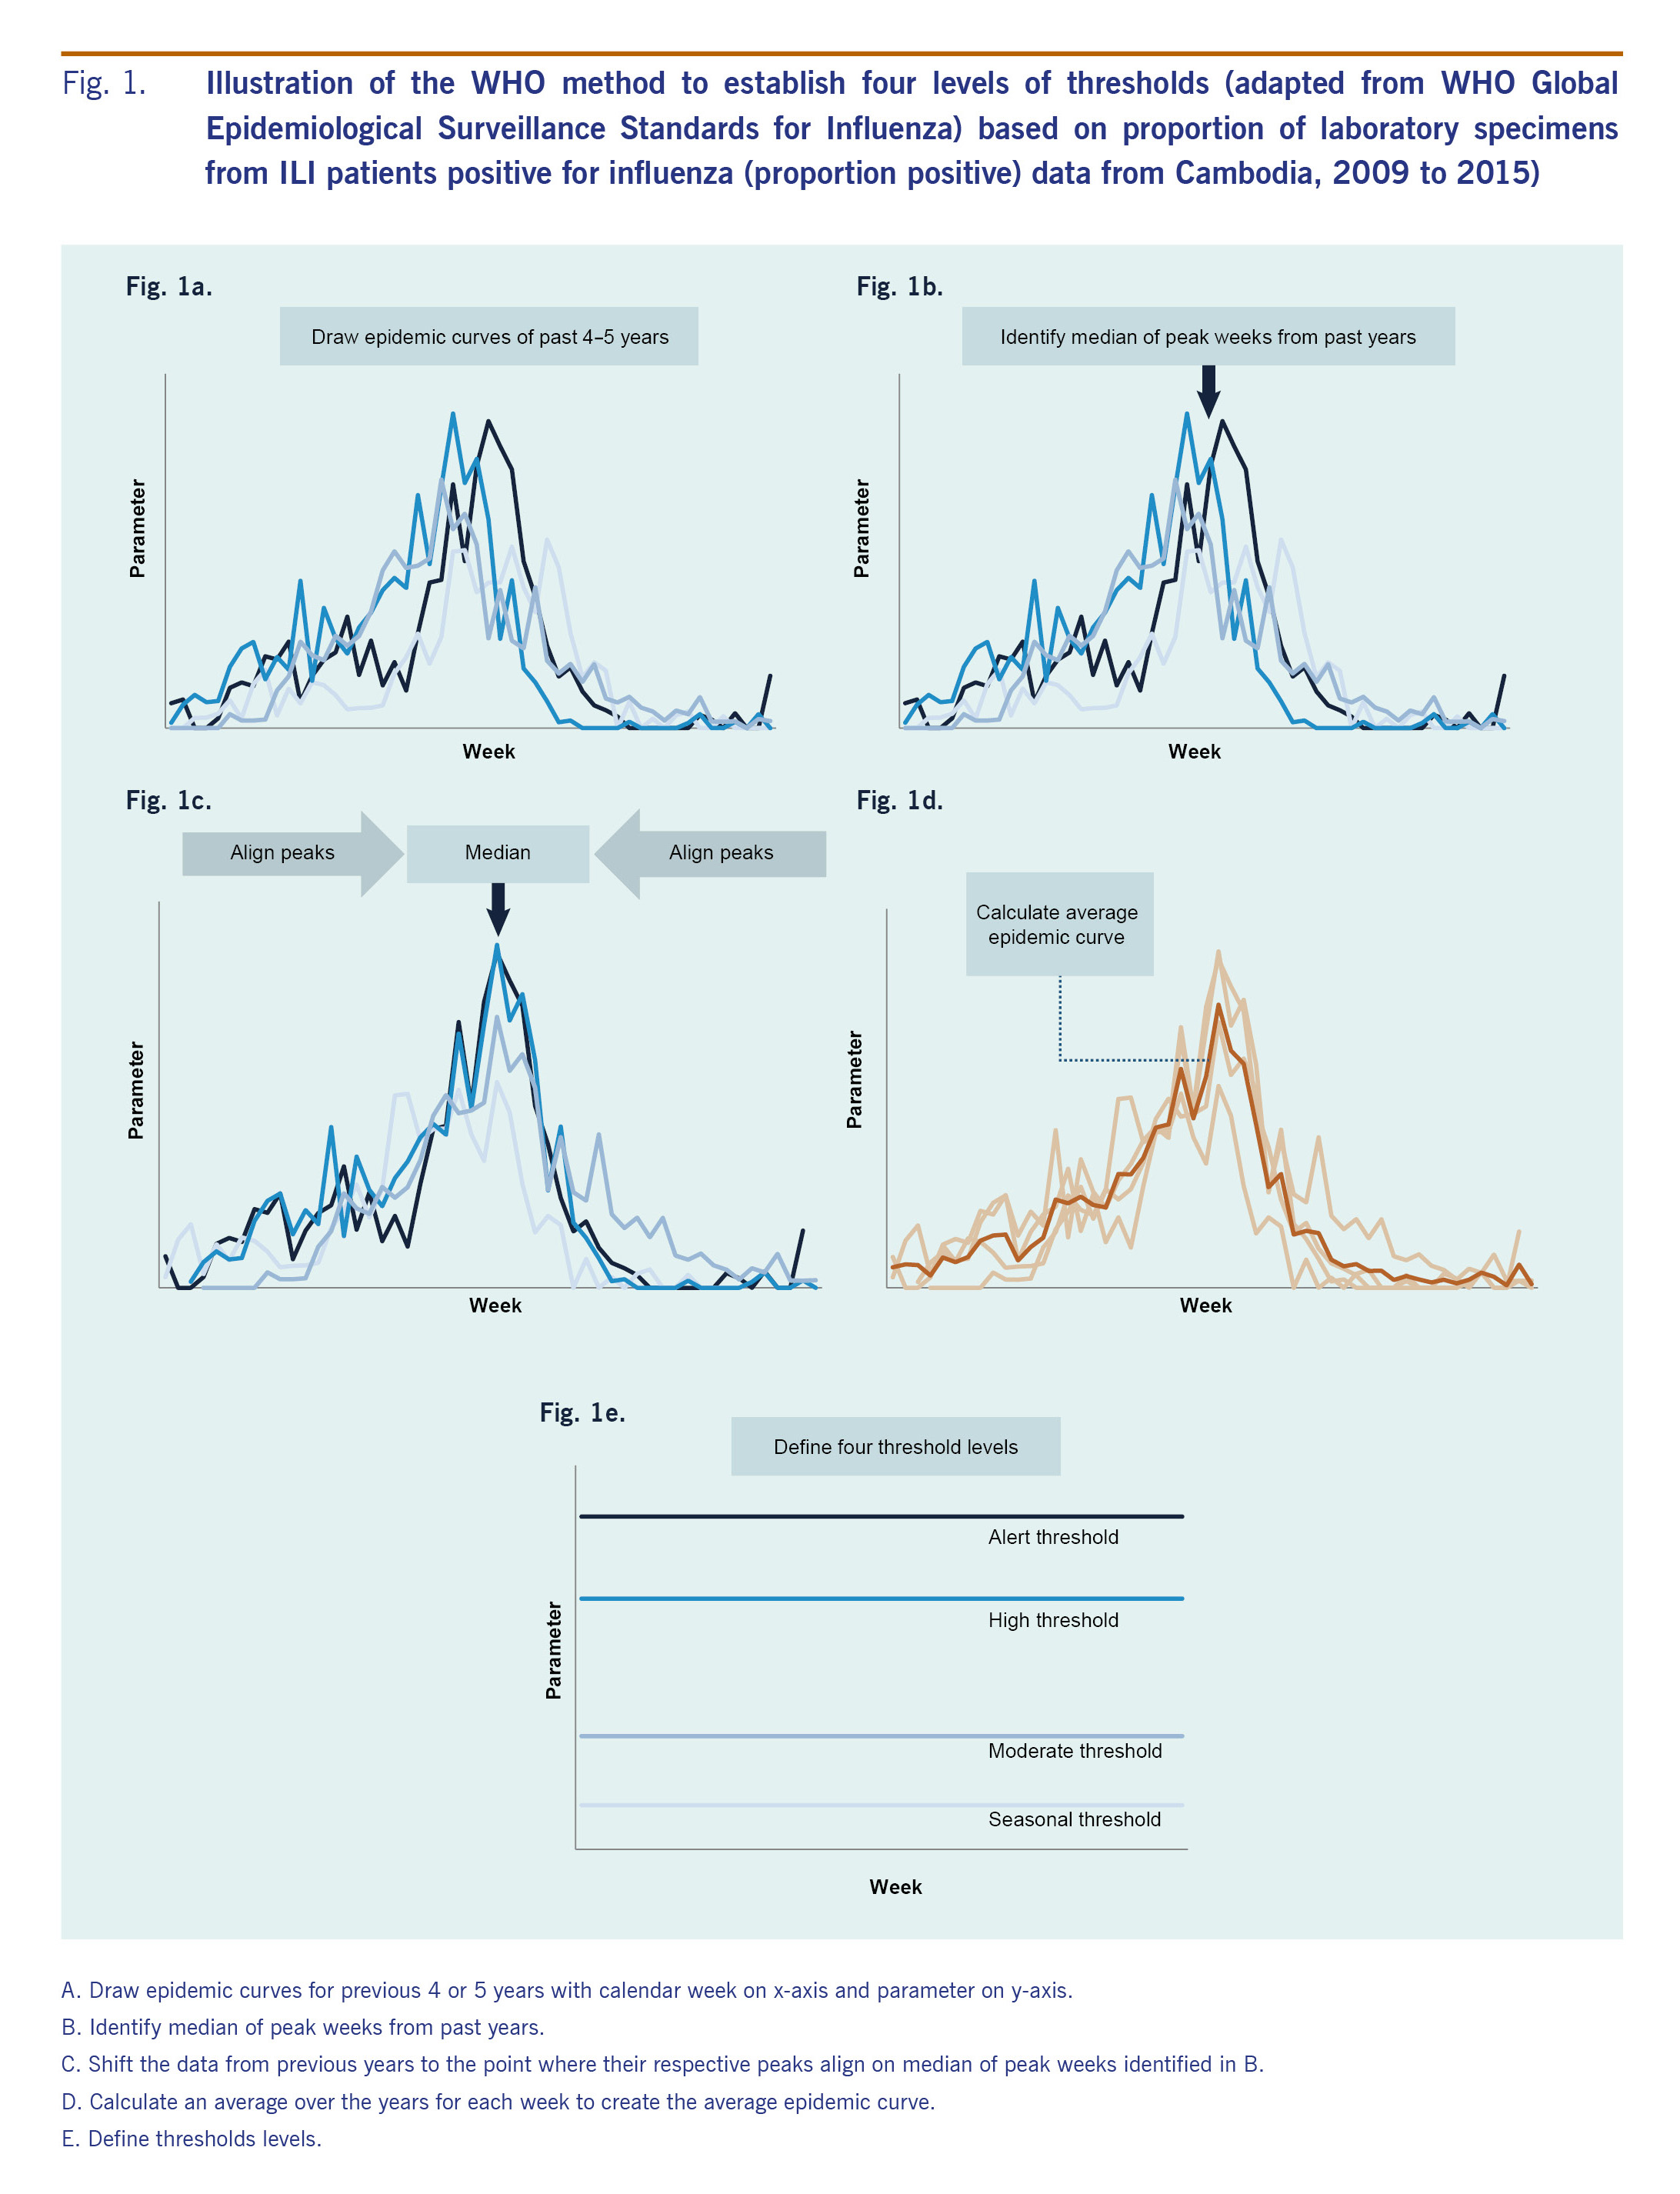
we adapted the who method described in the who global epidemiological surveillance standards for influenza (who manual) to establish seasonal and alert thresholds for the three parameters described above, with some modifications (fig. 1).17
first, to define different thresholds we drew weekly epidemic curves for the past 4-5 years (fig. 1a). next, the median week of peak occurrence was identified from these years (fig. 1b). then, respective peaks from previous years were aligned on the median week (fig. 1c). an average epidemic curve, which captures a typical influenza season's temporal distribution and amplitude, was drawn by calculating an arithmetic mean over the years for each week (fig. 1d).
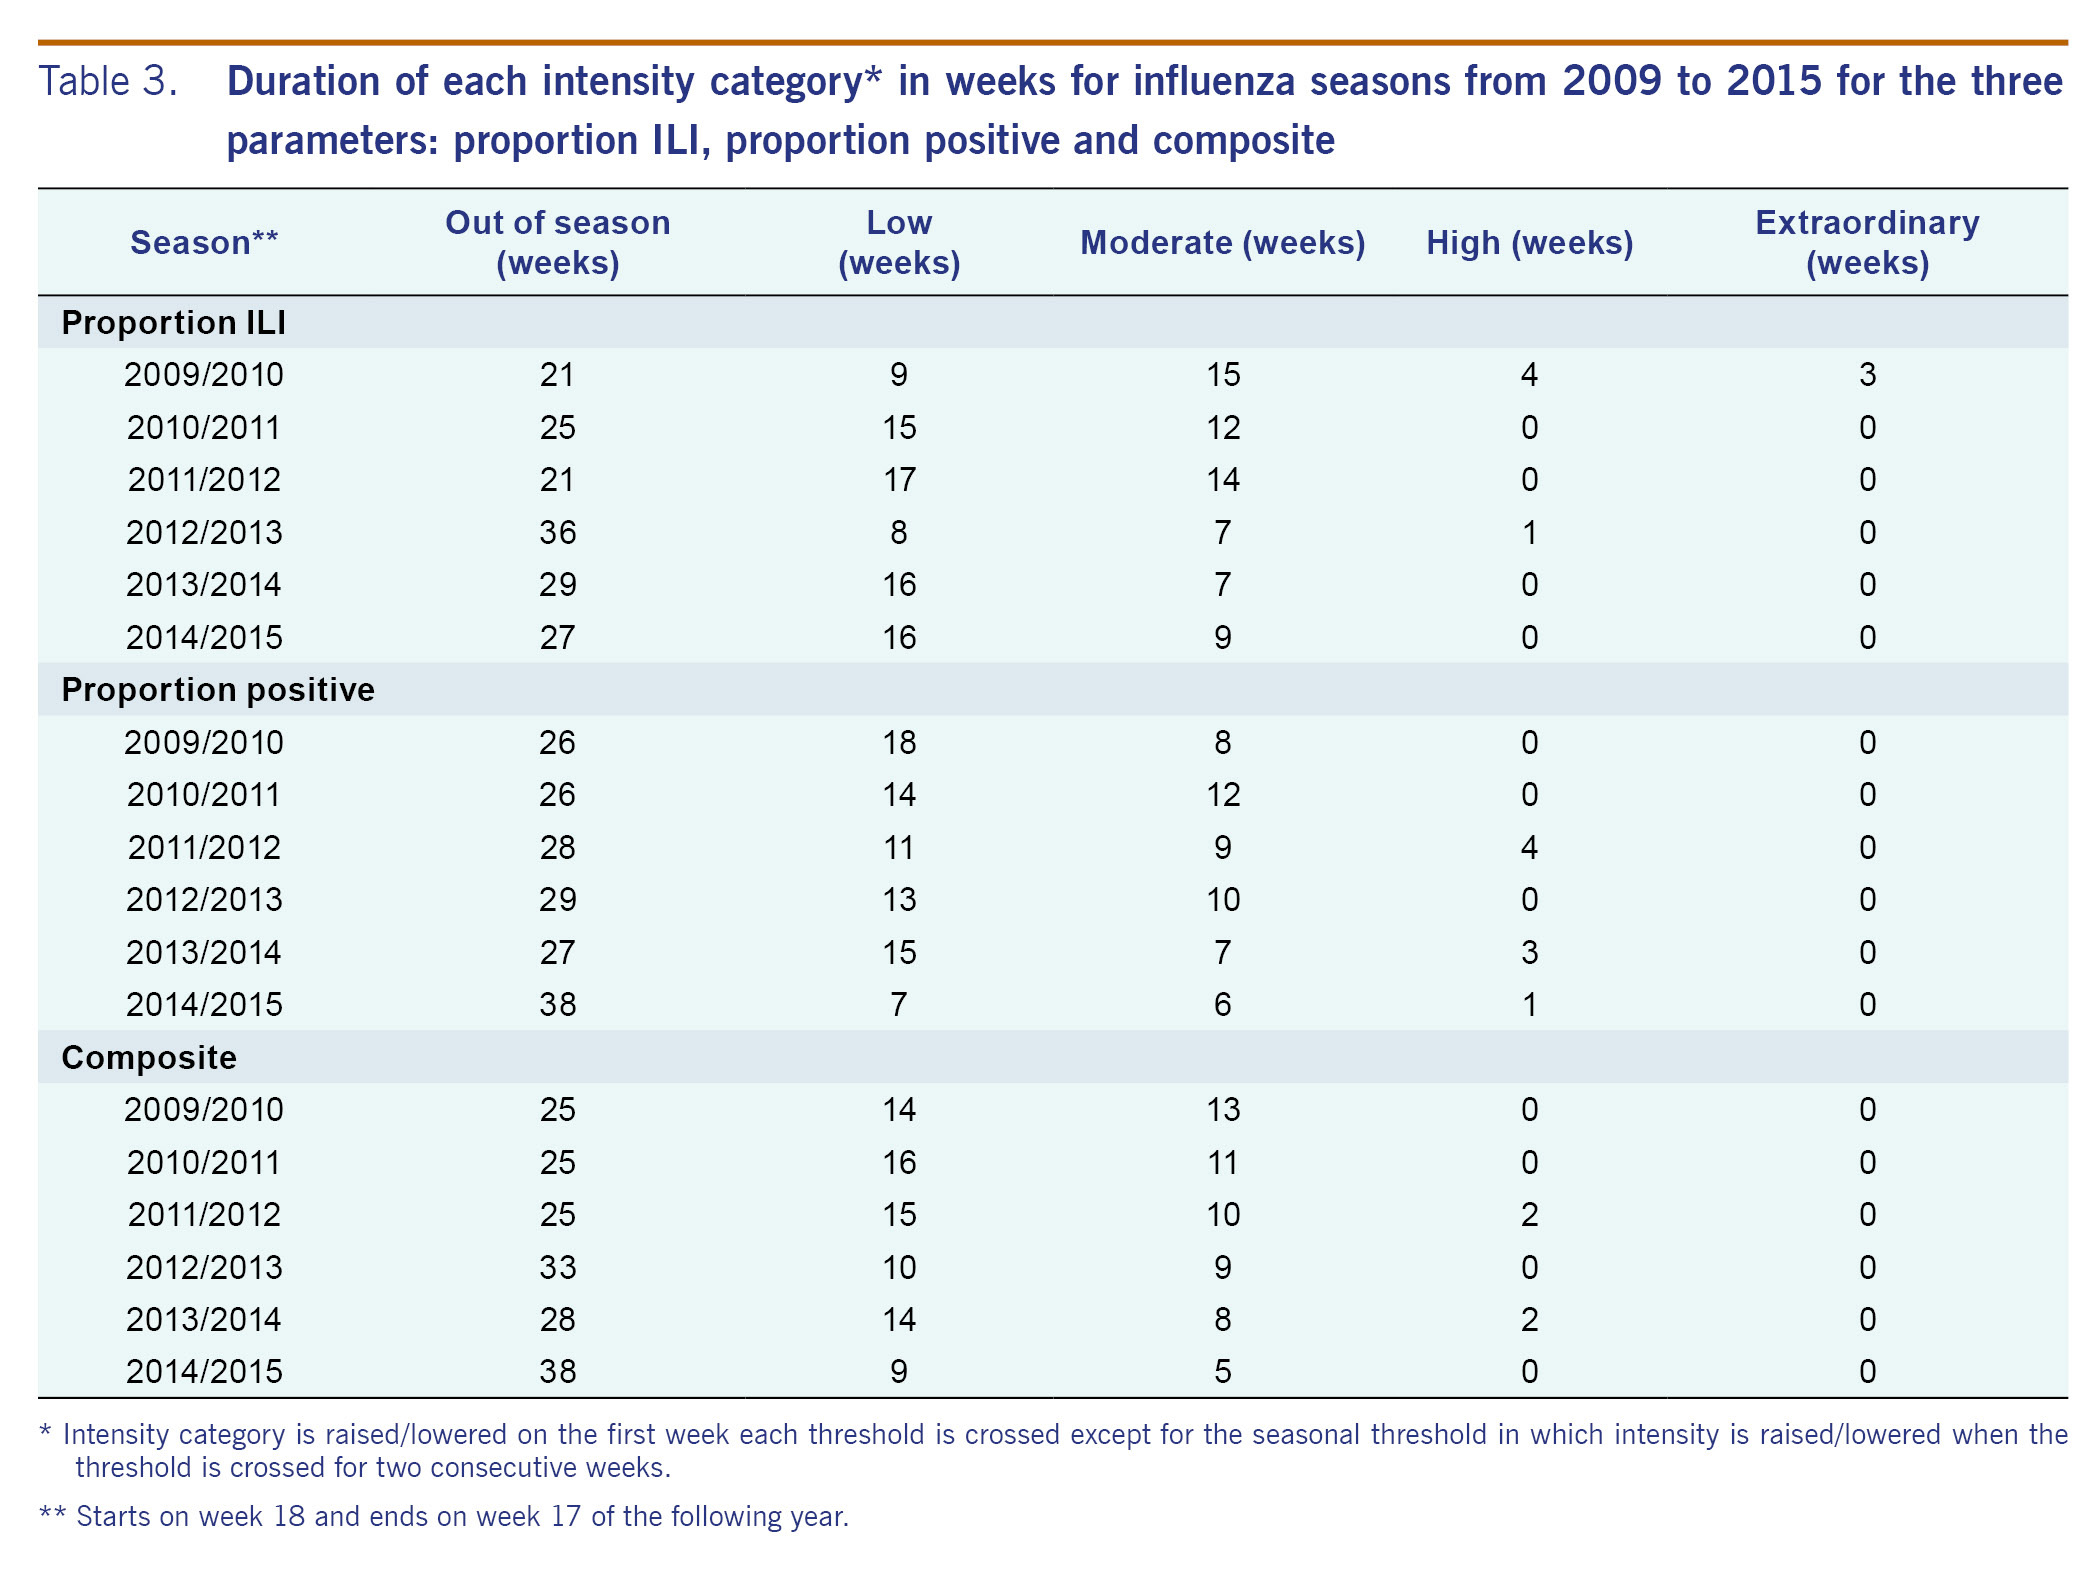
finally, four threshold levels were determined: (1) seasonal, (2) moderate, (3) high, and (4) alert (fig. 1e). as the thresholds are context-specific, we explored a range of candidates, including those recommended in the who manual for seasonal and alert thresholds,17 those proposed by tay et al19 and those proposed through key stakeholder discussions. final selections were based on consensus among national and international experts for technical and practical reasons based on several meetings with in-depth discussions. to define season onset (seasonal threshold), the median value of all weeks during the study period17 was used since we assumed seasonality in influenza activity with approximately half of the year being in-season and the other half off-season. for the moderate threshold, which defines a mild season set between high and seasonal thresholds, we explored the mean and the median values of all weeks during the in-season weeks during the study period (i.e. all weeks above the seasonal threshold). for the high threshold, which defines a higher than average season, we compared the peak value of the average and median epidemic curves.17,19 alert threshold defines extraordinarily severe seasons such as pandemics, and the upper 95% and 90% confidence interval (ci) and the 95th and 90th percentile of the peak values were explored.17,19 based on these four threshold levels, intensity of influenza transmission was classified into five categories: (1) out of season, (2) low, (3) moderate, (4) high, and (5) extraordinary.
assessment of thresholds
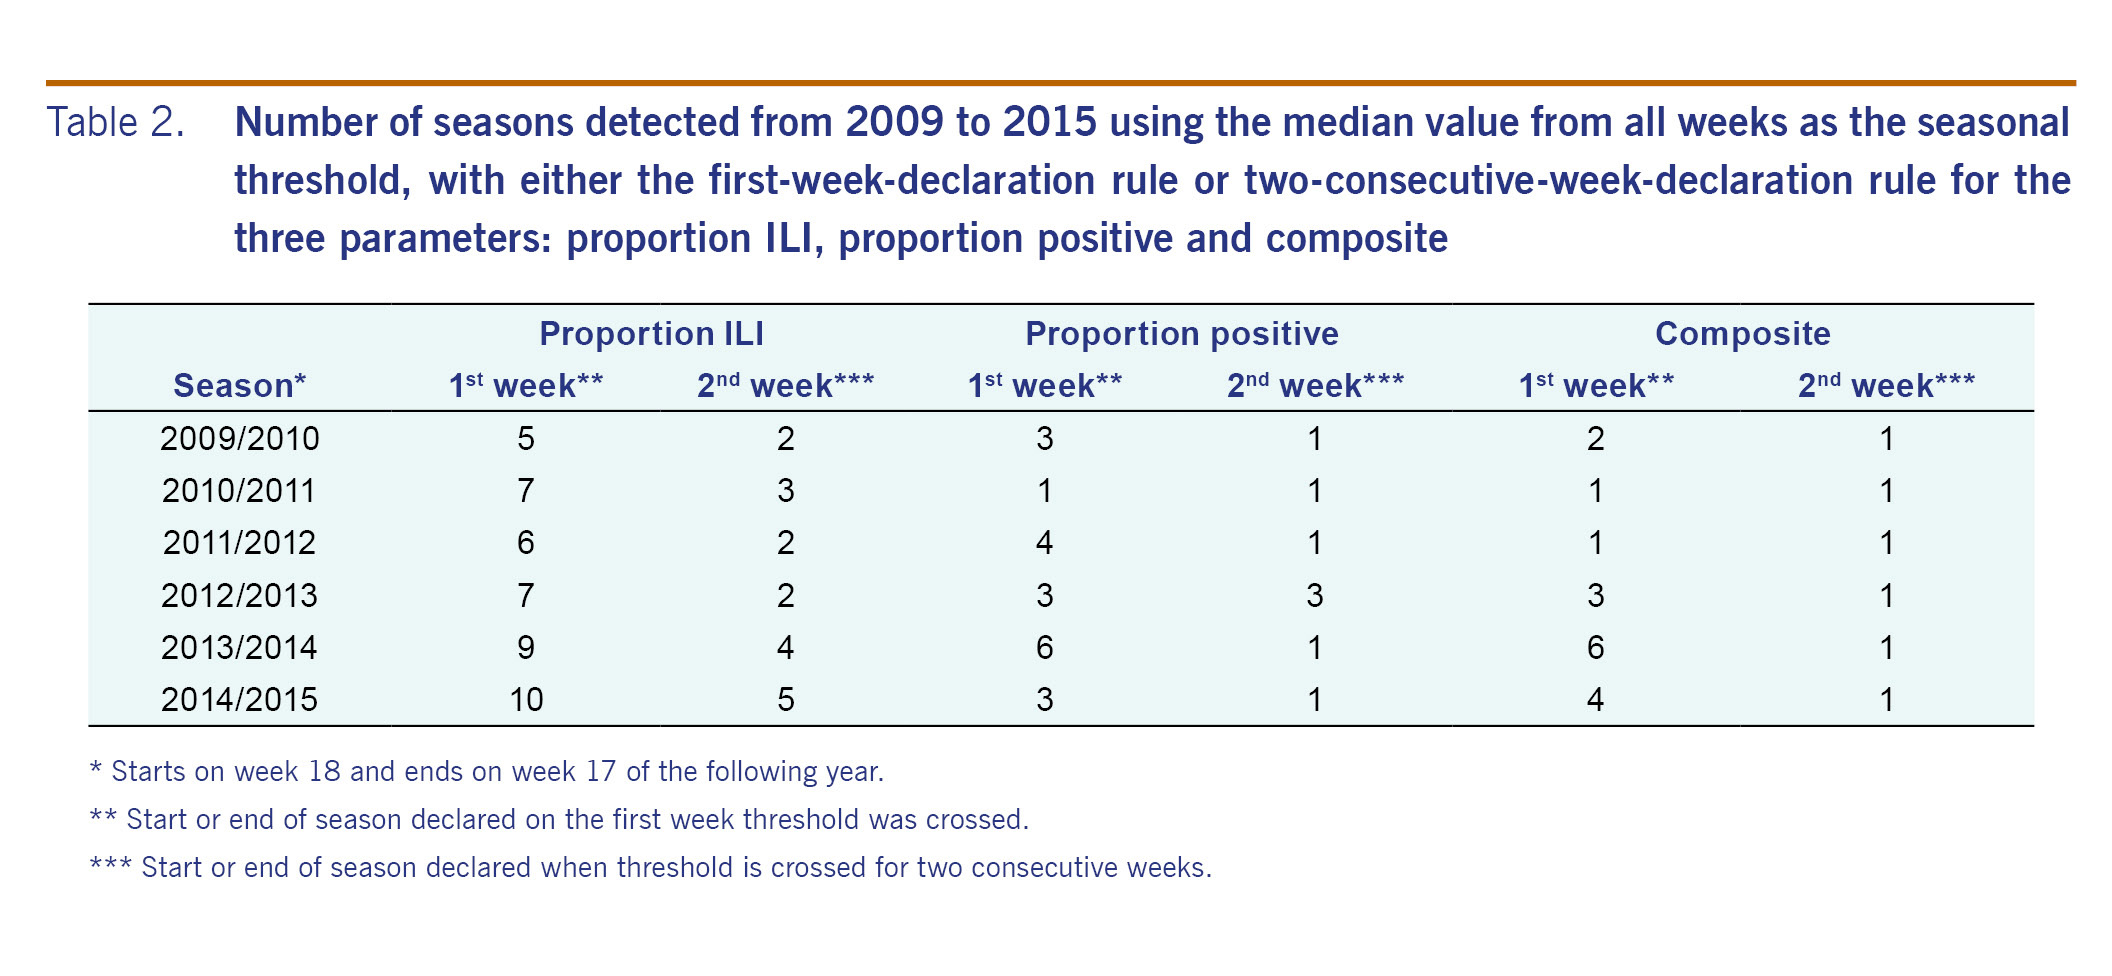
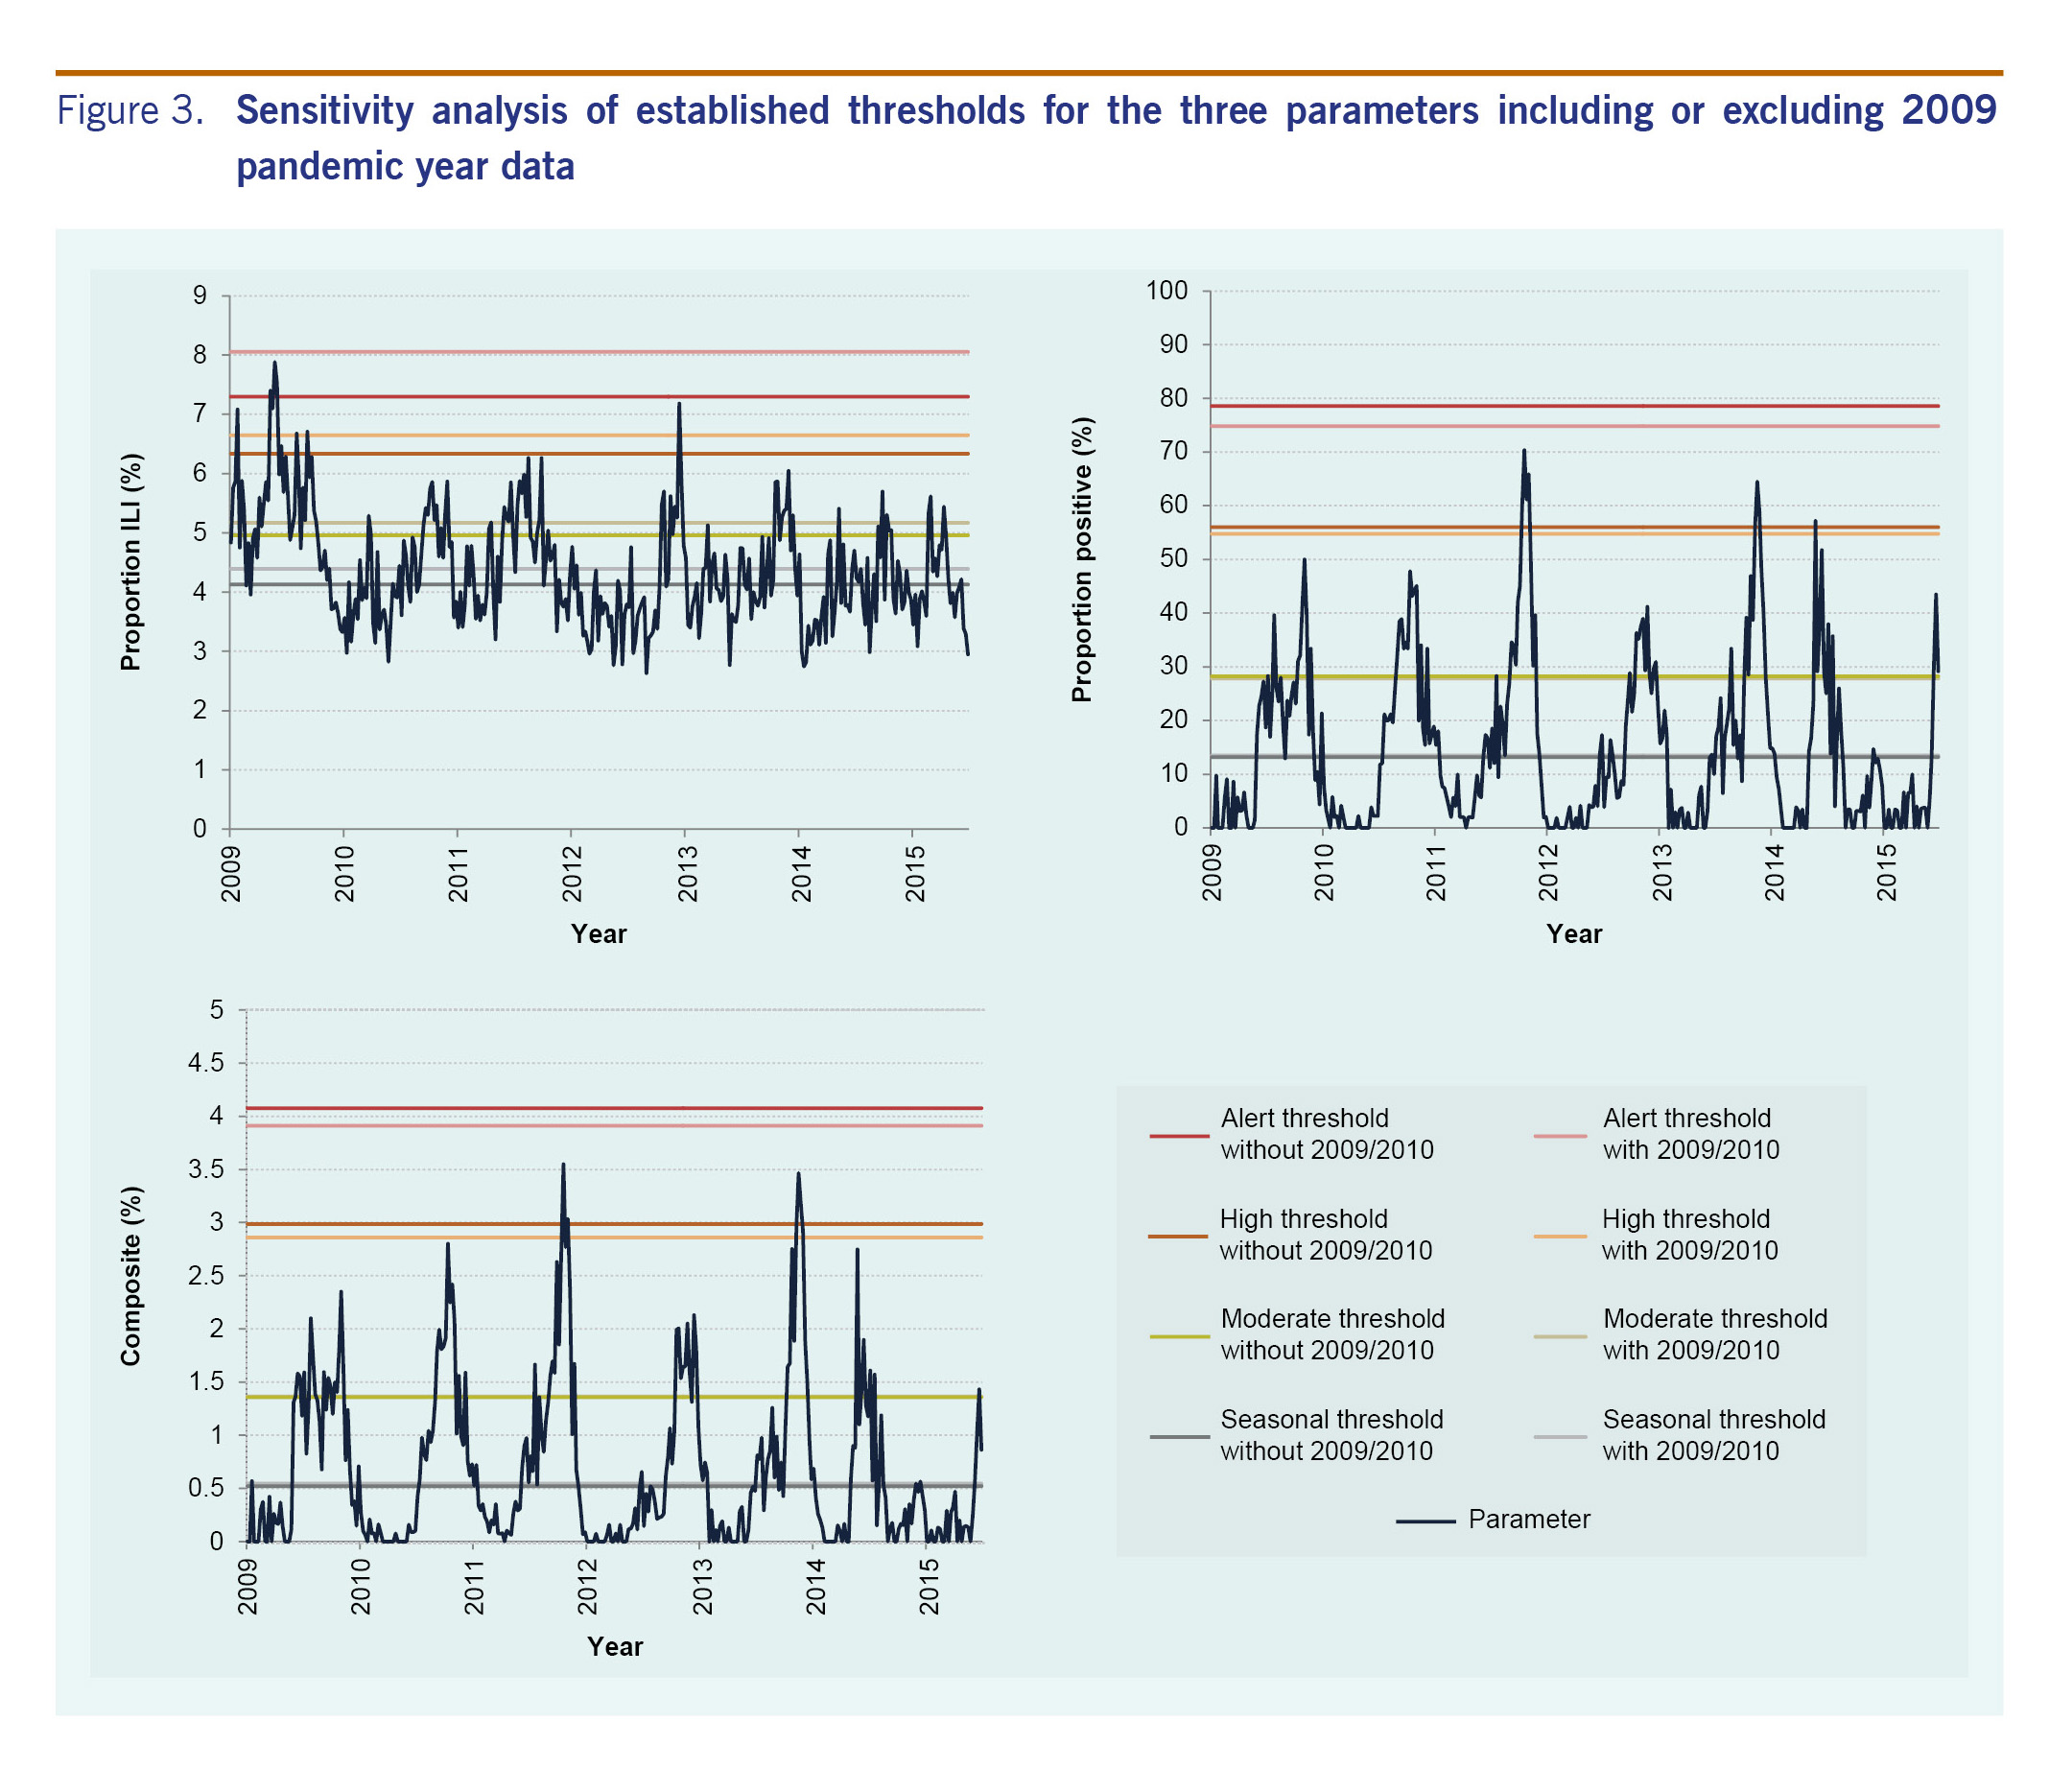
data for the three parameters from week 1 of 2009 to week 25 of 2015 were plotted against the established thresholds. influenza season was defined to start when the parameter increased above the seasonal threshold and to end when the parameter declined below the threshold. the number of times per year the seasonal threshold was crossed was used to assess the validity of the seasonal threshold; assuming one influenza season per year in cambodia based on historic data,10,12,13 additional detected seasons were considered false alarms. we also compared results from two conventional rules to declare season onset: the first-week-declaration rule, where onset is declared on the first week the threshold is crossed and the two-consecutive-week-declaration rule, where onset is declared when the threshold is crossed for two consecutive weeks.19 as additional sensitivity analysis, thresholds were re-calculated including 2009/2010 data to assess the degree of the pandemic season's impact on the parameters and thresholds. the most recent data from week 18 of 2014 provided an opportunity to assess the proposed thresholds using data not included in establishing the thresholds, as would be the case in practice.
ethics statement
the ili and influenza surveillance system is a public health activity organized by the ministry of health in cambodia and has standing authorization from the national ethics committee, cambodia. data that could potentially identify individuals are not included.
results
comparison of parameters to monitor influenza activities
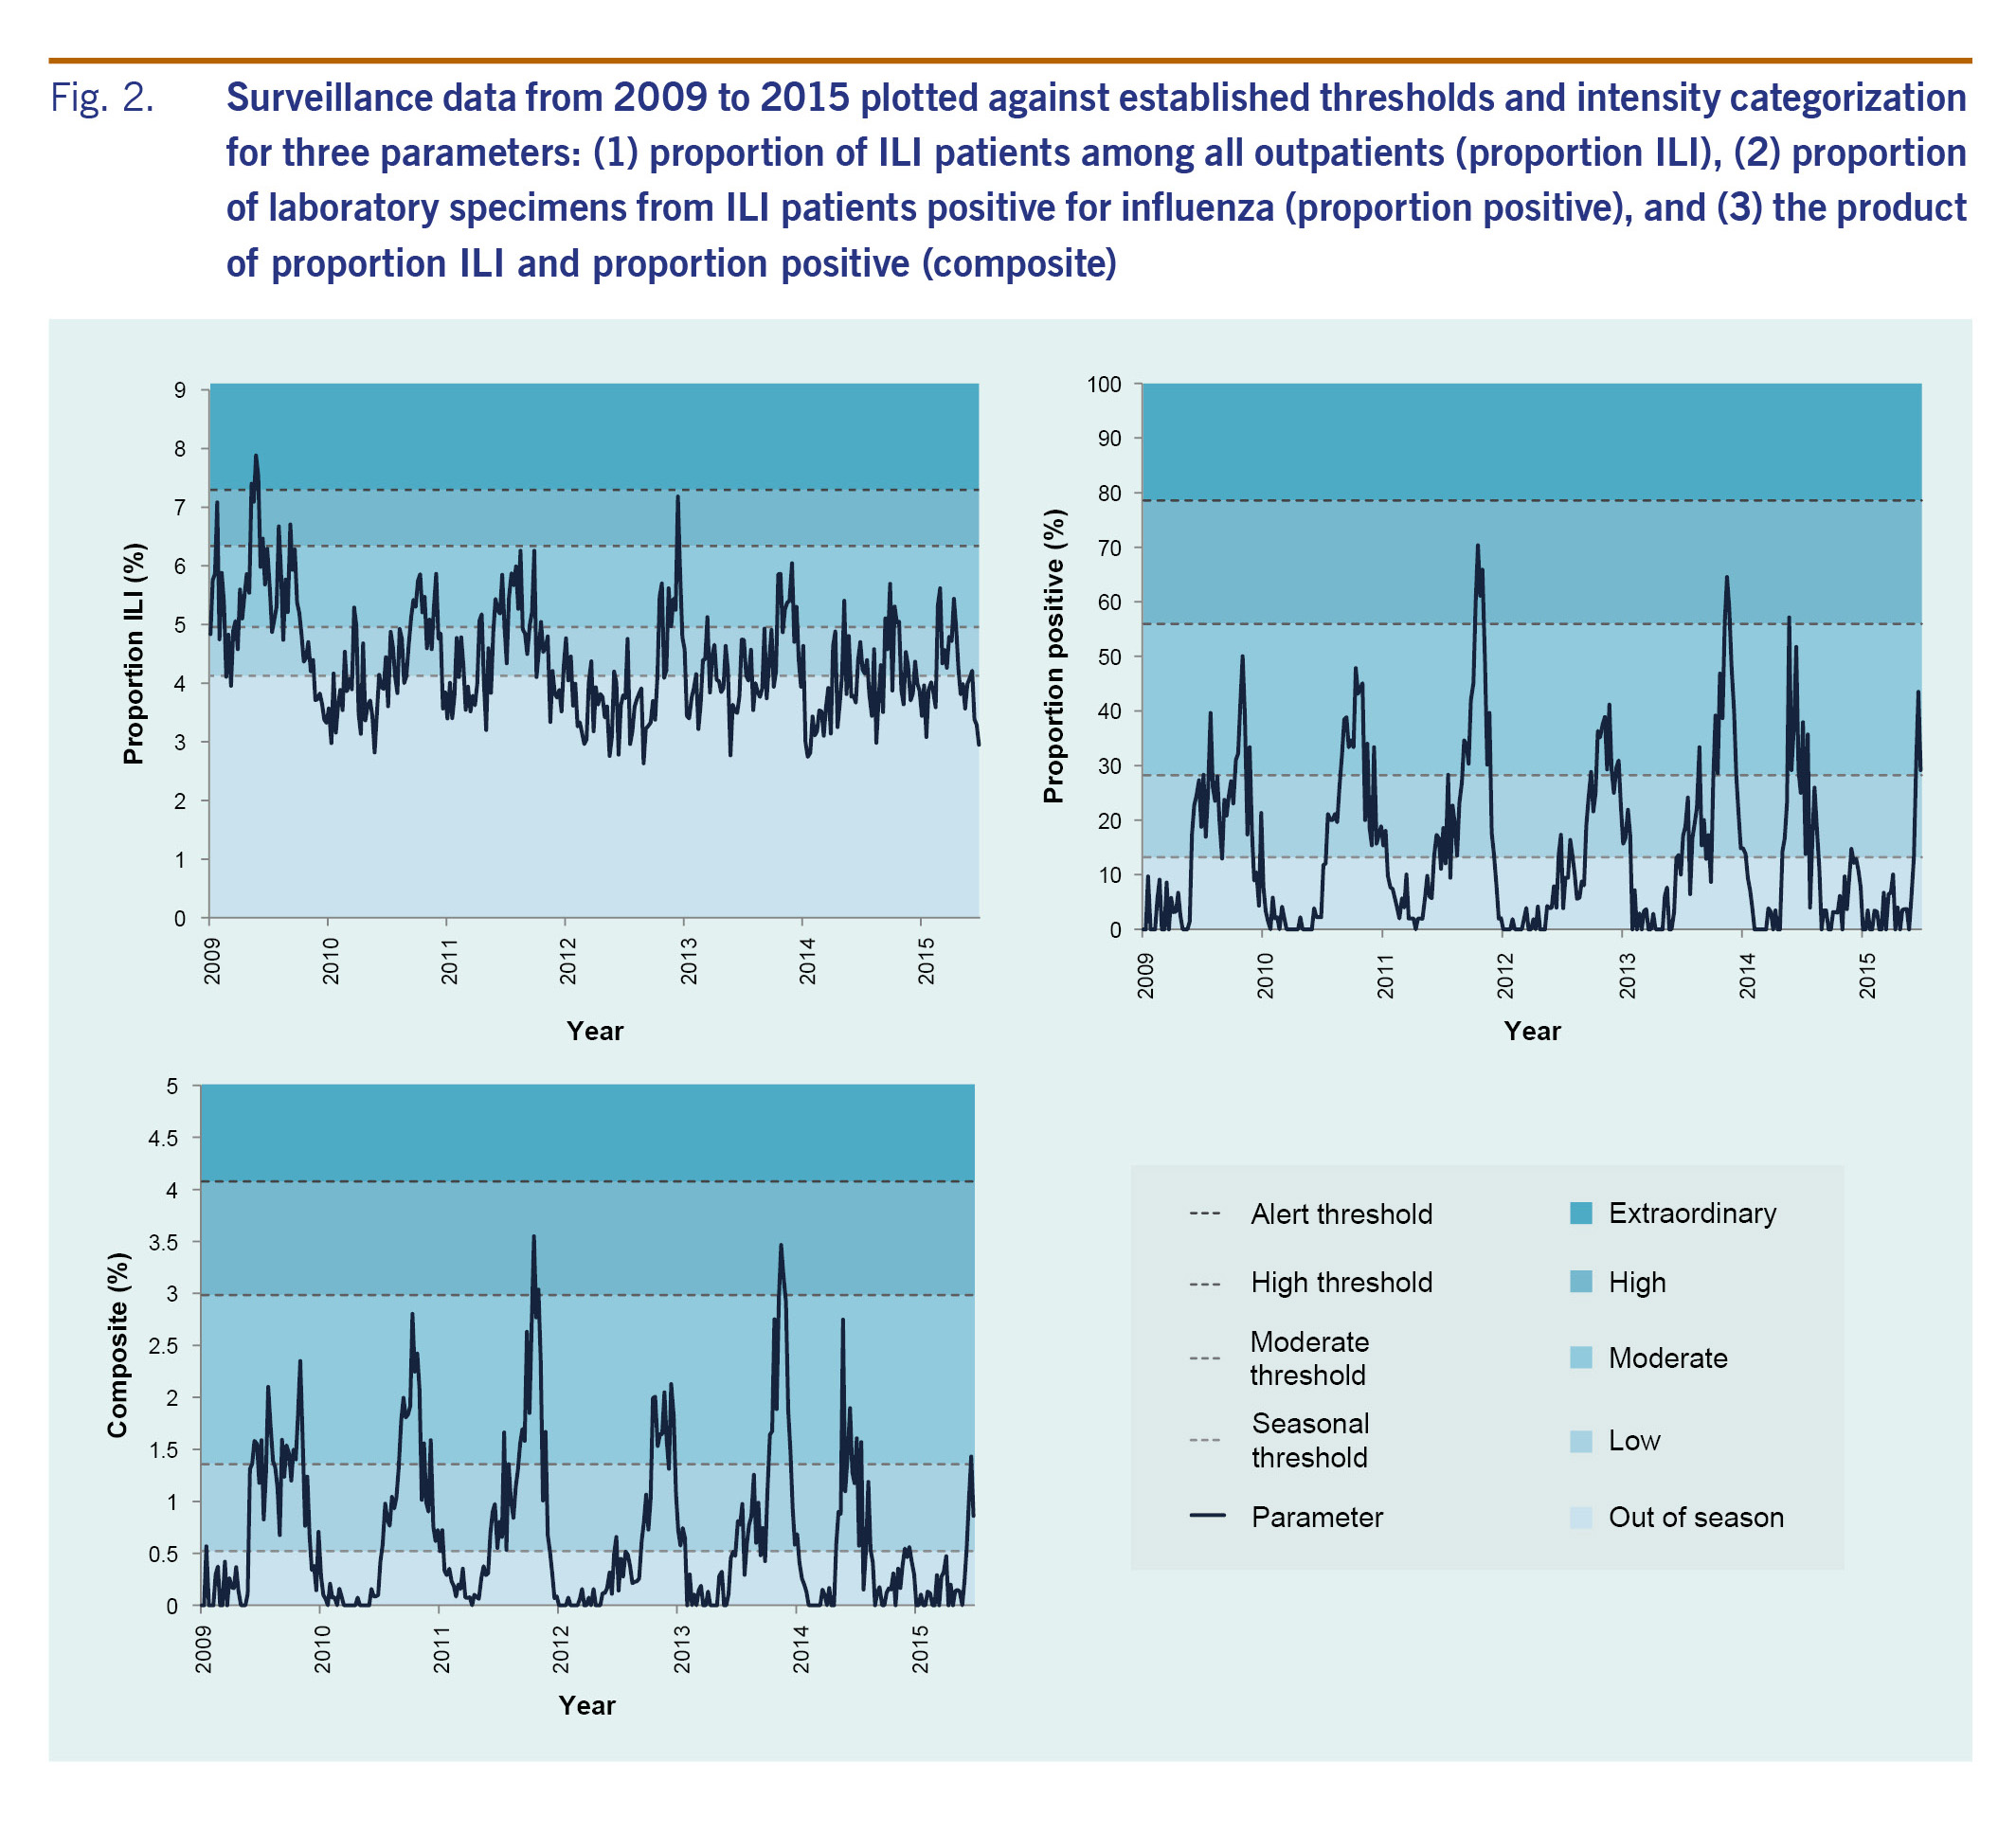
when 2009-2015 data were plotted for the three parameters, proportion ili showed extensive weekly fluctuations with no clear seasonal pattern, but proportion positive and composite both exhibited clear seasonality, peaking between october and december for the majority (5/6) of seasons (fig. 2).
establishment and assessment of seasonal and alert thresholds and intensity categorization
four threshold levels were established (table 1), defining five categories of transmission intensity (fig. 2). each threshold was based on a different criterion process described below.
seasonal threshold
while visual inspection indicated one season per year for most years based on the proportion positive and composite parameters (fig. 2), with the first-week-declaration rule, the seasonal threshold was crossed multiple times for most years (table 2). while multiple-season years were observed for all parameters, the frequency was greatest for the proportion ili and least for the composite. the two-consecutive-week-declaration rule reduced the frequency considerably regardless of parameter. notably, all years were shown to have a single season using the composite.
alert threshold
exploring a range of ci and percentiles, the upper 90% ci of the average epidemic curve peak amplitude was adopted (fig. 2) as suggested in the who manual17 and used previously in an australian study.19 the upper 90% ci had consistently higher values than the 90th or 95th percentiles for proportion positive and composite (data not shown). the only time the alert threshold was crossed was during the 2009 pandemic year with proportion ili (table 3).
high threshold
peak amplitude of the average epidemic curve was adopted (fig. 2) because average and median epidemic curves were found to be similar and sensitivity analysis including or excluding 2009/2010 data suggested that the average epidemic curve was more stable than the median when number of years used for threshold establishment was few (data not shown). based on the proportion positive and composite, the 2009 pandemic year did not reach the high threshold (table 3).
moderate threshold
the mean rather than the median value was selected as it would better distribute the in-season weeks between the low and moderate levels (fig. 2). given the distribution of the data during the in-season period, the latter would set the threshold at a considerably low level, close to the seasonal threshold, and make the moderate threshold practically less useful.
sensitivity analysis of thresholds with 2009 pandemic year data and application of thresholds to 2014-2015 data
finally, we tested whether inclusion of data from the 2009 pandemic for threshold determination would affect thresholds for the three parameters. when 2009/2010 data were included, there was a considerable increase in threshold values with proportion ili (fig. 3). for the other two parameters, thresholds remained largely unaffected. the proposed thresholds performed similarly when applied to surveillance data from week 18 of 2014 that were not included in establishing the thresholds (table 2 and fig. 2).
discussion
in the present study based on the who method for establishing seasonal and alert influenza thresholds, we explored a range of thresholds for three readily available parameters and established practical influenza thresholds for cambodia. based on consensus among national and international stakeholders, four thresholds were established to mark the start of the season and low, moderate, high and extraordinary levels of influenza activity.
when comparing the usefulness of the different parameters to monitor influenza activity, we found that the syndromic proportion ili parameter lacked seasonality. however, proportion positive and composite, parameters that incorporate laboratory data, generally exhibited a single distinct season each year in cambodia. furthermore, the composite parameter using the two-consecutive-week rule to indicate season onset had no false signals during the study period.
sensitivity analysis of thresholds with inclusion of 2009 data showed that only the proportion ili parameter was largely affected. the considerable increase in proportion ili during the 2009 pandemic may have been due to greater awareness resulting in more patients seeking health care for ili and/or more clinicians categorizing patients as ili rather than a true increase in incidence. in fact, influenza a(h1n1)pdm09 virus accounted for only one-third of all influenza subtypes detected in cambodia during the pandemic (data not shown). these findings further confirmed the robustness of parameters and thresholds that incorporate laboratory information.
the composite variable appeared particularly useful, likely due to higher specificity for a true increase in influenza cases by accounting for both syndromic activity and laboratory positivity; for instance, it accounts for situations where there is high proportion ili but low proportion positive as in the 2009 pandemic. similarly, when there is high proportion positive but low proportion ili, the composite approach would be more conservative than using proportion positive alone and would reduce false positive declarations. additionally, in settings where the number of samples for laboratory testing is limited or small resulting in high fluctuations in proportion positive, accounting for syndromic data may be useful.
finally, the five categories of intensity proposed here can be applied to both seasonal influenza and potential pandemic influenza within the pisa framework.18 the composite approach may be especially useful for pandemic influenza assessment by accounting for a potential increase in awareness, health-care access and/or reporting. as cambodia is one of several countries affected by human infections with avian influenza, its pandemic preparedness is especially important both domestically and globally.20
our study has several limitations. first, the assessment was limited to approximately five to 10 laboratory samples per site per week, and reporting varied between six and eight sentinel sites during the study period. nevertheless, the quantity and distribution of the data were sufficient to describe seasonality and establish thresholds. next, the sentinel surveillance system covers public hospitals and health centres but not private clinics, and therefore may not be representative of the overall cambodian population. a special study such as a health-care utilization survey is an important next step to better understand the burden of influenza nationwide. finally, data from paediatric and non-paediatric sites were combined to establish thresholds due to sample size limitations, although paediatric sites generally had higher values for proportion positive. however, the yearly trends were similar between the two site types (data not presented). regardless, to assess influenza activity, thresholds should be interpreted with other information such as subtypes and other parameters.
our findings have practical public health significance. once parameters, thresholds and categorizations are determined, it is possible to implement specific public health actions,21 such as risk communication that could be triggered from crossing a threshold. in cambodia, knowledge regarding influenza is still scarce among health workers and the general public and information regarding seasonality is just emerging. therefore, as a first step based on these findings, the ministry of health plans to raise awareness among the medical community and the public regarding (1) general knowledge of influenza and its seasonality, (2) preventive measures such as respiratory and hand hygiene, and (3) prevention of antimicrobial misuse. we consider channels such as press releases, the internet, posters and the national respiratory disease and influenza bulletin to convey these messages. in the long term, the seasonal threshold will be helpful for vaccination timing;10,11,21 continuous re-evaluation of vaccination timing will be necessary as the timing of season onset has been observed to vary in the tropics.
although one country's experience cannot be generalized, our findings provide novel insights with global implications, specifically for countries in the tropics and subtropics. first, ili syndromic surveillance may not be an appropriate parameter for influenza activity in the tropics and subtropics. this contrasts to what is known for ili data that are routinely used in temperate regions such as europe, the united states of america and australia as a proxy to monitor influenza activity.14-16,19 lack of apparent ili seasonality could be unique in the tropics and subtropics with various pathogens circulating year-round that cause acute respiratory illnesses.8-11,21-32 instead, use of proportion positive and composite approaches may be suggested given recent studies with laboratory information indicating that most countries, including non-temperate countries, exhibit distinct seasonal patterns.8-11,21-32 our findings regarding the usefulness of the composite variable agree with those from a temperate region in australia19 and highlight the importance of using multiple sources of information to guide assessment. considering similar surveillance systems in cambodia and those in other tropical and subtropical countries,21-28 our approach may be adapted to fit each country's context. for cambodia, eight sentinel sites with approximately 35 samples per week nationwide were enough to describe influenza activity. furthermore, there are several key observations in influenza activity that are unique to the tropics and subtropics:9-11,27,29 (1) annual timing of season onset and peak vary considerably, (2) season onset appears more gradual, and (3) magnitude of influenza season is not as distinct from off-season. these were also observed in the present study (fig. 2). such characteristics make it especially meaningful to set explicit thresholds based on appropriate parameters to support routine public health communications and allocate resources effectively and efficiently.21 in addition to the leadership of respective ministries of health, global efforts by who, the centers for disease control and prevention and other organizations have supported the establishment of national influenza surveillance systems in many resource-limited countries in non-temperate climates.10,11,21-34 we believe it is time to maximize utilization of influenza surveillance data for routine actions for domestic and global public health assessment and response.
in summary, distinct seasonality of influenza activity in cambodia was observed using two parameters that incorporate laboratory information, allowing for the establishment of thresholds and transmission intensity categories. the composite variable that accounts for syndromic and laboratory data was the most specific in declaring season onset and the most useful in monitoring intensity. this categorization can assess not only seasonal influenza but also potential pandemic influenza, contributing to the country's pandemic preparedness. these findings have important implications for countries in the tropics, subtropics and in resource-limited settings.
conflicts of interest
none declared. none of the authors have any affiliations with or financial involvement in any organization or entity with any actual or potential financial, political, or personal interest in the subject matter or materials of the research discussed in the manuscript.
funding
none.
acknowledgement
we thank sentinel site hospitals and health centres; national institute of public health, cambodia; and the centers for disease control and prevention, cambodia office for their contribution in the ili and influenza surveillance system. we also thank kazunori oishi, tamano matsui, nobuo ohta, and the the tokyo medical and dental university undergraduate student overseas study award for supporting the project on establishing influenza threshold in cambodia.
references
- fact sheet on influenza (seasonal). geneva: world health organization; 2014 (http://www.who.int/mediacentre/factsheets/fs211/en/, accessed 31 december 2016).
- molinari n-am, ortega-sanchez ir, messonnier ml, thompson ww, wortley pm, weintraub e, et al. the annual impact of seasonal influenza in the us: measuring disease burden and costs. vaccine. 2007 jun 28;25(27):5086-96. doi:10.1016/j.vaccine.2007.03.046 pmid:17544181
- lafond ke, nair h, rasooly mh, valente f, booy r, rahman m, et al.; global respiratory hospitalizations—influenza proportion positive (gripp) working group. global role and burden of influenza in pediatric respiratory hospitalizations, 1982-2012: a systematic analysis. plos med. 2016 03 24;13(3):e1001977. doi:10.1371/journal.pmed.1001977 pmid:27011229
- cheng py, palekar r, azziz-baumgartner e, iuliano d, alencar ap, bresee j, et al. burden of influenza-associated deaths in the americas, 2002-2008. influenza other respir viruses. 2015 aug;9 suppl 1:13-21. doi:10.1111/irv.12317 pmid:26256291
- ng s, gordon a. influenza burden and transmission in the tropics. curr epidemiol rep. 2015;2(2):89-100. doi:10.1007/s40471-015-0038-4 pmid:25938010
- simmerman jm, uyeki tm. the burden of influenza in east and south-east asia: a review of the english language literature. influenza other respir viruses. 2008 may;2(3):81-92. doi:10.1111/j.1750-2659.2008.00045.x pmid:19453467
- yang l, ma s, chen py, he jf, chan kp, chow a, et al. influenza associated mortality in the subtropics and tropics: results from three asian cities. vaccine. 2011 nov 08;29(48):8909-14. doi:10.1016/j.vaccine.2011.09.071 pmid:21959328
- azziz baumgartner e, dao cn, nasreen s, bhuiyan mu, mah-e-muneer s, al mamun a, et al. seasonality, timing, and climate drivers of influenza activity worldwide. j infect dis. 2012 sep 15;206(6):838-46. doi:10.1093/infdis/jis467 pmid:22829641
- durand lo, cheng py, palekar r, clara w, jara j, cerpa m, et al. timing of influenza epidemics and vaccines in the american tropics, 2002-2008, 2011-2014. influenza other respir viruses. 2016 may;10(3):170-5. doi:10.1111/irv.12371 pmid:26701079
- saha s, chadha m, al mamun a, rahman m, sturm-ramirez k, chittaganpitch m, et al. influenza seasonality and vaccination timing in tropical and subtropical areas of southern and south-eastern asia. bull world health organ. 2014 may 01;92(5):318-30. doi:10.2471/blt.13.124412 pmid:24839321
- hirve s, newman lp, paget j, azziz-baumgartner e, fitzner j, bhat n, et al. influenza seasonality in the tropics and subtropics-when to vaccinate? plos one. 2016 04 27;11(4):e0153003. doi:10.1371/journal.pone.0153003 pmid:27119988
- mardy s, ly s, heng s, vong s, huch c, nora c, et al. influenza activity in cambodia during 2006-2008. bmc infect dis. 2009 10 15;9(1):168. doi:10.1186/1471-2334-9-168 pmid:19828051
- horm sv, mardy s, rith s, ly s, heng s, vong s, et al. epidemiological and virological characteristics of influenza viruses circulating in cambodia from 2009 to 2011. plos one. 2014 10 23;9(10):e110713. doi:10.1371/journal.pone.0110713 pmid:25340711
- vega t, lozano je, meerhoff t, snacken r, mott j, ortiz de lejarazu r, et al. influenza surveillance in europe: establishing epidemic thresholds by the moving epidemic method. influenza other respir viruses. 2013 jul;7(4):546-58. doi:10.1111/j.1750-2659.2012.00422.x pmid:22897919
- vega t, lozano je, meerhoff t, snacken r, beautã© j, jorgensen p, et al. influenza surveillance in europe: comparing intensity levels calculated using the moving epidemic method. influenza other respir viruses. 2015 sep;9(5):234-46. doi:10.1111/irv.12330 pmid:26031655
- overview of influenza surveillance in the united states. atlanta: the united states centers for disease control and prevention; 2015 (https://www.cdc.gov/flu/weekly/overview.htm, accessed 31 december 2016).
- global epidemiological surveillance standards for influenza. geneva: world health organization; 2014 (http://www.who.int/influenza/resources/documents/influenza_surveillance_manual/en/, accessed 31 december 2016).
- strengthening response to pandemics and other public-health emergencies. geneva: world health organization; 2011 (http://apps.who.int/gb/ebwha/pdf_files/wha64/a64_10-en.pdf, accessed 31 december 2016).
- tay el, grant k, kirk m, mounts a, kelly h. exploring a proposed who method to determine thresholds for seasonal influenza surveillance. plos one. 2013 10 11;8(10):e77244. doi:10.1371/journal.pone.0077244 pmid:24146973
- beigel jh, farrar j, han am, hayden fg, hyer r, de jong md, et al. writing committee of the world health organization (who) consultation on human influenza a/h5. avian influenza a (h5n1) infection in humans. n engl j med. 2005 sep 29;353(13):1374-85. doi:10.1056/nejmra052211 pmid:16192482
- lucero mg, inobaya mt, nillos lt, tan ag, arguelles vlf, dureza cjc, et al. national influenza surveillance in the philippines from 2006 to 2012: seasonality and circulating strains. bmc infect dis. 2016 12 19;16(1):762. doi:10.1186/s12879-016-2087-9 pmid:27993136
- azziz-baumgartner e, alamgir asm, rahman m, homaira n, sohel bm, sharker may, et al. incidence of influenza-like illness and severe acute respiratory infection during three influenza seasons in bangladesh, 2008-2010. bull world health organ. 2012 jan 01;90(1):12-9. doi:10.2471/blt.11.090209 pmid:22271960
- chadha ms, broor s, gunasekaran p, potdar va, krishnan a, chawla-sarkar m, et al. multisite virological influenza surveillance in india: 2004-2008. influenza other respir viruses. 2012 may;6(3):196-203. doi:10.1111/j.1750-2659.2011.00293.x pmid:21955356
- chittaganpitch m, supawat k, olsen sj, waicharoen s, patthamadilok s, yingyong t, et al. influenza viruses in thailand: 7 years of sentinel surveillance data, 2004-2010. influenza other respir viruses. 2012 jul;6(4):276-83. doi:10.1111/j.1750-2659.2011.00302.x pmid:22074057
- khamphaphongphane b, ketmayoon p, lewis hc, phonekeo d, sisouk t, xayadeth s, et al. epidemiological and virological characteristics of seasonal and pandemic influenza in lao pdr, 2008-2010. influenza other respir viruses. 2013 may;7(3):304-11. doi:10.1111/j.1750-2659.2012.00394.x pmid:22716289
- kosasih h, roselinda, nurhayati, klimov a, xiyan x, lindstrom s, et al. surveillance of influenza in indonesia, 2003-2007. influenza other respir viruses. 2013 may;7(3):312-20. doi:10.1111/j.1750-2659.2012.00403.x pmid:22804910
- western pacific region global influenza surveillance and response system. epidemiological and virological characteristics of influenza in the western pacific region of the world health organization, 2006-2010. plos one. 2012;7(5):e37568. doi:10.1371/journal.pone.0037568 pmid:22675427
- radin jm, katz ma, tempia s, talla nzussouo n, davis r, duque j, et al. influenza surveillance in 15 countries in africa, 2006-2010. j infect dis. 2012 dec 15;206 suppl 1:s14-21. doi:10.1093/infdis/jis606 pmid:23169960
- bi-weekly influenza situation update. manila: world health organization regional office for the western pacific; 2016 (http://www.wpro.who.int/emerging_diseases/influenza/en/, accessed 31 december 2016).
- flu express. hong kong sar (china): department of health; 2016 (http://www.chp.gov.hk/en/guideline1_year/29/134/441/304.html, accessed 31 december 2016).
- pacific syndromic surveillance. new caledonia: pacific public health surveillance network; 2016 (http://www.spc.int/phs/pphsn/surveillance/syndromic.htm, accessed 31 december 2016).
- weekly report. china: chinese national influenza center; 2016 (http://www.chinaivdc.cn/cnic/en/surveillance/weeklyreport/, accessed 31 december 2016).
- steffen c, debellut f, gessner bd, kasolo fc, yahaya aa, ayebazibwe n, et al. improving influenza surveillance in sub-saharan africa. bull world health organ. 2012 apr 01;90(4):301-5. pmid:22511827
- polansky ls, outin-blenman s, moen ac. improved global capacity for influenza surveillance. emerg infect dis. 2016 jun;22(6):993-1001. doi:10.3201/eid2206.151521 pmid:27192395
engaging women volunteers of high socioeconomic status in supporting socioeconomically disadvantaged tuberculosis patients in chiang rai, thailand lessons from the field jintana ngamvithayapong-yanai,ab sarmwai luangjina,b supalert nedsuwan,c pacharee kantipong,cjirapohn wongyaib and nobukatsu ishikawaa a the research institute of tuberculosis, japan anti-tuberculosis association, tokyo, japan. b tb/hiv research foundation, muang district, chiang rai, thailand. b chiang rai regional hospital, chiang rai, thailand. correspondence to jintana ngamvithayapong-yanai (email:jip@loxinfo.co.th and jintanajip@yahoo.com). to cite this article: yanai jn et al. engaging women volunteers of high socioeconomic status in supporting socioeconomically disadvantaged tuberculosis patients in chiang rai, thailand. western pacific surveillance and response journal, 2013, 4(1):34–38. doi:10.5365/wpsar.2012.3.4.013 abstract problem: the 2008 tuberculosis (tb) surveillance of chiang rai hospital, chiang rai, thailand reported that 8.4% of thai, 22.7% of hill tribe minority and 25% of migrant patients (n = 736) defaulted from treatment. context: tb patient management in chiang rai is complicated due to poverty and hiv stigma. a previous study shows unaffordable travel expense was one of the reasons of patient default. action: we engaged chiang rai women’s organizations whose members are of high socioeconomic status to support poor tb patients financially and socially. a group of women formed a team to support these tb patients (n = 192) by raising and sustaining funds and providing home visits (n = 37). tb surveillance and patient-fund register data were used to evaluate tb treatment outcomes. outcome: the success of tb treatment was significantly higher for patients receiving financial support (relative risk [rr]: 1.351; 95% confidence interval [ci] 1.20–1.53; p discussion: it is possible to involve volunteers to support poor tb patients. willingness to support tb patients was driven by presenting provincial tb epidemiology information, research data on the experience of poor patients and the inspiring experiences of other women volunteers. future research should investigate the reasons for the high treatment success among patients who received home visits. problem regardless of a country’s economy or tuberculosis (tb) prevalence, tb is a disease associated with poverty,1 and thailand is no exception. although the world bank has ranked thailand as an upper-middle-income country, the income gap between the rich and the poor is one of the most unequal in asia.2 the world health organization (who) classified thailand as a country with high prevalences of tb, hiv and tb with hiv co-infection (tb/hiv).3 since 1998, who has listed thailand as one of the 22 high tb-burden countries. chiang rai, thailand’s northernmost province, has a high density of hill tribe minorities and migrants from myanmar. of the 1.2 million people in chiang rai, about 18 460 people are living with hiv; the tb notification rate in 2011 was 153 per 100 000 (23% tb with hiv co-infection). the chiang rai provincial tb surveillance data indicates that, on average, one patient dies of tb every 36 hours in the province. chiang rai hospital (crh), the largest provincial government hospital, provides free tb diagnosis and treatment for patients who declare that health-care costs are unaffordable. patients are requested to visit the hospital biweekly or monthly, depending on their clinical conditions. although treatment is free, tb patient management in crh is complicated due to poverty, hiv stigma, language and cultural differences, as well as the legal status of some patients. the 2007 tb surveillance of crh (n = 736) reported that 8.4% of thai, 22.7% of hill tribe minority, and 25% of migrant patients, defaulted from treatment. our previous study4 reported that a majority of tb patients had to borrow money during their tb treatment course (six to nine months). unaffordable travel expense was referred to as a main cause of treatment interruption, especially for hill tribe and migrant patients. due to language barriers, these cases had to be accompanied to the hospital, which doubled the travel expense. during the investigation into reasons for default from tb treatment, we learnt about the difficulties experienced by poor patients. older children who lost their parents had to quit school and go to work; younger children were raised by elderly grandparents.5 context in 2008 we established the “center for sharing,” a tb patient-fund at crh providing travel and food support for those who needed it. the initial 100 000 thai baht (approximately us$ 3300) was granted from the stop tb partnership.6 our greatest challenge was devising a way to sustain the patient-fund after the initial grant was exhausted. action to ensure continuity of the patient-fund, we explored the feasibility of fund-raising in a sustainable manner by involving chiang rai women’s organizations whose members are of high socioeconomic status. we obtained a list of women’s organizations in chiang rai through an internet search, contacted the provincial social development and human security office and discussed our plans with the chair of a menopause clinic club. subsequently, we organized the first workshop by inviting 33 women from nine women’s organizations in chiang rai. the five-hour workshop included the following sessions: preand post-workshop tests about tb; information about tb disease; chiang rai tb epidemiology; experiences of poor tb patients; tb control case studies on the role of women volunteers in india, bangladesh, indonesia and japan; and group discussion on “can women’s organizations in chiang rai contribute to tb care?” the first workshop revealed most women were highly aware of the serious hiv situation in chiang rai, but they thought of tb as a disease of the past. although the experiences of women volunteers from low-income countries were presented, the participants reported relating best to the japanese volunteers’ experiences. the slogan “eradicate tb with women’s hands and hearts” inspired the group, and they believed they could develop a similar project in chiang rai. two follow-up workshops to discuss and plan actions were organized. by the end of the third workshop a group was formed called “women volunteers to eradicate tb.” the group selected a chair, vice-chair, treasurer and secretariat and invited the tb and hiv doctors from crh to be advisers. the volunteers performed two major activities to support tb patients: fund-raising for the tb patient-fund and home visits. fund-raising for tb patient-fund the volunteers raised funds to support tb patients by organizing a charity gala dinner, selling products at provincial festivals and conferences and collecting donations from individual volunteers and women’s organizations. the tb patient-fund staff identified patients who needed financial assistance for transportation and living expenses by interviewing tb patients with a simple poverty screening questionnaire.7 the questionnaire included the following: (1) do you have health insurance? (2) do you have less than us$ 3 for the whole family or did you experience a food shortage during the last month? (3) are you able to pay for travel to the tb clinic? (4) do you have family members, friends or relatives to help when encountering a financial crisis? the support ranged from 100 to 4000 thai baht per visit depending on the patient’s circumstances. home visit in addition to receiving financial support from the tb patient-fund, some patients received home visits from the volunteers. the criteria for a home visit included: extremely poor tb patients, living alone, living with elderly caregivers or being isolated from the community and patient consent to home visit. in each visit, four to six volunteers visited the patient at home. the volunteers usually brought milk, eggs, clothes and cash to support the patient. the volunteers gave encouragement to patients to overcome their disease and difficulties. each home visit lasted about 30 minutes. evaluation after implementing these activities for more than 15 months, we analysed the tb register and patient-fund records and evaluated tb treatment outcomes of patients receiving and not receiving financial support. a group discussion with the members (10 women) who most frequently joined the activities was organized to explore the volunteers’ motivations and challenges. outcome tb treatment outcome of patients receiving only financial support of the total 759 tb patients, 72.1%, 21% and 6.9% were thai, hill tribe, and migrant patients, respectively (table 1). nineteen per cent of thai, 47% of hill tribe and 25% of migrant tb patients received financial support from the tb patient-fund. the overall treatment success rate of patients who received financial support was significantly higher than patients who did not receive financial support (relative risk [rr]:1.35; 95% confidence interval [ci]: 1.20–1.53; p table 1. treatment outcome of tuberculosis patients receiving financial support from the patient-fund, classified by ethnicity (june 2009 to march 2011) click to download table 1. jpg, 296kb rr – relative risk; ci – confidence interval * success rate – cured and completed treatment; default – lost to follow-up > 2 months note: data from chiang rai hospital’s tb register and tb patient-fund register. tb treatment outcome of patients receiving financial support and home visit between june 2009 and march 2011, 37 patients (five children, 17 women and 15 men) were visited by the volunteers at home. they were 25 thai, eight hill tribe and four migrant patients. sixteen patients (43%) had tb with hiv co-infection. remarkably, although these patients were considered to be either very poor or having complicated psychosocial issues, the treatment success rate of these 37 patients was 95%; two cases died (both were thai, hiv-positive) and none defaulted. this project was not able to determine the reasons for the high treatment success of these patients. some patients, especially the patients living alone or patients who were isolated from family and community reported feeling honoured and grateful to have the volunteers visit. one senior male patient living alone said, “it’s just like a dream, i have never thought this will happen to my life. several people came to visit me…thank you…thank you so much.” characteristics of the women volunteers, their motivations and challenges since june 2009, the women’s organizations that have consistently supported tb patients in chiang rai have been the red cross chapter, the model-mother group, the women’s cultural promotion association, the women volunteer for civil defence association and the senior smart-brain volunteers. the business and professional women’s association has participated with annual donations to the patient-fund. about 36 women regularly participated in the volunteer activities. more than half of the volunteers were aged over 60 years (range: 37–79 years old) and had university educations. they were retired senior government officers, health staff members, business owners or wives of high-level officials such as the governor and the hospital director. most volunteers originated and lived in chiang rai. the majority of these women were members of two to five women’s or volunteer organizations. many of them knew each other and had volunteered together for many years. some women had experience visiting disaster victims or disabled people. however, visits to tb patients’ homes were new to all of them. the volunteers found home visits challenging due to bad road conditions, especially in the rainy season. several senior women said their family asked them not to visit patients’ houses for fear of tb transmission. however, the volunteers felt home visits substantially encouraged patients and family members. volunteers felt that their home visits may have also helped reduce tb and hiv stigma because community people observed the women visit the patients at home and interact as friends. group discussion with the volunteers showed that the major reasons for volunteering and supporting poor tb patients were buddhism and the traditional thai value that doing charity is a virtue. they plan to serve as volunteers as long as their physical health allows. discussion to our knowledge, this is the first report from a tb high-burden country in which women with high socioeconomic status have been involved in tb care for fund-raising and home visits. although studies from bangladesh, indonesia,8 india9 and iraq10 reported the important role of women volunteers as treatment supporters for tb, those volunteers were women living in the same community or having comparable socioeconomic status with tb patients. several studies reported the role of financial support and social interventions in improving the tb situation for poor patients.11–14 however, published literature describing the process of implementation is lacking. this paper fills in the current knowledge gap by describing the process of engaging women volunteers with high socioeconomic status to financially and socially support poor tb patients. willingness by these women to support the patients was driven by presenting the tb situation, providing research data on the experiences of poor patients and the experiences of women volunteers from other countries. the motivation to follow the japanese women volunteers may be influenced by “japanization.” it has been suggested that since 1987, thai people seem to respect and appreciate japan as asia’s leading country for social, economic and technological advancement.15 mobilizing and engaging women organizations to support poor tb patients may be applicable in other settings where medical and health staff of tb services wish to support poor patients. the patients visited by women volunteers achieved very high treatment success rates despite being very poor and experiencing psychosocial difficulties. future research should apply qualitative research to investigate the reasons for the high treatment success among patients who received home visits. a rigorous qualitative study should elicit how patients and women volunteers perceived the support. in this paper, we report treatment outcomes from programme implementation, not from a research procedure. the stage of hiv infection, access to antiretroviral drugs and other clinical conditions may affect treatment outcome but were not available for the analysis. based on the limited data and methodology, we cannot conclude the effectiveness of the financial support and home visits. however, the overall treatment success of the patients receiving support was significantly higher than that of patients not-receiving support. the analysis by ethnicity showed high default rates in hill tribe and migrant patients; financial assistance alone may not be sufficient to assist these groups complete the long-term tb treatment. conflict of interest none declared. funding the double barred cross seal donation of japan anti-tuberculosis association (jata) supported the women volunteer workshops and the authors (s luangjina, j wongyai). references: addressing poverty in tb control. options for national tb control programmes. geneva, world health organization, 2005. available from: http://whqlibdoc.who.int/ hq/2005/who_htm_tb_2005.352.pdf [accessed 20 september 2012]. asian development outlook 2012. confronting rising inequality in asia. mandaluyong city, asian development bank, 2012. available from: http://www.adb.org/sites/ default/files/pub/2012/ado2012.pdf [accessed 20 september 2012]. global tuberculosis report 2012. geneva, world health organization, 2012. available from: http://www.who.int/tb/publications/global_report/en/ [accessed 20 september 2012]. kantipong p et al. needs assessment for a tuberculosis patient network in chiang rai hospital, thailand. the international journal of tuberculosis and lung disease, 13(12 suppl1):s237 (abstract). available from: http://www.worldlunghealth.org/ conf2009/website/assets/files/abstract_book_2009_web.pdf [accessed 20 september 2012]. moolphate s et al. having tb and having no money: narrating sequence and consequences of eight tb patients who were poor and defaulted their treatment (abstract). proceedings of the international conference on qualitative research in nursing and health, 2010. stoptb partnership. geneva, world health organization, 2012. available from: http://www.stoptb.org/ [accessed 28 december 2012]. nampaisan o et al. rapid assessment for poverty screening for and the support for poor tb and tb-hiv patients in chiang rai, thailand. the international journal of tuberculosis and lung disease, 15(11 suppl 3):s281 (abstract). available from: http://www.worldlunghealth.org/conflille/images/ stories/abstractbook2011_web.pdf [accessed 20 september 2012]. community contribution to tb care: practice and policy. geneva, world health organization, 2003. available from: http://www.stoptb.org/assets/documents/ countries/acsm/community%20contribution%20to%20tb%20care.pdf [accessed 20 september 2012]. aggarwal s. tackling social and economic determinants of health through women empowerment: the sewa case study (draft). new delhi, world health organization regional office for south-east asia, 2008. available from: http://www.who.int/ social_determinants/resources/isa_sewa_ind.pdf [accessed 20 september 2012]. niazi ad, al-delaimi am. impact of community participation on treatment outcomes and compliance of dots patients in iraq. eastern mediterranean health journal, 2003, 9:709–717. pmid:15748068 boccia d et al. cash transfer and microfinance interventions for tuberculosis control: review of the impact evidence and policy implications. international journal of tuberculosis and lung disease, 2011, 15(suppl 2):s37–49. doi:10.5588/ijtld.10.0438 pmid:21740658 rocha c et al. the innovative socio-economic interventions against tuberculosis (isiat) project: an operational assessment. international journal of tuberculosis and lung disease, 2011, 15(suppl 2):s50–77. doi:10.5588/ijtld.10.0447 pmid:21740659 lagarde m, haines a, palmer n. the impact of conditional cash transfers on health outcomes and use of health services in low and middle income countries (review). the cochrane library, 2009, issue 4. available from: http://apps.who.int/rhl/ reviews/cd008137.pdf [accessed 20 september 2012]. benatar sr, upshur r. tuberculosis and poverty: what could (and should) be done? the international journal of tuberculosis and lung disease, 2010, 14:1215–1221. pmid:20843410 satayanurak a. japanization [in thai]. bangkok, the open books publisher, 2005. responding to a measles outbreak in a pacific island community in western sydney: community interviews led to church-based immunization clinics original research nicola scott,ab salwa gabriel,c vicky sheppeard,d alisa peacock,c caroline scott,c kristina flego,c bradley forssmane and holly sealeb a new south wales public health officer training program, ministry of health, new south wales, australia. b school of public health and community medicine, university of new south wales, new south wales, australia. c western sydney local health district public health unit, new south wales, australia. d health protection new south wales, australia. e nepean blue mountains local health district public health unit, new south wales, australia. correspondence to nicola scott (e-mail: nicolascott11@hotmail.com). to cite this article: scott n et al. responding to a measles outbreak in a pacific island community in western sydney: community interviews led to church-based immunization clinics. western pacific surveillance and response journal, 2015, 6(2):51–57. doi:10.5365/wpsar.2014.5.3.004 abstract introduction: there are large pacific island communities in western and south-western sydney, new south wales, australia. in 2011 and 2012, measles outbreaks disproportionally affected children and youth within these communities. the objectives of this study were to explore barriers to immunization in a pacific island community from the perspectives of community members and health professionals and to conduct a pilot programme whereby immunization catch-up clinics were held in a samoan church in western sydney. methods: interviews were conducted with pacific island community members (n = 12) and health professionals connected with the pacific island community (n = 7) in 2013. a partnership with a local samoan church was established to provide an accessible venue for immunization catch-up clinics. results: among the community members there were high levels of belief in the importance of immunization and a positive view regarding the protection offered by immunization. a key barrier reported by community members was being busy and therefore having limited time to get children immunized. the important role of the church within the community was emphasized in the interviews, and as a result, two immunization catch-up clinics were held in a samoan church in western sydney. the age range of attendees was 7–33 years. a total of 31 measles, mumps and rubella doses and 19 meningococcal c doses were given during the two clinics. discussion: the outcomes of the interviews and the subsequent clinics highlighted the potential of churches as a venue for providing public health interventions such as catch-up immunization. introduction despite australia eliminating the transmission of endemic measles in 2005,1 sporadic measles outbreaks continue to occur. in new south wales from 2010 to 2013, there were 323 measles notifications with large outbreaks occurring in both 2011 and 2012.2 there were 168 cases in the 2012 measles outbreak in new south wales,3 with most cases occurring in south-western and western sydney with an overrepresentation among people of pacific island descent.3 the 2011 measles outbreak in western sydney also disproportionally affected the pacific island population, with 46% of the 26 cases being of pacific island descent.4 “pacific island population” refers to people from the islands of melanesia, the federated states of micronesia and polynesia,5 although populations from these different regions are heterogeneous with diverse cultures, languages and religions.5 australia has sizable pacific island communities in sydney, melbourne and brisbane.6 the blacktown local government area is the largest in new south wales by population with 312 479 residents7 and is multicultural with 38% of all residents reporting they were born overseas and 37% of residents speaking a primary language other than english.8 samoan is the fifth most common language spoken at home9 and is ranked as the 12th (4624 people) most common ancestry, followed by fijian at 13th (4105) and maori at 15th (3282).10 using ancestry, which is the cultural association and ethnic background of an individual going back three generations, provides a more accurate reflection of pacific island population size than country of birth.6 to date, very little research has been undertaken into immunization among pacific island communities in australia. new zealand research has found that children with pacific island backgrounds have a greater risk of poor health and hospitalization for respiratory infections, skin infections and a higher incidence of infectious diseases such as meningococcal disease and measles than new zealand maori or other new zealand children.11 factors found to be significantly associated with incomplete immunization of pacific island infants in new zealand include: (1) maternal birthplace (pacific island born rather than new zealand born); (2) parity (more than five children); (3) maternal smoking; and (4) difficulty with transport.12,13 as pacific island children and youth were predominant among the people affected in measles outbreaks in new south wales in 2011 and 2012, we attempted to increase immunization in this group by: (1) exploring the barriers to immunization in the pacific island community by conducting interviews with community members; and, (2) conducting a pilot programme whereby two immunization catch-up clinics were held in a samoan church in western sydney. this paper describes both of these. methods interviews with pacific island community members study design and sample semi-structured interviews were conducted in 2013 with pacific island community members and health professionals who worked with or were connected with the pacific island community. health professional participants were recruited through the public health unit. a pacific island community health worker, with in-depth knowledge of the community and extensive experience with community engagement, assisted with the recruitment of community participants. eligible participants were pacific island community members with children recruited through local pacific island women’s support groups and a pacific island church. a verbal explanation of the study was provided in english or samoan and written participant information and consent forms were provided in english, samoan and tongan. completed consent forms were returned to the researcher via the community health worker. approximately 80% of the people who were provided with a consent form returned them; participants were then contacted by the researcher to arrange an interview. the interviews aimed to gather information on barriers to immunization and views on proposed pilot immunization catch-up clinics. questions were asked in english in an open-ended manner to allow for expansion. interviews were conducted in private and lasted approximately 30 minutes each. community participants were provided with a voucher as reimbursement for their time. data analysis the interviews were recorded, transcribed verbatim and analysed thematically using qsr international’s nvivo10 qualitative data analysis software. this was then verified with secondary coding. ethics approval was obtained from the university of new south wales. immunization catch-up clinics target population and immunization offered the primary target population for the immunization catch-up clinics was pacific island youth aged 10–19 years, as this was the age group commonly affected in the 2011 and 2012 outbreaks.3,4 the australian childhood immunization register (acir) is a national register, established in 1996, that records details of vaccinations given to children under seven years of age who live in australia.14 all children who are registered with medicare (the australian universal health insurance scheme) are automatically included on the acir unless their parents actively seek their removal. because 99% of children are registered with medicare by the age of 12 months, it can be considered a near complete national record.15 as acir commenced operations in 1997, older pacific island youth (> 19 years) may not have received or have a record of receiving two doses of measles, mumps and rubella (mmr) vaccine, so this age group was also included as a secondary target. as well as mmr vaccine, both target populations were also offered meningococcal c vaccine if it was absent from their records. venue and logistics for clinics two immunization catch-up clinics were held in a large samoan church in western sydney in 2013. the clinics were advertized through a flyer and word of mouth within the community. the first clinic was held on a rehearsal day for a samoan festival, which was suggested by the church leader, because many children and youth from the congregation would be present. as the completion of a two-dose vaccine schedule for mmr requires a subsequent dose of mmr to be provided at least four weeks after the first valid dose,16 the second clinic was held one month after the first clinic. results interviews with pacific island community members participants the majority of community participants (n = 12) originated from samoa (n = 10) with one participant from the cook islands and one from tonga. reflective of the recruitment process, the majority of participants were female (n = 11). all participants had two children or more with half reporting that their children were born in australia. of the children born overseas, the majority were born in new zealand. one quarter of the participants reported they had grandchildren. of the seven health professionals interviewed, three were samoan, two tongan and two non-pacific islanders. at the time of the interviews, the health professionals worked in community health, primary care or tertiary hospital care. knowledge of immunization community participants stated that immunization was important and spoke positively about immunization protecting their children and themselves from diseases. immunization is good for prevention of diseases coming up, and it is good to have some antibodies against diseases in the future. – community member all participants were able to name at least two diseases that could be prevented by immunization. the majority of participants said whooping cough, measles or chickenpox, with a few participants providing a more comprehensive list including meningococcal disease and hepatitis. participants reported feeling there were minimal risks involved with immunization. one participant described a severe adverse reaction to immunization that her brother had back in the islands; however, she felt that this was not a risk in australia. reported benefits of immunization included: preventing disease; facilitating good health; and helping children to be safe, active and happy. there was some acknowledgement of the importance of other people immunizing their children and also reference to costs involved with children getting sick if they are not immunized. because i don’t want them to be sick. i want them to be healthy and it is more helpful to me cause if they are sick i have to take them to the doctor and spend a lot of money. – community member barriers to immunization busy lives when asked their current views on barriers to immunization, the majority of participants reported that being busy was a factor, which also leads to them forgetting or having limited time to take their children to the doctor. for some participants, there was no sense of urgency around immunization. my son, he turned four and i forgot, i had it on my reminder and then forgot again. so i didn’t get him done until he was four years and four months. and i kept having it on my reminder. it didn’t feel like it was urgent. just business got in the way and i forgot, i’ll do it next week. – community member migration missing out on immunization due to migration was raised as an issue by the majority of community participants and health professionals. community members reported that movement frequently occurs from samoa to new zealand and then to australia. this was also highlighted by the health professionals; one specifically identified that some of the pacific island families move when their children are adolescents and they have missed out on some of their immunizations. … i think it is just the time when they move over and they get missed that way. – health professional communication language barriers and lack of communication were not identified as barriers to immunization for the majority of community participants, although this outcome may have been influenced by the fact that the interviews were conducted in english. in comparison, all of the health professionals interviewed felt this was a key barrier with misinformation and myths about immunization and low levels of health literacy within the pacific island community. low level of understanding and communication, it’s more of an education issue that the people don’t really understand and the communication is very difficult. – health professional strategies to improve immunization rates in contrast to the findings from the community members, health professionals felt it was important to provide information and education about immunization including the risks associated with not being immunized. organize interpreters to speak with the group and provide information about the value of vaccination, about the risks of not getting your child vaccinated. – health professional due to previous advice given to the public health unit regarding the importance of church in the pacific island community, interviewees were asked their views on providing information on immunization through church. both groups agreed with this approach; however, the positive response from the community members may have been influenced by their links to local churches. most pacific island people go to church. maybe this is one of the best channels to go through. to remind people, through ministers, because their job is spiritual health as well, they will give out information for the health of their people. – community member i guess more awareness, through church, cause that is where most of them go to. the communities move around the church area, so that’s one way to improve the awareness and communication through church. – health professional interviewees were asked their views on the use of churches to pilot immunization catch-up clinics. the majority of community members said they would be happy for their children or grandchildren to be immunized at church. all of the health professionals agreed with the approach. the parents go there and seem to respect the leadership from the ministers, so i think we will have more success that way. – health professional immunization catch-up clinics approximately 70 children and youth were in attendance at the first clinic held on a festival rehearsal day. an older age group was in attendance at the second clinic held on a fundraiser day for the church. on both clinic days, completed consent forms were used to check acir and school vaccination records to determine the need for mmr or meningococcal c vaccine. there were 63 participants at the first clinic (approximately 10 people did not consent) and 15 at the second (table 1). of these, 27 at the first clinic and one at the second clinic were appropriately vaccinated; a total of 50 doses of vaccine were provided: 36 at the first clinic and 14 at the second (table 1). table 1. participants of the immunization catch-up clinics by immunization status and whether vaccine given, western sydney, australia, 2013 click to download table 1. jpg, 320kb * all received their mmr dose 1 at the first clinic. mmr, mumps, measles and rubella. participants already vaccinated with mmr had an age range of 7–17 years (median = 12 years), and for those that received mmr the age range was 10–29 years (median = 20 years). for those already vaccinated for meningococcal c, the age range was 7–27 years (median = 16 years), and for those provided with meningococcal c vaccine, the age range was 10–33 years (median = 20 years). the important role of the church within the community was emphasized in the interviews and as a result, two immunization catch-up clinics were held in a samoan church in western sydney. discussion the pacific island community in western sydney has been disproportionally affected by measles outbreaks in recent years. this study indicates that among pacific island community members interviewed, there were high levels of belief in the importance of immunization and a positive view of protection offered by immunization. a key barrier reported by the community members were being busy and forgetting immunization due to time limitations. health professionals interviewed felt that a key barrier was low levels of knowledge and health literacy affecting immunization. both groups agreed that missing out on immunization occurs in the pacific island community due to migration between countries. immunization clinics held in a samoan church in western sydney provided an easily accessible venue for church attendees to receive catch-up immunizations. as a pilot programme, gaining consent, checking the registry and providing the required immunizations on the same day was a successful model. however, this approach is resource and time intensive and requires a good relationship with the community. in comparison to a previous pacific island community-based catch-up clinic held by the same public health unit, where there were no attendees, this church-based clinic immunized a relatively large number of people. this may have been due to factors such as the church venue, that there was a rehearsal for a festival and that the clinics were held on weekends. the median age of people requiring both mmr and meningococcal c vaccine was 20, suggesting that young adults may require future targeted strategies to improve immunization. susceptibility of the teenage/young adult age group to measles has also been seen across new south wales; 15–19 year olds were the second highest age group affected in the 2012 measles outbreak.3 the interviews, although conducted with a small number of pacific island community members, provided information on knowledge and attitudes towards immunization. this is important as attitudes, perspectives, health beliefs and health-seeking behaviour are shaped by ethnicity and culture17 with different cultural groups understanding and experiencing health, health care, disease and treatment differently.17 a pacific island and maori health needs assessment conducted by queensland health found that health literacy was very poor among all pacific island communities; there were low levels of health-seeking behaviour, as well as a lack of knowledge of services and how to navigate the health system.6 traditional beliefs about health were also prevalent, but these beliefs were not discussed in relation to immunization. churches and religious groups were identified as having a positive influence on social cohesion and health outcomes within the pacific island community.6 our interviews also highlighted the influence of the church and that it may be a suitable location for catch-up immunization for this high-risk group. to our knowledge, there have been no other reports of immunization clinics being held in churches. attitudes and beliefs about immunization in the pacific island community in australia may be influenced by experiences in the country of origin. some pacific island countries record high incidences of infant and child mortality rates. as well as neonatal causes, other causes of death among children under five include diarrhoeal disease, pneumonia and measles.18 immunization data show varying levels of coverage for measles-containing vaccine (mcv) among pacific island countries. from 2008 to 2012, mcv coverage ranged from 99% to 95% in tonga, from 95% to 97% in cook islands, and from 45% to 85% in samoa.19 there is inconsistency in coverage rates over the five year period; however tonga and cook islands report they are able to sustain consistently high levels of coverage. the lower mcv coverage rates in samoa may effect immunization coverage in samoan communities in australia. the inconsistencies between pacific island countries may be due to differences in systems of primary health care and immunization service delivery among countries; there appears also to be a knowledge gap that could be addressed with further research. in australia, little is known about pacific island communities’ knowledge, attitudes and beliefs towards primary health care services such as immunization. there has been one study of accessibility and utilization of health services conducted in brisbane in four culturally and linguistically diverse communities in 2011. this found that in the pacific island community there was lack of knowledge of available health services, reported communication issues due to use of medical terminology by health workers and acknowledgement of a preference for accessing doctors from a similar cultural background.17 while our study focused only on immunization, these broader insights could be useful for improving delivery of culturally appropriate primary health care such as immunization clinics in the pacific island community in new south wales. this study had some limitations: interviews were only conducted with a small group of participants; conducting the interviews in english may have resulted in selection bias towards those able to converse in english; detailed socioeconomic and demographic information was not collected; and community participants were linked to the women’s group and the church from which they were recruited. this reduces the representativeness to the rest of the pacific island community and also the possibility that other important emergent themes were not discovered. limitations of the clinics were that some of the first clinic attendees did not return to receive their second mmr dose and that the clinics focused on one pacific island community and one religious denomination within that community. using open-ended questions enabled a greater depth of information and secondary coding verification strengthened the analysis. conclusions by interviewing a small number of community members and health professionals, the influence of the church was identified, and, as a result, two immunization clinics were held in a large samoan church in western sydney. this alternative approach for providing immunization to most-at-risk group was successful and highlighted that a partnership between a local church and public health unit can be effective in providing catch-up immunization. however, this approach is resource and time intensive and requires a good relationship with the community to ensure success. rather than implementing a regular programme, a church or similar community location could be used to target high-risk groups for immunization in outbreak situations. conflicts of interest none declared. funding holly seale is supported by an nhmrc australian-based public health training fellowship (1012631). acknowledgements this work was completed while nicola scott was an employee of the new south wales public health officer training program, funded by the new south wales ministry of health, while based at the western sydney public health unit. references: heywood ae et al. elimination of endemic measles transmission in australia. bulletin of the world health organization, 2009, 87:64–71. doi:10.2471/blt.07.046375 pmid:19197406 measles notification in nsw residents. sydney, new south wales ministry of health, 2013. available from: http://www0.health.nsw.gov.au/data/diseases/measles.asp [accessed 2 february 2014]. najjar z et al. sustained outbreak of measles in new south wales, 2012: risks for measles elimination in australia. western pacific surveillance and response journal, 2014, 5:14–20. doi:10.5365/wpsar.2013.4.4.001 pmid:25635228 flego k, sheppeard v, mcphie k. a recent measles outbreak in western sydney – diagnosis and population vaccination status. broad street pump, 2011, 23:1–2. white r et al. ethnic gangs in australia: do they exist? report no. 3 pacific islander young people. melbourne, australian multicultural foundation, 1999. queensland health response to pacific islander and maori health needs assessment. brisbane, queensland health, division of the chief health officer, 2011. demographics. sydney, blacktown city council, 2013. available from: http://www.blacktown.nsw.gov.au/discover_blacktown/statistics/demographics [accessed 5 march 2015]. birthplace. sydney, blacktown city council, 2013. available from: http://profile.id.com.au/blacktown/birthplace [accessed 5 march 2015]. language spoken at home. sydney, blacktown city council, 2013.available from: http://profile.id.com.au/blacktown/language [accessed 5 march 2015]. ancestry. sydney, blacktown city council, 2013. available from: http://profile.id.com.au/blacktown/ancestry [accessed 5 march 2015]. tukuitonga cr, bell s, robinson e. hospial admission among pacific children auckland 1992–97. the new zealand medical journal, 2000, 113:358–361. pmid:11130369 paterson j et al. maternal and demographic factors associated with non-immunisation of pacific infants living in new zealand. the new zealand medical journal, 2004, 117:u994. pmid:15475977 paterson j et al. immunisation of a cohort pacific children living in new zealand over the first 2 years of life. vaccine, 2006, 24:4883–4889. doi:10.1016/j.vaccine.2006.02.050 pmid:16644070 australian childhood immunisation register. canberra, department of human services, 2013. available from: http://www.medicareaustralia.gov.au/provider/ patients/acir/ [accessed 11 february 2014]. hull bp, deeks sl, mcintyre pb. the australian childhood immunisation register-a model for universal immunisation registers? vaccine, 2009, 27:5054–5060. doi:10.1016/j.vaccine.2009.06.056 pmid:19576945 the australian immunisation handbook – 10th edition. canberra, department of health and ageing, 2013. henderson s, kendall e. culturally and linguistically diverse peoples’ knowledge of accessibility and utilisation of health services: exploring the need for improvement in health service delivery. australian journal of primary health, 2011, 17:195–201. doi:10.1071/py10065 pmid:21645477 gani a. some aspects of communicable and non-communicable diseases in pacific island countries. social indicators research, 2009, 91:171–187. doi:10.1007/s11205-008-9276-x who-unicef estimates of measles containing vaccine (mcv) coverage. geneva, world health organization, 2014. available from: http://apps.who.int/immunization_ monitoring/globalsummary/timeseries/tswucoveragemcv.html [accessed 5 march 2015]. human infections with avian influenza a(h7n9) virus in china: preliminary assessments of the age and sex distribution perspective yuzo arima,a rongqiang zu,a manoj murhekar,a sirenda vong,b tomoe shimadaa and the world health organization event management team* a emerging disease surveillance and response, division of health security and emergencies, world health organization regional office for the western pacific, manila, philippines. b emerging disease surveillance and response, world health organization china office, beijing, china. * members of the world health organization event management team: nyka alexander, jang hwan bae, joy rivaca caminade, erica dueger, xavier dufrenot, norikasu isoda, frank konings, chin-kei lee, ailan li, michelle mcpherson, satoko otsu, karl schenkel and huu thuan vo. correspondence to yuzo arima (e-mail:arimay@wpro.who.int). to cite this article: arima y et al., world health organization event management team. human infections with avian influenza a(h7n9) virus in china: preliminary assessments of the age and sex distribution. western pacific surveillance and response journal, 2013, 4(2):1–3. doi:10.5365/wpsar.2013.4.2.005 since 31 march 2013, the government of china has been notifying the world health organization (who) of human infections with the avian influenza a(h7n9) virus,1 as mandated by the international health regulations (2005).2 while human infections with other subgroups of h7 influenza viruses (e.g. h7n2, h7n3, and h7n7) have previously been reported,3 the current event in china is of historical significance as it is the first time that a(h7n9) viruses have been detected among humans and the first time that a low pathogenic avian influenza virus is being associated with human fatalities.4 in this rapidly evolving situation, both detailed epidemiologic and clinical data from reported cases are limited—making assessments challenging—however, some key questions have arisen from the available data. age and sex data, as one of the first and most readily available data, may be an important proxy for gender-specific behaviours/conditions and an entry point for response.5,6 here, we describe the age and sex distribution of the human cases of avian influenza a(h7n9) to better inform risk assessments and potential next steps. between 31 march and 16 april 2013, there were 63 reported cases of avian influenza a(h7n9). the median age was 64 years (range 4–87), and 45 cases (71%) were male. notably, 39 of the 63 cases (62%) were ≥ 60 years of age. when stratified by age and sex, elderly men were the most affected demographic group (figure 1). this is different to the chinese population which has a large proportion of young and middle-aged adults and a greater number of women among the elderly.7 although the case fatality rate (cfr) in all males at 22% (10/45) was similar to females at 22% (4/18), when restricted to elderly cases ≥ 60 years of age, the cfr in males is 20% (6/30) compared to no deaths in females (0/9). the case distribution of current avian influenza a(h7n9) cases is also different to reported avian influenza a(h5n1) cases in china (n=45), where the majority were young working age adults (median: 26 years; range 2–62), with no difference in gender (figure 1).8 hence, the question naturally arises – why are we seeing the current age and sex distribution, and what key questions can we ask to allow public health practitioners to respond in an efficient and effective manner? figure 1. age group and sex distribution of reported human infections with avian influenza a(h7n9) and a(h5n1) viruses, china, as of 16 april 2013 click to download figure 1. jpg, 386kb three main reasons may be considered for the current case distribution: (1) differential exposure between males and females due to gender-associated practices and norms; (2) biological differences between males and females in the clinical course post exposure/infection; and (3) differential healthcare-seeking/access behaviour between male and females, i.e. surveillance/detection bias. determining whether the current distribution is due to differential exposures is difficult to assess. the same is true with many other field investigations of acute outbreaks due to the lack of detailed case-based exposure information. despite this, limited information among current cases point to poultry-related exposures, such as live bird markets (lbms) as a potential risk factor.9 lbms have been the primary site where avian influenza a(h7n9) virus has been detected in poultry and environmental samples in the affected areas,9 although ageand sex-specific lbm visit patterns are unknown.elderly chinese men are well-known to be hobbyists of “walking” ornamental pet songbirds and take frequent and extended walks with their caged birds, congregating together in parks.10 as the source and mode of infection remain unknown, control and prevention efforts are difficult. a better understanding of the social norms and behaviours among elderly chinese men in affected areas may better guide us in the investigation (e.g. by identifying hypotheses for case-control studies). biological characteristics particular to elderly men may also be a possible explanation for the observed age and sex distribution. a defining feature of seasonal influenza is its severe morbidity and mortality among the elderly, due to higher biological susceptibility to severe outcomes from influenza infection among this age group.11,12 while poultry exposure appears to be a common risk factor in the current event, the age distribution among reported cases also raises the question why so few young adults (i.e. those of working age exposured to poultry as vendors/lbm workers/breeders/transporters) have been reported. this not only suggests greater exposure among elderly men but also a possible greater biological susceptibility to more severe outcomes. among the elderly, the number of cases and the cfr is higher among men relative to women (although this may be a function of dose response due to greater or more frequent exposure). while serologic investigations among close contacts and other subpopulations in the area will assist with our understanding regarding the clinical spectrum of this infection, information regarding smoking, underlying medical conditions and other risk factors among the current case series would help to elucidate some of these issues. healthcare-seeking behaviour and access also need to be considered as an explanatory factor. if elderly men are more likely to access healthcare, be detected or reported, surveillance bias may occur such that the distribution of the reported cases does not reflect the underlying distribution of disease occurrence in the population. however, given the high severity among the majority of the reported cases to date, the current high awareness level in both the public and the healthcare community and the nation-wide implementation of enhanced influenza-like illness and severe acute respiratory illness surveillance activities, such an artefact where elderly men are being overly selected seems unlikely. at this time, it is clear that there are more questions than answers. still, based on the basic age and sex distribution, we identify several critical questions and options to guide the ongoing investigation: what are the societal norms and common social practices among elderly men in the affected provinces? qualitative approaches and involvement of anthropologists/sociologists specializing in the sociology of health of the chinese population may be beneficial. what is the age and sex distribution of severe acute respiratory illnesses and key risk factors for respiratory illness (e.g. smoking) in the underlying population in the affected provinces? while detailed case-based clinical information is pending, data from the general population may be helpful for initial assessments. what is the age and sex distribution of healthcare utilization in the chinese population in the affected provinces? ruling out any possible selection bias will be an important initial step in understanding both the clinical and epidemiologic spectrum of infection. in these situations, it is easy to dismiss preliminary epidemiologic assessments as being too low in numbers or with too few variables of interest. clearly, there is a need for further case-based information, such as zoonotic exposures and underlying medical conditions. however, for public health workers engaged in rapid response to acute events, it is essential to operate as observational scientists and assess available information to help formulate next steps. following age and sex distributions closely over time may detect important changes in the epidemiology of this virus and with better understanding, high-risk populations, targeted interventions (e.g. gender-specific risk communication messages), prevention and control measures (e.g. vaccination) and treatment options (e.g. antivirals) may be identified. while this brief and rapid communication cannot offer answers, we hope that public health practitioners involved in such response–at various capacities around the world–may consider these key concerns and questions to help counter against not only the current virus but other emerging infectious threats. conflicts of interest none declared. funding none. references: who disease outbreak news. human infection with influenza a(h7n9) virus in china – update. geneva, world health organization, 2013. available from: http://www.who.int/csr/don/en/index.html [accessed 19 april 2013]. international health regulations (2005). geneva, world health organization, 2008. available from: http://www.who.int/ihr/9789241596664/en/index.html [accessed 19 april 2013]. belser ja et al. past, present, and possible future human infection with influenza virus a subtype h7. emerging infectious diseases, 2009, 15:859–865. doi:10.3201/eid1506.090072 pmid:19523282 uyeki tm, cox nj. global concerns regarding novel influenza a(h7n9) virus infections. [epub ahead of print]. the new england journal of medicine, 2013, 2013:11. pmid:23577629 taking sex and gender into account in emerging infectious disease programmes: an analytical framework. manila, world health organization regional office for the western pacific, 2011. available: http://www.wpro.who.int/topics/gender_issues/ takingsexandgenderintoaccount.pdf [accessed 15 april 2013]. skufka j, arima y. sex, gender and emerging infectious disease surveillance: a leptospirosis case study. western pacific surveillance and response journal, 2012, 3:37–39. doi:10.5365/wpsar.2012.3.3.001 china country profile, 2011. manila, world health organization regional office for the western pacific, 2011. available from: http://www.wpro.who.int/countries/chn/ 5chnpro2011_finaldraft.pdf [accessed 15 april 2013]. zhou l et al. risk factors for human illness with avian influenza a(h5n1) virus infection in china. the journal of infectious diseases, 2009, 199:1726–1734. doi:10.1086/599206 pmid:19416076 world health organization risk assessment. human infections with influenza a(h7n9) virus. geneva, world health organization, 2013. available from: http://www.who.int/influenza/human_animal_interface/influenza_h7n9/ riskassessment_h7n9_13apr13.pdf [accessed 13 april 2013]. liu l. birds of a feather. china daily, 2011, 5 mar. available from: http://www.chinadaily.com.cn/cndy/2011-05/03/content_12432037.htm [accessed 15 april 2013]. molinari na et al. the annual impact of seasonal influenza in the us: measuring disease burden and costs. vaccine, 2007, 25:5086–5096. doi:10.1016/j.vaccine.2007.03.046 pmid:17544181 nobuoki eshima et al. sexand age-related differences in morbidity rates of 2009 pandemic influenza a h1n1 virus of swine origin in japan. plos one, 2011, 6(4):e19409. doi:10.1371/journal.pone.0019409 pmid:21559366 sustained outbreak of measles in new south wales, 2012: risks for measles elimination in australia original research zeina najjar,a kirsty hope,a penelope clark,b oanh nguyen,b alexander rosewellc and stephen conatya a south western sydney and sydney local health districts public health unit, new south wales, australia. b western sydney local health district public health unit, new south wales, australia. c communicable diseases branch, new south wales ministry of health, north sydney, australia. correspondence to zeina najjar (e-mail: zein100@hotmail.com). to cite this article: najjar z et al. sustained outbreak of measles in new south wales, 2012: risks for measles elimination in australia. western pacific surveillance and response journal, 2014, 5(1):14–20. doi:10.5365/wpsar.2013.4.4.002 abstract objective: on 7 april 2012, a recently returned traveller from thailand to australia was confirmed to have measles. an outbreak of measles subsequently occurred in the state of new south wales, prompting a sustained and coordinated response by public health authorities. the last confirmed case presented on 29 november 2012. this report describes the outbreak and its characteristics. methods: cases were investigated following australian protocols, including case interviews and assessment of contacts for post-exposure prophylaxis. results: of the 168 cases identified, most occurred in south-western and western sydney (92.9%, n = 156). notable features of this outbreak were the disproportionately high number of cases in the 10–19-year-old age group (29.2%, n = 49), the overrepresentation among people of pacific islander descent (21.4%, n = 36) and acquisition in health-care facilities (21.4%, n = 36). there were no reported cases of encephalitis and no deaths. discussion: this was the largest outbreak of measles in australia since 1997. its occurrence highlights the need to maintain vigilant surveillance systems for early detection and containment of measles cases and to maintain high population immunity to measles through routine childhood immunization. vaccination campaigns targeting susceptible groups may also be necessary to sustain australia’s measles elimination status. introduction measles is a highly infectious disease caused by a paramyxovirus of the genus morbillivirus. globally it is the most important cause of vaccine-preventable death.1 in australia, two doses of measles-mumps-rubella (mmr) vaccine were introduced to the routine childhood vaccination schedule in 1998 for all children at 12 months and four years of age and for all adults born after 1966 who were not immune or had one dose of mmr.2 since july 2013, the second dose has been administered at 18 months of age as the measles-mumps-rubella-varicella (mmrv) vaccine.3 a measles control campaign was also adopted in 1998, targeting children aged five to 12 years, resulting in high two-dose vaccination rates for this group. a national serological survey in 2002 estimated that the cohort born between 1978 and 1982 (aged 30–34 years in 2012) had lower immunity, having only received one dose of measles vaccine and being born in a period when natural measles infection was less common; the cohort born before 1978 had better immunity.4 those born before 1966 were assumed to have been naturally infected. measles elimination has been discussed since the development of an effective measles vaccine in the 1960s. in 2005, the world health organization regional committee for the western pacific, of which australia is a member, formally declared a goal of measles elimination in the region by 2012.5 it has been suggested that this had been achieved in australia as early as 1999,4 due to high population immunity achieved through the 1998 measles control campaign and ongoing high two-dose vaccination rates among children since then,4,6 as well as a low incidence rate of measles in australia with no endemic genotypes of the virus found in australia since the early 1990s.4,7 however, measles cases acquired overseas are still detected in australia which occasionally results in small outbreaks with ongoing transmission occurring in under-immunized populations. a large measles outbreak began in april 2012, with the index case being a 25-year-old male traveller from thailand. during the next eight months, a further 167 cases were identified in the australian state of new south wales (nsw), constituting the largest measles outbreak in australia since 1997 and illustrating the challenges in maintaining australia’s measles elimination status. we report on the characteristics of this outbreak. methods under the nsw public health act 2010,8 patients with measles must be notified to the local public health unit by doctors and laboratories. nsw is divided into eight local health districts with each district containing a public health unit. local health districts are subdivided into local government areas (lgas) and further subdivided into suburbs. all confirmed cases, as defined in the australian national guidelines,9 with a symptom onset between 7 april and 29 november 2012, an epidemiological link to south western sydney or western sydney local health districts, no history of overseas travel and a laboratory specimen that was of either unknown or d8 genotype were considered part of the outbreak. clinical specimens from measles cases occurring in this period with no clear epidemiological link to outbreak cases underwent genotyping at a reference laboratory. routine case investigation and the public health response followed the australian national guidelines.9 where possible, vaccination status was validated on the australian childhood immunization register (acir) established in 1996 to record immunizations administered to children under the age of seven. acir is considered to be a reliable record of all immunizations received in australia by australian residents currently aged 16 and under. contacts of cases were assessed for timely post-exposure prophylaxis, either mmr or human normal immunoglobulin, as indicated. data were analysed using microsoft excel 2010 and epi infotm 7. age-specific notification rates were calculated using 2012 mid-year nsw population data from the australian bureau of statistics. crude notification rates for aboriginal and/or torres strait islander people and people of samoan ancestry were calculated using nsw population data obtained in the 2011 national census. data on mmr vaccination coverage by postcode and lga were obtained from the nsw ministry of health. mapping of cases was performed using arcgis 10.1. results temporal and geographic distribution between april and november 2012, over a period of 36 weeks, 168 confirmed cases of measles occurred in nsw (figure 1) – the majority (n = 126, 75.0%) in south western sydney local health district (figure 2). western sydney local health district had the next highest number of cases (n = 30, 17.9%), with the remaining cases distributed among several other districts. figure 1. number of measles cases by outbreak week and pacific islander status by symptom onset date, new south wales, australia, april to november 2012 (n = 168) click to download figure 1. jpg, 286kb figure 2. measles cases by residence, new south wales, australia, april to november 2012 (n = 168) click to download figure 2. jpg, 461kb dots represent residential location of each case. lgas with the highest notification rates were campbelltown, camden and liverpool (table 1), all located in south western sydney local health district. the suburb of claymore, located within campbelltown lga, had a particularly high notification rate (table 1). table 1. measles case notification rates and immunization coverage rates with mmr1 and mmr2 in 2012 in local government areas in new south wales with greater than 10 outbreak cases, april to november 2012 click to download table 1. jpg, 380kb mmr – measles-mumps-rubella case characteristics approximately half the cases were male (n = 87, 51.8%), with the age ranging from four months to 61 years and a median age of 14 years (figure 3). measles case notification rates were highest in the less-than-one-year age group (n = 36, 37.3 per 100 000 population) followed by 15–19-year-olds (n = 29, 6.2 per 100 000 population), oneto four-year-olds (n = 19, 5.0 per 100 000 population) and 10–14-year-olds (n = 20, 4.5 per 100 000 population). among children aged less than one year (n = 36), 28% were aged less than nine months (n = 10). figure 3. number of measles cases by age group, new south wales, april to november 2012 (n = 168) click to download figure 3. jpg, 131kb of the 168 cases, 12 (7.1%; 5.8 per 100 000 population) were identified as being aboriginal and/or torres strait islander people. thirty-six cases (21.4%) were of pacific islander descent with 29 samoan (17.3%; 188.7 per 100 000 population). the pacific islander cases were particularly overrepresented in the first half of the outbreak, with all but two occurring before week 23 (figure 1). they also comprised 29% (n =14) of the 10–19-year-old age group. clinical course of illness the most common symptoms recorded were rash (n = 168, 100%), fever (n = 165, 98.2%), cough (n = 158, 94.0%), coryza (n = 143, 85.1%) and conjunctivitis (n = 101, 60.1%). koplik’s spots were identified in 43 cases (25.6%), with other symptoms including lethargy, malaise, vomiting, sore throat and headache. most cases (n = 130, 77.4%) had fever at the time of rash onset. forty-nine cases (29.2%) were hospitalized; seven (4.2%) developed complications – five developed bronchiolitis, one pneumonia and one pregnant case miscarried at eight weeks during the prodrome of her measles illness. there were no reported cases of encephalitis and no deaths. laboratory diagnosis most cases (n =157, 93.5%) were laboratory-confirmed with the remaining 11 cases (6.5%) confirmed based on clinical and epidemiological evidence. of the 148 cases with available laboratory test results, most were confirmed through serological assay for measles virus-specific igm antibodies (n =123), followed by antigen detection on a respiratory specimen by immunofluorescence (n =51) and nucleic acid testing on a respiratory or urine sample (n =43). negative test results were not reported to public health units. genotyping identified measles virus genotype d8 in 55 outbreak cases and genotype b3 in one case that was excluded from the outbreak. vaccination forty cases (23.8%) reported a vaccination history of at least one dose of mmr. of the 22 that were eligible for inclusion on acir, only seven were located on acir; three of the seven cases had received two doses of mmr vaccine. for the remaining 33 cases with no records on acir, only one provided alternate documentation of immunization status; the remaining 32 were based on self-report (six reported receiving two doses of mmr vaccine). most of the 128 cases that were not sure or reported no history of vaccination were aged more than one year (n= 95) and therefore were not vaccinated appropriately for their age. for the 52 cases that provided a reason for this non-vaccination, the most common reasons included being a vaccine refuser (n =32), forgetting to get vaccinated (n =5) or being born overseas (n =3). in 2012, the five lgas with more than 10 outbreak cases (table 1) had immunization coverage of at least 93% for the first dose of mmr vaccine and at least 91% for the second dose. the same was found by suburb, with the exception of claymore in campbelltown lga which had coverage of 88.2% for the second dose of mmr. health service presentations there were 355 separate health service presentations by the 168 cases; 197 (55.5%) presented to general practitioners and 158 (44.5%) to emergency departments. in 80 emergency department (50.6%) and 33 general practitioner (16.8%) visits, isolation procedures were adopted, and no contact follow-up was required. there were 16 instances of transmission occurring in the waiting rooms of general practices and emergency departments, and in hospital wards, resulting in 36 secondary cases (21.4% of all cases). public health response case and contact follow-up a total of 4786 contacts of cases not correctly isolated in waiting rooms of emergency departments and general practitioners were contacted by telephone and letter. of these, 621 were advised to have mmr vaccine and 442 to have normal human immunoglobulin as post-exposure prophylaxis. an additional 415 personal contacts of cases were identified for follow-up; 80 were advised to have mmr vaccine and 85 to have normal human immunoglobulin. the volume of cases and large number of susceptible contacts identified required additional staffing within some public health units, and in south western sydney local health district public health unit an incident command system structure was adopted. in addition, the nsw health computer assisted telephone interviewing service was engaged to assist with contact follow-up. prevention measures multiple methods of communicating with both health practitioners and the community were used. alerts were sent to general practitioners and emergency departments, local public health units placed posters in areas believed to see a high volume of people within the most affected communities and multiple media releases were broadcast. mmr vaccination clinics were established in seven high schools that either had confirmed cases or high enrolments of students of pacific islander descent. a community vaccination clinic was also established in a local club. in addition, samoan churches were visited by public health staff and community leaders, and educational materials about measles were distributed in both english and samoan. discussion despite high vaccination coverage and timely public health control measures, this measles outbreak continued for 35 weeks. in australia, unvaccinated young adults have been linked to outbreaks and pose a particular risk because of their mobility, high contact rates and the increasing ease of overseas travel.10 the d8 genotype in this outbreak is known to be circulating in thailand and has been exported to australia and europe previously.11,12 key features of this outbreak were the disproportionately high notification rates in people of pacific island descent and teenagers. other notable features included the number of infants affected and nosocomial transmission in health-care settings. in the era of measles elimination, under-immunized minority groups are a major component of measles epidemiology; however, interventions to increase immunity in these groups remain a challenge.13–15 in australia, pacific islanders are a high-risk group for ongoing transmission of measles,16 as shown in this outbreak, where people of pacific island, particularly samoan descent, were overrepresented. in 2006, there were approximately 100 000 pacific islanders living in australia, predominantly in sydney, melbourne and brisbane.17 this figure, however, is likely to be an underestimate as many pacific islanders arrive via new zealand, with which australia has special mutual migration arrangements whereby citizens can visit, live and work in either country.18 in the 2011 national census, campbelltown lga had a population of 145 967 with 2.1% reporting speaking samoan in their households;19 in claymore, within campbelltown lga, this was 13.0% of the 3308 population, one of the highest proportions in nsw.20 official immunization data by ethnicity are not available, but staff that conducted the mmr clinics in high schools during the outbreak reported that many students of pacific islander background appeared to have missed routine childhood vaccinations both before and after their arrival in australia. the three lgas with the highest notification rates in 2012, campbelltown, camden and liverpool, also had higher vaccination coverage rates than the nsw average. this suggests that high coverage rates at the lga level may not represent complete coverage within the lga, as there may be pockets of under-immunized populations in these areas, as evidenced by the lower vaccine coverage in claymore. therefore, as well as ensuring childhood vaccination targets of 95% for the first dose and 90% for the second dose,21 geographically targeted strategies towards susceptible minority groups are also required to increase overall measles immunity. there was also a high number of cases aged between 10 and 19 years in this outbreak – a group that should have received routine childhood vaccinations. a measles outbreak in england in 2012 showed a similar pattern, attributed to the dramatic fall in mmr vaccinations in the united kingdom in the late 1990s following a link made between the mmr vaccine and autism, which was subsequently discredited.22 however, this does not explain the high number of cases in this age group in this outbreak, as according to acir data, australia did not suffer the same decline in mmr coverage at that time.23 as acir data were not consistently reported until the late 1990s,24 historical immunization coverage of teenagers (aged 14 and over in 2012) is not available. also, the immunization status of children who migrate to australia is not captured by acir, especially those over the age of four who have missed all routinely scheduled immunizations. these factors may partially explain why this potentially susceptible group that should have received routine childhood vaccinations may have been undetected before the outbreak. despite this, that over two thirds of cases in this age group were born in australia and should have received two doses of mmr vaccine as part of routine childhood immunizations introduced in 1998 is a concern. two other age groups at high risk of measles infection25 were also overrepresented in this outbreak – infants and adults aged 30–34. infants aged less than 12 months are too young to have been vaccinated. that a significant proportion of this group were aged less than nine months suggests earlier waning natural protection offered by maternal antibodies than previously thought.26 adults aged 30–34 years grew up in a period when measles was not endemic in australia, but due to their age, they may have missed out on the 1998 vaccination programme and measles control campaign. nosocomial transmission in health-care settings formed a significant component of the outbreak burden, also seen in previous outbreaks,27 as these settings are ideal for transmission of measles due to their closed spaces and susceptible occupants.28 the large number of multiple presentations by cases to health-care facilities contributed to nosocomial transmission, as did the lack of isolation of cases presenting with a fever and rash, despite significant communication between public health authorities and clinical services. a high turnover of staff and the nature of shift work in emergency departments where staff were not always present to access the communications from public health authorities, as well as a lack of diagnostic experience among younger clinicians who often had never seen a case of measles, may explain these oversights. there are some limitations to this outbreak investigation. small surveillance gaps between generations of cases illustrated that not all cases of measles were being identified. reporting of negative test results are not required in the established surveillance system, and cases that were initially notified but later discarded due to incomplete or poor-quality laboratory test results made it difficult to draw conclusions about the effectiveness of the surveillance system. data quality was at times incomplete, including for ethnicity status and whether a contact received their recommended intervention. cases were not followed up after initial interview and contact tracing; information about complications from measles was also incomplete and may underestimate the true burden of disease. the sensitive case definition used may have included cases not truly part of the outbreak; however, this number is likely to be small as all cases with no clear epidemiological links underwent genotyping with only one non-d8 case identified. this outbreak, although the largest in australia since 1997, was relatively modest in size, limited in geographical spread and of moderate duration compared with other recent outbreaks from industrialized countries throughout europe.29 however, its duration is cause for concern, particularly as recent modelling suggests that based on declining measles seropositivity, the effective reproductive number (r) may exceed one in australia in the next few years.30 australia’s measles elimination status was not affected by this outbreak; however, the circulation of a single measles virus genotype for 35 weeks highlights the need to maintain vigilant surveillance systems for early detection and containment of measles cases and to maintain high population immunity to measles. this outbreak also highlighted susceptibility of measles in pacific islanders living in australia and that young travellers can cause measles outbreaks in non-endemic countries; a vaccination programmme targeting these at-risk groups needs to be implemented in conjunction with the routine childhood immunization programme, to which no change is required. conflicts of interest none declared. funding none. references: moss wj, griffin de. measles. lancet, 2012, 379:153–164. doi:10.1016/s0140-6736(10)62352-5 pmid:21855993 national centre for immunisation research & surveillance. immunisation schedules. sydney, university of sydney, 2000 (updated 18 june 2012). available from: http://www.ncirs.edu.au/immunisation/schedules/ [accessed 30 august 2013]. australian technical advisory group on immunisation. the australian immunization handbook. 10th ed. canberra, australian government department of health and ageing, 2013. heywood ae et al. elimination of endemic measles transmission in australia. bulletin of the world health organization, 2009, 87:64–71. doi:10.2471/blt.07.046375 pmid:19197406 centers for disease control and prevention (cdc). progress toward the 2012 measles elimination goal–western pacific region, 1990–2008. morbidity and mortality weekly report, 2009, 58:669–673. pmid:19553903 national centre for immunisation research & surveillance. coverage estimates. sydney, university of sydney, 2002 (updated 18 july 2013). available from: http://www.ncirs.edu.au/immunisation/coverage/estimates/index.php [accessed 30 august 2013]. rosewell a, reinten-reynolds t, spokes pj. epireview: measles in nsw, 2002–2011. new south wales public health bulletin, 2012, 23:201–207. doi:10.1071/nb12085 pmid:23442997 public health act 2010 (new south wales), schedule 1. canberra, ministry of health, 2012. available from: http://www.legislation.nsw.gov.au/maintop/view/ inforce/act+127+2010+cd+0+nhttp://www.legislation.nsw.gov.au/maintop/ view/inforce/act+127+2010+cd+0+n [accessed 30 august 2013]. measles. national guidelines for public health units. canberra, australian government, department of health, 2009 (updated 19 february 2009). available from: http://www.health.gov.au/internet/main/publishing.nsf/content/cdna-song-measles.htm [accessed 7 november 2013]. martin n, foxwell ar. measles status in australia, and outbreaks in the first quarter of 2009. communicable diseases intelligence, 2009, 33:225–231. pmid:19877543 rota pa et al. global distribution of measles genotypes and measles molecular epidemiology. the journal of infectious diseases, 2011, 204 suppl 1:s514–523. doi:10.1093/infdis/jir118 pmid:21666208 kantele a et al. travellers returning with measles from thailand to finland, april 2012: infection control measures. euro surveillance: european communicable disease bulletin, 2012, 17(22):pii=20184. pmid:22687913 mayoral cortés jm et al. measles outbreak in andalusia, spain, january to august 2011. euro surveillance: european communicable disease bulletin, 2012, 17(42):pii=20300. pmid:23098824 cohuet s et al. outbreak of measles among irish travellers in england, march to may 2007. euro surveillance: european communicable disease bulletin, 2007, 12(24):pii=3216. available from: http://www.eurosurveillance.org/viewarticle.aspx?articleid=3216 [accessed 30 august 2013]. review of outbreaks and barriers to mmr vaccination coverage among hard-to-reach populations in europe. stockholm, european centre for disease prevention and control, 2013. forrest jm et al. measles control in australia. report of the measles control in australia workshop, 5 november 1997. communicable diseases intelligence, 1998, 22:33–36. pmid:9557386 rose s, quanchi m, moore c. a national strategy for the study of the pacific. brisbane, australian association for the advancement of pacific studies, 2009. available from: http://www.uq.edu.au/hprc/docs/aaaps%20national%20 report%20cover%202009_prof.moore.pdf [accessed 30 august 2013]. ball r, beacroft l, lindley j. australia’s pacific seasonal worker climate scheme. trends & issues in crime and criminal justice. canberra, australian institute of criminology, 2011, 432. available from: http://www.aic.gov.au/documents/e/0/ c/%7be0c1eeb4-b893-489e-98f3-8ff9baf3e8c9%7dtandi432.pdf [accessed 30 august 2013]. 2011 census quickstats, campbelltown. canberra, australian bureau of statistics, 2011 (updated 28 march 2013). available from: http://www.censusdata.abs.gov.au/ census_services/getproduct/census/2011/quickstat/lga11500 [accessed 30 august 2013]. 2011 census quickstats, claymore. canberra, australian bureau of statistics 2011 (updated 28 march 2013). available from: http://www.censusdata.abs.gov.au/ census_services/getproduct/census/2011/quickstat/ssc10536 [accessed 30 august 2013]. let’s work together to beat measles: a report on australia’s measles control campaign. canberra, commonwealth department of health and aged care, 2000. vivancos r et al. an ongoing large outbreak of measles in merseyside, england, january to june 2012. euro surveillance: european communicable disease bulletin, 2012, 17(29):pii=20226. pmid:22835470 leask j, booy r, mcintyre pb. mmr, wakefield and the lancet: what can we learn? the medical journal of australia, 2010, 193:5–7. pmid:20618105 conaty sj, mcanulty jm. the australian childhood immunisation register: validation of the immunisation status of children who are very overdue. australian and new zealand journal of public health, 2001, 25:138–140. doi:10.1111/j.1753-6405.2001.tb01835.x pmid:11357909 gidding hf, gilbert gl. measles immunity in young australian adults. communicable diseases intelligence, 2001, 25:133–136. pmid:11596715 leuridan e, hens n, hutse v, leven m, aerts m, van damme p. early waning of maternal measles antibodies in era of measles elimination: longitudinal study. british medical journal, 2010, 340(7756):1123. hope k et al. measles transmission in health-care waiting rooms: implications for public health response. western pacific surveillance and response journal, 2012, 3:33–38. doi:10.5365/wpsar.2012.3.3.009 pmid:23908937 botelho-nevers e et al. nosocomial transmission of measles: an updated review. vaccine, 2012, 30:3996–4001. doi:10.1016/j.vaccine.2012.04.023 pmid:22521843 cottrell s, roberts rj. measles outbreak in europe. bmj (clinical research ed.), 2011, 342:d3724. doi:10.1136/bmj.d3724 pmid:21677008 wood j et al. declining measles seropositivity in australia and elimination status. paper presented at: the communicable disease control conference; 19-20 mar 2013. canberra, 2013. available from: https://secure.ashm.org.au/ei/viewpdf.esp?id=112&file=c%3a%5ccertain%5ceventwin%5cdocs%5cpdf%5ccdcasid final00279%2epdf [accessed 30 august 2013]. can you help me write my story? the institutional affiliations of authors of international journal articles on post-disaster health response brief report allison gocotano,a megan counahan,a vicente belizario,b kenneth hartigan-go,c gloria balboa,d marilyn go,d manuel dayrite and julie lyn halla a office of the who representative in the philippines, sta cruz, manila, philippines. b office for technical services, department of health, sta cruz, manila, philippines. c office for health regulation, department of health, sta cruz, manila, philippines. d health emergency management bureau, department of health, sta cruz, manila, philippines. e ateneo school of medicine and public health, pasig city, philippines. correspondence to allison gocotano (email: gocotanoa@ who.int or allisongocotano@gmail.com). to cite this article: gocotano a et al. can you help me write my story? the institutional affiliations of authors of international journal articles on post-disaster health response. western pacific surveillance and response journal, 2015, 6(suppl 1):10–14. doi:10.5365/wpsar.2015.6.3.hyn_019 public health policies are, in part, shaped by evidence from peer-reviewed journals. traditionally these papers have been predominantly written by practitioners with academic affiliations or field-based colleagues wanting to share lessons learnt, including those following disease outbreaks, emergencies or disasters. typhoon haiyan left a corridor of destruction across the philippines that affected the lives of 16 million people, devastated a health system and challenged every sector of the country.1 the destruction was unprecedented even for one of the world’s most disaster-prone countries. immediately following haiyan, the world health organization (who) representative office in the philippines, together with the philippine department of health (doh), co-led the health response. doh and who philippines coordinated more than 150 foreign medical teams2 and more than 500 tonnes of medical supplies and equipment as part of the response. many lessons were learnt from this experience. eighteen months after haiyan, who representative office in the philippines wanted to document some of those lessons and initiated a compendium of papers with the doh and local government health offices. when conducting literature searches for this process we found many papers were being written by academics, practitioners and responders who were external to the affected country and commonly with little or no involvement of academics, practitioners and responders inside the affected country. a previous study of published articles related to the 15 largest disasters (by number of deaths) over the last decade found that while almost all the disasters occurred in non-organization for economic cooperation and development (oecd) countries, more than 58% of related publications were led by authors from oecd countries.3 the objective of this paper was to investigate who had published papers about emergencies and disasters (events) in the last five years. this was not intended to be a full systematic review, rather an assessment of the location of authors of papers published on these events. methods we used the annual disaster statistical review from the centre for research on the epidemiology of disasters to determine the top 10 events per year, based on the number of deaths, from 2009 to 2013 (table 1).4–8 the countries in which the events took place were classified according to their gross domestic product (gdp) as one of the following: low or low-middle (low) or upper-middle or high (high) income countries.9 between 15 and 18 may 2015, we conducted a pubmed search using standardized search parameters for health-related peer-reviewed papers published about these events. the search strategy was intended to cover the three humanitarian clusters that form the health response to an event: health (including mental health), nutrition and water, and sanitation and hygiene.10 the search terms were “event type” (e.g. typhoon) and “country” (e.g. philippines) and “year of disaster” (e.g. 2002) and (medical or surgical or disease or outbreak or health or nutrition or mental or psychosocial or sanitation or hygiene or drink or drinking). for weather disturbances such as tropical depressions and cyclones the “event type” was converted into a nested search strategy to include the “international name” (e.g. haiyan) or “local name” (e.g. yolanda) or “meteorological term” (e.g. tropical cyclone). the search results were refined and only those publications written within three years of the event were included. each article was reviewed to ensure it was written post-event. institutional affiliations for all authors were classified as being internal or external to the affected country based on the location of their affiliation. we separated lead author and coauthors; authors affiliated with institutions and/or organizations with both internal and external locations to the affected country were classified as internal. when we could not determine an author’s affiliation we classified it as unknown. when authorship was collective (e.g. centers for disease control and prevention) we classified it as external. affiliation to international organizations including united nations agencies was also classified as external since we could not determine whether a specific united nations agency was at the country, regional or global level. it also was not possible to determine if a specific author was a national or an international staff. assessing the degree of involvement of these institutions in the response was not considered in this classification. results there were no publications for 17 of the 50 events (table 1); all but three of these (one each for the russian federation, peru and china) were from low-income countries. there were 834 articles published about the other 33 events across 19 countries by 3991 authors. there were 466 papers from 19 events in high-income and 368 papers from 14 events in low-income countries. overall, there was an average of 25 papers per event, ranging from one for the 2013 united kingdom heat wave to 297 for the 2010 haiti earthquake. table 1. top 10 emergencies or disasters (events) per year, based on the number of fatalities, 2009 to 2013,3–7 click to download table 1. jpg, 862kb * these events had no publications. the affiliations of lead and corresponding authors were more often internal when the country affected was a high-income country, whereas in low-income countries there were more external authors. this remained when we looked separately at lead/corresponding author and when we included coauthors (table 2). table 2. author classification and average publication by affected country and per capita gdp, top 10 emergencies or disasters (events) per year, 2009 to 2013 click to download table 2. jpg, 658kb * of the two events in japan, one generated just one article, while the other had 235 articles. † 17 events had no publications. gdp, gross domestic product; and n/a, not applicable. while more events with high mortality were associated with low-income countries when compared with high-income (87 208 cumulative deaths in highvs 243 334 in low-income countries) there were fewer publications for the events in low-income countries. the magnitude of the disaster appeared to influence the number and type of papers published. those events which had a large humanitarian response resulted in more papers than those managed from the resources within the affected country. the 2010 haiti earthquake is one such example. there was a considerable international humanitarian presence for the earthquake and 276 publications; the secondary cholera outbreak had 21 publications. discussion our study found that most articles on events in low-income countries published in peer-reviewed journals were most commonly written by authors with institutional affiliations external to the country of the event. we also found fewer papers were written about events in low-income countries when compared to high-income countries. this highlights the need for establishing institutional links for capacity and institutional development for scientific writing in low-income countries. to build capacity in scientific writing to facilitate the publication of the lessons learnt from haiyan, we partnered with the western pacific surveillance and response journal (wpsar) that offers pre-submission support for first-time authors. this included a five-day workshop on scientific writing with follow-up support for each paper individually. wpsar then published these articles in this issue. this enabled authors within the philippines to learn how to write scientific papers and to provide a local perspective for their publications. lessons from a highly resourced country on how they responded to an event may not be as helpful to a country with fewer resources as those from a low-income country. we assume that having a better understanding of the context, whether you are an internal or external actor, will likely improve outcomes. post-event researchers, particularly those reporting from lower-income countries who are external to the affected country, should be strongly encouraged to form proactive collaborations with local researchers. we acknowledge that there are some limitations in our study. publications in journals not indexed in pubmed were not included in our study. we also did not search other databases or the wider grey literature. however, as one of the key purposes of publication is for the international community to learn, a non-index journal makes learning from colleagues’ experiences more difficult. we accept that the results of this study could also be due to several influencing factors. high-income countries are better resourced and are likely to have more institutions capable, interested and resourced to respond and then publish their findings than low-income countries with fewer resources. institutional incentives to publish, availability of research funding, capability and specific topic or policy interests are all contributing factors. however, there is an ethical, developmental and academic argument for external authors to be more inclusive of internal authors provided that internal institutions are willing to put in the necessary effort required for authorship. it is also likely that events from high-income countries are managed internally hence generating more internal publications. the degree of investment from high-income countries to support response efforts in low-income country events may also influence authorship affiliation. while gdp will influence available resources, the difference between the number of papers resulting from major events in lowand high-income countries can be possibly explained by other factors. for events in low-income countries – external international support is time-limited and teams leaving the country have to report on their inputs to the government and other donors. this period of reflection and reporting lends itself to publication often done more easily outside the affected country which means those inside the country cannot contribute as easily. internal players, including those in government, continue responding beyond the initial relief effort through the different phases of the response (recovery, development etc.) and the reflection process may not be prioritized or conducted at all. our initial observation tells us that most authors of post-disaster articles were external to the affected country if the disaster was in a low-income country. increased collaboration between internal and external authors is warranted as are other mechanisms to build capacity in scientific writing, such as collaboration with a peer-reviewed journal. sharing experiences and lessons learnt are ideally communicated through a collection of views to provide a balanced and more rigorous contribution to the international body of research. conflicts of interest none declared. funding none. acknowledgements this paper was reviewed by dean jikyeong kang of the asian institute of management and dean romeo quizon of the university of the philippines college of public health. the authors acknowledged their support to the key message on increased collaboration between internal and externally affiliated health-related researchers, particularly in a low-income country post-disaster setting for international journal publication. references mcpherson, counahan m, hall jl. responding to typhoon haiyan in the philippines. western pacific surveillance and response journal, 2015, 6(supp 1):1–4. doi:10.5365/wpsar.2015.6.4.hyn_026 peiris s, buenaventura j, zagaria n. is registration of foreign medical teams needed for disaster response? findings from the response to typhoon haiyan. western pacific surveillance and response journal, 2015, 6(supp 1):29–33. doi:10.5365/wpsar.2015.6.2.hyn_014 gaillard jc, gomez c. post-disaster research: is there gold worth the rush? jàmbá: journal of disaster risk studies, 2015, 7:6. vos f et al. annual disaster statistical review 2009: the numbers and trends. brussels, centre for epidemiology of disasters, 2010. guha-sapir d et al. annual disaster statistical review 2010: the numbers and trends. brussels, centre for epidemiology of disasters, 2011. guha-sapir d et al. annual disaster statistical review 2011: the numbers and trends. brussels, centre for epidemiology of disasters, 2012. guha-sapir d, hoyois p, below r. annual disaster statistical review 2012: the numbers and trends. brussels, centre for epidemiology of disasters, 2013. guha-sapir d, hoyois p, below r. annual disaster statistical review 2013: the numbers and trends. brussels, centre for epidemiology of disasters, 2014. national accounts main aggregates database: december 2013, (select all countries, “gdp, per capita gdp us dollars”, and 2013 to generate table). new york, united nations statistics division, 2013. available from: http://unstats.un.org/ unsd/snaama/selcountry.asp [accessed 27 august 2015]. humanitarian response. new york, united nations office for the coordination of humanitarian affairs, 2015. available from: https://www.humanitarianresponse.info/clusters [accessed 27 august 2015]. an assessment of the case notification system 16 months after typhoon haiyan in region 8, the philippines field investigation report flor d’ lyn gallardo,a vikki carr de los reyes,a ma nemia sucaldito,a lilia ligon-imperio,a johnette peñas,a niño rebatoa and enrique tayaga a epidemiology bureau, department of health, sta cruz, manila, philippines. correspondence to flor d’ lyn gallardo (email: peachiegallardo@gmail.com). to cite this article: gallardo fdl et al. an assessment of the case notification system 16 months after typhoon haiyan, region 8, the philippines. western pacific surveillance and response journal, 2015, 6(suppl 1):71–75. doi:10.5365/wpsar.2015.6.2.hyn_002 abstract introduction: the philippines department of health uses the philippine integrated disease surveillance and response (pidsr) system to monitor 25 diseases and syndromes that have the potential to cause outbreaks. the focus of this system is to strengthen the capacity of local government units for early detection and response to outbreaks. after typhoon haiyan, routine disease surveillance activities were suspended at the epidemiology and surveillance units (esus) at the city and provincial levels, as well as laboratory services; surveillance resumed as soon as local conditions allowed. method: we conducted an assessment of pidsr in march 2015, 16 months post-haiyan, in region 8, the most heavily affected region. we used key informant interviews and a review of data from the system to assess the core surveillance and support functions. results: all esus reported they were performing all surveillance core functions, although laboratory confirmation needed to be strengthened at the regional reference laboratory. access to working communication equipment also needed improvement as did timeliness and completeness of reporting. discussion: assessment of surveillance activities, resources and quality should be conducted post-disaster. the strength and operations of the disease surveillance system usually requires support from the local, regional and national governments, especially if there are legal mandates and legislation that includes the system in disaster planning. regular monitoring of the system is recommended to ensure stability, system development, increased outbreak detection and fewer morbidities and fatalities. introduction disasters challenge the capacity of surveillance systems in a variety of ways, including damage to communication infrastructure, closure of health-care facilities, unavailability of surveillance staff, loss of laboratory facilities and distractions by other prioritized response activities. re-establishing disease surveillance and response capacity is an important priority post-disaster.1 in a post-disaster setting, analysis of the role of routine health information systems has been limited.2 the philippine integrated disease surveillance and response (pidsr) system is a nationwide disease surveillance and response system.3 the system monitors 25 diseases and syndromes that have the potential to cause an outbreak and that warrant an immediate response. an outbreak is suspected when there is unexpected clustering of cases in an area within a period of time or the number of cases reported exceeds the expected threshold. the diseases reported to pidsr are categorized as either category 1 for immediate reporting (within 24 hours) or category 2 for weekly reporting. category 1 diseases are reported using case investigation forms that are disease specific and require immediate notification from city/hospital to province to regional level. category 2 diseases are all reported on case report forms to a regional epidemiology and surveillance unit (resu) every friday. these forms are usually transmitted through email as metadata. if an internet connection is not available, hard copies are sent through the mail or hand delivered to resu for data entry. feedback from resu should be done every week, but often it is summarized and reported monthly. region 8, the region most affected by haiyan, is composed of six provinces and eight cities with a population of 4 million. they adopted the pidrs system in 2007 with epidemiology and surveillance units (esus) at the provincial and city levels and sentinel hospitals serving as reporting units.4 in this study, we conducted an assessment of selected esus in region 8 on core surveillance and support functions 16 months post-haiyan. using dengue as the representative disease, surveillance indicators such as timeliness and reporting rates in selected esus were also assessed for system performance. methods a descriptive study using key informant interviews and records review was conducted to gather information on pidsr operations 16 months after typhoon haiyan. the study focused on the support functions of the system – health workforce, communication equipment, access to internet, availability of pidsr forms and laboratory logistics. the six core surveillance functions based on who guidelines were assessed: case detection, case registration, reporting, confirmation, analysis and feedback.5 timeliness and reporting rate were also assessed using data obtained from january to february 2015 as per the centers for disease control and prevention guidelines for evaluating public health surveillance systems.6 seven esus and two sentinel hospitals (9 of 14 [64%]) from region 8 were selected for this assessment. the esus comprised the resu, four provincial esus (pesus) and two city esus (cesus). face-to-face interviews using a guided questionnaire were conducted among surveillance staff, the head of the resu, the chief of hospital (n = 1) and the director of pesus (n = 3). interviewees were asked to comment on the present status of pidsr support functions. pidsr metadata were obtained from six reporting units to determine case detection and the timeliness of data entry post-haiyan. these were pesus from biliran, eastern samar, western samar and leyte and disease reporting units from the eastern visayas regional medical center (evrmc) and leyte provincial hospital. dengue notification reports from 1 january to 28 february 2015 were obtained. dengue was chosen as the representative disease as vector-borne diseases remain a perennial problem in the area, and cases were expected to increase after haiyan.7 timeliness was defined as the number of weekly reports received by the resu from each pesu and cesu divided by eight (the total number of expected reports for the eight-week period of study). the reporting rate was defined as the number of dengue files received at resu from the esus divided by the total number of disease reporting units that regularly submit weekly reports. the target for both surveillance functional indicators was above 80%. results surveillance support functions at the time of the study, 16 months post-hiayan, all seven esus and the two hospitals had diseases surveillance officers and most (8/9, 89%) had adequate information technology equipment for data management. however, seven (78%) did not have printers for report generation, seven (78%) reported having unstable and limited internet access and eight (89%) reported that sending and receiving surveillance reports was challenging. all esus and hospitals had pidsr forms available (table 1). table 1. support functions of esus and sentinel hospitals, 16 months post-haiyan in region 8, the philippines, march 2015 (n = 9) click to download table 1. jpg, 429kb legend: blue, available; red, not available. cesu, city epidemiology and surveillance unit; esu, epidemiology and surveillance unit; pesu, provincial epidemiology and surveillance unit; and resu, regional epidemiology and surveillance unit. of the two hospital laboratories, one could do bacterial culture and hepatitis a igm by elisa detection (table 1). surveillance core functions all reporting units were able to conduct case detection activities. one cesu and one hospital reporting unit were unable to do data entry from case forms due to other health service delivery tasks and rapid changes of health services delivery roles. data entry was done by resu staff for these reporting units. data transmission from the pesus to the resu varied 16 months post-haiyan: case report forms from one pesu were hand-delivered, two were sent by email and one actively collected by resu staff. the earliest data entry post-haiyan was on 15 november 2013 at the resu. this was seven days post-disaster; case registration resumed after one to 10 weeks at the provincial and city levels (table 2). table 2. core functions of the case notification system by esus and sentinel hospitals, 16 months post-haiyan in region 8, the philippines, march 2015 (n = 9) click to download table 2. jpg, 458kb legend: blue, available; red, not available. cesu, city epidemiology and surveillance unit; esu, epidemiology and surveillance unit; and pesu, provincial epidemiology and surveillance unit; and resu, regional epidemiology and surveillance unit. resus did the routine analysis and dissemination of data to stakeholders through written or verbal feedback. no outbreaks were detected in these analyses and feedback. timeliness and reporting rate for the eight-week reporting period in january and february 2015, none of the four pesus or two cesus met the target of 80% for timeliness and reporting for dengue notifications; timeliness ranged from 13% to 63% and reporting from 2% to 50% (table 3). table 3. timeliness and reporting rate of esus in region 8, the philippines, 1 january 2015 to 28 february 2015 (n = 6) click to download table 3. jpg, 383kb cesu, city epidemiology and surveillance unit; esu, epidemiology and surveillance unit; and pesu, provincial epidemiology and surveillance unit. discussion this study shows that the re-establishment of pidsr in region 8 was slow after typhoon haiyan. reasons for this included the massive destruction to health infrastructures, loss of human lives and resources, lack of electricity, impassable roads, non-functional telecommunication systems and severely damaged data management equipment. also, as in the great japan earthquake,8 many health workers were victims themselves and were unable to deliver health services. directly after haiyan, there were many difficulties in collecting vital health data and data for disease surveillance, thus monitoring disease trends became impossible. the esus reported resuming surveillance activities one to 10 weeks post-haiyan. although this assessment showed that surveillance core functions were routinely being conducted, there was poor quality on timeliness and reporting rates observed in the surveillance reports submitted by esus. reporting rates for support core functions were also variable due to lack of equipment for report generation. better telecommunication and internet access would have resulted in improved report transmission. while case detection, case registration and reporting of disease surveillance activities were reported as being stable, the analysis and feedback component of the surveillance system needed to be strengthened. there also were no outbreaks detected through pidsr in the time between haiyan and this study. as pidsr is an indicator-based surveillance system, the detection of outbreaks requires stable reporting and monitoring of the number of cases against a threshold. thresholds are indicators of when the level of disease occurrence has been reached as an early warning for epidemics (alert threshold), and when the level of disease occurrence is above the expected range (outbreak threshold).9 as there was irregular reporting in the indicator-based surveillance system after haiyan, it was not surprising that no outbreaks were detected. there were outbreaks of measles, dengue and acute gastroenteritis reported through the philippines event-based surveillance and response system post-haiyan, suggesting that event-based surveillance might be more useful in the post-disaster setting. laboratory capacity was also limited in the study area 16 months post-haiyan, with only one hospital that could perform laboratory confirmation testing (e.g. bacterial culture). most samples were sent to the research institute for tropical medicine in manila for testing. additional health facilities that can conduct laboratory procedures or mobile laboratories would be useful for future response efforts as adequate surveillance relies on laboratory testing being available. enhancing laboratory capacity for disasters can be achieved through training more laboratory personnel and having surge capacity when disasters occur.10 this study had limitations. as it purposely selected those esus most affected by haiyan, the results are biased towards a non-functioning surveillance system and may not be representative of all cities and hospitals. also, surveillance functional indicators such as timeliness and reporting rate data pre-disaster were unavailable and therefore unable to be compared to our results. other limitations are that some of the results rely on self-reporting which may lead to bias, that a full evaluation of all components of the surveillance system was not included and that the sample size was small (only two cesus). conclusion in this post-haiyan assessment, the re-establishment of pidsr in region 8 was slow and hampered by the impact of haiyan. communications support was not optimal; staff, when available, had other competing tasks; laboratory testing was done in one hospital and the subnational reference laboratory and the timeliness of reporting and reporting rates for dengue were low. although case detection activities were being conducted in all reporting units, some data entry was being referred to resu staff. the operation of indicator-based surveillance systems, such as pidsr, greatly depends on the support of the local, regional and national governments coupled with legal mandates and legislations. based on this study, we recommend regular monitoring and evaluation of pidsr to determine specific surveillance activity gaps and to review surveillance functionality. this should occur routinely at the regional, provincial and city levels and also post-disaster to assess how the system has recovered. conflicts of interest none declared. funding none. acknowledgements we are grateful for the epidemiology bureau of the department of health (doh) for allowing us to conduct this study. the authors would also like to thank the regional ofice of the doh in region 8 particularly mr boyd roderick cerro, disease surveillance officers, pidsr coordinators and esu heads of eastern visayas for providing the information and data. we would also like to thank dr michael o’reilly and mr john bobbie roca for making this study possible. references united states center for disease control and prevention (cdc). rapid health response, assessment, and surveillance after a tsunami thailand, 2004–2005. mortality and morbidity weekly report, 2005, 54:61–64. aung e, whittaker m. preparing routine health information systems for immediate health responses to disasters. queensland, health information systems knowledge hub, 2010. available from: http://www.uq.edu.au/hishub/docs/wp12/hishub-wp12-full-13-web-24sept12.pdf [accessed 12 august 2015]. manual of procedures for the philippine integrated disease surveillance and response, third edition. manila, national epidemiology center, department of health, 2014. tante s et al. which surveillance systems were operational after typhoon haiyan? western pacific surveillance and response journal, 2015, 6(suppl 1):66–70. doi:10.5365/wpsar.2015.6.2.hyn_015 communicable disease surveillance and response system: guide to monitoring and evaluating. geneva, world health organization, 2006. available from: http://www.who.int/csr/resources/publications/surveillance/who_cds_ epr_lyo_2006_2.pdf [accessed 12 august 2015]. german rr et al.; guidelines working group centers for disease control and prevention (cdc). updated guidelines for evaluating public health surveillance systems: recommendations from the guidelines working group. morbidity and mortality weekly report – recommendations and reports, 2001, 50 rr-13:1–35, quiz ce1–7. pmid:18634202 aumentado c et al. the prevention and control of dengue after typhoon haiyan. western pacific surveillance and response journal, 2015, 6(suppl 1):60–65. doi:10.5365/wpsar.2015.6.3.hyn_018 arima et al. the great east japan earthquake: a need to plan for post-disaster surveillance in developed countries, western pacific surveillance and response journal, 2011, 2(4):3–6. doi:10.5365/wpsar.2011.2.4.007 pmid:23908893 administrative order no. 2007–0036: guidelines on the philippine integrated disease surveillance and response (pidsr) framework (1 october 2007). manila, department of health, 2007. available from: http://docslide.us/documents/ao-2007-0036-pidsrpdf.html [accessed 12 august 2015]. alert, response, and capacity building under the international health regulations (ihr): role of the laboratory in surveillance. geneva, world health organization, 2007. available from: http://www.who.int/ihr/lyon/surveillance/lab_surveillance/en/ [accessed 12 august 2015]. implementing hospital-based surveillance for severe acute respiratory infections caused by influenza and other respiratory pathogens in new zealand surveillance implementation q sue huang,a michael baker,b colin mcarthur,c sally roberts,c deborah williamson,acd cameron grant,d adrian trenholme,e conroy wong,e susan taylor,e lyndsay lecomte,e graham mackereth,a don bandaranayake,a tim wood,a ange bissielo,a ruth seeds,a nikki turner,d nevil pierse,b paul thomas,f richard webby,f diane gross,g jazmin duque,g mark thompsong and marc-alain widdowsong a institute of environmental science and research, wellington, new zealand. b university of otago, wellington, new zealand. c auckland district health board, auckland, new zealand. d university of auckland, auckland, new zealand. e counties manakau district health board, auckland, new zealand. f who collaborating centre, st jude children’s research hospital, memphis, united states of america g centers for disease control and prevention (cdc), atlanta, united states of america. correspondence to q sue huang (e-mail: sue.huang@esr.cri.nz). to cite this article: huang qs et al. implementing hospital-based surveillance for severe acute respiratory infections caused by influenza and other respiratory pathogens in new zealand. western pacific surveillance and response journal, 2014, 5(1). doi:10.5365/wpsar.2014.5.1.004 abstract background: recent experience with pandemic influenza a(h1n1)pdm09 highlighted the importance of global surveillance for severe respiratory disease to support pandemic preparedness and seasonal influenza control. improved surveillance in the southern hemisphere is needed to provide critical data on influenza epidemiology, disease burden, circulating strains and effectiveness of influenza prevention and control measures. hospital-based surveillance for severe acute respiratory infection (sari) cases was established in new zealand on 30 april 2012. the aims were to measure incidence, prevalence, risk factors, clinical spectrum and outcomes for sari and associated influenza and other respiratory pathogen cases as well as to understand influenza contribution to patients not meeting sari case definition. methods/design: all inpatients with suspected respiratory infections who were admitted overnight to the study hospitals were screened daily. if a patient met the world health organization’s sari case definition, a respiratory specimen was tested for influenza and other respiratory pathogens. a case report form captured demographics, history of presenting illness, co-morbidities, disease course and outcome and risk factors. these data were supplemented from electronic clinical records and other linked data sources. discussion: hospital-based sari surveillance has been implemented and is fully functioning in new zealand. active, prospective, continuous, hospital-based sari surveillance is useful in supporting pandemic preparedness for emerging influenza a(h7n9) virus infections and seasonal influenza prevention and control. background the 2009 influenza a(h1n1)pdm09 pandemic highlighted the need for disease surveillance to monitor severe respiratory disease to support pandemic preparedness as well as seasonal influenza prevention and control.1,2 information generated from this type of surveillance enhances our understanding of how epidemiology and etiology differ between countries and regions of the world. the accumulated data collected in a standard and consistent way will allow rapid assessment for each influenza season and future pandemics within and among countries.2 the 2009 pandemic and seasonal influenza epidemics demonstrated the importance of having an established real-time respiratory disease surveillance system in the southern hemisphere to inform the northern hemisphere countries about newly emerging pandemic or seasonal influenza.3,4 a surveillance system can provide critical data on the epidemiology, burden, impact, circulating influenza, other respiratory pathogens and effectiveness of influenza prevention and control measures at a time when similar data in the northern hemisphere are not available. new zealand is an excellent location for population-based research with its predominantly public funded health-care system. all new zealanders are assigned a unique identifier allowing tracking of health-care utilization over time and linkage to multiple databases. primary-care providers have highly computerized information systems and patient records with detailed demographic, risk factor and immunization information. the new zealand population is extremely well characterized regarding demographic structure, particularly by ethnicity and socioeconomic status. indigenous maori and pacific peoples (collectively about 20% of the population) are particularly vulnerable to influenza and other respiratory infection-related hospitalizations.3,5 in october 2011, led by the institute of environmental science and research (esr), a multicentre and multidisciplinary project – southern hemisphere influenza and vaccine effectiveness research and surveillance (shivers) – was established for a five-year period (2012–2016). this multiagency collaboration is between esr, auckland district health board (adhb), counties manukau district health board (cmdhb), university of otago, university of auckland, who collaborating centre at st jude children’s research hospital and the united states centers for disease control and prevention (us cdc). shivers, the largest and most comprehensive influenza research initiative in the southern hemisphere, aims to: (1) understand severe acute respiratory infections; (2) assess influenza vaccine effectiveness; (3) investigate interaction between influenza and other respiratory pathogens; (4) ascertain the causes of respiratory mortality; (5) understand non-severe respiratory illness; (6) estimate influenza infection through a serosurvey; (7) determine influenza risk factors; (8) study immune responses to influenza; and (9) estimate influenza-associated health care and societal economic burden and vaccine cost–effectiveness.6 a major component of the shivers project is to conduct hospital-based surveillance for severe acute respiratory infections (sari). this report describes the implementation of this hospital-based surveillance system and provides some preliminary results from the first influenza season of its operation. purpose of the surveillance system the specific aims of the hospital-based surveillance are to:7 establish active, prospective, continuous, population-based surveillance for hospitalized sari cases, including intensive care unit (icu) admissions and in-hospital deaths; understand influenza’s contribution to those assessed patients not meeting the sari case definition; measure incidence, prevalence, demographics, clinical spectrum and outcomes for sari and associated influenza cases; identify etiologies of sari cases attributable to influenza and other respiratory pathogens; compare surveillance data with the data generated from new zealand’s hospital discharge coding system; and describe any possible increased risk of influenza-related hospitalization. implementation of the surveillance system population under surveillance all residents from adhb (central auckland) and cmdhb (east and south aukland) were under surveillance. cases were reported from auckland city hospital and the associated starship children’s hospital and middlemore hospital and the associated kidz first children’s hospital. these four hospitals serve all residents of adhb and cmdhb, have emergency departments and inpatient general and speciality medical services and provide all inpatient care for acute respiratory illness. the age, ethnicity and socioeconomic distribution of the urban population of 838 000 under surveillance were broadly similar to the new zealand population (table 1). table 1. population distribution by age, ethnicity and socioeconomic group in new zealand and surveillance population click to download table 1. jpg, 436kb * new zealand population census 2006 † ratio – percentage study area over percentage new zealand ‡ nzdep 2006 index of deprivation is an area-based, census-derived measure of socioeconomic status which divides the population into deciles, where 10 represents areas with the most deprived population and 1 is the least deprived. note: some columns may not add up to 100% due to the rounding off of decimal places. case definition cases included in the surveillance were overnight inpatients with suspected respiratory infections. an overnight admission is defined as: “a patient who is admitted under a medical team, and to a hospital ward or assessment unit.”7 these cases were further identified as those meeting the sari case definition and those not meeting the sari case definition (non-sari). all sari cases and a subset of non-sari cases were enrolled. the who sari case definition was used for all age groups:2 an acute respiratory illness with: a history of fever or measured fever of 38 °c, and cough, and onset within the past 10* days, and requiring inpatient hospitalization. * note: onset within the past seven days was used in the 2012 study protocol. expected number of cases the discharge data for hospitalized patients in adhb and cmdhb during the period 2006–2010 showed that the average annual number of overnight respiratory disease admissions (icd-10 j00–99) was 9431 and influenza and pneumonia and acute lower respiratory tract infections (icd-10 j09–22) was 5033 (table 2). thirty-six per cent of these admissions occurred for children under 15 years. based on an average annual increase in respiratory disease admissions of 2.6% from 2006 to 2010, it was expected that the number of respiratory disease hospitalizations would increase by ~10% in 2012. therefore, it was estimated that in 2012, 10 374 patients (icd-10 j00–99) and 5537 patients (icd-10 j09–22) would be admitted overnight with respiratory diseases. table 2. overnight hospital admissions for respiratory infections and related conditions (principal diagnosis in the j00–99 range*) in auckland district health board and counties manukau district health board during 2006–2010 click to download table 2. jpg, 526kb * the following respiratory conditions (roughly 1352 cases per year) were excluded because most of them are not likely to be classed as acute respiratory infections: j30–39, j60–70, j80–84, j90–94, j95, j97–99. summer – december to march; winter – june to september. while it was difficult to accurately predict the expected number of annual sari cases based on discharge data, an early study in the starship children’s hospital indicated that approximately 50% of the preschool-aged children with a discharge diagnosis of pneumonia or bronchopneumonia met the who case definition for pneumonia.8 the adhb laboratory data during 2010–2011 showed that 15.2% (175/1145) of respiratory specimens were positive for influenza virus.9 an average of 5500–10 000 annual cases of hospitalized respiratory diseases with 50% meeting the who sari case definition would result in ~2800–5000 hospitalized sari cases. based on the ~10% positive detection rate, about 280–500 laboratory-confirmed influenza cases would be expected among these hospitalized sari patients. case ascertainment and data collection case ascertainment followed a surveillance algorithm. the presence of the components of the case definition was determined by reviewing clinicians’ admission diagnoses and interviewing patients. records of all acutely admitted patients were reviewed daily to identify any overnight inpatient with a suspected respiratory infection. these patients were categorized into one of 10 admission diagnostic syndrome groups. research nurses interviewed these patients, documented the components of the case definition that were present and differentiated patients into sari and non-sari cases. a case report form for each assessed patient captured patient demographics, presenting symptoms and illness, pre-hospital health care, medication usage, influenza vaccination history, co-morbidities, disease course and outcomes, epidemiological risk factors and laboratory results. clinical specimens were taken from all sari and some non-sari patients (for clinical management purposes) (figure 1). the preferred respiratory specimens for adult and paediatric patients were nasopharyngeal swabs and nasopharyngeal aspirates, respectively. where possible, at least one lower respiratory tract sample (tracheal aspirate, bronchial wash or bronchoalveolar lavage) was collected from all ventilated patients. figure 1. specimen collection and testing for sari cases and a proportion of non-sari cases click to download figure 1. jpg, 894kb adhb – auckland district health board; cmdhb – counties manukau district health board; elispot – enzyme-linked immunosorbent spot; esr – institute of environmental science and research; hai – haemagglutination inhibition assay; hmpv – human metapnemovirus; nai – neuraminidase inhibition assay; piv1–3 – parainfluenza virus types 1–3; pcr – polymerase chain reaction; rsv – respiratory syncytial virus. laboratory component influenza and other non-influenza respiratory viruses the adhb laboratory and esr used us-cdc’s real-time rt–pcr protocol for influenza virus.10 cmdhb laboratory used the easy-plex pcr assay for influenza virus (ausdiagnostic pty ltd, new south wales, australia).11 comparison between ausdiagnostic with us cdc’s assays showed that ausdiagnostic assay had a sensitivity of 100% and specificity of 96.6% when us cdc method was used as a gold standard. all shivers samples were forwarded to esr for further characterization/storage. the who standard manual was used to conduct antigenic, genetic and antiviral characterization.12 any unsubtypeable influenza a viruses were forwarded to who collaborating centres in melbourne or atlanta. us cdc’s real-time rt–pcr for non-influenza respiratory viruses was performed for respiratory syncytial virus, parainfluenza virus 1–3, human metapneumovirus, rhinovirus and adenovirus.13,14 respiratory bacteria sampling and testing for respiratory bacteria was based on the hospital clinical management and diagnostic protocols. urinary antigen tests (a rapid immuno-chromatographic test) from binax (auckland, new zealand) were used for all strains of streptococcus pneumoniae and legionella pneumophila serogroup 1. the adhb laboratory used blood culture media, bd bactec-plus aerobic/f and bactec lytic/10 anaerobic/f from becton, dickinson and co. (auckland, new zealand). the cmdhb laboratory used bact/alert-fa-plus, fn-plus and pf-plus bottles from biomérieux (auckland, new zealand). the cmdhb laboratory used ausdiagnostic pcr assay (bordetella and atypical pneumonia, cat. 3078) to detect: pan-legionella; legionella longbeachae, legionella pneumophila, mycoplasma pneumoniae, pan-chlamydia, chlamydophila pneumoniae, bordetella pertussis, bordetella parapertussis and pneumocystis jiroveci. data analysis and dissemination the total number of all hospital acute admissions and assessed and tested patients, including icu admissions and deaths and census data, were collected. this allowed calculation for population-based incidence for sari and associated influenza cases by overall and stratified population (age, sex, ethnicity and socioeconomic status) for the adhb and cmdhb population (2006 census data). this also allowed calculation for proportion of sari and associated influenza cases, including icu admissions and deaths, by overall and stratified patients among all acute admissions. an acute admission is an unplanned admission on the day of presentation at the admitting health-care facility. admission may have been from the emergency or outpatient departments of the health-care facility, a transfer from another facility or a referral from primary care. weekly reports during may–september and monthly reports during october–april were produced. annual reports described epidemiologic, clinical, virologic/microbiologic characteristics, risk factor analysis of sari and associated influenza and other respiratory pathogen cases, and antigenic, genetic and antiviral characterization of influenza viruses. ethics ethics approval was obtained from the northern a health and disability ethics committee (ntx/11/11/102 am02). written consent is not necessary for non-sensitive data from routine in-hospital clinical management and diagnostic testing. verbal explanation of the reason for additional information and its use was given to each patient, consistent with the new zealand code of health and disability services consumers’ rights (right 6: right to be fully informed).15 preliminary results from 30 april to 30 september 2012 there were 59 124 acute admissions to adhb and cmdhb hospitals. a total of 4417 (7.5%) patients with suspected respiratory infections were assessed. of these, 2023 (45.8%) met the sari case definition. of the 1430 sari cases from whom nasopharyngeal specimens were collected, 324 (22.7%) had influenza viruses. a small proportion of influenza-positive cases (7.1%, 21/294) were identified from patients with onset in the past seven to 10 days, so the case definition was expanded to onset within the past 10 days for subsequent study years (2013–2016). a small proportion (8.8%, 37/419) of influenza-positive cases was from non-sari cases tested for clinical purposes. discussion value of sari surveillance hospital-based sari surveillance has been implemented and fully functioning in new zealand since 30 april 2012. who is encouraging member states to establish sari surveillance that meets who global standards.2 to our knowledge, new zealand is among the first developed countries to do this, providing better understanding of the epidemiology, transmission and impact of influenza locally and globally. new zealand’s existing hospital-based disease surveillance is well suited to strategic surveillance functions.16 however, such systems are not suited to control-focused surveillance where it is necessary to identify and respond in a timely manner to individual events.16 thus, the active, prospective, continuous, hospital-based sari surveillance provided by the shivers project is particularly useful in supporting both pandemic preparedness for emerging influenza a(h7n9) virus and seasonal influenza prevention and control. sari surveillance has been a valuable platform for the study of other common respiratory pathogens and preparing for emerging respiratory viral diseases such as novel coronavirus, mers-cov. limitations and potential improvements to sari surveillance the who sari case definition, based on clinical symptoms and signs, will miss some illnesses caused by influenza infection and include some illnesses caused by non-influenza infections.2,17 the shivers sari surveillance system provides a comprehensive and thorough algorithm for case ascertainment and testing for all sari and some non-sari cases. it offers a unique opportunity to define cases of influenza not captured currently from patients who do not meet who sari case definition, thus enabling further refinement of the who case definition. additionally, the shivers sari surveillance system offers an opportunity to evaluate sensitivity and specificity of the who sari case definition and predicting symptoms for capturing non-influenza respiratory viruses. sari surveillance is limited in identifying influenza virus-infected patients with atypical clinical presentations (respiratory and non-respiratory). influenza infection can lead to more severe illness and complications such as primary viral pneumonia, secondary bacterial pneumonia, cardiac complications and neurological complications. influenza infection can also cause exacerbations of underlying diseases such as chronic lung disease or cardiovascular disease. some of the complications and exacerbations may occur after typical influenza-related clinical symptoms have resolved, and influenza infection may not be suspected as a cause in these complications. sari surveillance can characterize socio-demographic risk factors (age, sex, ethnicity and socioeconomic deprivation) as the distribution of these characteristics is well defined in census data in new zealand. for other more specific risk factors, there are limited data available on their distribution in the population. as sari surveillance is a case-finding surveillance for hospitalized inpatients, it is limited to quantify the impact of these specific risk factors for sari-related influenza infections without their baseline distributions. consequently, it is necessary to identify a suitable comparison/control population. during 2013, a hospital-based control population without respiratory illness will be added to investigate specific risk factors for influenza and other respiratory diseases. the case report form captures information by interviewing patients/caregivers through their recall, which generates bias. an important example is influenza vaccination status, which is crucial for estimating vaccine effectiveness. the ministry of health in new zealand plans to add influenza vaccination to its national immunization register in 2014, providing more accurate vaccination history for sari cases than patient/caregiver recall. conflicts of interests none declared. funding the shivers project is funded by us cdc (1u01ip000480-01). the hospital-based surveillance is a key component of the shivers project. the project is a five-year research cooperative agreement between esr and us cdc’s national center for immunization and respiratory diseases influenza division. acknowledgements the shivers project is a multicentre and multidisciplinary collaboration. special thanks to these collaborating organizations for their commitment and support: esr, adhb, cmdhb, university of otago, university of auckland, us cdc and who collaborating centre at st jude children’s research hospital in memphis, usa. special thanks to: the research nurses at adhb; the research nurses at cmdhb; staff of the who national influenza centre, esr; the health intelligence team, esr; staff of the adhb laboratory and cmdhb laboratory; it staff and sari surveillance participants. also, a special thanks to dr dean erdman from gastroenteritis and respiratory viruses laboratory branch, us cdc, who provided the real-time pcr assay for non-influenza respiratory viruses. support in kind was provided by the ministry of health. all authors participated in designing and establishing sari surveillance and revising the manuscript critically for intellectual content. all authors have given final approval of the version to be published. references: ortiz jr et al. strategy to enhance influenza surveillance worldwide. emerging infectious diseases, 2009, 15:1271–1278. doi:10.3201/eid1508.081422 pmid:19751590 who global epidemiological surveillance standards for influenza. geneva, world health organization, 2013. available from: http://www.who.int/influenza/ resources/documents/influenza_surveillance_manual/en/index.html [accessed 5 may 2014]. baker mg et al. pandemic influenza a(h1n1)v in new zealand: the experience from april to august 2009. eurosurveillance: european communicable disease bulletin, 2009, 14(34): pii:19319. pmid:19712648 huang qs et al. influenza surveillance and immunisation in new zealand, 1997–2006. influenza and other respiratory viruses, 2008, 2:139–145. pmid:19453466 baker mg et al. increasing incidence of serious infectious diseases and inequalities in new zealand: a national epidemiological study. lancet, 2012, 379:1112–1119. doi:10.1016/s0140-6736(11)61780-7 pmid:22353263 the shivers project study overview. new zealand, institute of environmental science and research, 2011. available from: http://www.esr.cri.nz/competencies/ shivers/pages/studyoverview.aspx [accessed 5 may 2014]. lopez l, wood t, huang qs. influenza surveillance in new zealand, 2012 and 2013. available from: https://surv.esr.cri.nz/virology/influenza_annual_report.php [accessed 6 may 2014]. grant cc et al. risk factors for community-acquired pneumonia in pre-school-aged children. journal of paediatrics and child health, 2012, 48:402–412. doi:10.1111/j.1440-1754.2011.02244.x pmid:22085309 williamson da et al. surveillance for influenza using hospital discharge data may underestimate the burden of influenza-related hospitalization. infection control and hospital epidemiology: the official journal of the society of hospital epidemiologists of america, 2012, 33(10): 1064–1066. shu b et al. design and performance of the cdc real-time reverse transcriptase pcr swine flu panel for detection of 2009 a (h1n1) pandemic influenza virus. journal of clinical microbiology, 2011, 49:2614–2619. doi:10.1128/jcm.02636-10 pmid:21593260 szewczuk e et al. rapid semi-automated quantitative multiplex tandem pcr (mt-pcr) assays for the differential diagnosis of influenza-like illness. bmc infectious diseases, 2010, 10:113. doi:10.1186/1471-2334-10-113 pmid:20459845 who global influenza surveillance network. manual for the laboratory diagnosis and virological surveillance of influenza. geneva, world health organization, 2011, p. 153. heim a et al. rapid and quantitative detection of human adenovirus dna by real-time pcr. journal of medical virology, 2003, 70:228–239. doi:10.1002/jmv.10382 pmid:12696109 lu x et al. real-time reverse transcription-pcr assay for comprehensive detection of human rhinoviruses. journal of clinical microbiology, 2008, 46:533–539. doi:10.1128/jcm.01739-07 pmid:18057136 code of health and disability services consumers’ rights. auckland, health and disability commissioner, 2009. available from: http://www.hdc.org.nz/the-act--code/the-code-of-rights [accessed 5 may 2014]. baker mg, easther s, wilson n. a surveillance sector review applied to infectious diseases at a country level. bmc public health, 2010, 10:332. doi:10.1186/1471-2458-10-332 pmid:20540772 murray el et al. what are the most sensitive and specific sign and symptom combinations for influenza in patients hospitalized with acute respiratory illness? results from western kenya, january 2007–july 2010. epidemiology and infection, 2013, 141:212–222. doi:10.1017/s095026881200043x pmid:22417876 assessment of the risk posed to singapore by the 2015 middle east respiratory syndrome outbreak in the republic of korea risk assessment emma xuxiao zhang,a olivia seen huey oh,a wanhan see,a pream raj,a lyn james,a kamran khanbc and jeannie su hui teya a epidemiology and disease control division, public health group, ministry of health, singapore. b li ka shing knowledge institute, st. michael’s hospital, toronto, canada. c department of medicine, division of infectious diseases, university of toronto, toronto, canada. correspondence to jeannie su hui tey (email: jeannie_tey@moh.gov.sg). to cite this article: zhang ex et al. assessment of the risk posed to singapore by the 2015 western pacific surveillance and response journal, 2016, 7(2):17–25. doi:10.5365/wpsar.2015.6.4.008 abstract objective: to assess the public health risk to singapore posed by the middle east respiratory syndrome (mers) outbreak in the republic of korea in 2015. methods: the likelihood of importation of mers cases and the magnitude of the public health impact in singapore were assessed to determine overall risk. literature on the epidemiology and contextual factors associated with mers coronavirus infection was collected and reviewed. connectivity between the republic of korea and singapore was analysed. public health measures implemented by the two countries were reviewed. results: the epidemiology of the 2015 mers outbreak in the republic of korea remained similar to the mers outbreaks in saudi arabia. in addition, strong infection control and response measures were effective in controlling the outbreak. in view of the air traffic between singapore and mers-affected areas, importation of mers cases into singapore is possible. nonetheless, the risk of a serious public health impact to singapore in the event of an imported case of mers would be mitigated by its strong health-care system and established infection control practices. discussion: the mers outbreak was sparked by an exported case from the middle east, which remains a concern as the reservoir of infection (thought to be camels) continues to exist in the middle east, and sporadic cases in the community and outbreaks in health-care settings continue to occur there. this risk assessment highlights the need for singapore to stay vigilant and to continue enhancing core public health capacities to detect and respond to mers coronavirus. introduction on 20 may 2015, the international health regulations national focal point of the republic of korea notified the world health organization (who) of the first laboratory-confirmed imported case of middle east respiratory syndrome coronavirus (mers-cov) infection in a 68-year-old man with a recent history of travel to the middle east.1 subsequent human-to-human transmission of the virus occurred in 16 health-care facilities in the republic of korea among close family contacts; patients who shared the same room or ward with infected patients; their visitors; and health-care workers who provided care to the patients, resulting in the largest nosocomial outbreak outside the middle east. in addition, one case was exported to china. the last case of mers-cov associated with the outbreak was reported on 5 july 2015, leading to a total of 186 cases including 36 deaths reported in the republic of korea.1 to assess the risk posed by the mers-cov outbreak in the republic of korea to singapore, we carried out an analysis to estimate the likelihood of importation of mers-cov cases into singapore from the republic of korea and to assess the public health impact should a case be imported. methods the likelihood of mers-cov spreading from the republic of korea and its impact on public health in singapore were assessed following who guidance on the risk assessment of acute public health events.2 the process of risk assessment included literature review, epidemiological analysis of the mers-cov outbreak in the republic of korea, analysis of air travel volume between the republic of korea and singapore, assessment of public health control measures taken by the republic of korea and preparedness of the singapore health authorities. the risk assessment was conducted by a core group of five public health officers specializing in public health surveillance, epidemiology and risk analysis of infectious diseases. their findings were reviewed by a broader group of experts from the singapore ministry of health in the areas of public health, laboratory medicine, epidemiology, infectious diseases, risk communication, as well as emergency preparedness and response. the epidemiology of mers-cov and the 2015 mers outbreak in the republic of korea was analysed based on information obtained from scientific literature review using pubmed, who situation reports and official information released by the republic of korea ministry of health and welfare. a qualitative review of the public health measures taken by the republic of korea and singapore in response to this outbreak was conducted based on information released by the republic of korea ministry of health and welfare and the singapore ministry of health. the volume of travellers initiating trips on commercial flights originating from the republic of korea with final destinations in singapore between january and november 2015 was analysed using data from the international air transport association (iata). these data include worldwide, anonymized, passenger-level flight itineraries capturing an estimated 90% of the world’s air traffic with the remainder being imputed using market intelligence. each itinerary includes information on the travellers’ point of origin, final destination, and where applicable, connecting flights. (iata data have been used previously to predict the epidemic wave-front of emerging pathogens, to support risk assessments for mass gatherings and to evaluate policies around screening of travellers at commercial airports.)3 results hazard assessment mers is a viral respiratory illness caused by a novel coronavirus that was first detected in saudi arabia in 2012.4 the clinical presentation of mers-cov infection ranges from asymptomatic infection to severe pneumonia with acute respiratory distress syndrome, septic shock and multiorgan failure resulting in death.4 poor prognosis is associated with increasing age or medical co-morbidities.4 the median incubation period for human-to-human secondary cases was estimated to be just over five days but could be as long as two weeks.5 the source of mers-cov and the mode of transmission have yet to be determined. current evidence suggests that camels are an important source of mers-cov in the community, and the pattern of disease reported in humans appear to be the result of repeated introductions of the virus from camels to humans.6,7 although no sustained community transmission has been reported thus far, human-to-human transmission has been documented in several clusters associated with health-care facilities, households and workplaces.8,9 the overall basic reproduction number of mers is less than one but can be higher in crowded health-care settings where infection prevention and control measures are inadequate.10,11 visits to multiple health-care facilities with increasing number of contacts has also been identified as a common feature of clustering events in the outbreak in the republic of korea.12 thus far, the possibility of transmission from asymptomatic polymerase chain reaction(pcr) positive cases cannot be excluded, necessitating the need for close monitoring and investigation of all contacts, including asymptomatic contacts.12 there has been no reported transmission during air travel, and the incidence of infection associated with large gatherings such as umrah and hajj was very low.14 the largest mers outbreak outside the saudi arabia occurred in 2015 in the republic of korea. the index case travelled to the middle east and developed symptoms one week after returning to the republic of korea. by the time the diagnosis of mers-cov infection was established, the index case had transmitted the infection to his wife, other patients and visitors in the same room/ward and health-care workers who had provided care to him. these secondary cases subsequently went on to infect relatives, patients and health-care workers in a similar pattern and largely in health-care settings, resulting in four generations of cases. among them, 83% appeared to be linked to five clustering events. an event was arbitrarily defined by the korea centers for disease control and prevention as one patient transmitting the infection to more than four patients.1 there was no evidence of sustained human-to-human transmission in the community or airborne transmission. the pattern of transmission in the republic of korea was similar to that of the outbreaks in saudi arabia. in addition, poor outcomes were associated with increasing age or medical co-morbidities, similar to that observed in the previous outbreaks in saudi arabia.1 the epidemiological patterns observed were in line with the close resemblance of genetic sequences of the viruses isolated from the republic of korea and saudi arabia,1 which suggested that the viruses were likely to demonstrate similar virulence and transmissibility. exposure assessment the mers outbreak was contained in the republic of korea with only one case exported to china via transit in the hong kong special administrative region (sar).1 the case did not transmit the infection to any of his contacts during travel. among the top 15 global final destination cities for travellers from the republic of korea in 2015, hong kong sar received the third highest number of travellers from the republic of korea after tokyo and shanghai. singapore ranked 11th with an average of 42 283 travellers coming from the republic of korea per month (figure 1). in view of the close connectivity between the two countries and the relatively long incubation time of mers-cov infection (up to 14 days), the importation of the mers-cov infection from the republic of korea to singapore is possible. figure 1. top final destinations of travellers from the republic of korea, january to november 2015 click to download figure 1. jpg, 645kb the light blue graduated circles reflect the top 15 final destinations identified. final destinations receiving fewer than 500 travellers were excluded. source: data were obtained from the international air transport association. context assessment this context assessment considers both the capabilities of the republic of korea health authorities to control the outbreak and to reduce the risk of exportation of cases, as well as the preparedness and response measures in singapore to evaluate the risk of this outbreak to the singapore local population. measures taken by the republic of korea the majority of the mers cases in the republic of korea had been infected before adequate infection prevention and control procedures were applied, suggesting lapses in the preventive and control measures, including contact tracing and quarantine at the beginning of the outbreak. in response to the surge in cases, the republic of korea authorities subsequently implemented intense case and contact management measures.15 upon detection of the first tertiary case on 2 june, the definition of contacts (initially health-care workers who directly cared for the index case and people who were in the same hospital room as the index case) was expanded to include anyone in the same room/ward as confirmed cases or those who had contact with the respiratory secretions of the cases.1 as a result, the number of contacts placed under quarantine increased rapidly (figure 2). the authorities also expanded their contact-tracing and search activities to include the entire hospital when deemed necessary. for instance, the authorities had attempted to contact every individual who had visited two severely mers-infected hospitals during the implicated period. the authorities also sealed off several hospitals and quarantined all patients and staff at the hospitals, resulting in a further increase in the number of contacts under quarantine between 10 and 18 june. more than 16 000 contacts were monitored during the entire outbreak with a peak of more than 1000 new contacts put under quarantine daily (figure 2). the increase in the number of contacts under quarantine corresponded with the decrease in the number of new cases reported. figure 2. cumulative and daily number of contacts of mers cases under quarantine in the republic of korea, 2015* a. cumulative contacts click to download figure 2. jpg, 661kb note: contacts isolated at hospitals are represented by a light blue bar, and contacts isolated at home are represented by a dark blue bar. when the numbers were not separately reported, the total number of contacts isolated is represented by a gray bar. percentage of contacts isolated at hospital is represented by a green line. b. daily contacts click to download figure 2. jpg, 661kb * the information is summarized based on the line listing reported by the republic of korea ministry of health and welfare from 20 may to 20 july 2015 . for hospital management, the republic of korea authorities closed down several affected hospitals, which were deemed to be epicentres of the outbreak, to prevent further transmission of the disease. the authorities also designated referral hospitals for managing confirmed cases. a national safe hospital program was implemented to control mers-cov transmission within hospitals by providing care for patients with respiratory diseases in secured areas separate from outpatient or emergency department.16 infection prevention and control measures were also strengthened in all health-care facilities. the republic of korea used the real-time reverse transcription pcr protocol recommended by who17 and was able to confirm the majority of the cases in the first test. repeat testing was required on 27 of 186 cases (15%). it remains unclear if these cases had low viral loads, although their symptoms were not milder than those who tested positive in the first test. in response to the exported case to china and reports of contacts of confirmed cases travelling within the republic of korea while under quarantine, a travel ban was imposed on quarantined people from travelling on both international and domestic flights.18 such extensive efforts to enhance contact tracing and stronger monitoring and quarantine measures contributed to the subsequent decline in new cases and the eventual end of the outbreak. preparedness and response in singapore the singapore ministry of health has been closely watching the developments of mers-cov infections since its first emergence in the arabian peninsula in 2012. as a precautionary measure for the early detection of mers cases, temperature screening at air checkpoints has been in place since 18 may 2014 for passengers arriving from affected countries in the middle east.19 in view of the surge in the number of mers-cov cases in the republic of korea, and continued news of reported breaches in containment and quarantine measures there, temperature screening at air checkpoints for passengers arriving from the republic of korea commenced on 9 june 2015.20 health advisories were also distributed at border checkpoints for travellers coming from and going to areas affected by mers-cov.21 temperature screening and other border health measures for passengers arriving from the republic of korea ended on 6 august 2015 in view of the stabilized situation in the republic of korea.22 temperature screening may not pick up all imported cases due to the long incubation period of mers-cov and the presence of mild and asymptomatic cases. therefore, all hospitals and doctors have been reminded to remain vigilant and to step up their operational readiness in the event of an imported case.20 patients with clinical signs/symptoms of pneumonia or severe respiratory infection with breathlessness and a travel history to the middle east and the republic of korea in the two weeks before onset will be evaluated to exclude mers-cov infection. in addition, people with a fever and respiratory illness of any severity who had recently visited a health-care facility while travelling in the middle east will also be similarly evaluated. (this measure was similarly applied for the republic of korea during the outbreak there. all suspected and confirmed cases will be isolated and managed under strict airborne infection control precautions.) infection control precautions and practices have been strengthened in all health-care institutions. guidance to health-care workers on the management of any suspected mers cases has also been provided. the national public health laboratory and the public hospital laboratories have the capabilities to test for mers-cov following the protocol recommended by who.17 if a confirmed mers case is detected, singapore ministry of health will conduct contact tracing when appropriate and all close contacts will be placed under quarantine. a designated quarantine housing will be on standby and can be deployed at short notice to safeguard public health.23 a coordinated national response plan against disease threats, including mers-cov, has been developed. the disease outbreak response system condition is a colour-coded framework that provides a quick reference to agencies and the public on the current disease situation and what needs to be done to respond to and prevent infections and reduce the impact.24 in response to the mers outbreak, the ministry of manpower issued a tripartite advisory on 7 july 2015 to help employers prepare and implement precautionary measures at the workplace.25 risk characterization the risk imposed to singapore by the 2015 mers outbreak in the republic of korea was characterized using the information collected with key factors considered to assess the likelihood of exportation of cases to singapore and the impact on public health (table 1). table 1. risk characterization matrix for the public health risk posed to singapore by the 2015 mers outbreak in the republic of korea click to download table 1. jpg, 975kb pcr, polymerase chain reaction. the risk characterization suggests that the likelihood of mers-cov importation into singapore is possible in view of air traffic between singapore and the republic of korea. the review of the republic of korea outbreak demonstrated that notwithstanding the initial surge in cases due to weaknesses in outbreak management and response at the early stage, mers outbreaks can be effectively contained with the implementation of strict infection control and outbreak response measures. this is reminiscent of our experience with severe acute respiratory syndrome (sars) in 2003. the lessons learnt from the mers outbreak in the republic of korea and our past experience in the management of the sars outbreak have been referenced in the planning of singapore’s response against mers, and the measures have been implemented accordingly. the risk of serious public health impact to singapore in the event of an imported case of mers-cov infection would be mitigated by a strong health-care system and established infection control practices in the local health-care settings. discussion this 2015 mers outbreak in the republic of korea was the largest nosocomial mers outbreak outside of the middle east and the first mers outbreak that resulted in further exportation to a third country. the spread of the disease in the republic of korea was less likely due to any intrinsic changes in virus but was more likely attributed to lapses in the infection and control measures in health-care facilities and weak enforcement of quarantine of contacts. also responsible for the spread of the disease were the health-seeking behaviours that were typical in the republic of korea, including seeking medical assistance at several health-care facilities (doctor shopping), transferring sick patients to multiple health-care facilities and family members staying for long durations in the overcrowded wards to provide care to their hospitalized relatives.26 the subsequent intense case and contact management implemented by the republic of korea government was effective in bringing down the case incidence. the analysis of the number of contacts under quarantine in the republic of korea provided insights into the surge capacity required from public health authorities to deal with such an outbreak. this risk assessment has some limitations. the assessment is based on limited data as only one case had been exported from the republic of korea and no cases had been imported into singapore. as the risk characterization was defined by the epidemiological and contextual knowledge available currently, conclusions could change as new information emerges. a better understanding of the variation in individual infectiousness and the environmental impact could provide key information on epidemic spread and facilitate the design of control measures. major gaps in information including source of infection, transmission mode and factors contributing to clustering events need to be filled to better assess the risk to public health. in addition, the analysis of contact management is based on the best available data reported by the republic of korea ministry of health and welfare during the outbreak. to conclude, this 2015 mers outbreak in the republic of korea was initiated by an exported case from the middle east. it remains a concern as the reservoir of infection (thought to be camels) continues to exist in the region, and sporadic cases in the community and outbreaks in health-care settings continue to occur there. in view of air traffic between singapore and the mers-affected areas, the importation of mers-cov infections into singapore is possible. this risk assessment highlights the need for singapore to stay vigilant and to continue enhancing core public health capacities to detect and respond to mers-cov. to date, there have been no mers cases reported in singapore. conflict of interests none declared. funding none. acknowledgements the authors are grateful to dr marisa creatore of bluedot, as well as dr derrick heng (group director of the public health group) of the singapore ministry of health for helpful discussion. references korea centers for disease control and prevention. middle east respiratory syndrome coronavirus outbreak in the republic of korea, 2015. osong public health research perspective, 2015, 6(4):269–278. doi:10.1016/j.phrp.2015.08.006 pmid:26473095 rapid risk assessment of acute public health events. geneva, world health organization, 2012. available from: http://whqlibdoc.who.int/cgi-bin/repository.pl?url=/hq/2012/who_hse_gar_aro_2012.1_eng.pdf [accessed 25 january 2016]. bogoch ii et al. assessment of the potential for international dissemination of ebola virus via commercial air travel during the 2014 west african outbreak. lancet, 2015, 3, 385(9962):29–35. doi:10.1016/s0140-6736(14)61828-6 pmid:25458732 the who mers-cov research group. state of knowledge and data gaps of middle east respiratory syndrome coronavirus (mers-cov) in humans. plos current, 2013, 12:5. doi:10.1371/currents.outbreaks.0bf719e352e7478f8ad85fa30127ddb8 cowling bj et al. preliminary epidemiological assessment of mers-cov outbreak in south korea, may to june 2015. eurosurveillance: european communicable disease bulletin, 2015, 20(25):7–13. pmid:26132767 müller ma et al. presence of middle east respiratory syndrome coronavirus antibodies in saudi arabia: a nationwide, cross-sectional, serological study. lancet infectious diseases, 2015, 15(5):559–564. doi:10.1016/s1473-3099(15)70090-3 pmid:25863564 reusken cb et al. occupational exposure to dromedaries and risk for mers-cov infection, qatar, 2013–2014. emerging infectious diseases, 2015, 21(8):1422–1425. doi:10.3201/eid2108.150481 pmid:26196891 assiri a et al. hospital outbreak of middle east respiratory syndrome coronavirus. new england journal of medicine, 2013, 369(5):407–416. doi:10.1056/nejmoa1306742 bermingham a et al. severe respiratory illness caused by a novel coronavirus, in a patient transferred to the united kingdom from the middle east, september 2012. eurosurveillance: european communicable disease bulletin, 2012, 17(40):20290. pmid:23078799 cauchemez s et al. middle east respiratory syndrome coronavirus: quantification of the extent of the epidemic, surveillance biases, and transmissibility. lancet infectious diseases, 2014, 14(1):50–56. doi:10.1016/s1473-3099(13)70304-9 pmid:24239323 breban r et al. interhuman transmissibility of middle east respiratory syndrome coronavirus: estimation of pandemic risk. lancet, 2013, 24; 382(9893):694–699. doi:10.1016/s0140-6736(13)61492-0 pmid:23831141 nishiura h et al. identifying determinants of heterogeneous transmission dynamics of the middle east respiratory syndrome (mers) outbreak in the republic of korea, 2015: a retrospective epidemiological analysis. bmj open, 2016, 6(2):e009936. doi:10.1136/bmjopen-2015-009936 pmid:26908522 al hammadi zm et al. asymptomatic mers-cov infection in humans possibly linked to infected dromedaries imported from oman to united arab emirates, may 2015. emerging infectious diseases, 2015, 21(12):2197–2200. doi:10.3201/eid2112.151132 pmid:26584223 gautret p et al. hajj-associated viral respiratory infections: a systematic review. travel medicine and infectious disease, 2015, 13(1):106–109. doi:10.1016/tmaid.2015.12.008 kim jy et al. middle east respiratory syndrome infection control and prevention guideline for healthcare facilities. journal of infection and chemotherapy, 2015, 47(4):278–302. doi:10.3947/ic.2015.47.4.278 pmid:26788414 press release: 87 hospitals would begin operations as national safe hospitals (12 june 2016). sejong, korea centers for disease control and prevention, 2015. available from: http://www.mers.go.kr/mers/html/jsp/menu_c/list_c1.jsp?menuids=&fid=21&q_type=&q_value=&cid=63431&pagenum=1 [accessed 7 april 2016]. laboratory testing for middle east respiratory syndrome coronavirus: interim recommendations (revised). geneva, world health organization, 2014. available from: http://www.who.int/csr/disease/coronavirus_infections/who_interim_ recommendations_lab_detection_merscov_092014.pdf [accessed 7 april 2016]. s. korea reports 3 new mers cases with no additional deaths. the korea herald, 23 june 2015. available from: http://www.koreaherald.com/view.php?ud=20150623000200 [accessed 7 april 2016]. additional measure for early detection of mers-cov. singapore, ministry of health, 2014. available from: https://www.moh.gov.sg/content/moh_web/home/pressroom/ pressroomitemrelease/2014/additional-measure-for-early-detection of-mers-cov.html [accessed 7 april 2016]. additional precautionary measures against mers-cov situation in south korea. singapore, ministry of health, 2015. available from: https://www.moh.gov.sg/content/ moh_web/home/pressroom/pressroomitemrelease/2015/additional-precautionary measures-against-mers-cov-situation-in-.html [accessed 7 april 2016]. mers-cov: health advisory (october 2015). singapore, ministry of health, 2015. available from: https://www.moh.gov.sg/content/moh_web/home/pressroom/ pressroomitemrelease/2015/additional-precautionary-measures against-mers-cov-situation-in-.html [accessed 7 april 2016]. cessation of mers-cov measures for south korea. singapore, ministry of health, 2015. available from: https://www.moh.gov.sg/content/moh_web/home/pressroom/ pressroomitemrelease/2015/cessation-of-mers-measures-for-south-korea.html accessed 7 april 2016). strengthening preparedness for emerging infectious diseases. singapore, ministry of health, 2013. available from: https://www.moh.gov.sg/content/moh_web/home/ pressroom/pressroomitemrelease/2013/strengthening-preparedness-for-emerging infectious-diseases.html [accessed 7 april 2016]. pandemic preparedness. singapore, ministry of health, 2014. available from: https://www.moh.gov.sg/content/moh_web/home/diseases_and_conditions/ pandemic-preparedness.html [accessed 7 april 2016]. tripartite advisory on workplace measures to tackle middle east respiratory syndrome coronavirus (mers-cov). singapore, ministry of manpower, 2015. available from: http://www.mom.gov.sg/~/media/mom/documents/employment-practices/guidelines/tripartite-advisory-workplace-measures-mers.pdf?la=en [accessed 7 april 2016]. who statement on the ninth meeting of the ihr emergency committee regarding mers-cov. geneva, world health organization, 2015. available from: http://www.who.int/mediacentre/news/statements/2015/ihr-ec-mers/en/ [accessed 7 april 2016]. an outbreak investigation of congenital rubella syndrome in solomon islands, 2013 outbreak investigation report kara n durski,a carol tituli,b divi ogaoga,c jennie musto,d cynthia joshua,c alfred dofai,b jennie leydone and eric nillesf a who headquarters, geneva, switzerland. b national referral hospital, honiara, solomon islands. c ministry of health and medical services, honiara, solomon islands. d office of the who representative in solomon islands, honiara, solomon islands. e victorian infectious diseases reference laboratory (vidrl), the doherty institute, melbourne, victoria, australia. f division of pacific technical support, who, suva, fiji. correspondence to jennie musto (email to: mustoj@wpro.who.int). to cite this article: an outbreak investigation of congenital rubella syndrome in solomon islands, 2013. western pacific surveillance and response journal, 2016, 7(1):10–13. doi:10.5365/wpsar.2015.6.4.005 abstract introduction: during may 2012, a rubella outbreak was declared in solomon islands. a suspected case of congenital rubella syndrome (crs) was reported from one hospital 11 months later in 2013. this report describes the subsequent crs investigation, findings and measures implemented. methods: prospective crs surveillance was conducted at the newborn nursery, paediatric and post-natal wards, and the paediatric cardiology and ophthalmology clinics of the study hospital from april to july 2013. retrospective case finding by reviewing medical records was also undertaken to identify additional cases born between january and march 2013 for the same wards and clinics. cases were identified using established world health organization case definitions for crs. results: a total of 13 crs cases were identified, including two laboratory-confirmed, four clinically confirmed and seven suspected cases. five crs cases were retrospectively identified, including four suspected and one clinically confirmed case. there was no geospatial clustering of residences. the mothers of the cases were aged between 20 and 36 years. three of the six mothers available for interview recalled an acute illness with rash during the first trimester of pregnancy. discussion: additional crs cases not captured in this investigation are likely. caring for crs cases is a challenge in resource-poor settings. rubella vaccination is safe and effective and can prevent the serious consequences of crs. well-planned and funded vaccination activities can prevent future crs cases. introduction infection with rubella virus often causes mild disease characterized by fever and rash. up to 50% of infections are asymptomatic.1 serious complications including fetal death and congenital rubella syndrome (crs) may occur when women are infected early in pregnancy. crs is characterized by congenital heart disease, deafness, glaucoma, cataracts, mental retardation and other disabilities. crs may be observed in up to 90% of infants born to mothers infected during the first 10 weeks of gestation.2 crs is a burden on countries with limited resources, particularly countries with low rubella vaccination coverage rates. in 2010, the reported rubella incidence in the western pacific region was 26 per million population.3 available data from 2008 to 2010 indicate that more than 30% of female rubella infections were in the childbearing years from 15 to 44 years of age.3 however, information on the burden of crs in the western pacific region and globally is scant. solomon islands (population 515 870 in 2009) is an archipelago consisting of nine provinces and 992 islands located in the western pacific.4 eight provinces have access to a public hospital; in addition there are four private hospitals. in may 2012, a rubella outbreak was declared in solomon islands. six of 10 suspected cases presenting with acute fever and rash (afr) to a hospital located in the capital city, honiara (population 64 609 in 2009),4 were laboratory confirmed by rubella-specific immunoglobulin m (igm) assay. between may and september 2012, more than 440 cases of afr were reported through the national syndromic surveillance system, a sentinel surveillance system with eight reporting sites in five provinces at that time (figure 1). during april 2013, 11 months after the start of the rubella outbreak, a newborn infant with cataracts and thrombocytopenia was reported as a suspected case of crs by a paediatrician at the hospital. this report describes the subsequent crs investigation, findings and control measures implemented at the hospital. figure 1. afr and suspected or confirmed crs cases by month, solomon islands, 2012–2013 click to download figure 1. jpg, 289kb afr, acute fever and rash; and crs, congenital rubella syndrome. methods prospective crs surveillance was conducted at the study hospital in the newborn nursery, paediatric and postnatal wards and the paediatric cardiology and ophthalmology clinics from april to july 2013 using established world health organization (who) guidelines and case definitions.5 we also conducted retrospective case finding from january to march 2013 by reviewing medical records for clinically compatible illnesses and demographics for the same wards and clinics using the same case definitions. the investigation period was based on the estimated gestational period of pregnant women who may have been infected during the 2012 rubella outbreak (1 may to 30 september 2012) as no routine rubella vaccination or crs surveillance existed in solomon islands before this 2012 outbreak. the following case definitions were used to identify and classify crs cases. a suspected case of crs was any infant less than one year of age in whom a health worker suspects crs, including any infant with heart disease and/or suspicion of deafness and/or one or more of the following eye signs: cataract, diminished vision, nystagmus, squint, microphthalmus or congenital glaucoma. a clinically confirmed case of crs was any infant less than one year with two complications in group a or one from a and one from b. group a: cataract(s), congenital glaucoma, congenital heart disease, loss of hearing, pigmentary retinopathy; and group b: purpura, splenomegaly, microcephaly, mental retardation, meningoencephalitis, radiolucent bone disease, jaundice with onset within 24 hours after birth. a laboratory-confirmed case of crs was a clinically confirmed crs case with presence of serum anti-rubella igm (beckman access, lane cove, australia) or rubella-specific ribonucleic acid from pharyngeal swabs tested by reverse-transcriptase polymerase chain reaction (rt–pcr). mothers were asked if they had illnesses with rash during their pregnancies. infants had serum and pharyngeal swabs collected for testing. serum was not available for the retrospectively identified cases and laboratory testing was not performed. this investigation obtained who ethics approval (2015.16.sol.2.esr). results in total 13 crs cases were identified during the investigation period. all crs cases were born within a gestational period from the rubella outbreak in 2012 (figure 1). eight crs cases were prospectively identified including three suspected, three clinically confirmed and two laboratory-confirmed cases; six cases were identified in the nursery and two cases, who presented with cataracts, in the outpatient paediatric clinics. the two laboratory-confirmed crs cases were anti-rubella igm-positive (of which one was also rt–pcr-positive); the remaining six cases were anti-rubella igm-negative (table 1). the mothers were aged between 20 and 36 years. there was no geospatial clustering of residences. three of the six (50%) mothers interviewed recalled an acute illness with rash during the first trimester of pregnancy; no other serious illness was reported during pregnancy. table 1. prospectively and retrospectively identified cases of suspected, clinically confirmed and laboratoryconfirmed crs patients at one hospital in honiara, solomon islands, 2013 click to download table 1. jpg, 776kb cc, congenital cataracts; chd, congenital heart disease [clinical diagnosis by the hospital paediatricians]; enc, encephalitis; ft, full term; igur, intrauterine growth retardation; n/a, not available; pr, petechial rash; and tcp, thrombocytopenia. * sample collected at 6 months of age. † both igm and rt-pcr positive. five crs cases were retrospectively identified by medical record review and/or paediatricians’ recall, including four suspected and one clinically confirmed case. the first suspected crs case was born on 5 march 2013 and diagnosed with intrauterine growth retardation, overwhelming sepsis, thrombocytopenia, severe anaemia and asphyxia. from 5 march to 9 april, four newborns were admitted to the nursery with clinical characteristics of crs, including purpuric rash, cataracts and/or congenital heart disease. two of the five infants died shortly after birth (table 1). discussion this is the first documented crs outbreak in solomon islands. in 2012, the solomon islands ministry of health and medical services (mhms) implemented indicatorand event-based early warning outbreak disease surveillance as part of the pacific syndromic surveillance system that includes weekly reporting and investigation of afr cases.6 there were eight sentinel sites in five of nine provinces in 2012. from may to september 2012, unusual and substantial increases in afr were documented from all sentinel sites. given the absence of routine rubella vaccination, and given that six out of 10 (60%) samples tested from honiara were confirmed for rubella, it is probable that widespread rubella transmission occurred during this period. prior to implementation of the early warning surveillance system in 2012, the rubella outbreak would have likely gone unreported. despite the small number of laboratory-confirmed crs cases, the timing of the crs outbreak is consistent with the previous rubella outbreak in 2012 (figure 1). suspected newborn crs cases that test anti-rubella igm negative should be re-tested one month later, as approximately 20% of infected infants may not have detectable titres before one month of age;7 this diagnostic follow-up was not possible as the cases had returned to their villages. given that substantial rubella transmission appears to have started in may 2012 and prospective crs surveillance was only implemented from april 2013, it is probable that additional cases went undetected. additional undetected cases in the other provinces where crs surveillance was not conducted is also possible. during 2013, a seroprevalence survey of 100 pregnant women attending the prenatal clinic at the same study hospital was conducted by the mhms to assess for pre-existing immunity to rubella; 97% of the samples were positive for anti-rubella igg (mhms, unpublished data, 2013), demonstrating high rates of prior exposure and infection in this cohort. given that rubella vaccination was not routinely administered in solomon islands until 2013, the high anti-rubella igg positive proportion suggested substantial prior rubella virus transmission in honiara. it is not possible to determine if these cases were infected during the 2012 rubella outbreak or during earlier, undocumented rubella transmissions. crs is a frequent complication of rubella infection in early pregnancy.8 preventing future rubella outbreaks and crs cases in a resource-limited setting requires careful consideration and planning. the immunization coverage in the population should be greater than 80%, with at least one dose of vaccine, to prevent crs outbreaks.5 a vaccination strategy that achieves partial coverage may decrease but not eliminate rubella transmission, potentially shifting the average age of infection from childhood to adolescence and adulthood and increasing the risk of infection during the child-bearing years.5 infants born with crs are potentially infectious for up to one year.9 in a setting where the susceptible population is unknown and vaccination coverage is low, implementing control measures to avoid the spread of disease is challenging. important recommendations were implemented to minimize transmission of rubella within the hospital, including reinforcing hand-washing protocols, procuring and stocking hand sanitizing supplies within the nursery, temporarily relocating pregnant staff to other wards and isolating infectious cases.10 prior to hospital discharge, health-care workers must educate families about how to prevent transmission of rubella to others, in particular avoiding contact between pregnant women and the infectious infant. caring for crs cases is a challenge in resource-poor settings. a crs outbreak has a long-standing impact on vulnerable populations with minimal access to cardiac, auditory and ophthalmologic services. rubella vaccination is safe and effective.5 well-planned and funded vaccination activities can prevent future crs cases, including in resource-poor countries. conflicts of interest none declared. funding none. references centers for disease control and prevention (cdc). control and prevention of rubella: evaluation and management of suspected outbreaks, rubella in pregnant women, and surveillance for congenital rubella syndrome. mmwr morbidity and mortality weekly report, 2001, 50 rr-12:1–23. reef se et al. preparing for elimination of congenital rubella syndrome (crs): summary of a workshop on crs elimination in the united states. clinical infectious diseases, 2000, 31:85–95. doi:10.1086/313928 pmid:10913402 rubella and congenital rubella syndrome: fact sheet. geneva, world health organization, 2012. available from: http://www.wpro.who.int/ mediacentre/factsheets/fs_20120228/en/ [accessed 4 december 2015]. solomon islands stats at a glance. honiara, solomon islands national statistics office, 2015. available from: http://www.spc.int/prism/solomons/ [accessed 8 january 2016]. world health organization. rubella vaccine position paper. weekly epidemiological record, 2011, 29:301–16. available from: http://www.who.int/wer/2011/wer8629/en/ [accessed 8 january 2016]. kool jl et al. pacific-wide simplified syndromic surveillance for early warning of outbreaks. global public health, 2012, 7:670–681. doi:10.1080/17441692.2012.699536 pmid:22823595 manual for the laboratory diagnosis of measles and rubella virus infection, second edition. geneva, world health organization, 2007. available from: http://www.who.int/ihr/elibrary/manual_diagn_lab_mea_rub_en.pdf [accessed 8 january 2016]. miller e, cradock-watson je, pollock tm. consequences of confirmed maternal rubella at successive stages of pregnancy. lancet 1982, 2:781–784. doi:10.1016/s0140-6736(82)92677-0 pmid:6126663 cutts ft et al. control of rubella and congenital rubella syndrome (crs) in developing countries, part 1: burden of disease from crs. bulletin of the world health organization, 1997, 75:55–68. pmid:9141751 manual for the surveillance of vaccine-preventable diseases. atlanta, centers for disease control and prevention, 2014. available from: http://www.cdc.gov/ vaccines/pubs/surv-manual/chpt15-crs.html [accessed 8 january 2016]. a snapshot of catastrophic post-disaster health expenses post-haiyan field investigation report noel espallardo,a lester sam geroy,b raul villanueva,a roy gavino,a lucille angela nieverab and julie lyn hallb a department of family and community medicine, university of the philippines, philippine general hospital, taft avenue, manila, philippines. b office of the who representative in the philippines, sta cruz, manila, philippines. correspondence to lester sam geroy (email: lelim22@yahoo.com). to cite this article: espallardo n et al. a snapshot of catastrophic post-disaster health expenses post-haiyan. western pacific surveillance and response journal, 2015, 6(suppl 1):76–81. doi:10.5365/wpsar.2015.6.2.hyn_017 abstract introduction: this paper provides a snapshot of the health-care costs, out-of-pocket expenditures and available safety nets post-typhoon haiyan. methods: this descriptive study used a survey and document review to report direct and indirect health-care costs and existing financial protection mechanisms used by households in two municipalities in the philippines at one week and at seven months post-haiyan. results: reported out-of-pocket health-care expenses were high immediately after the disaster and increased after seven months. the mean reported out-of-pocket expenses were higher than the reported average household income (us$ 24 to us$ 59). discussion: the existing local and national mechanisms for health financing were promising and should be strengthened to reduce out-of-pocket expenses and protect people from catastrophic expenditures. longer-term mechanisms are needed to ensure financial protection, especially among the poorest, beyond three months when most free services and medicines have ended. preparedness should include prior registration of households that would ensure protection when a disaster comes. introduction the philippines is working towards universal health coverage (uhc), aiming to achieve equity of access to health care without its population suffering financial hardship. the country has a well-distributed public health care system that primarily serves lowand middleincome people, especially in rural areas. a strong private sector focused in urban areas primarily serves middleand upper-income population. the philippine health insurance corporation (philhealth) is the philippines’ social health insurance agency, and it currently provides coverage for inpatient and a few public health interventions, e.g. newborn screening, perinatal mother and child care and tuberculosis. efforts in the last five years have increased philhealth enrolment coverage from 62% in 2010 to 83% in 2014.1,2 a point-of-care enrolment policy was created in 2013 whereby eligible individuals are made automatic beneficiaries at the point of access to the health care system. a no-balance-billing policy, also created in 2013, mandates that no other fees be charged or paid by eligible patients in hospitals, aiming to reduce out-of-pocket expenses. currently, these policies only apply to the poor and vulnerable identified by the department of social welfare and development or by the hospitals’ social welfare offices.3 disasters and emergencies, such as typhoon haiyan that struck the central philippines in november 2013, increase poverty and the vulnerability of the poor.4 high out-of-pocket expenses for health care post-disaster can lead to poverty as observed in the philippines.5,6 poverty incidence among families in region 8 where haiyan had the greatest impact was already 37% (2012).7 the government had previously established provisions to strengthen social services to protect people from financial risk in emergencies. the republic act 8185 mandated that local governments allocate 5% of their internal revenue to a calamity fund to be used when a local or national state of calamity is declared. after typhoon haiyan, philhealth declared it would subsidize the health-care costs of typhoon-affected individuals (philhealth circular nos. 0034–2013 and 0006–2014).8–10 philhealth also allowed delivery of hospital reimbursements in advance of claims to enable rebuilding and rehabilitating health facilities (philhealth circular nos. 0004–2014 and 0024–2014).11,12 disaster literature on health needs, operations and service delivery are abundant; publications on out-of-pocket payments, financial risk protection and catastrophic health expenditures are also available. but there is a paucity of literature on health financing and financial risk protection in disaster and emergency settings and longer-term sustainable health financing efforts. this paper provides a snapshot of the health-care costs, out-of-pocket expenses and available safety nets post-haiyan, raising their potential impact as catastrophic health expenditure. costs and out-of-pocket expenses were examined during the response phase (one week after) and the transition to the recovery phase (seven months after). costs and out-of-pocket expenses reflect supplyand demand-side realities, e.g. availability of health services and safety nets. methods this descriptive study used interviews and reviews of hospital and philhealth documents to gather data on financial barriers to health care, direct and indirect health-care costs and existing financial protection mechanisms used by individuals. data gathering was conducted from 1 october to 30 november 2014 for information that covered the period of november 2013 (one week after haiyan) and june 2014 (seven months after). the two study sites – sta fe, leyte, and guiuan, eastern samar – were purposely selected for their economic status, access to philhealth-accredited health facilities and the presence of local and international aid. household interviews were conducted with 35 community respondents selected by purposive sampling, i.e. individuals who visited health centres and hospitals. our interviews aimed to identify (1) potential barriers to using health services; (2) actual health-care costs such as for laboratory tests, medicines and professional fees after philhealth benefits had been deducted; and (3) benefits from philhealth, conditional cash transfers and other safety nets applied post-haiyan. the respondents were categorized into two groups based on their monthly income: (1) less than or (2) more than us$ 94 per month. we reviewed hospital and philhealth data on claims and costs of health services, including professional fees, laboratories and medicines to validate the results. direct health-care costs were defined as the costs of labour, supplies, medicines and equipment to provide patient-care services. indirect health-care costs included non-medical components of obtaining health care including transportation, lodging and home services. once a household’s financial health-care contribution exceeded 40%, after subsistence needs had been met, it was considered a catastrophic health expenditure.13 results availability of funds for consultation and transportation were the main barriers to seeking health services. one week after haiyan, 23 of 35 respondents (66%) reported they had no money for transportation or medical consultations (table 1). table 1. barriers to utilization of health services, sta fe, leyte and guiuan, eastern samar, the philippines click to download table 1. jpg, 323kb the monthly family income in the study sites ranged from us$ 24 to us$ 59. the reported health-care costs one week post-hiayan ranged from zero, when free services were available, to that which exceeded monthly incomes, particularly for laboratory and medicines costs, even after philhealth subsidies and benefits were applied (table 2). financial barriers during the immediate phase were further aggravated by difficulty to access cash either from others, who also did not have cash; from local government; or from local banks. table 2. self-reported out-of-pocket expenses one week and seven months after typhoon haiyan, sta fe, leyte and guiuan, eastern samar, the philippines (n = 35)* click to download table 2. jpg, 444kb * all figures in us$ at exchange rate of us$ 1.00 = php 42.47 (2 june 2014). values without range represent those with only one respondent. in public health facilities, there was minimal out-of-pocket payment because of the no-balance-billing policy of philhealth. however, patients still had to purchase medicines and supplies if these were not available in these facilities. records confirmed out-of-pocket payments ranged between us$ 3 and us$ 21 for medicines. similarly, in private health facilities in guiuan, patients had to pay the excess amount outside philhealth coverage which ranged from us$ 11 to us$ 21. seven months after the emergency, the reported costs of health care had increased. these were highest for professional fees in sta fe and hospital stays in guiuan (us$ 393 and us$ 592, respectively). overall, higher out-of-pocket expenses were found in sta fe compared with guiuan. mean health-care costs, except laboratory and transportation, were higher than the average household income (us$ 24 to us$ 59), which suggests it was catastrophic health expenditure. one respondent had a major surgical procedure (us$ 1361). review of hospital records and philhealth reimbursements seven months after the typhoon confirmed the high costs. community insurance was the main source of financial assistance for health care (16/35 respondents, 46%). other sources were local government funds (9/35, 26%), philhealth reimbursement (8/35, 23%) and conditional cash transfer remittance (2/35, 6%). households also reported borrowing necessary funds from relatives and local cooperatives. financial assistance from local governments was usually granted upon request from authorities. there were no reports of blanket cash relief for affected households. among the 35 respondents, 20 were in the category earning an average monthly income of less than us$ 94, and 15 were in the group earning more than us$ 94. both groups self-reported similar proportions of philhealth membership (25–27%). a higher proportion of the poorest were registered under the national household targeting system for poverty reduction programme. however, the poorest received less support from local governments (30% versus 67%), and they had more out-of-pocket expenses, especially seven months after the typhoon (55% versus 47%) (table 3). table 3. declared philhealth and nhts membership, safety nets and out-of-pocket expenses incurred among the poorest and near-poor, sta fe, leyte and guiuan, eastern samar, the philippines (n = 35) click to download table 3. jpg, 430kb * us$ 94.00 cut off is based on minimum monthly income levels in region 8 from the department of labour and employment. lgu, local government unit; nhts, national household targeting system for poverty reduction; oop, out-of-pocket; and 4ps, pantawid pamilyang pilipino program. discussion this study showed that the self-reported costs of health care post-haiyan were high with consultation and transportation costs as the main barriers to health service utilization. out-of-pocket expenses, after philhealth benefits were deducted, particularly for professional fees and hospital stays, were alarming. because of the no-balance-billing policy, respondents using public facilities reported no costs; hence, out-of-pocket expenses and costs represented private hospital services. these high costs suggest catastrophic health expenditures. another survey in region 8 of 2766 postpartum women 11–13 months post-haiyan showed that both public and private prenatal care had an average cost of us$ 4 (range: us$ 0 to us$ 149), while the average cost of delivery was us$ 73 (range: us$ 0 to us$ 2191).14 families with the reported average monthly income of us$ 24 would be adversely affected by these health-care costs. interestingly, official sources reported a higher average income in region 8 than was reported in this study (us$ 314 monthly in 2009).7 we observed that out-of-pocket expenses increased over the seven months after haiyan. within one week, health services were available in public facilities (e.g. rural health units) as well as being provided by local or international nongovernmental organizations (ngos). essential medicines, when available, were also provided free of charge. this may explain why the reported out-of-pocket payments for professional fees and medicines were low at this time. by seven months, all hospitals and primary care facilities in the two study areas were back in operation, roads were repaired making travel easier and more cash was in circulation. however, most international and local ngos had left along with their free medicines. community insurance was the most accessed source of health financing at the local level in this study. local government funds were not significant sources of support and were commonly only accessed through direct request from government officials. this was confirmed by another study where only 11–17% of households in region 8 reported seeking assistance from the government, while 8–14% sought private assistance (ngo, charity, individuals or groups).15 there was no information on how the local calamity funds were being spent, what proportion was earmarked for health or whether they were distributed as relief fund to local residents. if the government is to be the main source of social safety nets post-disaster, mechanisms for implementation as well as the amount of investment required to mitigate catastrophic health expenditures need to be determined. the philippines does not yet have updated or localized costing on how much capitalization or investment is needed. this is closely linked to determining the amount required for blanket cash relief for health if the country (or any donor) wanted to use this mechanism post-disaster. both supply and demand interventions should be considered to enhance social safety nets for health post-emergency. new initiatives for uhc include expansion of philhealth enrolment through point-of-care and no-balance-billing policies, expansion of primary care benefits subsidized by philhealth, price regulation for case-based payments, upgrading of health facilities, augmenting the health workforce (doctors, nurses and midwives) in rural and isolated areas and enhancing the availability of medicines and reducing their cost. there is optimism that the country is on the right path. current data from 2008 to 2013 demonstrate the distribution of health insurance is becoming more pro-poor.16,17 however, findings from our study did not show preferential benefits of safety nets to the poorest. the government has increased its revenue for health through sin taxes, allowing it to subsidize 14.7 million new members.18 this descriptive study identified the patterns of costs, out-of-pocket expenses and safety nets during the response and the transition to recovery post-haiyan. limitations include a small sample size, reliance on self-reporting, recall bias as the survey was conducted seven months post-event, lost records and data gaps. no actual calculation of local health accounts was done. there was also no investigation on whether the costs were actually paid for from private funds or from government relief. conclusion when the next disaster hits the philippines, people should not incur out-of-pocket payments for health care. financial risk protection should be mainstreamed into preparedness, risk assessment, mitigation, planning, response and recovery plans. national and local policies and mechanisms for financial protection should clearly benefit the poorest. knowledge gaps in health-care financing in disasters include demand questions (e.g. rate of impoverishment because of health care post-disasters) and supply questions (e.g. disaster subsidies/loans for private hospitals). the health system will need to focus on supply mechanisms to ensure the availability of health services and medicines at no or minimal cost with safety nets for the poorest households. longer-term mechanisms are needed to ensure financial protection especially for the poorest beyond three months when the bulk of free services and medicines being provided by international responders end. preparedness should include an intensive drive to enrol households in social health insurance or other mechanisms to ensure protection when the next disaster comes. conflicts of interest none declared. funding none. acknowledgements we thank the staff of the hospitals and philhealth offices in sta fe, leyte and guiuan, eastern samar for granting interviews and review of philhealth documents. references official gazette: philhealth enrolment. pasay city, philippine health insurance corporation, 2014. available from: http://www.gov.ph/report/philhealth-enrolment/ [accessed 18 september 2015]. chapter 3: financial risk protection through the national health insurance program. in: national objectives for health 2011–2016. manila, department of health, 2012. available from: http://www.doh.gov.ph/sites/default/files/5%20chapter3.pdf [accessed 18 september 2015]. republic act no. 10606: an act amending republic act no. 7875, otherwise known as the “national health insurance act of 1995”, as amended, and for other purposes. manila, fifteenth congress of the philippines, 2013. available from: http://www.gov.ph/2013/06/19/republic-act-no-10606/ [accessed 18 september 2015]. philhealth circular no. 024–2012: entitlement to nhip benefits of all pantawid pamilyang pilipino program beneficiaries of the dswd (29 may 2012). pasig city, philippine health insurance corporation, 2012. available from: http://www.philhealth.gov.ph/circulars/2012/circ24_2012.pdf [accessed 18 september 2015]. shepherd a et al. the geography of poverty, disasters and climate extremes in 2030. london, overseas development institute, 2013. available from: http://www.odi.org/sites/odi.org.uk/files/odi-assets/publications-opinion files/8633.pdf [accessed 18 september 2015]. disaster-conflict interface: comparative experiences. france, bureau for crisis prevention and recovery, united nations development programme, 2011. available from: http://www.preventionweb.net/files/20432_20432undpdisaster conflictinterface2.pdf [accessed 18 september 2015]. national statistical coordination board. family income statistics. manila, philippine statistics authority, 2014. available from: http://www.nscb.gov.ph/secstat/ d_income.asp [accessed 18 september 2015]. manasan rg. expanding social health insurance coverage: new issues and challenges (discussion paper series no. 2011–21). manila, philippine institute for development studies, 2011. available from: http://dirp4.pids.gov.ph/ ris/dps/pidsdps1121.pdf [accessed 18 september 2015]. philhealth circular no. 0034–2013: guidelines on the provision of special privileges to those affected by a fortuitous event (15 november 2013). pasig city, philippine health insurance corporation, 2013. available from: http://www.philhealth.gov.ph/circulars/2013/circ34_2013.pdf [accessed 18 september 2015]. philhealth circular no. 0006–2014: supplement to philhealth circular 34, series of 2013: guidelines on the provision of special privileges to those affected by a fortuitous event including specific provisions for those affected by typhoon yolanda (24 january 2014). pasig city, philippine health insurance corporation, 2013. available from: http://www.philhealth.gov.ph/circulars/2014/ circ06_2014.pdf [accessed 18 september 2015]. philhealth circular no. 0004–2014: implementation of the interim reimbursement mechanism (irm) for health care institutions in areas directly affected by ‘super typhoon yolanda’ (28 january 2014). pasig city, philippine health insurance corporation, 2014. available from: http://www.philhealth.gov.ph/circulars/ 2014/circ04_2014.pdf [accessed 18 september 2015]. philhealth circular no. 0024–2014: implementation of the interim reimbursement mechanism (irm) for health care institutions in areas directly affected by ‘super typhoon yolanda’ (revision 1, 23 october 2014). pasig city, philippine health insurance corporation, 2014. available from: http://www.philhealth.gov.ph/ circulars/2014/circ24_2014.pdf [accessed 18 september 2015]. xu k et al. household catastrophic health expenditure: a multicountry analysis. lancet, 2003, 362:111–117. doi:10.1016/s0140-6736(03)13861-5 pmid:12867110 dayrit mm et al. assessing access to prenatal, delivery and postpartum services in the eastern visayas region, philippines: final technical report to the world health organization philippines. quezon city, ateneo center for health evidence, action and leadership (a-heals), 2015. ravago mlv et al. eastern visayas after yolanda: evidence from household survey. policy notes, 2014, 2014–05. available from: http://www.stat.upd.edu.ph/ docs/misc/pn%202014-5.pdf [accessed 18 september 2015]. ulep vg, de la cruz na. analysis of out-of-pocket expenditures in the philippines. manila, philippine institute for development studies, 2014> available from: http://dirp4.pids.gov.ph/webportal/cdn/events/ulep_oop%20analysis% 20ulep%20july%202.pdf [accessed 18 september 2015]. bredenkamp c, buisman l. financial risk protection in the philippines: what do we know? manila, philhealth international conference, 2015. available from: http://www.philhealth.gov.ph/2015intlconf/benefits/financialprotectioninthe philippineswhatdoweknow.pdf [accessed 18 september 2015]. a strong ally to achieve kp: 4 out of 5 filipinos now covered. the doh files, 2014, 1(3):1–2. available from: http://www.doh.gov.ph/sites/default/files/dohjuly.pdf [accessed 18 september 2015]. short report: 2014 pacific meeting on implementation of the international health regulations (2005) news adam t craig,a eric rafai,bf marcus samo,cf aaron oritaimae,df losii samseeg and eric j nillesa a world health organization, division of pacific technical support, suva, fiji. b fiji ministry of health, suva, fiji. c department of health, education and social affairs, pohnpei, federal states of micronesia. d ministry of health and medical services, honiara, solomon islands. e ministry of health, ngerulmud, palau. f meeting chairperson. g meeting rapporteur. correspondence to eric j nilles (email: nillese@wpro.who.int). from 24 to 26 november 2014, 44 delegates representing 20 of the 22 pacific island countries and areas, programme directors and technical experts from the world health organization (who) regional office for the western pacific and development partners met in the tranquil setting of denarau island, fiji to attend the third biannual pacific meeting on implementation of the international health regulations (2005). the pacific region covers one third of the earth and is home to approximately 11.4 million people (excluding australia and new zealand).1 pacific populations are dispersed over many thousands of islands and atolls that make up the region’s 22 countries and areas. fourteen pacific island countries are states parties to the international health regulations (ihr 2005),2 and eight are territories for which ihr (2005) responsibilities are delegated to other countries. as the title indicates, the meeting’s purpose was to discuss progress in meeting the global public health security objectives of ihr (2005) in the pacific, and to explore avenues to strengthen infectious disease (and other public health emergency) surveillance and response capacities required to achieve ihr (2005) compliance. the meeting’s programme was ambitious, aiming to provide delegates with an update on global public health infectious disease emergencies; to review the progress of pacific islands’ core capacity-building activities under the ihr (2005); to review the pacific syndromic surveillance system (psss) to identify its strengths and limitations; to explore the role of pacific public health surveillance network in supporting ihr (2005) implementation; and to recommend common ihr (2005) capacity-building priorities that focus over the 2014–2016 period. due to global concern about the ebola virus disease (evd) epidemic in west africa at the time of the meeting, specific discussion about evd preparedness was also included. finally, the meeting was an opportunity to undertake preliminary consultation with delegates about the future direction of the asia pacific strategy for emerging diseases (apsed)3 and the roadmap for ihr (2005) implementation in the western pacific. the first day of the meeting focused on global and pacific emerging and re-emerging infectious diseases. the discussion centred on the evd situation in west africa and the risk posed to populations in the pacific. who reiterated that the risk of evd importation to the pacific was low, however emphasized that the impact, if imported, would potentially be devastating and hence pre-emptive preparedness was encouraged.4 further, discussion about the emergence of zika and chikungunya viruses, and the re-emergence of dengue virus in the pacific islands in recent years was held.5 pacific island countries and areas were advised to prepare for ongoing transmission of all three arboviruses over the coming two to five years. the afternoon of day one was spent for reviewing the psss, the premier early warning surveillance system for infectious disease outbreaks used by countries and areas in the pacific. the psss is performing well and meeting ihr (2005) obligations for indicator-based early warning surveillance; however, it was noted that the event-based surveillance component of the system needs to be formalized and strengthened to ensure rapid identification of events that cannot be captured by the system’s indicator component. while increasing the number of psss reporting sites (to increase system coverage and function) was a topic of discussion, it was noted that given the resource limitations in most pacific islands, redistribution of human, material and financial resources for additional surveillance activities may affect other health programmes and therefore needs to be rationalized and justified. the second day of the meeting focused on enhancing pacific islands’ evd preparedness plans. delegates discussed key issues related to ebola virus epidemiology with who staff recently returned from west africa. time was allocated for peer discussion to refine national evd preparedness plans. the day concluded with a simulation exercise that reinforced the importance of national preparedness for major public health events, both for known and unknown nature. the third day of the meeting focused on future priorities for ihr (2005) core capacity-building in the pacific. delegates identified infectious disease surveillance and response; public health workforce development; and public health preparedness at international points of entry as the core capacity areas on which to focus in the period of 2014 to 2016. the meeting continued with a consultation on future directions of apsed and determination of its usefulness in the pacific. delegates expressed strong support and appreciation of apsed in endorsing the strategy as the leading framework for infectious disease and ihr (2005) public health core capacity-building. as a key outcome of the meeting, pacific island countries and development partners agreed to support the three priority ihr (2005) core capacity-building areas mentioned above; to work collaboratively for strengthening the psss, including enhancement of the event-based surveillance component of the system; and to continue to develop, test and refine national public health emergency preparedness and response plans. pacific islander delegates and partners articulated the value of ihr (2005) and apsed as a clear and logical framework within which national public health core capacity-building is, and will continue to be, developed in the pacific islands. other outcomes of the meeting are recorded in the meeting report available at http://www.wpro.who.int/emerging_ diseases/meetings/docs/report_pacificmeetingonihr_nov2014.pdf?ua=1. references: secretariat of the pacific community. pacific island populations – estimate and projections of demographic indicators for selected years. in: community sotp, editor. september 2013 ed. noumea, secretariat of the pacific community, 2013. international health regulations (2005) second edition. geneva, world health organization, 2008. available from: http://www.who.int/ihr/9789241596664/en/ [accessed 12 may 2015]. asia pacific strategy for emerging diseases: 2010. manila, world health organization regional office for the western pacific, 2011. available from: http://www.wpro.who.int/emerging_diseases/documents/docs/asped_2010.pdf [accessed 12 may 2015]. craig at et al. risk posed by the ebola epidemic to the pacific islands: findings of a recent world health organization assessment. western pacific surveillance and response journal 2015, 6(2). roth a et al. concurrent outbreaks of dengue, chikungunya and zika virus infections – an unprecedented epidemic wave of mosquito-borne viruses in the pacific 2012–2014. euro surveillance: european communicable disease bulletin, 2014, 19. pmid:25345518 which surveillance systems were operational after typhoon haiyan? field investigation report sheila tante,a eireen villa,a agnes pacho,a maria adona galvana and aura corpuzb a field epidemiology training program alumni foundation incorporated, department of health compound, sta cruz, manila, philippines. b office of the who representative in the philippines, sta cruz, manila, philippines. correspondence to sheila tante (email: epidoc_sheila@yahoo.com). to cite this article: tante s et al. which surveillance systems were operational after typhoon haiyan? western pacific surveillance and response journal, 2015, 6(suppl 1):66–70. doi:10.5365/wpsar.2015.6.2.hyn_015 abstract introduction: effective disease surveillance is vital for a successful disaster response. this study assessed the functionality of the three disease surveillance systems used post-haiyan: philippine integrated disease surveillance and response (pidsr), event-based surveillance and response (esr) and surveillance in post extreme emergencies and disasters (speed). methods: a survey of 45 government health officers from affected areas was conducted in march 2014. the survey documented when each of the systems was operational and included questions that ranked the functionality of the three surveillance systems and whether they complemented each other. results: two of 11 (18%) surveillance units had an operational speed system pre-event. pidsr and esr remained operational in five of 11 (45%) surveillance units without interruption of reporting. ten surveillance units (91%) rated pidsr as functional post-typhoon; eight (72.7%) considered esr functional. speed was rated as functional by three (27%) surveillance units. seven of 11 (63.6%) surveillance units rated the three systems as being complementary to each other. discussion: in most of the areas affected by typhoon haiyan, the routine surveillance systems (pidsr and esr) were not disrupted; although, in leyte it took seven weeks for these to be operational. although speed is recommended for activation within 48 hours after a disaster, this did not occur in most of the surveyed areas. most of the surveillance units rated pidsr, esr and speed to be complementary to each other. introduction disease surveillance is an integral part of health emergency and disaster management as it allows for the early detection of epidemic-prone diseases for timely and appropriate response, prevention and minimizing morbidity and mortality.1 in the philippines, the department of health (doh) redesigned the existing disease surveillance mechanisms into the philippine integrated disease surveillance and response (pidsr) system in 2008.2 pidsr is a casebased surveillance system for the routine reporting of 11 identified diseases on a daily basis (category 1) with another 14 reported weekly (category 2).3 the event-based surveillance and response (esr) system was established in 2010 to complement pidsr and includes the reporting of events not captured by other systems. esr can capture rare, unusual or unexpected events with formal reporting through a reporting system, media, health workers or nongovermental organizations (ngos); or informally through rumours, phone calls or text messages.2 in 2010, the doh-health emergency management bureau, with assistance from the world health organization (who), introduced surveillance in post extreme emergencies and disasters (speed). this electronic-based surveillance mechanism was specifically designed for use during an emergency or disaster. it captures data on 21 communicable and noncommunicable syndromes with case definitions that are different from the regular surveillance systems.4 data are collected by speed coordinators and surveillance officers from health units and sentinel sites specific to the disaster and are reported daily using a structured reporting mechanism. speed was activated in region 6 in october 2013 when the provinces of cebu city and bohol were hit by an earthquake. as speed includes syndromes of certain conditions, the reporting should be faster than the routine schemes. once speed has been activated, it continues to operate until conditions return to routine levels. after typhoon haiyan hit the philippines on 8 november 2013, these three surveillance systems were compromised as several health facilities were destroyed and most key health personnel were victims. this study aimed to determine which of the three disease surveillance systems were operational, as well as their functionality and whether they complemented each other for the six months post-haiyan. methods in march 2014, we conducted a survey of 45 government health officers who represented cities, municipalities and provinces from regions 6, 7 and 8 – the areas worst hit by haiyan. doh regional and central counterparts at the local level also participated in the survey; almost half (49%) were health emergency management coordinators, speed coordinators and pidsr-esr surveillance officers. the survey assessed the three disease surveillance systems for the period each was operational, their functionality and whether they complemented each other. we asked the participants to assess functionality in the context of the following attributes: (a) the simplicity of the system while being able to meet its objectives; (b) its flexibility to accommodate (e.g. new events); (c) the completeness and validity of the data recorded; (d) sensitivity to detect outbreaks and monitor changes; and (e) timeliness between steps in a public health surveillance system.5 for leyte and tacloban city, functionality was assessed over two time periods which corresponded to when pidsr and esr were not operational (november to december 2013) and when they were operational (january 2014 onwards). functionality was ranked using a likert scale of 1 to 5 where 1–2 was not functional, 3 neutral and 4–5 functional. we also asked the participants to consider whether the three systems complemented each other post-haiyan. responses were also measured using a likert scale of 1 to 5 where 1–2 was not complementary, 3 neutral and 4–5 complementary. results the operation of the three disease surveillance systems varied post-haiyan by region and province/cities (table 1). two of 11 (18%) surveillance units (region 7 and capiz) had an operational speed system pre-haiyan. capiz activated speed one day before landfall and region 7 had speed ongoing as a 7.2 magnitude earthquake had struck the province of bohol three weeks prior. of the remaining nine surveillance units, eight (89%) had speed operational within one week post-haiyan, and one (11%) was operational within seven weeks (leyte). table 1. disease surveillance systems by reported operational status and week post-haiyan, the philippines, 2013–2014 click to download table 1. jpg, 530kb esr, event-based surveillance and response; pidsr, philippine integrated disease surveillance and response; and speed, surveillance in post extreme emergencies and disasters. pidsr and esr remained operational in five of 11 (45%) surveillance units without interruption of reporting. one (9%) surveillance unit had no interruption of esr, but pidsr was suspended until six weeks post-haiyan. the hardest hit areas, leyte and tacloban city, had variable interruptions of pidsr and esr surveillance activity. in leyte, limited reporting was back online one week post-haiyan. in tacloban city, pidsr and esr activities were suspended until seven weeks post-haiyan. in tacloban city, speed was operational one week post-haiyan; in leyte, speed was operational seven weeks post-haiyan. deactivation of speed occurred 17 weeks post-haiyan in most (7/11) surveillance units. the number of weeks of activation ranged from 7 to 17 weeks (mean 15 weeks). ten of 11 (91%) surveillance units rated pidsr as functional post-typhoon. eight (73%) considered esr functional. speed was rated functional by three (27%) surveillance units (table 1). in leyte and tacloban city, pidsr and esr were rated separately for functionality from november to december and january onward as their situations changed. in the first period, both rated the three systems to be not functional. in january and onward, leyte rated the functionality as neutral for both pidsr and esr, and speed as not functional. tacloban city rated the three surveillance systems as functional at this time (table 2). table 2. reported functionality of the disease surveillance systems post-haiyan, the philippines, 2013–2014 click to download table 2. jpg, 474kb esr, event-based surveillance and response; pidsr, philippine integrated disease surveillance and response; and speed, surveillance in post extreme emergencies and disasters. * < 1–2 – not functional; 3 – neutral; and 4–5 – functional. † 1–2 – not complementary; 3 – neutral; and 4–5 – complementary. ‡ two time periods were reported: november to december 2013 and january 2014 onwards. seven of 11 (63.6%) surveillance units reported that the three systems were complementary to each other post-haiyan. four (30.7%) rated the three systems as neutral and two (15.3%) rated them as less complementary to each other. discussion this study shows that in most of the surveillance units in the areas affected by typhoon haiyan, the routine surveillance systems (pidsr and esr) were not disrupted. the disruption in the routine surveillance systems in other areas lasted for only one week post-impact except in leyte and tacloban city where it took seven weeks to activate routine surveillance. the delay was due to the extent of the devastation after haiyan due to power and network failures as well as unavailability of surveillance officers who were typhoon victims themselves. region 6 had less disruption in the operations of the two systems compared to region 8, which could be related to the magnitude of the devastation in the latter that reduced the ability to continuously perform routine surveillance activities.6 almost all of the surveillance units had delayed activation of speed – which is recommended to be activated 48 hours after a disaster as per the guidelines.4,7 despite extensive damage to the region 8 health office, tacloban city and eastern samar did activate speed the week immediately after haiyan. this could be attributed to the haste at which emergency assistance was delivered by the national health office; other unaffected regional health offices; and from several international organizations.8 in leyte, speed was activated seven weeks after haiyan because the health facilities were severely damaged, most of the health workers were affected and there was a threat to the peace and order in the area. most of the surveillance units rated the routine surveillance systems as being functional, but few reported speed as functional. some respondents were not confident of the functionality of speed because they had encountered various difficulties upon its application. some of the difficulties – lack of proficiency in performing the syndromic approach and reverting to paper-based reporting due to power and network failures – have been reported previously for other similar systems.9 the majority of respondents reported that speed complemented pidsr and esr in such a manner that it guided the health officers to verify and validate the particular syndromes and the areas affected for possible outbreaks. although esr was functional also, events were not reported, most likely because this system also employs a syndromic approach similar to speed. one limitation of this study is that the responses were subjective; therefore, different respondents may have different interpretations of functionality and whether the systems were complementary. in this study, we observed that routine surveillance systems can function even after a disaster and more so when health infrastructures are less damaged. speed could be a useful disease surveillance system in future disasters or emergencies but may require better training among field workers. speed should not replace pidsr and esr as such systems can supplement the other two by rapidly generating reports from health units. emphasis in disaster preparedness to establish the needed capability proficiency in health units to ensure the functionality of speed is required. we recommend refresher courses, simulations and on-site mentoring on speed to enhance the surveillance and health officer’s capabilities. conflicts of interest none declared. funding this study was funded by who. acknowledgements we express our gratitude for the full support and cooperation of all pidsr-esr surveillance officers, health emergency management bureau and speed coordinators as well as all the health managers/officers from the national, regional and local government health offices in making this post-incident evaluation of disease surveillance systems possible. references united states center for disease control and prevention (cdc). rapid health response, assessment, and surveillance after a tsunami thailand, 2004–2005. mortality and morbidity weekly report, 2005, 54:61–64. manual of procedures for the philippine integrated disease surveillance and response. third edition. manila, national epidemiology center, department of health, 2014. gallardo fdl et al. an assessment of the case notification system 16 months after typhoon haiyan in region 8, the philippines. western pacific surveillance and response journal, 2015, 6(suppl 1):71–75. doi:10.5365/wpsar/2015.6.2.hyn_002 manual of procedures for surveillance in post extreme emergencies and disasters. manila, department of health, philippines 2010. klaucke dn et al. guidelines for evaluating surveillance systems. mortality and morbidity weekly report, 1988, 37(s-5):1–18, available from: http://www.cdc.gov/mmwr/preview/mmwrhtml/00001769.htm [accessed 1 october 2015]. uscher-pines l et al. framework for the development of response protocols for public health syndromic surveillance systems: case studies of 8 us states. disaster medicine and public health preparedness, 2009, 3 suppl:s29–36. doi:10.1097/dmp.0b013e31819f4483 pmid:19491585 buehler jw et al. situational uses of syndromic surveillance. iosecurity and bioterrorism, 2009, 7:165–177. doi:10.1089/bsp.2009.0013 pmid:19635001 peiris s et al. is registration of foreign medical teams needed for disaster response? findings from the response to typhoon haiyan. western pacific surveillance and response journal, 2015, 6(suppl 1):29–33. doi:10.5365/wpsar.2015.6.2.hyn_014 ridpath ad et al. challenges to implementing communicable disease surveillance in new york city evacuation shelters after hurricane sandy. public health reports (washington, d.c.), 2012, (january–february):2015. underreporting of influenza outbreaks in aged care facilities in south western sydney, australia, 2014 brief report leng boonwaat,a stephanie fletcher-larteya and stephen conatya a public health unit, south western sydney local health district, new south wales, australia. correspondence to leng boonwaat (email: leng.boonwaat@sswahs.nsw.gov.au). to cite this article: boonwaat l et al. underreporting of influenza outbreaks in aged care facitilities in south western sydney, australia, 2014. western pacific surveillance and response journal, 2016, 7(1):31–33. doi:10.5365/wpsar.2015.6.3.001 introduction in 2014, influenza activity was high in new south wales (nsw), australia, and 21 443 people were hospitalized with a diagnosis of influenza-associated pneumonia. this translates to a rate of 252.4 cases per 100 000 population. more than 18 000 cases of laboratory-confirmed influenza were reported in nsw. the majority were influenza a, dominated by a/h3n2 subtype. there were also 111 influenza outbreaks in aged care facilities (acfs) reported in nsw in 2014, the highest number on record.1 elderly residents in acfs experience high rates of morbidity and mortality during influenza outbreaks. they are at increased risk of developing complications due to underlying diseases.2 these residents also have an increased risk of infection because of the institutional environment they share with many other residents and staff. furthermore, impaired oral intake, limited dexterity and altered consciousness may limit treatment options when they are infected.3 the australian government’s department of health and ageing (dha) has issued specific guidelines for prevention and control of influenza outbreaks in residential care facilities.4 while acfs have primary responsibility for managing outbreaks, public health units (phus) are required to promote acf compliance with these guidelines and facilitate delivery and administration of antivirals. however, effective influenza prophylaxis and other timely interventions can only occur if phus are notified in a timely manner.5 dha guidelines indicate influenza outbreaks in acfs are to be reported to phus.4 however, under nsw public health legislation, reporting of outbreaks in acfs is not mandatory.6 in this report we investigated whether there were outbreaks that were not reported to the south western sydney local health districts phu during the 2014 influenza season. methods new south wales notifiable conditions information management system (ncims) influenza is a laboratory-notifiable disease in nsw.7 influenza cases are confirmed by viral culture or polymerase chain reaction from nasopharyngeal aspirates or nose and throat swabs. in acfs, samples are taken by either nursing staff or attending medical officers or taken during hospital admission. results are electronically notified to the ncims from corresponding laboratories. definition of influenza outbreak dha guidelines4 define an influenza outbreak as: three or more epidemiologically linked cases of influenza-like illness (ili) in residents or staff of the facility within a period of 72 hours, plus at least one case having a positive laboratory test, or at least two having a positive point-of-care test. ili is defined as sudden onset of fever (body temperature ≥38 °c) plus cough and/or other respiratory symptoms (e.g. shortness of breath) plus one or more systemic symptom(s) (fatigue, muscle soreness, headache). for a conservative estimate, we use three or more confirmed cases of influenza in residents or staff of the facility (by either laboratory or point-of-care test) to define an influenza outbreak for analysis. study population and data analysis notifications of influenza among residents of south western sydney local health district that were reported to the ncims during 2014 were extracted and stratified by age. those aged 65 years or above were selected for further analysis. the selected cases with residential addresses corresponding to the acfs in nsw were identified. these acfs were then cross-referenced with a database of influenza outbreaks reported to the phu in 2014 for comparison. data analysis was conducted using the statistical analysis software (sas institute, cary, north carolina, usa). qualitative assessment informal interviews with facility managers were conducted by phu staff on an ad hoc basis to understand the managers’ knowledge of outbreak recognition and what factors should trigger a notification. results the results revealed that 139 of 549 laboratory-confirmed influenza cases aged 65 years or above had originated from 32 known acfs. eight acfs with one or more confirmed cases (range 2–16 cases) reported their cases to the phu. twenty-four acfs with one or more confirmed cases did not report their cases to the phu (range 1–16 cases). there were 14 acfs with three or more confirmed cases of influenza. only seven of them (50%) reported the influenza outbreaks appropriately (table 1). a delay of one to four days occurred between onset of ili and notification to the phu. table 1. number of acfs (and cases) reporting and not reporting influenza outbreaks to the south western sydney local health district phu for laboratory-confirmed cases of influenza (age 65 years or above), australia, 2014 click to download table 1. jpg, 303kb acfs, aged care facilities; phu, public health unit. informal interviews were conducted with managers from five acfs that reported ili among residents before june 2015. results revealed that although all managers (n = 5) were aware of the need to report an outbreak, some were unsure what number of cases constituted an outbreak and others did not know when to report. in some cases, managers believed they had to wait for the laboratory confirmation before notifying the phu. high workload was also a reason given for delays in reporting. discussion the results revealed that half of acfs that should have reported an influenza outbreak did not do so. this is similar to a british survey where only 20% (n = 34) of all local health protection units were formally notified of ili occurring within acfs.8 it is unclear whether acfs were cognizant of the influenza outbreak definition in the dha guidelines.4 feedback from facility managers indicated that various factors could have contributed to delays in notification. nonetheless, delays in identification and notification of influenza outbreaks in acfs have led to difficulties in containing the spread of influenza. these challenges with influenza outbreak reporting are not unique to the south western sydney local health district. other phus have reported fear of bad publicity as another reason for delays in notification by acfs.9 factors such as awareness of outbreak definitions and the assumption that laboratory confirmation should occur before notification can be corrected with improved education and training provided by the phu before the annual influenza season. limitations of the study include the reliance on information provided by facility managers with potential recall bias and laboratory reporting. unreported outbreaks of ili may have occurred for which laboratory testing was never done. also, reported acf outbreaks of ili may never be classified as influenza outbreaks because of insufficient testing. phu staff do not have the resources to routinely conduct onsite investigations and testing for every reported acf outbreak of ili. the study suggests that phus should ensure that acfs understand the dha guidelines, specifically the importance of the epidemiological link between cases and influenza outbreaks. reminders and education sessions should be issued to acfs before the beginning of influenza seasons to ensure acf facility managers are able to recognize outbreaks and provide timely notifications to phus. furthermore, it may be useful for phus to conduct influenza preparedness activities, possibly in the form of desktop exercises. conflicts of interest none declared. funding none. acknowledgements the authors would like to acknowledge all phu staff involved in managing acf-based influenza outbreaks. references communicable diseases branch. influenza monthly epidemiology report, nsw: december 2014 (including a summary for the year 2014). sydney, new south wales, ministry of health, 2014. available from: http://www.health.nsw.gov.au/infectious/ influenza/documents/2014/december-report.pdf [accessed 24 february 2016]. sayers g et al. high morbidity and mortality associated with an outbreak of influenza a(h3n2) in a psycho-geriatric facility. epidemiology and infection, 2013, 141:357–365. doi:10.1017/s0950268812000659 pmid:22672856 mossad sb. influenza in long-term care facilities: preventable, detectable, treatable. cleveland clinic journal of medicine, 2009, 76:513–521. doi:10.3949/ccjm.76a.09022 pmid:19726556 communicable disease network australia. a practical guide to assist in the prevention and control of influenza outbreaks in residential care facilities in australia. canberra, department of health and ageing, 2009. available from: http://www.health.gov.au/internet/main/publishing.nsf/content/27be697a7f bf5ab5ca257bf0001d3ac8/$file/a%20practical%20guide%20seasonal% 20flu%20in%20rcfs%2012%20jun%2009.pdf [accessed 24 february 2016]. rosewell a et al. surveillance for outbreaks of influenza-like illness in the institutionalized elderly. epidemiology and infection, 2010, 138:1126–1134. doi:10.1017/s0950268809991440 pmid:20018130 public health act 2010 no. 127. new south wales parliament, 2010. available from: http://www.legislation.nsw.gov.au/inforcepdf/2010-127.pdf?id=e20f1d11-6a0d-ec9a-fe79-d31ae57c52c3 [accessed 24 february 2016]. disease reporting laboratories. new south wales health, 2013. available from: http://www.health.nsw.gov.au/infectious/documents/2013-labs-notify.pdf [accessed 24 february 2016]. gupta rk et al. public health responses to influenza in care homes: a questionnaire-based study of local health protection units. journal of public health (oxford england), 2007, 29:88–90. doi:10.1093/pubmed/fdl082 pmid:17237477 turahui j et al. 2008. lessons from a respiratory illness outbreak in an aged-care facility. new south wales public health bulletin, 2004, 19:153–156. doi:10.1071/nb07083 seroprevalence survey of avian influenza a(h5n1) among live poultry market workers in northern viet nam, 2011 original research tham chi dung,a pham ngoc dinh,a vu sinh nam,b luong minh tan,a nguyen le khanh hang,a le thi thanha and le quynh maia a national institute of hygiene and epidemiology, hanoi, viet nam. b department of preventive medicine, ministry of health, hanoi, viet nam. correspondence to le quynh mailom9@nihe.org.vn or lom9@hotmail.com). to cite this article: tham cd et al. seroprevalence survey of avian influenza a(h5n1) among live poultry market workers in northern viet nam, 2011. western pacific surveillance and response journal, 2014, 5(4):21–26. doi:10.5365/wpsar.2014.5.2.006 abstract objective: highly pathogenic avian influenza a(h5n1) is endemic in poultry in viet nam. the country has experienced the third highest number of human infections with influenza a(h5n1) in the world. a study in hanoi in 2001, before the epizootic that was identified in 2003, found influenza a(h5n1) specific antibodies in 4% of poultry market workers (pmws). we conducted a seroprevalence survey to determine the seroprevalence of antibodies to influenza a(h5n1) among pmws in hanoi, thaibinh and thanhhoa provinces. methods: we selected pmws from five markets, interviewed them and collected blood samples. these were then tested using a horse haemagglutination inhibition assay and a microneutralization assay with all three clades of influenza a(h5n1) viruses that have circulated in viet nam since 2004. results: the overall seroprevalence was 6.1% (95% confidence interval: 4.6–8.3). the highest proportion (7.2%) was found in pmws in hanoi, and the majority of seropositive subjects (70.3%) were slaughterers or sellers of poultry. discussion: the continued circulation and evolution of influenza a(h5n1) requires comprehensive surveillance of both human and animal sites throughout the country with follow-up studies on pmws to estimate the risk of avian–human transmission of influenza a(h5n1) in viet nam. introduction highly pathogenic avian influenza a(h5n1) viruses re-emerged in south-eastern asia in 2003, and these viruses continue to circulate widely among domestic poultry in the region.1 numerous outbreaks of influenza a(h5n1) viruses have occurred, with limited transmission to humans and as of yet unclear potential for sustained human-to-human transmission. however, the continuing evolution and genetic diversification of influenza a(h5n1) viruses is worrying since as few as four amino acid changes are necessary to render the viruses transmissible between ferrets, reinforcing the ongoing pandemic threat from these viruses.2–4 in viet nam, as of july 2014, there have been 127 human cases of influenza a(h5n1) infection with 63 deaths. since the influenza a(h5n1) epizootic first began in viet nam in 2003, three main clades have circulated and been associated with human infections (clades 1, 2.3.4 and 2.3.2.1).1,5 contact with sick or dead poultry has been consistently identified as a risk factor for human influenza a(h5n1) infection, and live poultry markets have been shown to be important locations for amplifying influenza a(h5n1) virus transmission.6,7 an antibody seroprevalence study conducted among 200 poultry market workers (pmws) in hanoi in 2001 detected antibodies against influenza a(h5n1) virus in 4% of subjects,8 suggesting that there were human infections with influenza a(h5n1) before the first case was officially confirmed.9 in addition, subclinical, asymptomatic or mildly symptomatic cases were reported during outbreak investigations.9–11 similarly, seroprevalence studies have been conducted in thailand, cambodia and indonesia as part of comprehensive outbreak investigations to evaluate key clinical, epidemiological and serological aspects related to human influenza a(h5n1) infections. to assess if exposure to influenza a(h5n1) viruses among pmws has changed over this period, we conducted a seroprevalence study among pmws in three provinces of northern viet nam in 2011. materials and methods sample and protocol a cross-sectional seroprevelance study was conducted among adult workers at five markets selling live poulty in the provinces of hanoi, thaibinh and thanhhoa in northern viet nam. sample size was estimated based on a reported seropositive rate of 4% among pmws in hanoi in 2001,9 with a confidence level of 95% and 1.5% confidence interval (ci) ranging from 2.45% to 5.55%. to account for uncooperative participants and unqualified samples, a total of 600 samples were estimated for this study. live poultry markets were eligible if their regular number of poultry sellers exceeded 100 individuals and they were located in a large city with a history of laboratory-confirmed cases of human influenza a(h5n1) infection. with the support of local government, 11 poultry markets were nominated. five markets from three provinces were then randomly selected. individual participants were eligible if they were aged 18 years or older, currently a trader or slaughterer of live poultry (including waterfowl) and had worked for a minimum of six months in a live poultry market. we enrolled subjects, sampling market to market, until the required number of participants were recruited. a questionnaire was used to collect information on demographic characteristics and potential occupational risk factors for exposures to influenza a(h5n1). the variables of age, gender, education history, medical history, province of occupation and poultry-related occupational risk exposures were collected. all participants were interviewed face to face. data were entered into epidata v3.1 and analysed using stata v11. frequencies were calculated with a 95% ci. seroprevalence among workers was compared across the potential variables using the pearson’s chi-squared test or using fisher exact test if any observed value was less than five. mean values were compared using a t-test to assess whether any differences observed were statistically significant at 95% ci. all participants were asked to provide 5 ml of venous blood to determine serum antibody concentrations against influenza a(h5n1) viruses. samples were transported by car in ice boxes at 4 °c to the national influenza center at the national institute of hygiene and epidemiology (nihe) in hanoi within 24 to 48 hours of collection. sera was used after centrifugation of whole blood at nihe (2500 rpm for 15 minutes) and were aliquoted and stored at −70 °c until testing. serologic assays the participants’ sera were tested for antibodies to influenza a(h5n1) viruses by horse haemagglutination inhibition assay (hhi) and microneutralization assay (mn) at nihe following the us centers for disease control and prevention protocols. all three clades of influenza a(h5n1) virus that have cirulated in viet nam since 2004 were used because the antigenic diversity of influenza a(h5n1) viruses may alter the sensitivity of assays to detect strain-specific antibodies. the influenza a(h5n1) viruses used were cultured from selected vietnamese patients with positive reverse transcription polymerase chain reaction (rt–pcr) assays for clade 1 in 2005 (a/viet nam/hn30408/2005), clade 2.3.4 in 2007 (a/viet nam/hn31244/2007) and clade 2.3.2.1 in 2011 (a/viet nam/cm32/2011). due to the unknown pathogenic potential of avian/human viruses, all tests involving live virus were conducted in animal-biosafety level 3 and biosafety level 3 laboratories. the hhi assays were performed as described elsewhere12 using reference antisera treated with receptor-destroying enzyme before testing. serum samples were tested at a starting dilution of 1:10 using eight haemagglutinating units of virus and 1% volume/volume horse erythrocytes. all viruses were inactivated by 1% β propiolactone before use. hhi titres were read up to 60 minutes after the addition of erythrocytes and reported as the reciprocal of the highest serum dilution causing complete inhibition of agglutination. results were accepted if negative sera and horse erythrocytes cell controls provided the correct non-agglutinated pattern. samples that were negative by hhi assay in the lowest dilution (1:10) and samples resulting in hhi titres ≥40 were tested against the three influenza a(h5n1) clades by mn assay. mn assays were performed according to world health organization (who) protocols, using 100 x tcid50 of live viruses as above.12,13 virus was incubated with twofold serial dilutions of sera starting at 1:10 and then incubated with mdck cells (madin-darby canine kidney cells-american type culture collection-atcc, united states of america) overnight before virus quantitation by enzyme-linked immunosorbent assay (elisa) to detect influenza nucleoprotein. the titre was reported as the reciprocal of the highest dilution that reduced infection by at least 50%. the who seropositive criteria for an influenza a(h5n1)-confirmed case in single serum collected at day 14 or later of symptom onset is an hhi titre >160 and an mn titre >80.14 however, this is not appropriate for seroprevalence studies as the participants are not suspected influenza a(h5n1) patients. in fact, the consortium for the standardization of influenza seroepidemiology has not yet devised positive criteria for influenza a(h5n1) assays.7 for our study, a sample was considered seropositive for influenza a(h5n1) virus antibody if an hhi titre ≥80 and an mn titre ≥20 were obtained in duplicate hhi and mn tests with any influenza a(h5n1) clade. the clades of seropositive samples were classified based on the highest antibody titre by comparison between three clades.13 the study protocol was approved by the institutional review board of nihe. participation was voluntary and all subjects provided written informed consent to participate in the study. results characteristics of study population a serum sample was collected from 607 pmws during four months (september to december 2011). of those, 305 samples (50.3%) were from hanoi, 169 samples (27.8%) from thaibinh and 133 samples (21.9%) from thanhhoa.the mean duration of working in a live poultry market was 7.7 years (95% ci: 7.1–8.2) and ranged from six months to 36 years. the mean age of participants was 42.3 years (95% ci: 41.4–43.2) with a range of 18 to 74 years, and 214 (35.3%) were male. almost two thirds (62.6%) reported that they were sellers or slaughterers of live poultry, with 37.4% being breeders, transporters and others (veterinarians, drivers, feather collectors, cleaners and market managers). a total of 79 (13.1%) participants reported having a chronic medical condition (hypertension, diabetes, hepatitis). there were 555 (91.4%) participants who had an education level to high-school standard or higher (table 1). table 1. characteristics of pmws seropositive for influenza a(h5n1), northern viet nam, 2011 (n = 607) click to download table 1. jpg, 478kb ci, confidence interval. * breeders, transporters, veterinarians, feather collectors, cleaners and market managers. seroprevalence of h5 antibodies there were 37 participants seropositive for (21.9%), giving an overall seropositive rate of 6.1%; (95% ci: 4.6–8.3). of the 37 seropositive samples, 24 were seropositive to clade 2.3.4, two were seropositive to clade 2.3.2.1 and 11 were seropositive to both (table 2). by province, the proportion of seropositives was 7.2% (95% ci: 4.3–10.1) for hanoi, 5.3% (95% ci: 1.9–8.7) for thaibinh and 4.5% (95% ci: 0.9–8.0) for thanhhoa; these differences were not statistically significant (p = 0.49) (table 1). table 2. seropositive participants by influenza a(h5n1) clade and province, northern viet nam, 2011 click to download table 2. jpg, 239kb by age, the highest proportion of seropositivity was in the 25 to 34 year old age group (8.9%, 95%ci: 3.8–13.9) although there was no statistically significant difference across the four age groups (p = 0.46). there was also no statistically significant difference by sex (p = 0.99), education level (p = 0.48) or chronic medical condition (p = 0.55) (table 1). by occupation, the proportion seropositive was higher in slaughterers and sellers compared with all others but this was not significant (8.2% compared with 2.6%, p = 0.06) (table 1). discussion our study identified 37 (6.1%) pmws seropositive for influenza a(h5n1) clade 2.3.4 and clade 2.3.2.1 viruses; these clades were predominant in northern viet nam from 2005 to 2013.15–17 while clade 1 also circulated in viet nam from 2003 to mid-2005,18 no pmws seropositive for clade 1 was identified in our study. this was unexpected as some of the workers in our study would have been working when this clade was circulating. our sample of pmws were from hanoi, thaibinh and thanhhoa where a large number of human influenza a(h5n1) infections have been reported since 2004.6,18 although studies conducted in 2004 in viet nam and thailand did not identify contact with healthy poultry as a risk factor of influenza a(h5n1) exposure,6 a study among pmws in hanoi in 2001 showed a 4% seroprevalence of influenza a(h5n1) clade a/goose/viet nam/113/2001.8 circulation of influenza a(h5n1) in healthy ducks in viet nam1 demonstrated the possible risk of influenza a(h5n1) infection among persons exposed to healthy poultry in viet nam. in our study population, the working duration of pmws was an average of 7.2 years (range from six months to 36 years). it is possible then that some of the workers in the study may not have been exposed to the clade 1 virus. that 11 participants were positive for both clade 2.3.4 and clade 2.3.2.1 may have been due to cross-reactivity, coinfections or reinfections since co-circulation of these clades was identified in 2010.12 we found no statistically significant difference in the proportion of seropositive pmws between the three different geographical study areas, which suggests the working conditions or occupational habits of pmws are similar in these areas. our study found a higher seropositive rate among pmws in hanoi compared to a seroprevalence study conducted in 2001 (7.2% compared with 4.0%), which might be due to the spread of influenza a(h5n1) in viet nam occurring after late 2003.15 we found a higher seropositive proportion in slaughterers and sellers compared with the other occupational groups; this is consistent with studies from china, thailand and bangladesh that showed that people who work directly with poultry are more likely to have been exposed to avian influenza a(h5n1).9,15 a 2010 survey of live bird markets in viet nam found 3.3% of poultry samples tested were positive for influenza a(h5n1) by rt–pcr (personal communication: john weaver, viet nam avian and human influenza control and preparedness project). a survey of healthy ducks in northern viet nam in 2006 concluded that while influenza a(h5n1) viruses were not detected in any throat or cloacal swabs, serological analyses suggested that ducks were infected with influenza a(h5n1) viruses in the absence of any recognized outbreak.11 that our study demonstrated seropositivity to influenza a(h5n1) viruses in all groups of poultry workers suggests that preventive measures such as personal protective equipment and vaccination for pmws are needed. our criteria for seropositivity were modified from the who criteria for detection of influenza a(h5n1) infection by serological testing. the who criteria are for confirming suspected cases of influenza a(h5n1) and seems not to be practical or sensitive enough for serological surveillance studies since antibody titres against influenza a(h5n1) begin to decrease six to 12 months after exposure and may disappear.20 we selected a seropositive cutoff titre of hhi ≥80 and mn titre ≥20 since mn’s sensitivity is reduced (less than 80%) for adults21 and all pmws enrolled in our study were at least 18 years old. previous comparisons have shown that horse red blood cells hhi assays have high reliability and good agreement with mn assays.22 using our cutoff titre might have resulted in an overestimate of the seroprevalence and these cutoffs should be tested with more seroprevalence studies in control populations where influenza a(h5n1) has not yet been detected. further development of standard criteria for prevalence of antibodies against influenza a(h5n1) is needed for future studies.7 there may have been some misclassification in the reporting of occupational exposures in this study as pmws may not have accurately recalled these exposures over a long period of time. it is also possible that participants may have had more than one poultry-related occupation during their exposure period. the results of our study, that 6.1% of pmws in northern viet nam were seropositive for influenza a(h5n1), may not be representative of all pmws in viet nam. collecting further epidemiological information (using personal protective equipment; contact duration, influenza vaccination) may also be useful. the results of our study would be more convincing if control groups (vegetable, fruit and seafood sellers working in the same market with pmws) were included or a follow-up study was conducted. despite these limitations, our study has shown that 6.1% of pmws in northern viet nam are seropositive for influenza a(h5n1). the continued circulation and evolution of influenza a(h5n1) requires comprehensive surveillance of both human and animal sites throughout the country with follow-up studies on pmws to estimate the risk of avian–human transmission of influenza a(h5n1) viruses in viet nam. conflicts of interest none declared. funding none. acknowledgement we thank the preventive medical center (pmc) of hanoi, pmc thaibinh and pmc thanhhoa. the study was funded by viet nam avian and human influenza control and preparedness project, ministry of health, viet nam. we would like to thank david dennis, former officer, centers for disease control and prevention, viet nam for editing this manuscript. references takakuwa h et al. possible circulation of h5n1 avian influenza viruses in healthy ducks on farms in northern vietnam. microbiology and immunology, 2010, 54:58–62. doi:10.1111/j.1348-0421.2009.00170.x pmid:20055944 herfst s et al. airborne transmission of influenza a/h5n1 virus between ferrets. science, 2012, 336:1534–1541. doi:10.1126/science.1213362 pmid:22723413 viruses ai, world health organization global influenza program surveillance network. evolution of h5n1 avian influenza viruses in asia. emerging infectious diseases, 2005, 11:1515–1521. doi:10.3201/eid1110.050644 pmid:16318689 beigel jh et al.writing committee of the world health organization (who) consultation on human influenza a/h5. avian influenza a(h5n1) infection in humans. new england journal of medicine, 2005, 353:1374–1385. doi:10.1056/nejmra052211 pmid:16192482 wan x et al. evolution of highly pathogenic h5n1 avian influenza viruses in viet nam between 2001 and 2007. plos one, 2008, 3:1–12. doi:10.1371/journal.pone.0003462 dinh pn et al; world health organization/global outbreak alert and response network avian influenza investigation team in vietnam. risk factors for human infection with avian influenza a(h5n1), vietnam, 2004. [internet]. emerging infectious diseases, 2006, 12:1841–1847. doi:10.3201/eid1212.060829 pmid:17326934 schultsz c et al. prevalence of antibodies against avian influenza a (h5n1) virus among cullers and poultry workers in ho chi minh city, 2005. plos one, 2009, 4:e7948. doi:10.1371/journal.pone.0007948 pmid:19956765 uyeki tm et al. seroprevalence of antibodies to avian influenza a(h5) and a(h9) viruses among market poultry workers, ha noi, viet nam, 2001. plos one, 2012,7(8):e43948. doi:10.1371/journal.pone.0043948 liem nt et al. clinical features of human influenza a(h5n1) infection in vietnam: 2004–2006. clinical infectious diseases, 2009, 48:1639–1646. doi:10.1086/599031 pmid:19435433 le mq et al. subclinical avian influenza a(h5n1) virus infection in human, vietnam. emerging infectious diseases, 2013, 19:1674–1677. doi:10.3201/eid1910.130730 pmid:24047510 shinya k et al. subclinical brain injury caused by h5n1 influenza virus infection. journal of virology, 2011, 85:5202–5207. doi:10.1128/jvi.00239-11 pmid:21389133 recommendations and laboratory procedures for detection of avian influenza a(h5n1) virus in specimens from suspected human cases. geneva, world health organization, 2007:1–28. dejpichai r et al. seroprevalence of antibodies to avian influenza virus a(h5n1) among residents of villages with human cases, thailand, 2005. emerging infectious diseases, 2009, 15:756–760. doi:10.3201/eid1505.080316 pmid:19402962 takakuwa h et al. molecular epidemiology of avian influenza viruses circulating among healthy poultry flocks in farms in northern vietnam. preventive veterinary medicine, 2012, 103:192–200. doi:10.1016/j.prevetmed.2011.09.014 pmid:21974815 le qm et al. pathogenicity of highly pathogenic avian h5n1 influenza a viruses isolated from humans between 2003 and 2008 in northern vietnam. journal of general virology, 2010, 91:2485–2490. doi:10.1099/vir.0.021659-0 pmid:20592108 muramoto y et al. molecular characterization of the hemagglutinin and neuraminidase genes of h5n1 influenza a viruses isolated from poultry in vietnam from 2004 to 2005. journal of veterinary medical science, 2006, 68:527–531. doi:10.1292/jvms.68.527 pmid:16757902 nguyen td et al. multiple sublineages of influenza a virus (h5n1), vietnam, 2005–2007. emerging infectious diseases, 2008, 14:632–636. doi:10.3201/eid1404.071343 pmid:18394281 long nt et al. recent avian influenza virus a/h5n1 evolution in vaccinated and unvaccinated poultry from farms in southern viet nam, january-march 2010. transbound emerging diseases, 2011, 58:537–543. doi:10.1111/j.1865-1682.2011.01229.x van nt et al. the h5n1 vaccination trial in viet nam – phase 3, 2011–2013 [unpublished]. rowe t et al. detection of antibody to avian influenza a (h5n1) virus in human serum by using a combination of serologic assays. journal of clinical microbiology, 1999, 37:937–943. pmid:10074505 kayali g et al. testing human sera for antibodies against avian influenza viruses: horse rbc hemagglutination inhibition vs. microneutralization assays. journal of clinical virology, 2008, 43:73–78. doi:10.1016/j.jcv.2008.04.013 pmid:18571465 social media as a risk communication tool following typhoon haiyan lessons from the field christine tiffany cool,a marie chantal claravall,b julie lyn hall,a keisuke taketani,a john paul zepeda,a monika gehnerb and olivia lawe-daviesb a office of the who representative in the philippines, sta cruz, manila, philippines. b who headquarters, geneva, switzerland. correspondence to christine tiffany cool (email: christinecool@coolconsulting.net). to cite this article: cool ct et al. social media as a risk communication tool following typhoon haiyan. western pacific surveillance and response journal, 2015, 6(suppl 1):86–90. doi:10.5365/wpsar.2015.6.2.hyn_013 abstract problem: in the aftermath of typhoon haiyan, the world health organization (who) representative office in the philippines had no social media presence to share timely, relevant public health information. context: risk communication is essential to emergency management for public health message dissemination. as social media sites, such as facebook, are popular in the philippines, these were adopted for risk communication during the response to haiyan. action and outcome: the who representative office in the philippines established facebook, twitter and instagram accounts. thirty days after these social medial channels were established, a gradual increase in followers was observed. facebook saw the largest increase in followers which occurred as posted content gradually evolved from general public health information to more pro-active public health intervention and preparedness messaging. this included information on key health interventions encouraging followers to adopt protective behaviours to mitigate public health threats that frequently occur after a disaster. lessons learnt: during the response to haiyan, creating a social media presence, raising a follower base and developing meaningful messages and content was possible. this event underscored the importance of building a social media strategy in non-emergency times and supported the value of developing public health messages and content that both educates and interests the general public. problem typhoon haiyan affected over 16 million people in the philippines with the health of people in affected areas threatened by outbreak-prone diseases and other public health risks.1 infrastructure across all sectors was completely devastated and access to essential health-care services was limited. mobilizing appropriate response measures took time. therefore an emergency risk communication (erc) plan was required to communicate with the public. as part of this erc plan, social media was suggested as a way to enhance traditional erc to the affected population. usually a social media strategy starts during non-emergency times. however, before typhoon haiyan, the world health organization (who) representative office in the philippines had no social media presence for sharing timely, relevant public health information. the primary focus during the acute phase of a response is to rapidly release essential public health information to a large population. this paper therefore describes how social media was used to enhance traditional erc and how a social media presence allowed for the broad and rapid dissemination of public health information in the response to haiyan. context risk communication is an essential component of crisis or emergency management and is one of the core capacities required under the international health regulations.2 in a disaster response, risk communication to affected communities ensures that interventions are evidence-based and include a range of capacities at each stage of the emergency (i.e. preparedness, response and recovery). it encourages informed decision-making, positive behaviour change and maintains the public’s trust in those handling the emergency.3,4 in recent times, social media has played an important role in public health message dissemination, particularly as a tool in emergency preparedness and response.5 pro-active communication provides important health information and advice for the public to adopt protective behaviours that augment disease surveillance post-disaster, reduce public confusion and allow for better resource allocation.4 the philippines, with a population of almost 100 million, had 34 million active facebook users in 2014 – 97% of people living in urban areas and 69% of rural dwellers were accessing facebook.6 social media users were estimated to be spending on average four hours and 12 minutes on social media each day.6 the who representative office in the philippines published bi-weekly health cluster bulletins as well as early warning alert and response reports on their website; however, the office did not have any other digital mechanism to disseminate information other than its website and traditional media channels. action platform for information dissemination typhoon haiyan destroyed all telecommunications in the affected areas – there was no telephone, internet or power until 20 november 2013 (12 days after the typhoon). by 27 november 2013 (19 days after the typhoon), a facebook page for the who representative office in the philippines was established; by 2 december 2013 (24 days after the typhoon), twitter and instagram accounts were also established by who. to assess the impact of these social media platforms, the monthly number of followers and posts were obtained from the facebook and twitter accounts between 27 november 2013 and 30 january 2015. the reach of a post on facebook was defined as the number of views each post received in the first 28 days as reported on facebook analytics. this included posts viewed by people on more than one device (e.g. desktop computer, mobile device and/or laptop). “followers” were defined as a person or organization that ‘liked’ or ‘followed’ one of these social media accounts. the facebook account was prioritized as it had more users in the philippines, particularly in rural areas, compared to other social media. twitter only accounted for 40% of social media users in rural populations.6 there was an increase in the number of followers on both facebook and twitter, although this was more marked for facebook (figure 1). there was also an increase observed for the instagram account (data not shown). figure 1. number of social media followers on who accounts by month after typhoon haiyan, november 2013 to january 2015 click to download figure 1. jpg, 293kb according to who policy, all social media posts and followers have to be generated organically. this policy posed a great challenge to the social media team as it had to rely on followers that actively sought out the who social media pages, which were being generated for the first time, rather than using mechanisms where content is placed in social media accounts. because of this, the social media team had to figure out how to use agencies with an established social media presence, such as health cluster partners, health officials, local government and celebrities, to encourage their followers to keep up to date with who health responses and priorities for the typhoon-affected area without the help of paid social media advertisements. shift in messages: reaching affected populations the initial content of posts on facebook provided information about the who emergency response and comprised mostly photos and text. as the risk communication needs evolved during the response, so too did the posts. public health messages (e.g. that drinking boiled water was essential) were gradually replaced with messages encouraging the public to take protective actions against public health threats that commonly follow disasters. in july 2014, typhoon glenda made landfall in manila, and so the social media message content post-haiyan included preparation messages for glenda as well. the presentation of content also changed, with more illustrative infographics showing people what to do; these resulted in further reach and more followers ( table 1). table 1. thematic posts and reach by message, who philippines facebook page, 8 november 2013 to 8 november 2014 click to download table 1. jpg, 971kb as the content of social media became more informed by technical input from both who and the department of health, working collaboratively to align policy and practice with social media messaging, the number of people reached per post increased (table 1). an infographic on immunization resulted in a 76% increase in people reached over two months; this infographic was seen by 3190 people over 28 days. an infographic on breastfeeding in disasters reached 9636 people within 28 days, compared to a photo and text that reached only 1354 people in the same time period. the erc strategy also relied on the collaboration of who with health cluster partners. during daily meetings, the needs of those in the affected areas were discussed along with the activities being undertaken. the social media outputs were also reported, some of which were disseminated with partners such as unicef and the department of health, for example the promotion of breastfeeding in disasters. this opportunity to collaborate with partners increased the social media coverage. the social media team was able to track the performance of each post through the facebook analytics tool which helped in identifying the type of content that gained the greatest reach. for example, the “health at the heart of healing” campaign called for people to post a picture of themselves making a heart gesture with their hands to show support for those in affected areas. within the first week of the campaign, 170 entries were distributed to all who hubs in the typhoon haiyan-affected regions. participation in this campaign included philippines government officials, health cluster partners, health officials, overseas filipino workers and who staff in the philippines and in the european region and region of the americas. traditional media reported on the social media campaign, featuring the health priorities in affected areas six months after the typhoon. lessons learnt as the erc plan was developed during the response to an emergency, parameters for defining its success and evaluating the effectiveness of the strategy were not established. the importance of system evaluation was one of the primary lessons learnt. evaluation is integral to determining the impact that communication interventions and activities have on behaviour change and the public’s risk perception. it also determines whether the messages are being received, understood and adopted by target groups. who was only able to evaluate the social media campaign using the number of views and likes from the social media posts. although post views increased, whether the content resulted in offline engagement could not be assessed. evaluation has been added to the updated who erc standard operating procedures for implementation in future emergencies. some ways to determine whether social media messaging resulted in offline engagement is to conduct a survey of offline behaviours, have response teams observe behaviours to see if they align with social media messages or to verify through media monitoring if any changes in risk perception or behaviour change had occurred in the affected areas.3 another main lesson learnt was that a social media presence should be established during non-emergency periods. this would give the team more time to establish a follower base, test the content that was most engaging and develop and test evaluation mechanisms to track the effectiveness of activities and interventions. if these mechanisms were in place, whether online activity translated to offline engagement could be determined. since affected populations measure, in part, the effectiveness of an emergency response based on the amount of information they have access to at any given time,7 effective erc and coordination among partners is crucial. as each partner has different priorities, different aspects of the response are emphasized through social media. getting essential public health information to the affected population and ensuring alignment with both national and international partners was challenging. a mechanism to facilitate effective coordination with various partners should be implemented. creating an erc subgroup to meet after the daily health cluster meetings would allow partners to discuss the best way to address erc priorities. conclusion social media was used for the first time by who in the philippines as part of the erc strategy in the response to typhoon haiyan. creating a social media presence and organically generating a follower base was challenging, especially amidst such a large-scale humanitarian emergency. however, that the number of facebook and twitter followers increased over time suggested that these social media channels did allow for increased reach. lessons learnt included having an evaluation strategy as part of the campaign, establishing the social media platforms during non-emergency times and improving collaboration between partners in the dissemination of social media content. the power of social media is that users can leverage existing social networks to generate discussion or provide information on important issues, and it represents a cost-effective tool for erc.4 the ability to communicate in real-time enhances traditional erc as it allows for rapid dissemination of public health information. using social media in an emergency response should be part of all erc strategies. conflicts of interest none declared. funding none. acknowledgements we thank the following people for their input: rachel parry, paulo lyra, nyka alexander, christina banluta, faith kilford-vorting, ruth foxwell, aphaluck bhatiasevi, rosemarie aguirre and ivan escartin. we also thank all those that responded to our campaign. references mcpherson m, counahan m, hall jl. responding to typhoon haiyan in the philippines. western pacific surveillance and response journal, 2015, 6(suppl 1):1–4. doi:10.5365/wpsar.2015.6.4.hyn_026 international health regulations implementation: ensuring effective responses to public health emergencies – strengthening risk communication capacities of national systems. geneva, world health organization, 2012. available from: http://www.who.int/ihr/about/07_risk_communication.pdf [accessed 13 august 2015]. world health organization outbreak communication planning guide. geneva, world health organization, 2008. available from: http://www.who.int/ihr/elibrary/ whooutbreakcommsplanngguide.pdf [accessed 13 august 2015]. merchant rm, elmer s, lurie n. integrating social media into emergency-preparedness efforts. new england journal of medicine, 2011, 365:289–291. doi:10.1056/nejmp1103591 pmid:21793742 fung ic-h et al. the use of social media in public health surveillance. western pacific surveillance and response journal, 2015, 6(2):3–6. doi:10.5365/wpsar.2015.6.1.019 kemp s. social, digital & mobile in apac 2014. london, wearesocial, 2014. available from: http://wearesocial.net/tag/philippines/ [accessed 13 august 2015]. o’malley p, rainford j, thompson a. transparency during public health emergencies: from rhetoric to reality. bulletin of the world health organization, 2009, 87:614–618. doi:10.2471/blt.08.056689 pmid:19705012 the burden of congenital rubella syndrome in the philippines: results from a retrospective assessment original research anna lena lopez,a peter francis raguindin,a jose jonas del rosario,b,c ramon v najarro,d eleanor du,e josephine aldaba,a aida m salonga,a andrea kristina monzon-pajarillo,f alvina pauline santiago,f alan c oug,h and maria joyce ducusini a institute of child health and human development, national institutes of health, university of the philippines manila, philippines. b philippine children's medical center, quezon city, philippines. c department of pediatrics, college of medicine, university of the philippines manila, philippines. d department of pediatrics, vicente sotto memorial medical center, cebu city, philippines. e department of pediatrics, southern philippines medical center, davao city, philippines. f department of ophthalmology, college of medicine, university of the philippines manila, philippines. g world health organization representative's office, manila, philippines. h centers for disease control and prevention, global immunization division, atlanta, georgia, usa. i department of health, philippines. correspondence to anna lena lopez(email:annalenalopez@gmail.com). to cite this article: lopez al, raguindin pf, del rosario jj, najarro rv, du e, aldaba j, et al. the burden of congenital rubella syndrome in the philippines: results from a retrospective assessment. western pac surveill response j. 2017 may;8(2). doi:10.5365/wpsar.2017.8.1.006. abstract introduction: in line with the regional aim of eliminating rubella and congenital rubella syndrome (crs), phased introduction of rubella-containing vaccines (rcv) in the philippines' routine immunization programme began in 2010. we estimated the burden of crs in the country before widespread nationwide programmatic rcv use. methods: we performed a retrospective chart review in four tertiary hospitals. children born between 1 january 2009 and 31 december 2014 and identified as possible crs cases based on the presence of one or more potential manifestations of crs documented in hospital or clinic charts were reviewed. cases that met the clinical case definition of crs were classified as either confirmed (with laboratory confirmation) or probable (without laboratory confirmation). cases that did not fulfil the criteria for either confirmed or probable crs were excluded from the analysis. results: we identified 18 confirmed and 201 probable cases in this review. depending on the hospital, the estimated incidence of crs ranged from 30 to 233 cases per 100 000 live births. the estimated national burden of crs was 20 to 31 cases per 100 000 annually. discussion: this is the first attempt to assess the national crs burden using in-country hospital data in the philippines. prospective surveillance for crs and further strengthening of the ongoing measles-rubella surveillance are necessary to establish accurate estimates of the burden of crs and the impact of programmatic rcv use in the future. introduction rubella, also known as german measles, is an exanthematous disease that commonly causes mild fever and rash that begins on the face and gradually spreads to the neck, trunk and extremities. while most infections are mild, infection in a pregnant woman may cause devastating foetal malformations and may result in stillbirths, miscarriage or a pattern of birth defects known as congenital rubella syndrome (crs).1-3 the use of effective rubella-containing vaccines (rcv) has resulted in significant reductions in the incidence of rubella and crs in countries that have included rubella vaccines in their national immunization programmes. in 2015, it was announced that the countries in the world health organization (who) region of the americas had eliminated endemic transmission of rubella and crs.4 before routine rubella vaccination, the incidence of crs worldwide ranged from 10 to 20 cases per 100 000 live births to 80 to 400 cases per 100 000 live births during intra-epidemic and epidemic periods, respectively.3,5-7 globally, it is estimated that there were 105 391 cases of crs in 2010, representing a decline of 11.6% from 1996.8 in the who global vaccine action plan 2011-2020, a goal to eliminate both measles and rubella in at least five regions of the who was established.9 in october 2014, the who regional committee for the western pacific region included rubella elimination plus crs prevention as one of eight regional immunization goals specified by the regional framework for implementation of the global vaccine action plan in the western pacific.10 to support this goal, the technical advisory group on immunization and vaccine preventable diseases in the western pacific region recommended enhancing surveillance activities for rubella and crs with case detection and thorough outbreak investigations as well as appropriate case management and vaccination of susceptible contacts.11 in the philippines, rubella surveillance is conducted as part of measles surveillance. no crs surveillance currently exists anywhere in the philippines. in the philippines, a pilot project introduced rcv in five of the 18 regions of the country in 2009. in 2010, rcv was incorporated into the national routine immunization programme targeting children aged 12-15 months with the combined measles-mumps-rubella (mmr) vaccine. children up to the age of 95 months were additionally covered by a national measles and rubella supplemental immunization campaign in 2011.12 coverage for mmr gradually rose from 31% in 2011 to 38% in 2012-2013, and 64% in 2014; it was 62% in 2015. mmr coverage remained low due to vaccine stock-outs in 2013 and 2015 and delayed reporting from the 18 regions.13 to date, women of childbearing age have not been targeted systematically for rubella vaccination in the philippines. we aimed to estimate the burden of crs in the country through a retrospective chart review to provide a baseline before widespread introduction of rubella vaccines. this information is important for evaluating the impact of the introduction of rcv into the immunization programme. methods we conducted a retrospective review of hospital records in four large hospitals in the country. these hospitals, which are public, tertiary training hospitals equipped with subspecialists capable of managing crs, are known to have the highest annual crs consultations. they were selected based on their large catchment area that encompasses the three main island groups of the philippines as well as their ability to provide care to crs cases. two of the hospitals were in metro manila in the most populated island of luzon (philippine general hospital, pgh, in the city of manila, and philippine children's medical center, pcmc, in quezon city), one in cebu city in the visayas (vicente sotto memorial medical center, vsmmc) and one in davao city in mindanao (southern philippines medical center, spmc) (fig. 1). click to download figure 1. jpg, 436kb records review and case classification the following patients were included in the review: children born between 1 january 2009 and 31 december 2014 who were hospitalized or received outpatient care at one of the study sites from 1 january 2009 until 31 december 2014 with: documented positive rubella immunoglobulin m (igm) laboratory test result; or international classification of disease (icd)-914 or icd-1015 discharge code consistent with one or more manifestation(s) of crs; icd-9/icd-10 codes used in the chart review were: congenital rubella syndrome (771.0/p35); cataracts (743.3/q12); congenital glaucoma (743.2/q15-h40); deafness and hearing impairment (389.1/h90); congenital heart disease (745-747/q20-q26); dermal erythropoiesis (759.89/p83.8); microcephaly (742.1/q02); or written documentation in the medical record of one or more manifestation(s) of crs using the following diagnostic keywords: cardiac-congenital heart disease (chd); patent ductus arteriosus (pda); peripheral pulmonary artery stenosis; congenital cardiopathy; ventricular septal defect; ophthalmologic: cataract, microphthalmia, glaucoma, pigmentary retinopathy; auditory: deafness, hearing loss/hearing impairment; dermatologic: purpura, "blueberry muffin rash"; and others: microcephaly, mental retardation, developmental delay, neonatal jaundice, hepatosplenomegaly, meningoencephalitis, radiolucent bone disease, "rule out torch infection," congenital rubella syndrome or congenital rubella infection (including "suspected crs" or "rule out congenital rubella"). we excluded the following in our review: infants <2500 g with isolated pda or isolated microcephaly and no other signs of crs, documented negative rubella-specific igg test for the child, documented positive laboratory test for other potential etiology of crs manifestation (e.g. positive cytomegalovirus or toxoplasmosis test) in the absence of a positive rubella laboratory test and not a resident of the philippines. charts were retrieved from all eligible cases. information collected from the charts included hospital location; patient's province and region of residence; location of birth, maternal and infant demographics; infant's clinical signs and symptoms; maternal history; and laboratory tests performed. data were collected on standard forms and entered securely into an electronic database using epi info™ 7 (centers for disease control and prevention, atlanta, georgia, usa. participants were coded using a unique surveillance identification number. data analysis data analysis was performed using epi info™ 7. we used the case definition from who surveillance standards16,17 to classify the identified cases (box 1). estimated annual incidence rates were calculated using different methods. first, we computed hospital-specific incidence including only babies who were born at pgh, spmc or vsmmc in the analysis. since few deliveries occurred in pcmc, incidence rate for this hospital was not calculated. the numerator was the respective number of probable or confirmed crs cases in one of the three study sites and the denominator was the number of live births in the same hospitals from 1 january 2009 to 31 december 2014. to calculate the national incidence rates, we used the method previously used by bloom, et al. using cataract detection in morocco to calculate the national burden19 with the following formula: i = (crsp + crsc) × 1/%c × 1/(%crs cases with cataracts) where i = incidence, crsp = probable crs cases, crsc = confirmed crs cases, %c = percentage of overall cataract care provided at three participating hospitals, and %crs cases with cataract = crs cases with cataracts based on previous literature. based on previous studies, 16-25% of crs cases have cataracts.20,21 for the national incidence estimation, we obtained the proportion of cataract care provided by each participating hospital by using the insurance claims for icd-10 code q12 (congenital cataract and congenital diseases of the lens) from philhealth (the national health insurance programme). based on the claims from philhealth from 2009 to 2013, pgh, pcmc, spmc and vsmmc accounted for 7%, 0%, 2% and 1% of all cataract care in the country, respectively, or 10% cumulatively for all hospitals.22 this database included reports from both private and public hospitals in the country that managed cases of congenital cataracts. click to download box 1. jpg, 590kb ethics this study was reviewed and approved by the ethics review committee of the who regional office for the western pacific (2015.8.phl.2.epi), and the ethical review boards of the university of the philippines manila (upm-reb 2015-205-01), pcmc, vsmmc and the spmc. results out of 4339 unique entries identified from medical records, we identified 18 laboratory-confirmed cases and 201 probable crs cases from the four hospitals. the majority of suspected cases came from pgh (1849), followed by pcmc (1091), spmc (939) and vsmmc (459). both spmc and vsmmc had no confirmed cases due to the absence of laboratories capable of performing a rubella igm test in either davao city or cebu city. clinical manifestations of crs were predominantly cardiac (83.3% and 86.1% among confirmed and probable cases, respectively), audiologic (50% and 33.3% among confirmed and probable cases, respectively) and ophthalmologic (27.8% and 25.4% among confirmed and probable cases, respectively). among all confirmed and probable crs cases, the mean age of diagnosis was 9.9 months (range: 3 days-72 months) with more cases among males (55.7%) and the mean age of mothers was 27.8 (±5.2) years, with only 13.2% reporting rashes on prenatal history by recall (tables 1 and 2). the most common cardiac presentation was patent ductus arteriosus. we obtained the number of live births in pgh, vsmmc and spmc. using each hospital's live births, the estimate for crs incidence ranged from 30 to 233 cases per 100 000 live births (table 3). there were 52 cataract cases among the 219 confirmed and probable cases identified from 2009 to 2014. based on philhealth claims for congenital cataracts from 2009 to 2013, pgh, pcmc, spmc and vsmmc together accounted for 10% of all cataract cases nationwide. thus, there were an estimated 520 diagnosed cataract cases nationally from 2009 to 2014. using the reported live births in the country during the same period,23 and adjusting by 4-6.25 times (the inverse of 16-25% of crs cases have cataracts), then an estimated 2080 to 3250 crs cases nationally from 2009 to 2014, or an annual incidence of 20 to 31 crs cases per 100 000 live births. click to download table 1. jpg, 586kb click to download table 2. jpg, 433kb click to download table 3. jpg, 224kb discussion we documented the occurrence of crs in the philippines; cardiac and ophthalmologic defects were the most common findings, similar to previous studies conducted in sudan,24 viet nam25 and the philippines.26 our estimates for crs varied widely by hospital. who estimates that there were 150 cases of crs per 100 000 live births in the philippines in 2010, or about 2674 cases of crs, much higher than estimates obtained in this review.27 previous estimates of crs were based on modelling using rubella seroprevalence data together with the incidence of infection during gestation28 or with immunization coverage in the different countries,8 while this study was a retrospective assessment of crs using admission records. the national estimate we obtained based on cataract care is conservative. first, our review covered only a small proportion of the country and is not representative of the entire population. we conducted chart reviews in four public hospitals that were the biggest tertiary public referral centres in the country's three major island groups and located in urbanized centres. as crs diagnosis requires consultation with subspecialists that is typically unavailable at small hospitals, most cases should have been referred to one of these hospitals. a closer review of the data from pgh and pcmc showed that only 59% and 57%, respectively, of the patients came from metro manila; the rest came from other areas. but despite the four hospitals' large catchment areas, there are more than 1800 hospitals in the philippines. in addition, since only 40% of philippines' hospitals are government-owned, some patients may have sought care in the private sector. it is estimated that 30% of the population use private fee-for-service medical care.29 second, there are differences in the hospitals included in the study. the higher incidence seen in pgh compared to spmc and vsmmc may be due to the nature of deliveries performed at pgh. pgh is the largest training and referral hospital in the philippines and only high-risk pregnancies are admitted; hence normal deliveries are limited at the hospital. pgh is also considered to have the most complete subspecialty services; thus patients requiring complicated case management are often transferred to this hospital. conversely, the hospitals in cebu and davao did not have adequate laboratories to diagnose crs. subspecialty services (paediatric ophthalmology and audiology) were also inconsistently available during the inclusive dates under review. thus, children seeking eye care and hearing tests may have sought care at private health facilities and therefore possibly missed. with the passage of a law in 2009 that requires mandatory hearing screening of all newborns, more public facilities are able to conduct hearing testing and identify cases. third, as in any retrospective chart review, we encountered difficulties in retrieving patient records and abstracting information from clinical sources. a significant number of medical records were missing in the archiving facilities of respective hospitals. retrieved medical records, likewise, had incomplete documentation. the incomplete records and inaccurate coding may also result in misclassification and reduce our estimates. fourth, we found many cases in which care from hospitals was sought late. many children with hearing and visual impairment were seen after 5 years of age and therefore were missed in this retrospective case finding. in pgh, only 30% of children with hearing loss were referred before 1 year of age,30 and crs was the most common (36%) etiology of hearing loss in 94 patients who underwent cochlear implantation.331 fifth, the estimate on the national incidence is likely to be an underestimate due to the low utilization and coverage of philhealth for the lower economic strata from 2009 to 2014. although 88% of the population were enrolled in 2015 in philhealth, from 2009 to 2014 philhealth utilization remained low.22 lastly, the phased introduction of rcv may have affected our results since rcv was initially introduced in 2009 before inclusion into the national routine immunization programme targeting children aged 12-15 months with the mmr vaccine and as supplemental immunization campaigns in children up to the age of 95 months in 2011 resulting in low rcv coverage initially but increasing coverage as the study progressed. however, by 2014, the national childhood rcv coverage was <70% due to vaccine stock-outs and in metro manila, rcv coverage was <50%. at this vaccine coverage, it is unlikely that susceptible pregnant women would benefit from herd immunity.32 currently, women of childbearing age are not systematically targeted for rubella vaccination in the philippines. in 2002, 15% of women in an urban antenatal clinic remained susceptible to rubella.26 in the absence of vaccination, a large cohort of this population remains at risk for being infected with rubella during pregnancy. from 1 january to 22 october 2016, there were 119 laboratory-confirmed cases of rubella out of 1732 suspected measles-rubella cases captured by the philippine department of health surveillance. of these, 23% of cases were among women aged 16 to 30 years.33 to the best of our knowledge, this is the first attempt to obtain an estimate of the burden of crs using hospital data in the philippines. the estimates varied widely by hospital and the national estimate we obtained was substantially lower than those obtained from models. prospective surveillance will be important to obtain the true burden of crs in the philippines. new crs surveillance guidelines are now available and these will be used as the country strengthens its rubella surveillance and plans to embark on a prospective crs surveillance. care must be taken in choosing potential surveillance sites to obtain reliable data. conflicts of interest none. funding this study was funded by a centers for disease control and prevention (cdc) small grant in support of national routine immunization and surveillance and administered through the world health organization. acknowledgements we would like to thank dr susan reef for her critical review of the manuscript, dr charlotte chiong for providing information on audiologic crs cases and ms maricel de quiroz-castro for her support in the conduct of the study. references mclean h, redd sb, abernathy e, icenogle jp, wallace g. rubella. in: roush sw, baldy lm, editors. manual for the surveillance of vaccine-preventable diseases. atlanta: centers for disease control and prevention; 2012 (https://www.cdc.gov/vaccines/pubs/surv-manual/chpt14-rubella.html). mclean h, redd sb, abernathy e, icenogle jp, wallace g. congenital rubella syndrome. in: roush sw, editor. manual for the surveillance of vaccine-preventable diseases. atlanta: centers for disease control and prevention; 2012 (https://www.cdc.gov/vaccines/pubs/surv-manual/chpt15-crs.html). robertson se, featherstone da, gacic-dobo m, hersh bs. rubella and congenital rubella syndrome: global update. rev panam salud publica. 2003 nov;14(5):306-15. pmid:14870758 doi:10.1590/s1020-49892003001000005 americas region is declared the world's first to eliminate rubella. washington, dc: world health organization regional office for the americas; 2015 (http://www2.paho.org/hq/index.php?option=com_content&view=article&id=10798%3aamericas-free-of-rubella&itemid=1926⟨=en, accessed 4 march 2017). lawn je, reef s, baffoe-bonnie b, adadevoh s, caul eo, griffin ge. unseen blindness, unheard deafness, and unrecorded death and disability: congenital rubella in kumasi, ghana. am j public health. 2000 oct;90(10):1555-61. pmid:11029988 doi:10.2105/ajph.90.10.1555 thant kz, oo wm, myint tt, shwe tn, han am, aye km, et al. active surveillance for congenital rubella syndrome in yangon, myanmar. bull world health organ. 2006 jan;84(1):12-20. pmid:16501710 doi:10.2471/blt.05.022814 world health organization. rubella vaccines: who position paper. wkly epidemiol rec. 2011 jul 15;86(29):301-16. pmid:21766537 vynnycky e, adams ej, cutts ft, reef se, navar am, simons e, et al. using seroprevalence and immunisation coverage data to estimate the global burden of congenital rubella syndrome, 1996-2010: a systematic review. plos one. 2016 03 10;11(3):e0149160. pmid:xxxxxxx doi:10.xxxx/xxx/xxxxxxxx world health organization. global vaccine action plan. decade of vaccine collaboration. vaccine. 2013 apr 18;31 suppl 2:b5-31. pmid:23734366 doi:10.1016/j.vaccine.2013.02.015 regional committee for western pacific. regional framework for implementation of the global vaccine action plan in the western pacific. manila: world health organization; 2014 october 16. report no.: wpr/rc65.r5. available from: http://www.wpro.who.int/about/regional_committee/65/documents/wpr_rc065_08_epi_en.pdf. 24th meeting of the technical advisory group on immunization and vaccine preventable diseases in the western pacific region. manila: who regional office for the western pacific; 2015 (http://iris.wpro.who.int/bitstream/handle/10665.1/12687/rs_2015_ge_16_phl_eng.pdf?ua=1). family health office expanded program for immunization. the philippine immunization program strategic plan for 2015-2019. manila: department of health, philippines; 2015. family health office expanded program for immunization. the philippine immunization program strategic plan for 2016-2022. manila: department of health, philippines; 2016. icd-9. international statistical classification of diseases and related health problems 9th revision. geneva: world health organization; 1978 (http://www.who.int/iris/handle/10665/39473). icd-10. international statistical classification of diseases and related health problems 10th revision. geneva: world health organization; 2016 (http://apps.who.int/classifications/icd10/browse/2016/en). vaccines and biologicals: who-recommended standards for surveillance of selected vaccine-preventable diseases. geneva: world health organization; 2008 (http://apps.who.int/iris/bitstream/10665/68334/1/who_v-b_03.01_eng.pdf). introducing rubella vaccine into national immunization programmes: a step by step guide. geneva: world health organization; 2015 (http://apps.who.int/iris/bitstream/10665/184174/1/9789241549370_eng.pdf). centers for disease control and prevention (hamborsky j, kroger a, wolfe s, editors). epidemiology and prevention of vaccine preventable diseases. washington, dc: public health foundation; 2015 (https://www.cdc.gov/vaccines/pubs/pinkbook/index.html). bloom s, rguig a, berraho a, zniber l, bouazzaoui n, zaghloul z, et al. congenital rubella syndrome burden in morocco: a rapid retrospective assessment. lancet. 2005 jan 8-14;365(9454):135-41. pmid:15639295 doi:10.1016/s0140-6736(05)17703-4 reef se, plotkin s, cordero jf, katz m, cooper l, schwartz b, et al. preparing for elimination of congenital rubella syndrome (crs): summary of a workshop on crs elimination in the united states. clin infect dis. 2000 jul;31(1):85-95. pmid:10913402 doi:10.1086/31392 wolff sm. the ocular manifestation of congenital rubella. trans am ophthalmol soc. 1972;70:577-614. pmcid:pmc1310470 stats & charts 1st semester 2015. manila: philippine health insurance corporation; 2015 (http://www.philhealth.gov.ph/about_us/statsncharts/snc2015_1st.pdf, accessed 15 may 2016). live births philippines 2014. manila: philippine statistics authority; 2015 (https://psa.gov.ph/content/live-births-philippines-2014, cited may 5 2015). adam o, ali ak, hübschen jm, muller cp. identification of congenital rubella syndrome in sudan. bmc infect dis. 2014 06 04;14(1):305. pmid:24898017 doi:10.1186/1471-2334-14-305 toda k, reef s, tsuruoka m, iijima m, dang th, duong th, et al. congenital rubella syndrome (crs) in vietnam 2011-2012-crs epidemic after rubella epidemic in 2010-2011. vaccine. 2015 jul 17;33(31):3673-7. pmid:26087296 doi:10.1016/j.vaccine.2015.06.035 lopez al, raguindin pfn, silvestre ma, fabay xcj, vinarao ab, manalastas r. rubella and congenital rubella syndrome in the philippines: a systematic review. int j pediatr. 2016;2016(8):8158712. pmid:28115948 vynnycky e, adams ej, cutts ft, reef se, navar am, simons e, et al. using seroprevalence and immunisation coverage data to estimate the global burden of congenital rubella syndrome, 1996-2010: a systematic review. plos one. 2016 03 10;11(3):e0149160. pmid:26962867 doi:10.1371/journal.pone.0149160 cutts ft, vynnycky e. modelling the incidence of congenital rubella syndrome in developing countries. int j epidemiol. 1999 dec;28(6):1176-84. pmid:10661666 doi:10.1093/ije/28.6.1176 health service delivery profile: philippines. manila: who representative office in the philippines; 2012 (http://www.wpro.who.int/health_services/health_service_delivery_profiles/en/, accessed 29 december 2016). chiong c, ostrea e jr, reyes a, llanes eg, uy me, chan a. correlation of hearing screening with developmental outcomes in infants over a 2-year period. acta otolaryngol. 2007 apr;127(4):384-8. pmid:17453458 doi:10.1080/00016480601075431 chiong cm, villanueva em. cochlear implantation in chronic otitis media. acta med philipp. 2012;46(3):21-6. anderson rm, may rm. vaccination against rubella and measles: quantitative investigations of different policies. j hyg (lond). 1983 apr;90(02):259-325. pmid:6833747 doi:10.1017/s002217240002893x measles-rubella cases. morbidity week 42. manila: epidemiology bureau, department of health, philippines; 2016 (http://www.doh.gov.ph/sites/default/files/statistics/measlesrubella42_compressed.pdf, accessed 29 december 2016). an assessment of measles vaccine effectiveness, australia, 2006–2012 original research alexis pillsburyab and helen quinnac a national centre for immunisation research and surveillance of vaccine preventable diseases, the children’s hospital at westmead and the university of sydney, new south wales, australia. b national centre for epidemiology and population health, australian national university, canberra, australia. c discipline of paediatrics and child health, university of sydney, the children’s hospital at westmead, westmead, new south wales, australia. correspondence to alexis pillsbury (email: alexis.pillsbury@health.nsw.gov.au). to cite this article: pillsbury a and quinn h. an assessment of measles vaccine effectiveness, australia, 2006–2012. western pacific surveillance and response journal, 2015, 6(3). doi:10.5365/wpsar.2015.6.2.007 abstract objective: vaccine effectiveness analysis serves as a critical evaluation for immunization programmes and vaccination coverage. it also contributes to maintaining public confidence with the vaccine providers. this study estimated measles vaccine effectiveness at the population level using australian national notifications data between 2006 and 2012. methods: notification data were obtained from the national notifiable diseases surveillance system. vaccination status was classified according to whether a case had received zero, one or two doses of measles-containing vaccine. cases aged less than 1 year and those with unknown vaccination status were excluded. all children with disease onset between 1 january 2006 and 31 december 2012 who were born after 1996 were included. cases were matched to controls extracted from the australian childhood immunisation register according to date of birth and jurisdiction of residence. vaccine effectiveness was estimated by conditional logistic regression. sensitivity analyses were conducted to test data robustness. results: vaccine effectiveness was estimated at 96.7% (95% confidence interval [ci]: 94.5–98.0%) for one dose and 99.7% (95% ci: 99.2–99.9%) for two doses of measles vaccine. for at least one dose, effectiveness was estimated at 98.7% (95% ci: 97.9–99.2%). sensitivity analyses did not significantly alter the base estimates. discussion: vaccine effectiveness estimates suggested that the measles vaccine was protective at the population level between 2006 and 2012. however, vaccination coverage gaps may have contributed to recent measles outbreaks and may represent a serious barrier for australia to maintain measles elimination status. introduction the australian national immunisation program (nip) has funded the measles vaccine since 1972, with the first national vaccine schedule including measles vaccine for all infants aged 12 months in 1975.1 in 1989, measles-mumps-rubella (mmr) vaccine was included on the schedule for all infants 12 months of age, with a second dose being included soon after, originally for children aged 10–14 years. since the late 1990s, two doses have been recommended and scheduled at 12 months and 4–5 years, with the second dose changed to 4 years from 2000.1 from july 2013, the second dose has been rescheduled to 18 months due to the introduction of the measles-mumps-rubella-varicella vaccine.1,2 as part of a dedicated effort for measles elimination, various funded catch-up campaigns have been conducted to ensure that those born since the 1970s have received two doses of measles-containing vaccine. anyone born since 1966 has also been recommended to receive two doses.1 though efforts to eliminate measles have resulted in a notable decrease in measles notifications since the mid-1990s in australia, vaccination coverage rates have been below 95%, the optimal rate for maintaining herd immunity to protect against outbreaks.3 consequently, imported cases have continued to trigger outbreaks, for example one that occurred in new south wales in 2012 that infected 168 cases.4 few measles vaccine effectiveness analyses have been published in australia after the measles control campaign in the late 1990s, except after an outbreak in new south wales in 2006.5 this report assessed the vaccine effectiveness at the population level in australia between 2006 and 2012 and explored results within the epidemiological context of measles in an era of elimination. methods case definition as required by legislation, all australian states and territories must notify public health authorities of all probable and confirmed cases of measles using the national notifiable diseases case definition.6 a confirmed case requires laboratory definitive evidence or a combination of clinical and epidemiological evidence. a probable case requires laboratory suggestive evidence and clinical evidence. case selection all measles cases notified to the national notifiable diseases surveillance system (nndss) with an onset between 1 january 2006 and 31 december 2012 who were born after 1996 were included. data were restricted to 2006 through 2012 because the nndss data for all states and territories were more complete from 2006 onwards. those aged less than 1 year were excluded as they were not eligible for measles vaccination. controls were selected from the australian childhood immunisation register (acir) database. the acir is a population-based register which includes all children of citizens and permanent residents enrolled in the national publicly funded health-care system regardless of vaccination status.7 for each case, controls were randomly sampled from the acir and matched to cases by date of birth (plus or minus one day) and state or territory of residence. twenty age-matched controls were sampled for each case to maximize precision based on previously used methods.8 only cases aged less than 17 years were included in the analysis because the acir began in 1996. vaccination status for cases was obtained from the nndss and was summarized as zero, one, two doses or unknown. where the nndss had only classified a case as partially or fully vaccinated, vaccination status was interpreted according to the case’s age and the vaccination schedule in place at the time of illness for analysis. “fully vaccinated” was interpreted as one dose for anyone aged less than 4 years at the time of disease onset and two doses for anyone aged 4 years or older. “partially vaccinated” therefore was interpreted as one dose for anyone aged 4 years or older. any doses recorded within two weeks before disease onset were excluded from analysis. vaccination status for controls, as well as gender and indigenous status was obtained from the acir. controls who had received a dose within two weeks of onset of disease in their matched case were considered to have had an invalid dose but were still included in the analysis. statistical methods using nndss data, trends in measles notifications from 1995 through 2012 were briefly described. comparisons of characteristics between cases and controls were analysed using the pearson χ2 test at a significance level of p 9 ve = (1 – or)*100. all analysis was done using stata version 12.0 (stata corporation, college station, tx, usa). ethics approval was not required as de-identified nndss and acir data are routinely provided to the national centre for immunisation research and surveillance (ncirs) for disease surveillance on behalf of the australian commonwealth department of health. sensitivity analyses sensitivity analyses were conducted as there were many participants with unknown vaccination status. analyses were conducted first by categorizing all those with unknown vaccination status as having been vaccinated with age-dependent dosages and then categorizing all as unvaccinated. vaccine effectiveness calculations were then executed using the same method described above. results secular trends among measles notifications between 1995 and 2012, 4111 measles notifications were reported to the nndss. efforts to achieve and maintain measles elimination have resulted in a decrease in notifications in australia since the midto late 1990s following the impact of the addition of the second dose to the nip in 1992. there were 1182 notifications of measles in australia in 1995 and the notifications decreased throughout the 1990s except in 1997. notifications between 2000 and 2012 ranged from 10 to 199 annually (figure 1). figure 1. number of measles notifications, australia, 1995–20121,10 click to download figure 1. jpg, 258kb since 2000, a disproportionate number of notifications were reported for those aged 20 to 59 years (52.4% on average). notifications in 2011 and 2012 also showed an increase in cases aged 10 to 19 years (31.5% in 2011 and 25.6% in 2012). most notifications in 2012 were from the new south wales outbreak; among those cases, there was an increase in the number of notifications among infants less than 1 year of age (21.4% in the outbreak) who were too young to be vaccinated. study participants according to the inclusion criteria, 769 notifications were initially included. after excluding all notifications with disease onset before 2006, and those with a date of birth before 1997 or aged less than 1 year at the time of illness, 207 notifications remained. the majority of cases (40.1%) were aged 1 to 4 years, 30.4% were aged 5 to 9 years and 29.5% were aged 10 to 15 years. eighteen cases were excluded from the analysis due to their unknown vaccination status. more than half of the excluded cases (55.5%, n = 10) were aged 10–15 years. seven cases included in the analysis were classified as having received zero doses of vaccine because they had received a dose immediately after exposure. ultimately, 189 cases were included in the vaccine effectiveness analysis (figure 2). figure 2. flow diagram showing case selection for vaccine effectiveness analysis, australia, 2006–2012 click to download figure 2. jpg, 438kb acir, australian childhood immunisation register; nndss, national notifiable diseases surveillance system. twenty controls were matched for each case, resulting in a total of 3780 controls. there were no significant differences between cases and controls in terms of gender (p = 0.34) and indigenous status (p = 0.52). vaccine effectiveness estimates the overall estimated vaccine effectiveness for one dose of mmr was 96.7% (95% ci: 94.5–98.0%). for at least one dose, vaccine effectiveness was estimated to be 98.7% (95% ci: 97.9–99.2%) and for two doses, it was 99.7% (95% ci: 99.2–99.9%) (table 1). table 1. vaccination status and vaccine effectiveness for notified measles cases and matched controls, australia, 2006–2012 click to download table 1. jpg, 254kb ci, confidence interval; ve, vaccine effectiveness. stratified analysis for age revealed that the estimated vaccine effectiveness for one dose of mmr was 97.9% (95% ci: 95.8–98.9%) for those aged 0 to 5 years, 98.6% (95%ci: 91.8–99.8%) for those aged 6 to 10 years and 82.7% (95%ci: 58.9–92.7%) for those aged 11 to 15 years. the estimate of the 11 to 15 year age group was significantly lower than that of the 0 to 5 year age group. among these age groups, vaccine effectiveness estimates for two doses ranged from 99.3% to 99.8%. the differences among each group were not significant (table 2). table 2. vaccination status and vaccine effectiveness estimates for notified measles cases and matched controls stratified by age group, australia, 2006–2012 click to download table 2. jpg, 344kb ci, confidence interval; ve, vaccine effectiveness. sensitivity analysis when all cases with unknown vaccination status were categorized as having been vaccinated, 16 individuals were categorized as receiving two doses and two individuals were categorized as receiving one dose. the vaccine effectiveness was then estimated at 96.9% for one dose (95% ci: 94.9–98.1%) and 99.1% (95% ci: 98.3–99.5%) for two doses. when all 18 individuals with unknown vaccination status were categorized as unvaccinated, the vaccine effectiveness estimate was 97.5% for one dose (95% ci: 95.7–98.6%) and 99.8% for two doses (95% ci: 99.5–99.9%) (table 3). table 3. sensitivity analyses of vaccination status and vaccine effectiveness for notified measles cases and matched controls, australia, 2006–2012 click to download table 3. jpg, 470kb * eighteen cases with unknown vaccination status were excluded from the original analysis. dosage was categorized according to the age of the individual. ci, confidence interval; ve, vaccine effectiveness. no significant differences were found in the estimates of these two scenarios when compared to the original estimates. discussion vaccine effectiveness estimation is a critical component for evaluating an immunization schedule and its changes. though it was unlikely that poor vaccine effectiveness played a part in contributing to measles transmission in australia between 2006 and 2012, it is nevertheless important to conduct regular vaccine effectiveness analyses to rule out possible vaccine failure as a contributing factor. as australia strives to maintain measles elimination status (broadly defined as the absence of transmission of endemic measles11), it is critical not only to understand why and how transmission continues to occur but also to be able to document all evidence that explains current measles epidemiology. this study is an important contribution to this evidence. results demonstrated that australian measles vaccine has been effective (overall at least one dose was found to be 98.7%). the vaccine effectiveness estimates were similar to those following the 2006 new south wales outbreak that yielded 96% vaccine effectiveness.5 recent analyses from other developed countries have also concluded similar effectiveness12–14 with the exception of a study in 2008 for a population-wide outbreak in ukraine that concluded 93.1% effectiveness for two doses.15 selection and misclassification biases are known to affect vaccine effectiveness analyses. specifically, problems with case definitions, case ascertainment and ascertainment of vaccination status may bias the analysis.16 in this study, biases were reduced by using standard notification procedures with a sensitive case definition which minimized the number of missing cases. the distinct clinical features, high infectivity of the illness and the required laboratory evidence (both for probable and confirmed cases) minimized case misclassification.17 suspected cases were also not reported to the nndss.18 it was possible that using de-identified acir data to obtain controls may have resulted in a case being matched to his/her self. however, due to the availability of numerous eligible matches, of which 20 were randomly selected, the possibility of this occurring was considered rare. vaccination status data were obtained from the nndss and were reliant upon the information provided by each state and territory. while vaccination status is only sometimes validated by medical records and acir data, self-reported data may be subject to recall bias. studies have demonstrated that parental recall of vaccination status may overestimate vaccination coverage and a requirement for written verification may lead to underestimates.19,20 notes from the 2012 new south wales outbreak cases revealed that sometimes self-reports were accepted as proof of vaccination. for this analysis, vaccination status was accepted as whatever was reported in the nndss data. in this report, the high number of cases with unknown vaccination status (8.7%, n = 18/207) may have been influenced by more than just incomplete nndss data. it has been suggested that the acir may underestimate coverage by 5% for both first and second doses of measles-containing vaccines.21 although the results from the sensitivity analyses showed no significant differences compared to the original estimates where 18 cases were excluded due to unknown vaccination status, it is evident that the recording of vaccination status could be improved. finally, confounding may be problematic for the analysis. socioeconomic data were not available in the data set for adjustment in this study. cases and controls were, however, matched by date of birth and jurisdiction of residence. also, cases and controls were found not significantly different in regards to gender or indigenous status. if vaccine effectiveness was excluded as a contributing factor in recent transmission and outbreaks in australia, it may mean vaccination coverage has remained problematic to maintaining measles elimination. the australian nationwide coverage estimates from 2010 reported 93.9% mmr coverage for those aged 24-months and 89.1% for those aged 60 months with new south wales-specific coverage estimates at 93.8% and 89.3% for 24 months and 60 months of age, respectively.3 these percentages, however, conceal small pockets of lower coverage rates. the lowest 24-month coverage rates by medicare local catchments were recorded by north coast new south wales and eastern sydney at 89%. the lowest 60 month coverage rate was recorded in eastern sydney at 84%.22 these coverage estimates fall well short of the 95% mark, which is what world health organization (who) guidelines state is required to maintain elimination.18 the 2012 new south wales outbreak highlighted areas where coverage gaps exist, demonstrating that those aged 10 to 19 years (29.2%, n = 40/168) and those of pacific islander descent (21.4%, n = 36/168) comprised a high proportion of cases.4 evidence suggests that south western sydney high school students of pacific islander background may have missed out on routine childhood vaccinations both before and after their arrival in australia.4 although vaccination coverage among pacific island nations varies,23 who and the united nations children’s fund estimates of samoan vaccination coverage between 2003 and 2011 range from 45% to 67%; it is only in 2012 that estimates appear higher at 85%.23 those aged 10 to 19 years who were born in australia were eligible to have received two doses of measles-containing vaccine as part of the 1998 measles control campaign that successfully vaccinated 96% of the targeted primary school age group.24 further studies are needed to better understand the nature of the coverage gaps among this age group and those of pacific islander descent for targeted strategies to improve vaccination uptake. in addition to coverage gaps, waning immunity was likely a cause of recent measles outbreaks. the vaccine effectiveness estimate calculated for those aged 11 to 15 years who had received one dose of vaccine was lower (82.7%) than that of the younger age groups (99.7% and 98.6% for those aged 0 to 5 years and those aged 6 to 10 years, respectively). this suggested that vaccine-induced immunity may be waning among older children, particularly if they have received only one dose of vaccine.25,26 maternal antibody-induced immunity may also be waning earlier than anticipated. though infant data were not incorporated into this study, infants are at high risk for measles infection and transmission; thus this age group is a critical component for understanding measles epidemiology. in the new south wales 2012 outbreak, infants less than 1 year of age comprised 21.4% (n = 36) of cases.4 if this is indeed indicative of early waning of maternal antibodies, it may be problematic as more mothers are protected by vaccine-conferred immunity rather than immunity induced by measles infection.27–30 although recent serosurvey results have demonstrated an effective reproductive number (r) of 31 a 2013 report noted that seropositivity has decreased since 1999 and that r could be approaching 1.32 this could be a major setback for australia’s sustained measles elimination. conclusion our results not only provided evidence that vaccination failure had not contributed to measles infections between 2006 and 2012 but also served to evaluate measles immunization programmes in australia. the analyses assisted in describing elimination era measles epidemiology and also highlighted the contribution of vaccination coverage gaps which require targeted improvement. in addition, vaccine effectiveness analyses served as essential contributions to maintain public and provider confidence in vaccinations, which are vital for maintaining measles elimination status in australia and advancing the elimination goal globally. conflicts of interest none declared. funding none. acknowledgements the authors would like to acknowledge the vaccine preventable diseases surveillance section, health emergency management branch, office of health protection, australian government department of health for data from the national notifiable diseases surveillance system and medicare australia, department of human services for acir data. references national centre for immunisation research and surveillance (ncirs). significant events in measles, mumps and rubella vaccination practice in australia. new south wales, the university of sydney, 2013. available from: http://www.ncirs.edu.au/immunisation/history/measles-mumps-rubella-history-december-2013.pdf [accessed 15 june 2015]. australian technical advisory group on immunisation (atagi). the australian immunisation handbook, 10th edition. canberra, australian government department of health and ageing, 2013. available from: http://www.immunise.health.gov.au/ internet/immunise/publishing.nsf/content/handbook10-home [accessed 15 june 2015]. hull b et al. annual immunisation coverage report, 2010. communicable diseases intelligence quarterly report, 2013, 37:e21–39. pmid:23692156 najjar z et al. sustained outbreak of measles in new south wales, 2012: risks for measles elimination in australia. western pacific surveillance and response journal, 2014, 5:14–20. doi:10.5365/wpsar.2013.4.4.001 pmid:25635228 sheppeard v et al. vaccine failures and vaccine effectiveness in children during measles outbreaks in new south wales, march–may 2006. communicable diseases intelligence quarterly report, 2009, 33:21–26. pmid:19618764 australian national notifiable diseases case definitions: measles case definition. canberra, australian government department of health and ageing, 2004. available from: http://www.health.gov.au/internet/main/publishing.nsf/content/cda-surveil-nndss-casedefs-cd_measl.htm [accessed 15 june 2015]. hull bp, deeks sl, mcintyre pb. the australian childhood immunisation register-a model for universal immunisation registers? vaccine, 2009, 27:5054–5060. doi:10.1016/j.vaccine.2009.06.056 pmid:19576945 quinn he et al. duration of protection after first dose of acellular pertussis vaccine in infants. pediatrics, 2014, 133:e513–519. doi:10.1542/peds.2013-3181 pmid:24515514 orenstein wa et al. field evaluation of vaccine efficacy. bulletin of the world health organization, 1985, 63:1055–1068. pmid:3879673 number of notifications of measles, received from state and territory health authorities in the period of 1991 to 2012 and year-to-date notifications for 2013. canberra, national notifiable diseases surveillance system (nndss), 2013. field guidelines for measles elimination. manila, world health organization regional office for the western pacific, 2004. available from: http://www.wpro.who.int/ publications/docs/fieldguidelines_for_measleselimination_0f24.pdf [accessed 15 june 2015]. arenz s et al. effectiveness of measles vaccination after household exposure during a measles outbreak: a household contact study in coburg, bavaria. the pediatric infectious disease journal, 2005, 24:697–699. doi:10.1097/01.inf.0000172900.70430.c2 pmid:16094223 wichmann o et al. large measles outbreak at a german public school, 2006. the pediatric infectious disease journal, 2007, 26:782–786. doi:10.1097/inf.0b013e318060aca1 pmid:17721371 yeung lf et al. a limited measles outbreak in a highly vaccinated us boarding school. pediatrics, 2005, 116:1287–1291. doi:10.1542/peds.2004-2718 pmid:16322148 velicko i et al. nationwide measles epidemic in ukraine: the effect of low vaccine effectiveness. vaccine, 2008, 26:6980–6985. doi:10.1016/j.vaccine.2008.09.012 pmid:18805455 torvaldsen s, mcintyre pb. observational methods in epidemiologic assessment of vaccine effectiveness. communicable diseases intelligence quarterly report, 2002, 26:451–457. pmid:12416713 hinman ar, orenstein wa, papania mj. evolution of measles elimination strategies in the united states. the journal of infectious diseases, 2004, 189 suppl 1;s17–22. doi:10.1086/377694 pmid:15106084 heywood ae et al. elimination of endemic measles transmission in australia. bulletin of the world health organization, 2009, 87:64–71. doi:10.2471/blt.07.046375 pmid:19197406 lister s et al. immunisation coverage in australian children: a systematic review 1990–1998. communicable diseases intelligence, 1999, 23:145–170. pmid:10432761 hawe p. measles control: a best-practice challenge in public health. australian journal of public health, 1994, 18:241–243. doi:10.1111/j.1753-6405.1994.tb00237.x pmid:7841249 hull bp et al. immunisation coverage in australia corrected for under-reporting to the australian childhood immunisation register. australian and new zealand journal of public health, 2003, 27:533–538. doi:10.1111/j.1467-842x.2003.tb00829.x pmid:14651401 healthy communities: immunisation rates for children in 2011–2012. sydney, national health performance authority, 2013. available from: http://www.nhpa.gov.au/internet/nhpa/publishing.nsf/content/report download-healthy-communities-immunisation-rates-for-children-in-2011-12/$file/hc_immrate_techsupp_final_web.pdf [accessed 15 june 2015]. who vaccine-preventable diseases: monitoring system: 2013 global summary. geneva, world health organization, 2015. available from: http://apps.who.int/immunization_monitoring/globalsummary [accessed 15 june 2015]. turnbull fm et al. the australian measles control campaign, 1998. bulletin of the world health organization, 2001, 79:882–888. pmid:11584738 chen cj et al. waning population immunity to measles in taiwan. vaccine, 2012, 30:6721–6727. doi:10.1016/j.vaccine.2012.05.019 pmid:22634294 he h et al. waning immunity to measles in young adults and booster effects of revaccination in secondary school students. vaccine, 2013, 31:533–537. doi:10.1016/j.vaccine.2012.11.014 pmid:23159458 ramsay me et al. the elimination of indigenous measles transmission in england and wales. the journal of infectious diseases, 2003, 187 suppl 1;s198–207. doi:10.1086/368024 pmid:12721914 wise j. measles outbreak hits northeast england. british medical journal, 2013, 346:f662. doi:10.1136/bmj.f662 pmid:23369777 vivancos r et al. an ongoing large outbreak of measles in merseyside, england, january to june 2012. euro surveillance: european communicable disease bulletin, 2012, 17. pmid:22835470 measles outbreak cases rise again as school vaccinations enter final week. cardiff, public health wales, 2013. available from: http://www.wales.nhs.uk/sitesplus/ 888/news/27327 [accessed 15 june 2015]. gidding hf et al. sustained measles elimination in australia and priorities for long term maintenance. vaccine, 2007, 25:3574–3580. doi:10.1016/j.vaccine.2007.01.090 pmid:17300858 wood j et al. declining seropositivity in australia and elimination status. canberra, communicable disease control conference, 19–20 march 2013. epidemic hysteria following the national school deworming day, zamboanga peninsula, philippines, 2015 field investigation report johnette a. peñas,a vikki carr de los reyes,a ma. nemia l. sucaldito,a julius erving d. ballera,a herdie l. hizon,a rio l. magpantay,a vicente y. belizario jra and kenneth hartigan-goa a department of health, philippines. correspondence to johnette a peñas (email:penasjohnettea@gmail.com). to cite this article: peñas ja, de los reyes vc, sucaldito mnl, ballera jed, hizon hl, magpantay rl, et al. epidemic hysteria following the national school deworming day, zamboanga peninsula, philippines, 2015. western pac surveill response j. 2018 dec;9(4). doi:10.5365/wpsar.2017.8.1.009 abstract introduction: in july 2015, the philippines conducted a school-based mass drug administration using albendazole for soil-transmitted helminths infection. reports of adverse events were subsequently made through the event-based surveillance system, mostly from the zamboanga peninsula on the island of mindanao. a team from the epidemiology bureau investigated the reports of adverse events following mass drug administration (aefmda). methods: five schools were identified for the investigation which comprised an unmatched case-control study, key informant interviews and laboratory examinations. aefmda cases were students who had sudden onset of abdominal pain, vomiting, diarrhoea, loss of consciousness, headache or dizziness within 24 hours after intake of deworming tablet; controls were healthy students who did not develop signs and symptoms after deworming. results: most (85%) of the 7313 aefmda cases reported nationwide were from zamboanga peninsula. most reports were made after rumours of deaths following deworming and of the use of expired drug were spread through the region. many parents sent their children to hospital, even if asymptomatic. the case-control study found that being an aefmda case was associated with no history of previous deworming (odds ratio = 4.08, 95% confidence interval: 1.77–9.42). discussion: the investigation concluded that epidemic hysteria was the cause of the increased number of aefmda cases in the zamboanga peninsula. the false information, aggravated by social media, caused panic and an increase in reporting. some cases had no history of deworming, and they may not have been aware that albendazole is safe and that side-effects are expected. risk communication before, during and after future national deworming programmes are recommended to prevent unnecessary reporting of aefmda. introduction over 2 billion people suffer from soil-transmitted helminths worldwide.1 in the philippines, soil-transmitted helminths affect all provinces.2 before the implementation of the national school deworming day (nsdd) in 2015, month-long nationwide deworming programmes were administered to preschool-age children (1–4 years old) in the community by city and rural health units, while school-age students (5–18 years old) were dewormed by the department of education in public elementary and secondary schools.2,3 the prevalence of soil-transmitted helminths has decreased from 66% among children aged 1–5 years old and 65% among children aged 6–14 years old in 2003 to 28.4% in school-aged children in 2013–2015.4,5 mass deworming programmes in school-age children are recommended by the world health organization (who).1,6 the philippines department of health, in partnership with the department of education, conducted the first nsdd on 29 july 2015.3 the nsdd aimed to deworm approximately 16 million school-age children enrolled in all public elementary schools in one day to reduce the burden of soil-transmitted helminths infections. it was anticipated that the nsdd strategy would have a major impact on the integrated helminth control program accomplishments, and pilot projects in regions 6 and 11 showed that a one-day deworming programme is feasible and improves the efficiency of service delivery among the target population.7 on the day of the nsdd, cases of adverse events following mass drug administration (aefmda) were reported to the national event-based surveillance system from schools, health centres and hospitals. most reports were from the zamboanga peninsula in region 9 on the island of mindanao. therefore, a team from the epidemiology bureau of the department of health was sent to zamboanga peninsula to investigate the reports of aefmda. methods case finding the zamboanga peninsula region had the highest number of reports of aefmda in the event-based surveillance system and was therefore selected for the investigation. due to insurgency and armed conflict in some areas of the region, five schools that had reported cases and were identified as being safe by the zamboanga peninsula regional epidemiology surveillance unit were selected for the investigation. case-control study a 1:2 unmatched case-control study was conducted in the five schools. a standard questionnaire with closedand open-ended questions was used to identify sociodemographic risk factors and exposure history. an aefmda case was any student from the selected schools on the zamboanga peninsula who reported abdominal pain, vomiting, diarrhoea, loss of consciousness, headache or dizziness within 24 hours after intake of deworming tablet on 29 july 2015. a control was any healthy student from the same schools who did not develop any signs and symptoms after receiving the deworming tablet on 29 july 2015. only those students whose parents and teachers consented to the interview were included in the study. cases were classified based on who guidelines for degree of severity.8,9 odds ratios (or), 95% confidence intervals (ci) and p-values were calculated using epi info version 3.5.4. risk factors approaching significance (p key informant interviews semi-structured interviews were conducted in person with zamboanga peninsula health and school personnel who were involved in the conduct of the nsdd. information about activities before, during and after the nsdd were elicited. laboratory examination rectal swabs were collected from cases and sent to the research institute for tropical medicine for bacteriological culture for salmonella, shigella, vibrio and staphylococcus species. albendazole samples of the same batch and lot number as the deworming tablets used during the nsdd were collected from schools and health centres and sent to the food and drug administration for testing for the active component. results of the almost 12 million children administered deworming tablets during the nsdd, there were 7330 aefmda cases reported to the event-based surveillance system (0.06%). most of these (6236/7330, 85%) were from the zamboanga peninsula, giving an incidence proportion of 1.28% (6236/486 490). case-control study there were 77 cases of aefmda identified at the five selected schools included in the case-control study. their ages ranged from 6 to 16 years (median = 10 years) and 39 (51%) were males. the most affected age group was the 10–14-year-olds. there were 154 controls identified, with the same age and sex distribution as cases (table 1). table 1. factors associated with reporting adverse events following the national school deworming day, zamboanga peninsula, the philippines, july 2015 click to download table 1. jpg, 490kb signs and symptoms of the 77 aefmda cases included abdominal pain (95%), headache (47%) and vomiting (34%). thirty-nine (51%) cases were hospitalized, and there were no deaths reported. there were 11 cases (14%) classified as severe, 20 (26%) as moderate and 46 (60%) as mild. the onset of symptoms ranged from less than 1 to 13 hours after deworming (median = 4 hours). the nutritional status of most cases was normal (91%). respondents were asked if they had washed their hands before the deworming activity, and 45 (58%) cases reported handwashing. sixty-five (84%) reported taking the tablet with food, and 17 (22%) had no previous history of deworming. in the case-control analysis, having no history of previous deworming was associated with being an aefmda case (or = 4.08, 95% ci: 1.77–9.42), whereas the reporting of handwashing was inversely associated with being an aefmda case (or = 0.56, 95% ci: 0.32–0.997). in the multivariable analysis, no history of deworming was the only risk factor associated with being an aefmda case (or = 4.08, 95% ci: 1.77–9.42) (table 1). key informant interviews a total of 15 personnel were interviewed (five from the health department and 10 from schools). there was no remarkable incidents recorded during the deworming administration other than the chronology of events. the interviewees suggested that there was insufficient orientation in schools and for parents before the nsdd and that parents believed that their children were harmed due to the deworming. schools that administered the deworming tablets before 10:00 experienced no problems. it wasn’t until a text message circulated that reported that several students in the region had died due to the deworming activity that the reports of aefmda started. pictures of expired albendazole tablets claimed to have been used during the nsdd were also circulated through social media. it was thought that these rumours resulted in panic at the schools and in the community as parents rushed to the schools and insisted their children be sent to hospital, even those children without symptoms. it was also reported that when some children began to report abdominal pain and headache, other children within the same classrooms began to report the same symptoms. in some villages, the village head also announced that all children who received the deworming tablet should go to the hospital. directly after this, there was a large increase in cases (fig. 1). fig. 1. epidemic curve of cases that reported adverse events following the national school deworming day, zamboanga peninsula, the philippines, july 2015 (n = 77) click to download figure 1. jpg, 294kb laboratory examination bacteriological culture of rectal swabs collected from 14 cases revealed one (7%) positive for vibrio mimicus, with the remainder negative for all pathogens. all 24 albendazole samples conformed to the drug standard of active component. discussion we concluded from this investigation that the aefmda cases reported in the zamboanga peninsula region after the nsdd were primarily due to epidemic hysteria. the high proportion of total aefmda cases reported from this region, coupled with the misinformation spread in the community, contributed to the increase of reported cases. the deworming tablets used conformed to drug standards, were used throughout the country and were therefore unlikely to have caused the high number of reported side-effects. epidemic hysteria has been defined as a group of symptoms suggestive of organic illness but without identifiable cause.10 schools are the most common setting for epidemic hysteria outbreak with triggering factors including events and rumours.11 in this investigation, several triggers were identified, including the spread of a text message across the entire region during the nsdd that claimed there were children who died following the intake of the deworming tablet and the circulation of false reports in social media that the deworming tablets used by the department of health for the nsdd were expired; both falsehoods were aggravated by media coverage. that insufficient orientation was provided to the schools and parents about the expected side-effects of the deworming tablets also contributed to the increase in reported cases. epidemics of mass hysteria attract media attention, which usually results in an escalation of such outbreaks.12 having no history of previous deworming was significantly associated with aefmda cases. the children who had not been dewormed previously and their parents were perhaps less likely to know that taking albendazole is safe and that mild side-effects are expected as they had no experience with the drug. side-effects occur as the worms pass through a child’s body; mild and moderate adverse reactions are more common after the first dose as children dewormed for the first time are most likely to be heavily infected.6,13 heavily infected children may experience mild side-effects following deworming, and their reports may trigger other school children to claim similar symptoms even when they are asymptomatic.6 mass hysteria following a health intervention has also been reported in schools of islamic republic of iran, italy, canada, jordan and china following vaccinations.14 in 2007, epidemic hysteria occurred in ghana during a mass elimination campaign of helminths where trained teachers administered mebendazole tablet to nearly 4.5 million children in public schools. similar to this study, a few hours later, there was news on local radio of deaths due to the programme, which resulted in a wave of unrest and mass hysteria. such incidents highlight the need for active pharmacovigilance, excellent risk communication and planning of crisis management.15 during this incident, the department of health and department of education used risk communication to appease the public. community assemblies were held and national press releases explaining the nsdd, the potential side-effects of albendazole and the health importance of the programme were disseminated. the public were informed that the medications used during the nsdd were not expired, there had been no deaths related to the deworming tablet and that side-effects are expected, especially in heavily infected children. risk communication efforts conducted following adverse events after health interventions in bangladesh, pakistan, india and afghanistan have shown to be effective in regaining public trust.16 in march 2016, guidelines on the implementation of the nsdd were amended.17 all school-age children shall be dewormed in one month through the national school deworming month. there are some limitations to this investigation. psychological testing and assessment of general cognitive abilities of children were not conducted, which may have strengthened the diagnosis of mass hysteria. another limitation was the unavailability of parasitological data, which may have shown the relationship between reported adverse events and severity of infection. the insurgency and armed conflict in some parts of the region limited the availability of schools to participate in the case-control study, and the small number of respondents may not be generalizable to the whole population of the region. vibrio mimicus was isolated from one case but is unlikely the cause of this event since its incubation period (15-24 hours)18 was not consistent with the event. although the reported aefmda was low during this deworming programme compared to other studies, the negative impact of the mass hysteria from false reporting may affect the future implementation of the national deworming programme. school and community education efforts that focus on providing a greater understanding of adverse reactions may prevent this and help to achieve the goal of the nsdd. risk communication before, during and after nsdd in the future is highly recommended. conflicts of interest none. funding this field investigation was funded by the department of health, philippines. acknowledgements we are grateful for the cooperation and support of the department of health regional office – zamboanga peninsula, provincial and local government units in zamboanga peninsula, the police security, zamboanga city medical center, alicia district hospital, tugbungan elementary school, sangali elementary school, haron a. kiram naga-naga elementary school, paradise elementary school, gulayan integrated school polanco central school during the field investigation. we also thank ms rowena capistrano and the laboratory staff of the research institute for tropical medicine and ms sharon rose p garcia and the food and drug administration for facilitating and testing the samples collected. references the effect of a deworming intervention to improve early childhood growth and development in resource-poor areas. bethesda, md: clinicaltrials.gov; 2014 (https://clinicaltrials.gov/ct2/show/nct01314937, accessed 31 july 2015). the philippines work plan: fy 2018, project year, 7 october 2017 – september 2018. washington, dc: envision; 2018 (https://www.ntdenvision.org/sites/default/files/docs/philippines_fy18_py7_envision_wp.pdf,, accessed 30 september 2018). administrative order no. 2015–0030. guidelines on the implementation of the national school deworming day. manila: department of health; 2015 (https://ais.doh.gov.ph/uploads/aopdf/ao2015-0030(2).pdf, accessed 14 august 2015). national objectives for health, philippines, 2005–2010. manila: department of health; 2005 (https://www.doh.gov.ph/sites/default/files/publications/noh2005.pdf, accessed 30 september 2018). doh conducts national deworming month to reinforce prevention and control of soil-transmitted helminths. manila: department of health; 2018 (https://www.doh.gov.ph/node/10545, accessed 30 september 2018). school deworming at a glance. geneva: world health organization; 2003 (http://www.who.int/intestinal_worms/resources/en/at_a_glance.pdf, accessed 31 july 2015). guidelines on the implementation of national school deworming day. pasig city: department of education; 2015 (http://www.deped.gov.ph/2015/07/24/july-24-2015-dm-80-s-2015-guidelines-on-the-implementation-of-the-national-school-deworming-day-nsdd/, accessed 14 august 2015). njenga sm, ng’ang’a pm, mwanje mt, bendera fs, bockarie mj. a school-based cross-sectional survey of adverse events following co-administration of albendazole and praziquantel for preventive chemotherapy against urogenital schistosomiasis and soil-transmitted helminthiasis in kwale county, kenya. plos one. 2014 feb 10;9(2):e88315. doi:10.1371/journal.pone.0088315 pmid:24520365 assuring safety of preventive chemotherapy interventions for the control of neglected tropical diseases – practical advice for national programme managers on the prevention, detection and management of serious adverse events. geneva: world health organization; 2011 (http://apps.who.int/iris/bitstream/10665/44683/1/9789241502191_eng.pdf, accessed 14 august 2015). jones tf. mass psychogenic illness: role of the individual physician. am fam physician. 2000 dec 15;62(12):2649–53, 2655–6. pmid:11142471 boss lp. epidemic hysteria: a review of the published literature. epidemiol rev. 1997;19(2):233–43. doi:10.1093/oxfordjournals.epirev.a017955 pmid:9494785 govender i. mass hysteria among south african primary school learners in kwa-dukuza, kwazulu-natal. sa fam pract. 2010;52(4):318–21. doi:10.1080/20786204.2010.10873998 preventive chemotherapy in human helminthiasis coordinated use of anthelminthic drugs in control interventions: a manual for health professionals and programme managers. geneva: world health organization; 2006 (http://apps.who.int/iris/bitstream/10665/43545/1/9241547103_eng.pdf, accessed 14 august 2015). clements cj. mass psychogenic illness after vaccination. drug saf. 2003;26(9):599–604. doi:10.2165/00002018-200326090-00001 pmid:12814329 dodoo a, adjie s, couper m, hugman b, edwars r. when rumours derail a mass deworming exercise. lancet. 2007 aug 11;370(9586):465-6 building trust and responding to adverse events following immunization in south asia: using strategic communication. kathmandu: unicef regional office for south asia; 2005 (https://www.unicef.org/cbsc/files/immunisation_report_17may_05(final_editing_text).pdf, accessed 30 september 2018). amendment to administrative order no. 2015-0030 dated 26 june 2015 entitled “guidelines on the implementation of national school deworming day”. manila: department of health; 2016 (https://ais.doh.gov.ph/uploads/aopdf/ao2015-0030-a.pdf, accessed 5 november 2018). noncholera vibrio infections. kenilworth, nj: msd manual; 2014 (http://www.msdmanuals.com/professional/infectious-diseases/gram-negative-bacilli/noncholera-vibrio-infections, accessed 26 august 2015). leveraging social networking sites for disease surveillance and public sensing: the case of the 2013 avian influenza a(h7n9) outbreak in china original research emma xuxiao zhang,a* yinping yang,b* richard di shang,c joseph john pyne simons,b boon kiat quek,b xiao feng yin,b wanhan see,a olivia seen huey oh,a khine sein tun nandar,a vivienne ruo yun ling,a pei pei chan,a zhaoxia wang,b rick siow mong goh,b lyn jamesa and jeannie su hui teya a epidemiology and disease control division, public health group, ministry of health, singapore. b social and cognitive computing department and computing science department, institute of high performance computing (ihpc), agency for science, technology and research (a*star), singapore. c school of business, public administration and information sciences, long island university brooklyn, new york, united states of america. * the first two authors contributed equally to this study. correspondence to jeannie su hui tey (e-mail:jeannie_tey@moh.gov.sg). to cite this article: zhang ex et al. leveraging social networking sites for disease surveillance and public sensing: the case of the 2013 avian influenza a(h7n9) outbreak in china. western pacific surveillance and response journal, 2015, 6(2):66–72. doi:10.5365/wpsar.2015.6.1.013 abstract we conducted in-depth analysis on the use of a popular chinese social networking and microblogging site, sina weibo, to monitor an avian influenza a(h7n9) outbreak in china and to assess the value of social networking sites in the surveillance of disease outbreaks that occur overseas. two data sets were employed for our analysis: a line listing of confirmed cases obtained from conventional public health information channels and case information from weibo posts. our findings showed that the level of activity on weibo corresponded with the number of new cases reported. in addition, the reporting of new cases on weibo was significantly faster than those of conventional reporting sites and non-local news media. a qualitative review of the functions of weibo also revealed that weibo enabled timely monitoring of other outbreak-relevant information, provided access to additional crowd-sourced epidemiological information and was leveraged by the local government as an interactive platform for risk communication and monitoring public sentiment on the policy response. our analysis demonstrated the potential for social networking sites to be used by public health agencies to enhance traditional communicable disease surveillance systems for the global surveillance of overseas public health threats. social networking sites also can be used by governments for calibration of response policies and measures and for risk communication. introduction on 31 march 2013, china announced the world’s first three human cases of avian influenza a(h7n9) in shanghai and anhui provinces.1 this was followed by reports of further cases in over 16 provinces/municipalities of china and exportation of infection to china, hong kong special administrative region, malaysia and taiwan, china. most human cases of a(h7n9) infection were severe and were characterized by rapidly progressive pneumonia and acute respiratory distress syndrome.2 there was significant international concern about the impact of this novel infection on global health and security.3,4 in singapore, to follow the rapidly evolving a(h7n9) outbreak in china, we supplemented information obtained from conventional public health information channels with posts from sina weibo (www.weibo.com; weibo). weibo is a popular social networking site in china with more than 500 million registered users as of february 2013. it was one of the fastest social networking platforms to report breaking news on a(h7n9) and was leveraged by health authorities, media and the public to monitor outbreak-related information.5 to evaluate the relevance of social networking sites as a new platform in the global surveillance of disease outbreaks external to singapore, we carried out an in-depth analysis to review and verify the functions of weibo in the monitoring of the a(h7n9) outbreak in china. method for our analysis, we consolidated two data sets. the first included a line listing of confirmed cases obtained from conventional public health information channels, including the official website of chinese national health and family planning commission (nhfpc); the event information site of the world health organization (who) and email alerts from a leading international news agency, agence france-presse (afp). the second data set included weibo posts containing the search phrase “h7n9”. we obtained the weibo data set from an authorized provider. to ensure data quality and reduce data noise, we solicited posts from authenticated users whose identities had been verified by weibo. we focused our analysis period from 31 march to 30 april 2013 for two reasons: (1) the outbreak started on 31 march and the majority of cases during the first wave of the outbreak were recorded in april (126 cases of the total of 133); (2) daily reporting of cases by the nhfpc website was only available during the first wave. we performed two types of analysis: (1) quantitative analysis to compare the timeliness of reporting of new cases by the various information channels; (2) qualitative analysis on the weibo users with the timeliest posts on new cases. weibo posts that were the first to report the 126 cases were retrieved, and information including time of reporting, reporter account and epidemiological information of the cases was recorded. to identify the timeliest reporter of each case, we used the advanced search function of weibo. key phrase “h7n9” was used, and the search was restricted to authenticated users. time duration was narrowed down to only one hour to allow retrieval of all posts as weibo tends to automatically exclude posts if the volume is too large. the location of posts was left unspecified. the search results were compared against the line listing of cases confirmed by who to identify the earliest reporter. for comparison of timeliness of reporting by various channels, statistical analysis was performed to assess the significance of any temporal differences in the reporting. non-parametric wilcoxon signed-rank test was used as the temporal differences were not normally distributed. the analysis was performed in spss 16.0. a statistically significant result was defined as p to explore the factors contributing to the timeliness of reporting by weibo, we performed qualitative analysis to examine the characteristics of the users with the timeliest post on new cases. we also analysed the content of the posts to qualitatively assess other aspects in which weibo was used. to ensure data reliability, we checked the information manually against the line listing of the corresponding cases confirmed by who. results between 31 march and 30 april 2013, china reported 126 cases of a(h7n9). correspondingly, 718 419 posts, or an average of about 23 175 per day, were posted on weibo. the volume of social media discussion corresponded to the number of reported cases (figure 1). the increasing number of cases from 10 april onward was accompanied by a surge in the number of posts, indicative of the public’s heightened awareness of the disease while the outbreak appeared to be gaining momentum. a peak of 48 255 daily posts was recorded on 16 april when the highest daily number of 16 cases was reported. weibo users’ interest in a(h7n9) plummeted briefly on 21 april and 24 april, probably due to a shift in attention toward other major events: an earthquake in china’s sichuan province on 21 april and social unrest in china’s xinjiang province on 24 april. figure 1. the number of weibo posts on “h7n9” and the number of new a(h7n9) cases confirmed by authorities by day, 31 march to 30 april 2013 click to download figure 1. jpg, 393kb a comparison of reporting times revealed that weibo was significantly faster in reporting new cases than the conventional public health channels including the nhfpc, afp and who (p figure 2). reporting of new cases on weibo was an average of 1 hour 2 minutes before the nhfpc website with a maximum lead time of 20 hours and 35 minutes. this lead was even greater when weibo reporting was compared with that of afp with the latter reporting an average of 8 hours and 14 minutes after the nhpfc. the average lead was more pronounced when compared to who that reported cases an average of 23 hours and 13 minutes after the nhpfc (figure 2). the delay in the announcement by who was expected as who reports only cases that are notified to them by member states (china in this case) in accordance with the international health regulations (2005).6 in addition, further time lag would be incurred if clarification or confirmatory testing of the cases were required. figure 2. timeliness of reports on a(h7n9) cases by weibo, afp and who compared with nhfpc, 31 march to 30 april 2013* click to download figure 2. jpg, 353kb * the zero-hour baseline represents the time of reporting by the nhfpc. afp, agence france-presse; nhfpc, national health and family planning commission of china; and who, world health organization. the weibo users with the timeliest report on new cases comprised province/municipality-based news agencies, including zhejiang daily (the official newspaper of zhejiang provincial government), modern express and china exclusive (both belong to xinhua news agency, the official news agency of the chinese central government) (table 1). the veracity of the data reported from these users is likely to be high, and this was confirmed when manual verification of the information from these posts and those from official reports showed high level of concurrence. upon release of information by the provincial/municipal health authorities, these news agencies posted the news on their weibo account immediately, before reporting on their conventional websites. in contrast, announcement at the nhfpc website typically lagged behind and was probably due to the additional time taken to collate information from the various provincial/municipal health authorities for the chinese central government’s daily updates. table 1. timeliest reporting of new a(h7n9) cases on weibo, 31 march to 30 april 2013 click to download table 1. jpg, 279kb in addition to monitoring outbreak development, the use of weibo enabled timely monitoring of other outbreak-relevant information. on 24 april, who held a press conference on its investigation findings in china; the transcript was posted in real-time on the nhfpc’s weibo feed, allowing instant access to the information from anywhere in the world. weibo also provided access to additional crowd-sourced epidemiological information on infected cases, such as updates on patients’ health conditions, exposure history and family contacts that were not readily available through official sources (table 2). such additional insights from weibo usually came from informants in the community whose ready access to social media enabled them to actively participate in disease surveillance. table 2. examples of crowd-sourced epidemiological information on weibo click to download table 2. jpg, 456kb from the perspective of the chinese health authorities, the rapid disclosure of information on social media appeared to have helped accelerate official response and reporting. for example, on 5 april, a weibo user posted pictures of dead sparrows in a nanjing residential area. the local authority promptly responded by cleaning the implicated premises and testing samples from the dead sparrows that were found to be negative for a(h7n9). in another case on 2 april, a medical document of a new case was disclosed by a weibo user. this was soon followed by the official announcement of the case by the implicated hospital on weibo along with official confirmation of four new cases by the nhfpc. social networking sites were leveraged by the chinese health authorities as an interactive platform for risk communication with the general public. during the outbreak, the chinese health authorities held many real-time question-and-answer sessions on weibo. in these sessions, doctors and experts addressed queries from the public in a real-time and interactive manner. weibo was also used by the chinese health authorities as a tool for assessing public sentiments to proposed outbreak response measures to guide policy decisions. in april 2013, a local news media conducted a survey on weibo to seek citizens’ views on permanent closure of live poultry markets (lpms) in shanghai.7 a total of 28.6% of the respondents supported permanent closure, while 30.4% opposed the idea. among all the respondents, over 77% suggested enhanced animal surveillance and better management of poultry in farms and markets. the shanghai health authority later ordered the temporary closure of lpms during the peak of the outbreak. in addition, the authorities initiated various infection control measures, including enhanced poultry surveillance and restriction of live poultry trading to designated markets which were subjected to weekly closure for disinfection and cleaning. from 27 april to 4 may the china nhfpc conducted a poll on weibo to survey public attitudes, concerns and expectations.8 the results showed that 93.4% of the respondents were satisfied with the information released by nhfpc’s weibo page and expressed support for continued transparent information-sharing to be conducted by the nhfpc via weibo. discussion our study was conducted from the perspective of public health agencies involved in the global surveillance of overseas public health threats. the findings of our analysis demonstrate the potential for public health agencies to acquire time-sensitive information on rapidly evolving outbreaks occurring outside of their countries through social networking sites. in our analysis, weibo served as a platform leveraged by central/provincial governments, local news agencies and the public for the timely release and retrieval of information. the chinese social networking sites’ timeliness of reporting are significantly better compared to international mainstream media in english, official websites of the central chinese government and who. information was released by the local news agencies on the social networking site in the local language before any reports in the conventional news websites or government websites. the information was subsequently amplified by the social networking sites through re-posting of the original report. this allowed the international community greater access to more detailed and timely information compared to that released at the central government level to the international media. the central chinese government may have allowed the provincial/municipal health authorities to release information on new cases when available to ensure transparency and timeliness of public communications. the access to such timely, crowd-sourced information on infected cases greatly facilitated the understanding of the epidemiology of an unknown disease, which is key in developing effective prevention and control measures. in view of the vast number of posts on various social networking sites, it would be important to employ the site(s) that have the most relevant user profiles, language medium and context to the country of interest. one limitation of the social media surveillance system is the initial difficulty in identifying reliable, consistent and timely information sources at the outset of surveillance since countless numbers of users would be posting on the topic of interest. time is usually required to monitor the information put out by various users and to compare them against verified reports to insure their relevance for inclusion into the surveillance system. the other limitation is the veracity of the information. while the analyses of posts could be limited to those from verified users only, we observed that the study of posts from layman users provided an understanding of the actual situation and sentiments in the affected country. this additional viewpoint could have a significant impact on outbreak control and consequently influence the risk assessment of the outbreak. there is also a possibility of inaccurate or false information being purposely propagated through social media that could affect the quality of the intelligence acquired from this source. to overcome this, verifying information against credible sources, including who and the health authorities of the affected country, is necessary. for the social media platform to be effective, there is also a need for the disease to be sufficiently novel to warrant the interest and concern of the people in the affected country for significant re-posting of information to occur; the affected population must have a thriving social networking scene with high participation and connectivity. despite this, re-posting can be still be insignificant due to apathy, low media coverage or diversion of public interest to other events as illustrated by the plunge in number of posts on 21 and 24 april in our study. our qualitative analysis showed the effective use of social media by the chinese health authorities in risk communication as well as gathering public sentiments on response options is an innovative strategy in public education, social mobilization and garnering support for the outbreak response measures. this echoes a previous study that demonstrated that social media could be a useful tool for public health practitioners to understand public reaction to disease outbreak information released by health authorities.9 an analysis of internet data during the a(h7n9) outbreak suggested that the early stage of the outbreak was accompanied by rapidly increasing public attention and thus was considered the best time frame for health authorities to engage the public, conduct education campaigns and control rumours.10 although social media is considered a less formal platform, health authorities around the world are increasingly using it for information access and dissemination.11–13 social media has been used as a central platform for the retrieval of information from various official sources; such use was highlighted by epidemiologists from the united states centers for disease control and prevention who used social media to monitor the a(h7n9) outbreak.14 there are, however, challenges to the use of social networking sites. constant monitoring and real-time analysis of a large influx of data with a high level of background noise, including rumours and unrelated information, is labour-intensive. identifying the most appropriate social media platform to use is also critical to ensure effectiveness. in this case, the use of weibo for the a(h7n9) outbreak in china would be more appropriate than global social media platforms such as twitter. language barriers can pose additional challenges; our ability to access and accurately interpret information from weibo was partly due to our being based in singapore where mandarin is an official language. our experience showed that it may be beneficial for public health agencies to recruit and maintain a workforce of epidemiologists who are multilingual for international disease surveillance in a foreign language. one limitation of our study is the selection of afp to represent international mainstream news media, particularly since chinese news media such as xinhua news agency would likely be faster in reporting new cases. afp was included in our comparison because global surveillance is carried out primarily in english, and we noted that afp was consistently one of the fastest global news agencies, along with reuters, british broadcasting company, cable news network and associated press, to deliver accurate and comprehensive news on global disease outbreaks. while xinhua news agency may report news on outbreaks located in china in a timelier manner compared to afp, we find it less relevant as a generic source of information for the surveillance of outbreaks outside of china. we envisage significant potential for social media surveillance to be incorporated into mainstream disease surveillance and response systems. for international public health practitioners, social media surveillance could provide early warning for unusual public health events in a foreign country and serve as an additional source of epidemiological intelligence to complement conventional surveillance tools. for local public health authorities, social media surveillance could function as an effective platform for public education and social mobilization. the underlying value coupled with the challenges of using social media warrants future research and collaboration between public health agencies and computational scientists to enhance its use in disease outbreak surveillance and response. conflicts of interest none declared. funding this study was supported in part by the social technologies+ programme funded by agency for science, technology and research (a*star) joint council office, singapore. acknowledgements the authors are grateful to dr derrick heng (group director of the public health group, singapore), ms ang li wei and ms cindy lim of the singapore ministry of health for helpful discussion. references questions and answers about human infection with a(h7n9) avian influenza virus. beijing, chinese center for disease control and prevention (cdc), 2013. available from: http://www.chinacdc.cn/en/ne/201303/t20130331_79282.html [accessed 15 august 2014]. li q et al. epidemiology of human infections with avian influenza a(h7n9) virus in china. the new england journal of medicine, 2014, 370:520–532. doi:10.1056/nejmoa1304617 pmid:23614499 uyeki tm, cox nj. global concerns regarding novel influenza a(h7n9) virus infections. the new england journal of medicine, 2013, 368:1862–1864. doi:10.1056/nejmp1304661 pmid:23577629 meng z et al. possible pandemic threat from new reassortment of influenza a(h7n9) virus in china. euro surveillance: european communicable disease bulletin, 2014,19(6):pii=20699. pmid:24556346 salathé m et al. influenza a (h7n9) and the importance of digital epidemiology. the new england journal of medicine, 2013, 369:401–404. doi:10.1056/nejmp1307752 pmid:23822655 international health regulations (2005), second edition. geneva, world health organization, 2008. availavble from: http://www.who.int/ihr/9789241596664/en/ [accessed 21 april 2015]. survey on public opinion toward permanent closure of live poultry market in shanghai. [in chinese] jf daily, 2013. available from: http://newspaper.jfdaily.com/xwcb/html/2013-04/10/content_1004412.htm [accessed 18 august 2014]. 12320 public health hotline conducted survey on public opinions toward infection control measures against avian influenza a(h7n9). [in chinese] beijing, china national health and family planning commission (nhfpc), 2013. available from: http://www.moh.gov.cn/zhuzhan/zsdwgzdt/201306/070c3ca66f604c1aa4ec 5f65761ede76.shtml [accessed 18 august 2014]. fung ic et al. chinese social media reaction to the mers-cov and avian influenza a(h7n9) outbreaks. infectious diseases of poverty, 2013, 2:31. doi:10.1186/2049-9957-2-31 pmid:24359669 gu h et al. importance of internet surveillance in public health emergency control and prevention: evidence from a digital epidemiologic study during avian influenza a h7n9 outbreaks. journal of medical internet research, 2014, 16:e20. doi:10.2196/jmir.2911 pmid:24440770 world health organization twitter. available from: https://twitter.com/who [accessed 29 march 2015]. european center of disease prevention and control twitter. available from: https://twitter.com/ecdc_eu [accessed 29 march 2015]. united states centers for disease control and prevention twitter. available from: https://twitter.com/cdcgov [accessed 29 march 2015]. fung ich, wong k. efficient use of social media during the avian influenza a(h7n9) emergency response. western pacific surveillance and response journal, 2013, 4:1–3. doi:10.5365/wpsar.2013.4.3.005 pmid:24478916 a large outbreak of enterohaemorrhagic escherichia coli o157, caused by low-salt pickled napa cabbage in nursing homes, japan, 2012 outbreak investigation report ayako tabuchi,a taku wakui,a yuichiro yahata,b koichi yano,c kotaro azuma,c takuya yamagishi,b kazutoshi nakashima,b tomimasa sunagawa,b tamano matsuib and kazunori oishib a field epidemiology training programme of japan, national institute of infectious diseases, tokyo, japan. b infectious diseases surveillance center, national institute of infectious diseases, tokyo, japan. c public health office, city of sapporo, japan. correspondence to yuichiro yahata (e-mail: yahata@nih.go.jp). to cite this article: tabuchi a et al. a large outbreak of enterohaemorrhagic escherichia coli o157, caused by low-salt pickled napa cabbage in nursing homes, japan, 2012. western pacific surveillance and response journal, 2015, 6(2)7–11. doi:10.5365/wpsar.2014.5.1.012 abstract objective: in august 2012, an outbreak of enterohaemorrhagic escherichia coli (ehec) o157 infection was investigated by the city of sapporo and hokkaido prefectural government. the initial notification reported an illness affecting 94 residents of 10 private nursing homes distributed across multiple areas of hokkaido, the northernmost island of japan; at this time three cases were confirmed as ehec o157 infection. the objectives of the investigation were to identify the source of infection and recommend control measures to prevent further illness. methods: a suspected case was defined as a resident of one of the private nursing homes in hokkaido who had at least one of the following gastrointestinal symptoms: diarrhoea, bloody stool, abdominal pain or vomiting between 10 july and 10 september 2012. cases were confirmed by the presence of shiga toxin 1and 2-producing ehec o157 in stool samples of suspected cases. we conducted an epidemiological analysis and an environmental investigation. results: we identified 54 confirmed and 53 suspected cases in 12 private nursing homes including five fatalities. of the 107 cases, 102 (95%) had consumed pickles, all of which had been manufactured at the same facility. ehec o157 isolates from two pickle samples, 11 cases and two staff members of the processing company were indistinguishable. the company that produced the pickles used inadequate techniques to wash and sanitize the vegetables. discussion: contaminated pickles were the likely source of this outbreak. we recommended that the processing company improve their methods of washing and sanitizing raw vegetables. as a result of this outbreak, the sanitation requirements for processing pickles were revised. introduction enterohaemorrhagic escherichia coli (ehec) causes gastrointestinal illnesses, resulting in symptoms such as watery diarrhoea, bloody stool, vomiting and abdominal cramps/pain.1 among all reported ehec cases, approximately 4% develop haemolytic uraemic syndrome (hus) and around 0.5% are fatal.2–4 the main route of ehec transmission is via the ingestion of food contaminated with ruminant faeces.5 in japan, ehec infection has been a notifiable disease since april 1999, with 3500–4500 cases reported annually between 2012 and 2014 of which 2600 were symptomatic cases.2–4 on 11 august 2012, a possible ehec o157 outbreak affecting the residents of 10 private nursing homes was reported to the public health office (pho) of the city of sapporo and hokkaido prefectural government. these nursing homes provide daily support with household tasks such as cleaning, laundry and meals but not medical care. they are distributed across a wide area of hokkaido, the northernmost island of japan. by law, staff at all facilities record details of all meals consumed by residents. the initial report stated that 94 residents were affected, including three confirmed ehec o157 cases and one fatal case. the pho requested that the investigation be supported by the national institute of infectious diseases. the objectives of this investigation were to identify the source of infection and recommend control measures to prevent further illness. methods case definition a suspected case was defined as a resident of a nursing home in hokkaido with at least one of the following gastrointestinal symptoms: diarrhoea, bloody stool, abdominal pain or vomiting between 10 july and 10 september 2012. a confirmed case was a suspected case in which shiga toxin 1 and 2 (stx1 and stx2)-producing ehec o157 was detected in stool sample. data collection and descriptive epidemiology public health nurses or food hygiene inspectors reviewed residents’ food records and conducted interviews with each of the 588 nursing home residents and 417 staff members. information was collected using a standardized questionnaire which included demographics (sex, age), symptoms, date of onset and exposure history (e.g. food consumption and contact with ill patients) within 14 days before the date of onset. food items in the questionnaires were adjusted to the specific menu at each nursing home. environmental study all nursing homes had their own kitchen for the preparation and cooking of three meals a day for residents. staff from local public health centres conducted a trace-back investigation of uncooked food items served during the two weeks before the outbreak to determine common food suppliers. on 28 august, an inspection of one of the food suppliers was conducted by the pho in accordance with the food sanitation act,6 and the process of preparing the suspected food was replicated on-site on 7–8 september 2012. the concentration of sodium hypochlorite was monitored digitally. laboratory investigations from each of the 12 nursing homes, faecal samples from all residents and mandatory stored food samples served from 24 july to 5 august 2012 were collected. frozen food, environmental samples and stool samples from 12 staff members were also collected from the food supplier during the initial inspection as required by law.6 all samples were tested at sapporo city institute of public health and hokkaido prefectural institute of public health. ehec o157 isolation and pulse-field gel electrophoresis (pfge) analysis were performed by sapporo city institute of public health, as previously described by terajima et al.7 results descriptive epidemiology there were 588 residents in the 12 nursing homes and 54 confirmed and 53 suspected cases (table 1); the overall attack rate among residents was 18% (107/588). the median number of cases per nursing home was eight (range: 1–19 residents). table 1. characteristics of subjects (n = 107) click to download table 1. jpg, 320kb * pickles, low-salt pickled napa cabbage. of the 107 cases, 94 were women (88%) and the median age was 87 years (range: 72–102 years of age; table 1). among them, 106 (99%) reported diarrhoea and 74 (69%) had bloody stool. two cases (2%) developed hus and two (2%) developed acute encephalopathy. five cases were fatal (case fatality rate: 5%); the median age was 95 years (range: 80–99 years of age). the onset of symptoms occurred during 3–17 august 2012, peaking on 7 august (figure 1). no cases were reported after 17 august 2012. the median incubation period was six days (range: 2–16 days) from the time of exposure to the onset of gastrointestinal symptoms. figure 1. epidemic curve of enterohemorrhagic e. coli o157 cases (n = 107*) at 12 nursing homes in sapporo city and hokkaido prefecture, japan, july to september 2012 click to download figure 1. jpg, 363kb * onset date of one case unknown. one particular brand of pickles, made by company a, was the only uncooked food item served that was eaten at all 12 facilities. the pickles were packaged on 30 july by company a and served on 1 or 2 august at each nursing home and had been consumed by 102 cases (95%). no other food items were commonly served in all facilities. none of the care staff at any of the nursing homes consumed foods served to residents. laboratory tests of the 338 residents of 12 nursing homes that had stool specimens collected, the stx1and stx2-producing ehec o157 strains (eae positive and aggr negative) were isolated in 81 residents. the clinical case definition was met by 54 of the 81 residents. stored pickles were collected from two of the affected nursing homes and stx1and stx2-producing ehec o157 were isolated from both samples. the samples had been packaged on the same day (30 july) by the same food processing company according to the delivery records. twelve staff members of company a also had stool samples collected; three were positive for ehec o157. these three staff members reported eating the pickles, after which they developed diarrhoea, soft faeces or abdominal cramps between 4 and 5 august. pfge patterns from 11 stool samples from cases from six of the nursing homes, stool samples from two staff members of company a and two pickle samples were indistinguishable. environmental study the main ingredients of the pickles were napa cabbage and salt with some cucumber and carrot. it took two days to prepare without a fermentation agent or vinegar. the product’s salt content is low (2%) and is served without washing. during the replication process at the processing plant several issues were identified with the processing of the pickles: (1) during washing, running water could not circulate effectively around the leafy vegetables in the tank, and (2) the same sodium hypochlorite solution was used repeatedly about 10 times to sanitize the vegetables after washing; hence, the concentration of sodium hypochlorite gradually dropped (tank 1: from 250 mg/l to 100 mg/l; tank 2: 210 mg/l to 95 mg/l) during replication. the concentration of sodium hypochlorite was not checked or recorded at company a during commercial production. staff performed adequate hand hygiene procedures during production, including wearing gloves. company a did not keep records on the source of the leafy vegetables or any other ingredients used in the manufacturing process, thus limiting the trace-back investigation. public health outcome on 11 august 2012, company a suspended production and performed a recall. on 12 october 2012, the ministry of health, labour and welfare (mhlw) revised the sanitation requirements for the processing of pickles. discussion this large common-source outbreak of stx1and stx2-producing ehec o157 was likely caused by the consumption of contaminated pickles at nursing homes. the pickles had been consumed by most cases, and most compelling, the same pfge pattern was observed from nursing home cases, company a cases and samples of the pickles. that the onset dates of the cases from company a occurred after the nursing home index cases were reported suggested that the staff members were not the source of infection or contamination. this is further confirmed by the adequate hygiene practice observed during the environmental investigation. there have been similar outbreaks caused by low-salt pickles in japan.8 tsukemono, a traditional japanese food, has a high salt content (around 10%) and is a naturally fermented pickle. low-salt pickles,9 however, are very similar to tsukemono, but are not fermented. low-salt pickles are becoming more common due to development of the cold chain during shipping and a general tendency of consumers to limit salt intake; however, they are similar to raw vegetables and therefore have a similar risk of cross contamination.10,11 in japan, national guidelines recommend not serving raw vegetables in school meals due to the risk of contamination of micro agents such as ehec and salmonellosis.12 however, nursing homes did not have such guidelines or regulations. as a result of this outbreak, we recommended that low-salt pickles should not be served in nursing home settings. after this outbreak, the mhlw investigated the processing of low-salt pickles and found that only 6% of processing companies washed raw vegetable materials.13 as a result, on 12 october 2012, the mhlw revised the guidelines for the preparation for low-salt pickles and added the importance of sufficient washing and sanitization. this investigation collected retrospective data and so there could have been some susceptibility to recall bias. as there was only one food common to all facilities, which was consumed by 95% of cases, an analytical study of food items was not warranted, especially as the laboratory evidence pointed to the pickles. in conclusion, this outbreak was most likely caused by ehec o157-contaminated pickles served at nursing homes. we recommend that raw foods not be served to vulnerable members of the population such as elderly people. ethics statement the investigation was conducted in accordance with the food sanitation act. conflicts of interest none declared. funding this investigation was supported by a grant from the ministry of health, labour and welfare, japan. acknowledgements we thank the public health office of the city of sapporo, sapporo city institute of public health, hokkaido prefectural government, and hokkaido prefectural institute of public health for their assistance in the epidemiological investigation and laboratory tests. we also thank sunao iyodad, jun terajima, and makoto ohnishi of the department of bacteriology i, national institute of infectious diseases, japan for advice and technical assistance. references: fontain o et al. diarrhea caused by enterohemorrhagic strains. in heymann dl, editor. control of communicable diseases manual. 19th ed. washington dc, american public health association, 2008, pp 181–186. national institute of infectious diseases. enterohemorrhagic escherichia coli infection in japan as of april 2012. infectious agents surveillance report, 2012, 33:115–116. available from: http://www.nih.go.jp/niid/en/iasr-vol33-e/865-iasr/2134-tpc387.html [accessed 11 march 2015]. national institute of infectious diseases. enterohemorrhagic escherichia coli infection in japan as of april 2013. infectious agents surveillance report, 2013, 34:123–124. available from: http://www.nih.go.jp/niid/en/iasr-vol34-e/865-iasr/3570-tpc399.html [accessed 12 march 2015]. national institute of infectious diseases. enterohemorrhagic escherichia coli infection in japan as of april 2014. infectious agents surveillance report, 2014, 35:117–118. available from: http://www.nih.go.jp/niid/en/iasr-vol35-e/865-iasr/4674-tpc411.html [accessed 12 march 2015]. muto t et al. outbreaks of enterohemorrhagic escherichia coli o157 infections among children with animal contact at a dairy farm in yokohama city, japan. japanese journal of infectious diseases, 2008, 61:161–162. pmid:18362413 the first special diet session. katayama cabinet. the food sanitation act. japan, 1947. available from: http://www.japaneselawtranslation.go.jp/law/detail_main?vm=&id=12 [accessed 12 march 2015]. terajima j et al. high genomic diversity of enterohemorrhagic escherichia coli isolates in japan and its applicability for the detection of diffuse outbreak. japanese journal of infectious diseases, 2002, 55:19–22. pmid:11971157 ozeki y et al. [a diffuse outbreak of enterohemorrhagic escherichia coli o157:h7 related to the japanese-style pickles in saitama, japan] (in japanese) [the journal of the japanese association for infectious diseases]. kansenshogaku zasshi, 2003, 77:493–498. doi:10.11150/kansenshogakuzasshi1970.77.493 pmid:12931575 wendel am et al. multistate outbreak of escherichia coli o157:h7 infection associated with consumption of packaged spinach, august-september 2006: the wisconsin investigation. clinical infectious diseases, 2009, 48:1079–1086. doi:10.1086/597399 pmid:19265476 saitou t et al. reported cases of hemolytic uremic syndrome associated with ehec infection in 2010—nesid. (in japanese). infectious agents surveillance report, 2011, 33:141–143. available from: http://idsc.nih.go.jp/iasr/32/375/dj375e.html [accessed 12 march 2015]. food and agriculture organization, world health organization. joint fao/who food standards programme codex alimentarius commission twenty-seventh session. rotterdam, codex committee on food additives and contaminants, 2004. available from: ftp://ftp.fao.org/docrep/ fao/meeting/008/j2262e.pdf [accessed 12 march 2015]. viii food processing. in: standards for school lunch health administration. tokyo, ministry of education, culture, sports, science and technology, 2014. available from: http://www.mext.go.jp/b_menu/houdou/20/07/08071616/001/008.htm [accessed 12 march 2015]. result for inspection of premises for low-salt pickles of processing company. tokyo, inspection and safety division, pharmaceutical and food safety bureau, ministry of health, labour and welfare, 2012. available from: http://www.mhlw.go.jp/stf/houdou/ 2r9852000002owtc-att/2r9852000002owwz.pdf [accessed 12 march 2015]. measles outbreak investigation in a remote area of solomon islands, 2014 outbreak investigation report jason diau,a christopher jimuru,a james asugeni,a lyndell asugeni,a mike puia,a john maomatekwa,a humpress harrington,b david maclaren,c rick spearecd and peter d masseye a atoifi adventist hospital, malaita, solomon islands. b pacific adventist university, atoifi, malaita, solomon islands. c james cook university, queensland, australia. d tropical health solutions, james cook university, queensland, australia. e hunter new england population health, new south wales, australia. correspondence to peter d massey (email: peter.massey@hnehealth.nsw.gov.au). to cite this article: diau j et al. measles outbreak investigation in a remote area of solomon islands, 2014. western pacific surveillance and response journal, 2015, 6(3). doi:10.5365/wpsar.2015.6.2.001 abstract objective: to describe a measles outbreak and health service response in a remote location in malaita, solomon islands. methods: epidemiological review of cases who presented to the atoifi adventist hospital (aah) during the outbreak period from july to december 2014. rumour surveillance was used to gather information on unreported cases. results: a total of 117 cases were reported to aah. the incidence rate was 123 per 10 000 individuals. fifty-six per cent (66/117) of cases were hospitalized. children under 5 years had the highest number of cases (n = 41) with 10 cases below 6 months old. the age-specific incidence rate of children under 5 years was 278.5 per 10 000 individuals. eighty-two per cent of reported cases were 18 years old or younger. rumour surveillance revealed about three quarters of children in one area of the east kwaio mountains had suspected measles not reported to aah. there were three unreported deaths from measles outside aah. during the outbreak, a total of 2453 measles-rubella vaccines were given in the aah catchment area. conclusion: a high incidence rate was observed in children and young people aged 18 years or younger, reflecting low childhood vaccination coverage. more than 50% of cases required hospitalization due to disease severity and challenges of accessing health services. the rumour surveillance discovered many unreported cases in the mountain areas and a few deaths possibly linked to the outbreak. improvement of registration methods and follow-up systems and setting up satellite clinics are planned to improve measles surveillance and vaccination coverage. introduction measles is a highly infectious, acute airborne viral disease with an infectious period of four days before to four days after rash onset. it has an incubation period of 10–14 days. measles can be a serious illness with complications including otitis media, pneumonia and encephalitis.1 solomon islands lies between latitudes 6° and 12° and had a total population of 515 870 in 2009.2 an outbreak of measles occurred in papua new guinea, solomon islands and vanuatu during 2014.3 the first reported case of measles in solomon islands was a returned traveller from papua new guinea in july 2014.4 a total of 4563 cases with nine deaths were reported from across all 10 provinces in solomon islands.3 the highest incidence rate was reported in the honiara area (349 per 10 000 individuals) where there is good access to health services. the first cases reported in the east kwaio area of solomon islands were 1-year-old twins from a small village on 10 august 2014. the infants were not linked to the honiara outbreak although there is frequent movement of small numbers of people between honiara and east kwaio. this report describes the local outbreak response and epidemiological investigation of the measles outbreak in east kwaio. methods study site east kwaio is on the eastern side of the island of malaita of solomon islands (figure 1). the population of east kwaio was 9509 in 2009,2,5 and most people live in coastal villages. approximately 3000 people live in small hamlets in the mountainous area of malaita and practise ancestral religion predominantly.6,7 there are no roads in east kwaio. people have to walk or travel by canoe to atoifi adventist hospital (aah), the only hospital in the region. figure 1. map of east kwaio, solomon islands click to download figure 1. jpg, 631kb notes: (1) honiara is the capital of solomon islands; auki is the provincial capital of malaita; (2) atoifi adventist hospital is located on the island of malaita and serves mainly the east kwaio area; and (3) the east kwaio area comprises more than 40 villages and many mountain hamle case definition a measles case was defined as any person presenting to aah between 1 august 2014 and 11 january 2015 with fever and maculopapular rash; and cough, coryza or conjunctivitis.8 laboratory confirmations were not available at aah or elsewhere in malaita. cases were diagnosed on clinical criteria only. data collection, processing and analysis demographics, location, onset, presenting symptoms, complications and hospitalization status of the cases were recorded. case details were written in a record sheet and subsequently entered into and analysed by microsoft excel 2010. incidence rates and relative risks with 95% confidence intervals (ci) were calculated based on the 2009 population census data.2,5 rumour surveillance rumours were sought from community members who were visiting the hospital or attending local markets, through discussions with chiefs and from nursing staff at outreach clinics. information on possible measles cases in the villages or hamlets was collected by staff and reported to the outpatient department and primary health care (phc) senior staff. information was compiled into public health intelligence and used to guide action. results cases the outbreak occurred during epidemiological weeks 32 to 50 of 2014, with 117 total cases (figure 2). fifty per cent of cases were male; 82% were aged 18 years or younger. all reported cases (100%) had fever and rash. cough was reported by 90 (76.9%) cases, and 89 (76.1%) cases had conjunctivitis. the overall incidence rate for the aah catchment area was 123 per 10 000 individuals with a relative risk of 2.88 (95% ci: 2.36–3.50) compared to the rest of malaita where 618 cases were reported in total (incidence rate 42.8 per 10 000 individuals).3 the highest number of cases were found in the 0–4 years age group (n = 41) with 10 cases less than 6 months old. the age-specific incidence rate in this group was 278.5 per 10 000 individuals. figure 2. number of measles cases presented to aah, july to december 2014 click to download figure 2. jpg, 293kb of the 117 cases, 66 (56.4%) required hospitalization. of these, 15.2% (10/66) and 18.2% (12/66) were under 1 year and 1 to 4 years, respectively. eleven (9.4%) of the cases were diagnosed with pneumonia. no other complications or deaths were reported. approximately 50% of the reported measles cases were from the mountainous areas of east kwaio. most of the villages (37/40) in the aah catchment area reported cases. kwalakwala village, with a population of 49, had the highest attack rate (38.8%, 19/49). rumour surveillance rumour surveillance indicated that there were only two suspected cases of measles in the mountains of the karfurumu area. in the mountains of the kwainaa’isi area, we estimated that three quarters of the 150 to 200 children and young people under age 19 had suspected measles but did not visit aah. there were also three deaths from measles reported in children from kwainaa’isi that were not officially registered. however, these rumours were unable to be verified due to inaccessibility to the cases and sociocultural reasons. measles outbreak response a local measles outbreak response team was formed on 24 august 2014. all residents of atoifi were offered measles-rubella (mr) vaccination on 25 august. the remaining available vaccines were used on 26 august for children aged 6 months to 4 years in villages where a measles case had been reported (canaan and na’au) and in the four neighbouring villages. rumour surveillance was initiated on 26 august 2014. alerts were sent to communities through hospital visitors and people attending the local markets. measles cases attending the hospital were provided with a separate entrance and cared for in an isolation ward with restricted visitor numbers. increased hand washing and the use of masks enhanced infection control in the hospital. meanwhile, schools were not closed and community events continued to occur. mr vaccination was offered to the family members of measles cases. three teams of five nurses were deployed to conduct mr vaccination at the surrounding villages of east kwaio. children aged 6 months to 4 years were targeted in the first round followed by the school-aged children (4 to 18 years) and adults older than 18. a total of 2453 mr vaccines were given. we estimated a 73.5% (496/675) response for vaccination coverage of children aged 6 months to 4 years. discussion in the past 10 years, there have been only two published measles outbreak reports in pacific islands (marshall islands and fiji). these two reports mainly described national-level responses.9,10 our report describes a measles outbreak in a remote area of solomon islands. we found the hospitalization rate was higher than the previously reported outbreak in the pacific.9 most cases presented with clinically apparent measles with rash and fever predominant. in remote settings, surge staff are not easily available for hospital care, and families are relied upon for much of the care of ill relatives. the sudden increase in admissions to a remote hospital like aah can put significant demand on the staff and the facility. since the majority of the adult residents at atoifi worked at aah, vaccinating all residents of atoifi maintained the hospital’s capability to manage the outbreak. on the other hand, for the villages that had not been rapidly vaccinated, a higher attack rate was observed. this may be linked to the two weeks delay in obtaining additional mr vaccines through the national programme. the village of kwalakwala had the highest attack rate among all villages (38.8%). many families in kwalakwala village hold traditional beliefs that hinder measles vaccination. the aah phc team reported that before this outbreak, families in that area did not support vaccination. however, vaccination is now being promoted by the chiefs and elders due to the outbreak experience and the health promotion of the phc team. rumour surveillance is a method that can be used to indicate the possible spread of a disease and areas to target for response.11 the results described many unreported cases in the mountainous areas and a few deaths possibly linked to the outbreak, though they were not verified. in addition to the long distance between home and hospital, there are complex sociocultural issues resulting in people from the mountains being unable to use health-care facilities.12 many families also consult traditional healers for health advice first and delay their hospital visits.13 the high proportion of cases in children and the higher rates compared to other parts of malaita, indicate that the vaccination coverage in east kwaio had not been adequate to prevent outbreaks. in solomon islands, measles vaccination is scheduled at 12 months of age, mostly given by government services; the national coverage ranged from 60% to 80% in recent years.14 to increase and sustain the level of vaccination, the aah has developed a range of new strategies. these strategies include a record card system to identify children overdue, enhanced registration of children into the primary health care system, providing more satellite clinics for remote villages/hamlets, implementing opportunistic vaccination at aah and satellite clinics and using rumour surveillance to identify and discuss vaccination with parents of children not born in the hospital. information about children born in villages or hamlets can be found through chiefs and other community leaders and then used to direct outreach services. limitations of this report include that the case definition was not based on laboratory confirmation. some cases may be misclassified. passive surveillance with only certain levels of active case finding may miss some cases. there were no computerized data systems for data recording. targeting of the outbreak response may not have been ideal for the local situation.15 since this study only included cases who had visited aah, it may not be representative of all community cases. vaccination status of the cases was not collected, which may have hampered further understanding of the outbreak. conclusions the outbreak demonstrates that measles remains a threat in remote areas such as east kwaio. this report highlights how sociocultural, geographic and health service issues contribute to the development and control of measles outbreaks and similar diseases. conflicts of interest none declared. funding this outbreak investigation report also received some financial support from the tdr, the special programme for research and training in tropical diseases, co-sponsored by united nations children’s fund, united nations development programme, the world bank and the world health organization (grant 1–811001688). acknowledgements the authors would like to acknowledge and thank the following organizations for their support of this project and the ongoing work of improving health for the people of east kwaio, solomon islands: atoifi adventist hospital, pacific adventist university – atoifi campus, james cook university and hunter new england population health. references heymann dl. control of communicable diseases manual 20th edition. washington, dc, american public health association, 2009, pp. 389–397. report on 2009 population and housing census: statistical bulletin 06/2011. honiara, government of solomon islands, 2011, p. 12. available from: http://catalog.ihsn.org/index.php/catalog/4595/download/58455 [accessed 29 july 2015]. world health organization regional office for the western pacific. measles outbreak, solomon islands, health situation report no. 7. geneva, reliefweb, 2014. available from: http://reliefweb.int/report/solomon-islands/measles-outbreak-solomon-islands-health-situation-report-no-7 [accessed 29 july 2015]. world health organization. health alert: suspected measles outbreak: honiara, solomon islands, 23 july 2014. geneva, reliefweb, 2014. available from: http://reliefweb.int/report/solomon-islands/health-alert-suspected-measles-outbreak-honiara-solomon-islands-23-july-2014 [accessed 29 july 2015]. oloifana-polosovai h et al. a marked decline in the incidence of malaria in a remote region of malaita, solomon islands, 2008 to 2013. western pacific surveillance and response journal, 2014, 5:30–39. doi:10.5365/wpsar.2014.5.3.002 pmid:25320674 maclaren d, kekeubata e. reorienting health services through community health promotion in kwaio, solomon islands. promotion & education, 2007, 14:78–79. doi:10.1177/10253823070140021701 pmid:17665704 maclaren d et al. incorporating sociocultural beliefs in mental health services in kwaio, solomon islands. australasian psychiatry, 2009, 17(suppl 1):s125–127. doi:10.1080/10398560902948381 pmid:19579125 who recommended standards for surveillance of selected vaccine-preventable diseases. geneva, world health organization, 2003. available from: http://whqlibdoc.who.int/hq/2003/who_v&b_03.01.pdf accessed 29 july 2015). hyde tb et al. measles outbreak in the republic of the marshall islands, 2003. international journal of epidemiology, 2006, 35:299–306. doi:10.1093/ije/dyi222 pmid:16299123 centers for disease control and prevention (cdc). measles outbreak and response–fiji, february–may 2006. mmwr. morbidity and mortality weekly report, 2006, 55:963–966. pmid:16960551 samaan g et al.; world health organization outbreak response team. rumor surveillance and avian influenza h5n1. emerging infectious diseases, 2005, 11: 463–466. doi:10.3201/eid1103.040657 pmid:15757567 maclaren d. culturally appropriate health care in kwaio, malaita, solomon islands: an action research approach. phd [dissertation]. queensland, griffith university, 2007. massey pd et al. tb questions, east kwaio answers: community-based participatory research in a remote area of solomon islands. rural and remote health, 2012, 12:2139. pmid:23094978 immunization epi country poster. manila, world health organization regional office for the western pacific, 2010. available from: http://www.wpro.who.int/ immunization/documents/epi_country_poster_2010_sol.pdf?ua=1 [accessed 29 july 2015]. minetti a et al. measles outbreak response immunization is context-specific: insight from the recent experience of médecins sans frontières. plos medicine, 2013, 10:e1001544. doi:10.1371/journal.pmed.1001544 pmid:24223523 enhanced syndromic surveillance for mass gatherings in the pacific: a case study of the 11th festival of pacific arts in solomon islands, 2012 surveillance system implementation/evaluation damian hoy,a salanieta t saketa,a roy roger maraka,b alison sio,c ian wanyeki,a pascal frison,a divi ogaoga,b dennie iniakawala,a cynthia joshua,c sala duituturaga,a christelle lepers,a adam roth,a paul whitea and yvan souaresa,d a research, evidence and information programme, public health division, the pacific community. b national referral hospital, solomon islands. c ministry of health and medical services (mhms), solomon islands. d agence sanitaire et sociale de la nouvelle-calédonie. correspondence to damian hoy (email: damehoy@yahoo.com.au). to cite this article: hoy d et al. enhanced syndromic surveillance for mass gatherings in the pacific: a case study of the 11th festival of pacific arts in solomon islands, 2012. western pacific surveillance and response journal, 2016, 7(3). doi:10.5365/wpsar.2016.7.1.004 abstract mass gatherings pose public health challenges to host countries, as they can cause or exacerbate disease outbreaks within the host location or elsewhere. in july 2012, the 11th festival of pacific arts (fopa), a mass gathering event involving 22 pacific island states and territories, was hosted by solomon islands. an enhanced syndromic surveillance (ess) system was implemented for the event. throughout the capital city, honiara, 15 sentinel sites were established and successfully took part in the ess system, which commenced one week before the fopa (25 june) and concluded eight days after the event (22 july). the ess involved expanding on the existing syndromic surveillance parameters: from one to 15 sentinel sites, from four to eight syndromes, from aggregated to case-based reporting and from weekly to daily reporting. a web-based system was developed to enable data entry, data storage and data analysis. towards the end of the ess period, a focus group discussion and series of key informant interviews were conducted. the ess was considered a success and played an important role in the early detection of possible outbreaks. for the period of the ess, 1668 patients with syndrome presentations were received across the 15 sentinel sites. there were no major events of public health significance. several lessons were learnt that are relevant to ess in mass gathering scenarios, including the importance of having adequate lead in time for engagement and preparation to ensure appropriate policy and institutional frameworks are put in place. introduction mass gatherings are congregations of large numbers of people in a specific location or locations for a defined period of time examples are major sporting events or festivals.1 planned mass gatherings are common occurrences in pacific island countries and territories. one of the risk areas of these gatherings is the potential for communicable diseases to spread efficiently and rapidly, causing outbreaks or amplifying existing outbreaks in the host country.2 solomon islands hosted the 11th festival of pacific arts (fopa) from 1 to 14 july 2012 in honiara, the country's capital. it was the largest event ever hosted by solomon islands, involving more than 3000 artists and performers from around the pacific. most visitors arrived the week before the event and departed up to one week after the festival. syndromic surveillance (ss) is used for the early detection of and response to potential public health threats.3,4 case definitions in ss are based on clinical signs and symptoms rather than laboratory confirmation for the early detection of outbreaks while preserving limited resources.4 solomon islands' ss system, established in 2011, monitors four syndromes at the national referral hospital (nrh). enhanced syndromic surveillance (ess) is increasingly being used for mass gatherings, although it generally has been limited to high-income countries.5 ess usually involves expanding the number of sentinel sites and syndromes tracked as well as moving from aggregated to case-based reporting and from weekly to daily reporting. in lowand middle-income countries, ess for mass gatherings has the potential to strengthen existing ss systems in a sustainable manner.3,4 in 2012 the solomon islands ministry of health and medical services (mhms) requested the pacific community (spc) to provide technical assistance for ess at the fopa. the objectives were: to provide a simple surveillance system for detecting and responding to disease outbreaks in a timely and effective manner, to sustain the surveillance system improvements beyond the mass gathering. methods the approach that spc takes for ess systems for mass gatherings has three stages: (1) preparation, (2) operation and (3) sustainability. these stages, as they were implemented for the fopa, are described below. stage 1 preparation formalize agreement with mhms the solomon islands mhms and spc agreed that spc would provide ess during and around the fopa, starting two months before the event. system and disease risk assessment the existing ss system was assessed two months before the event to identify its strengths and weaknesses for a mass gathering and areas of enhancement needed for ess. the assessment included a literature review of the disease patterns within the country, an assessment of disease databases, a reflective self-assessment with the public health and laboratory surveillance teams, interviews with key informants and focus group discussions with key stakeholders. a risk assessment was conducted that included assessing: the size, duration and characteristics of the event; priority communicable diseases of concern; medical resources and surge capacity; and the political will of decision-makers. stage 2 operation the plan for ess was developed in may 2012. the ess system commenced one week before the fopa (june 25) and concluded eight days after the event (july 22). the system included: data sources: expanded from one to 15 sentinel sites in honiara comprising the nrh, nine public clinics, two private clinics and three temporary clinics set up primarily for the fopa. syndromes: existing syndromes were diarrhoea, acute fever and rash (afr), prolonged fever (pf) and influenza-like illness (ili). to increase the likelihood of capturing outbreak-prone diseases that are common in the region, acute fever and neurological symptoms (afn), fever and jaundice (f&j) and heat-related illness (hri) were added; watery diarrhoea (wd) and non-watery diarrhoea (nwd) were reported separately in the new list. the new list of eight syndromes is shown in table 1. although hri is not outbreak prone, it was included due to the risk of it occurring. reporting forms: developed for data capture at sentinel sites. forms were case-based and included: name, age, sex, country of origin, province of origin, zone location in honiara, syndrome, malaria smear result and whether laboratory sample(s) had been taken and sent to the laboratory. web-based database: developed for data entry, storage and analysis. this was hosted on an spc server in noumea. data flow: moved from aggregated reporting on a weekly basis to case-based reporting on a daily basis. each afternoon sentinel sites completed the daily reporting form that was collected by the surveillance team the following morning and entered into the web-based system. data were exported by spc staff for analysis and preparation of daily situational reports that were returned to the honiara team for vetting and dissemination. response: for most syndromes the response point was based on team discussion. exceptions were wd, f&j and afn where a single case was investigated immediately (table 1). training: nurses from sentinel sites were trained on the ess system case definitions and reporting; the response team was trained on outbreak investigation. feedback: regular feedback of surveillance results was provided to sentinel sites to explain how data were used to prevent and respond to potential outbreaks. table 1. the eight syndromes endorsed for surveillance, 11th festival of pacific arts, solomon islands, 2012 click to download table 1. jpg, 789kb *fever defined as a temperature of 38 °c/100.4 °f or higher. **the point at which to respond is based on discussions among the team stage 3 sustainability towards the end of the ess period, a focus group and a series of key informant interviews were conducted with staff who were involved in data collection, entry and analysis. the purpose of these sessions was to discuss the strengths and challenges of the system, lessons learnt about it and to explore how elements of the system could be sustained. results epidemiological findings for the period of ess, 1668 patients presented with one or more syndromes across the 15 sentinel sites. the average daily number of cases seen with one or more syndromes was 60; this decreased from 67 in the first half of the period to 52 in the last half of the period. of those with one or more syndromes, 804 (48%) were female and 864 (52%) were male. the mean age of these cases was 13.2 years (range: 1 month to 82 years); 229 (13.7%) cases were infants aged less than 1 year and 803 (48%) were children aged less than 5 years. the results are described by syndrome in table 2. of the patients with one or more syndromes, ili was the most common syndrome (n = 727, 44%), followed by pf (n = 402, 24%), nwd (n = 387, 23%) and afr (n = 204, 12%). cases for each of the four most frequently occurring syndromes were relatively equally distributed between the sexes and had a broad age range with a mean age of between 12 and 15 years. the total daily number of syndrome cases peaked eight times throughout the surveillance period (fig. 1); four peaks occurred during the fopa. this peak pattern was largely due to an influx of patients on mondays to clinics that had been closed for the weekend. the peaks were in ili, pf and nwd that peaked at over 30, 20 and 15 daily cases, respectively, several times. afr peaked at over 10 daily cases several times in the first half of the period. this was most likely due to the end of a rubella outbreak that had commenced before the ess period. only a small number of the wd cases had laboratory samples taken. vibrio cholerae was not found. samples from nwd cases showed multiple enteric etiologies, including shigellosis and amoebiasis. six cases of rubella and one case of dengue fever were confirmed during the period. a dengue fever preparedness and control plan for solomon islands was initiated. no other public health events of significance occurred. click to download table 2. jpg, 789kb click to download figure 1. jpg, 789kb focus group discussion and interviews the focus group discussion and key informant interviews with staff who were involved in data collection, entry and analysis revealed several ess areas that worked well and areas that were more challenging. participants generally felt that the ess was relatively simple and operated successfully and that it played an important role in the early detection of possible outbreaks. several strengths in the ess were identified. daily reporting from sites was generally carried out on time as was the data analysis and the preparation of daily situation reports. staff felt that the regular feedback visits to the clinics were extremely useful; they provided an overview of the analysis results and checked the nurses' understanding of the case definitions for quality assurance. the focus group discussion and informant interviews revealed that clinic staff attitudes changed markedly after the regular feedback visits started. a major challenge noted in the ess process was that some clinical staff were not clear on when and how to collect specimens. many participants felt that some of the ess improvements for early detection of and response to potential public health threats may not be sustainable beyond the mass gathering. reasons given were limited human resources and limited transportation for samples, feedback visits and collecting data. participants also said that updating solomon islands' communicable disease policy and developing standard operational procedures for the ss system would be important for the sustainability of effective surveillance in solomon islands. discussion through the analysis of the ess that was operated at the fopa, we have demonstrated that an ess works relatively well for mass gatherings in resource-constrained settings. more than 1600 cases were captured across the 15 sentinel sites. the frequency of syndrome cases was tracked on a daily basis, triggering several outbreak investigations and informing public health promotion strategies. strengths the ess provided the necessary elements for detecting and responding to disease outbreaks in a timely and effective manner. the existing ss system was expanded from one to 15 sentinel sites, from four to eight syndromes, from aggregated to case-based reporting and from weekly to daily reporting. a web-based database was established to expedite data entry, analysis and reporting. this enhanced information led to more efficient field investigations and responses. therefore, it is possible that ess contributed to early detection of diseases in solomon islands and in the broader region. while ess for a mass gathering is resource-intensive, the improvements are not likely to be costly to sustain if electronic disease surveillance software is used.6 challenges and lessons learnt there were several potential biases of the surveillance system. graph peaks were largely influenced by an influx of patients on mondays after clinics had been closed for the weekends. some clinicians may have been more actively engaged in the system and thus more likely to report. there are likely to have been some misclassification of cases, particularly for those syndromes with similar case definitions. the laboratory surveillance element of ess was considered one of the main challenges. several staff were unclear about specimen collection. laboratory staff often did not communicate laboratory results back to sentinel sites, restricting the ability of clinic staff to undertake outbreak response. laboratory and clinic staff should be given more training, including reinforcing the roles of each. many country delegate groups brought their own health personnel who often were the first people consulted by the delegation if they became ill. consequently, clinics were not always accessed; thus, the ess system may have missed a significant number of cases. a critical element in ensuring the sustainability of an ess system is to have adequate lead in time for engagement and preparation (ideally at least 12 months). this should ensure that the appropriate policy and institutional frameworks, such as policy and standard operating procedures, are firmly in place in advance of the event. it will also enable the system users to become familiar with the system before the event. conclusions the 11th fopa saw large crowds of people gather in honiara for a public event. this implied an increased risk for the transmission of communicable disease, both at the event and across the region. an ess system was used to strengthen the early detection and response to potential public health threats. the ess system was considered a success, and it played an important role in the early detection of possible outbreaks. no major events of public health significance were experienced. several lessons were learnt for the delivery of ess in mass gathering scenarios. these included the importance of using a structured approach such as the one identified above, and engaging in planning for the ss of the event at least 12 months prior to ensure that appropriate and necessary policy and institutional frameworks are in place well before the event. conflicts of interest none declared. funding none. references memish za, et al. emergence of medicine for mass gatherings: lessons from the hajj. the lancet infectious diseases. 2012 jan;12(1):56-65. doi:10.1016/s1473-3099(11)70337-1 pmid:22192130 abubakar i, et al. global perspectives for prevention of infectious diseases associated with mass gatherings. the lancet infectious diseases. 2012 jan;12(1):66-74. doi:10.1016/s1473-3099(11)70246-8 pmid:22192131 triple s project. assessment of syndromic surveillance in europe. the lancet. 2011 nov 26;378(9806):1833-1834. doi:10.1016/s0140-6736(11)60834-9 pmid:22118433 henning kj. what is syndromic surveillance? mmwr supplements. 2004 sep 24;53 suppl:5-11. pmid:15714620 nelesone t, et al. short communication: strengthening sub-national communicable disease surveillance in a remote pacific island country by adapting a successful african outbreak surveillance model. tropical medicine and international health. 2006 jan;11(1):17-21. doi:10.1111/j.1365-3156.2005.01534.x pmid:16398751 hoy d, et al. using sages openessence for mass gathering events. online journal of public health informatics. 2015;7(1). first round of external quality assessment of dengue diagnostics in the who western pacific region, 2013 original research kwoon yong pok,a* raynal c squires,b* li kiang tan,a tomohiko takasaki,c sazaly abubakar,d futoshi hasebe,e jeffrey partridge,b chin kei lee,b janice lo,f john aaskov,g lee ching nga and frank koningsb a who collaborating centre for reference and research of arbovirus and their associated vectors, environmental health institute, national environment agency, singapore. b emerging disease surveillance and response unit, division of health security and emergencies, world health organization regional office for the western pacific, manila, philippines. c national institute of infectious diseases, tokyo, japan. d who collaborating centre for arbovirus reference and research (dengue/severe dengue), tropical infectious diseases research and education centre, department of medical microbiology, faculty of medicine, university of malaya, kuala lumpur, malaysia. e who collaborating centre for reference and research on tropical and emerging virus diseases, nagasaki university, nagasaki, japan. f public health laboratory services branch, centre for health protection, department of health, hong kong special administrative region, china. g who collaborating centre for arbovirus reference and research, institute of health and biomedical innovation, queensland university of technology, brisbane, australia. * both authors contributed equally in the writing of this paper. correspondence to frank koningskoningsf@wpro.who.int). to cite this article: pok ky et al. first round of external quality assessment of dengue diagnostics in the who western pacific region, 2013. western pacific surveillance and response journal, 2015, 6(2):73–81. doi:10.5365/wpsar.2015.6.1.017 abstract objective: accurate laboratory testing is a critical component of dengue surveillance and control. the objective of this programme was to assess dengue diagnostic proficiency among national-level public health laboratories in the world health organization (who) western pacific region. methods: nineteen national-level public health laboratories performed routine dengue diagnostic assays on a proficiency testing panel consisting of two modules: one containing commercial serum samples spiked with cultured dengue viruses for the detection of nucleic acid and non-structural protein 1 (ns1) (module a) and one containing human serum samples for the detection of anti-dengue virus antibodies (module b). a review of logistics arrangements was also conducted. results: all 16 laboratories testing module a performed reverse transcriptase polymerase chain reaction (rt-pcr) for both rna and serotype detection. of these, 15 had correct results for rna detection and all 16 correctly serotyped the viruses. all nine laboratories performing ns1 antigen detection obtained the correct results. sixteen of the 18 laboratories using igm assays in module b obtained the correct results as did the 13 laboratories that performed igg assays. detection of ongoing/recent dengue virus infection by both molecular (rt-pcr) and serological methods (igm) was available in 15/19 participating laboratories. discussion: this first round of external quality assessment of dengue diagnostics was successfully conducted in national-level public health laboratories in the who western pacific region, revealing good proficiency in both molecular and serological testing. further comprehensive diagnostic testing for dengue virus and other priority pathogens in the region will be assessed during future rounds. introduction dengue is a mosquito-borne viral infection associated with significant morbidity and mortality caused by any of four closely related virus serotypes (denv-1,-2,-3 and -4), all of which circulate in the world health organization (who) western pacific region.1,2 dengue presentation is broad and non-specific, which may confound clinical diagnosis. the majority (~75%) of infections in humans are asymptomatic, but a small proportion of symptomatic patients develops severe dengue characterized by rapid progression into shock, severe bleeding and/or multiorgan impairment, which leads to death if unattended or mismanaged.2,3 in the western pacific region, dengue outbreaks occur yearly in multiple countries, driven by a complex interplay of virus, vector and host biology, climatic and socioeconomic factors as well as international travel and trade.1,4–7 different case definitions are used for dengue surveillance throughout the region; some countries (e.g. singapore, australia) include only laboratory-confirmed cases, while others include all clinical diagnoses with only a subset (e.g. paediatric patients) being laboratory-confirmed. in 2013, outbreaks resulted in 44 098 dengue cases in the lao people’s democratic republic, 39 222 cases in malaysia, 10 548 cases in new caledonia and 22 170 cases in singapore.8,9 analysis of the outbreaks in singapore, malaysia and later fiji (> 20 000 cases as of 22 april 2014) revealed denv serotype switches from the previous year.10,11 secondary heterotypic infection is believed to foreshadow larger numbers of dengue and severe dengue cases.12 surveillance detection of a switch in the prevalent serotype within a population is thus cause for concern. accurate laboratory testing is a critical component of dengue surveillance and control. during the acute phase of infection, detection is targeted to denv rna and/or the virus non-structural protein 1 (ns1), while anti-denv antibodies igm and/or high titre igg are the diagnostic targets in the convalescent phase. several commercial diagnostic tests for dengue are available that detect denv rna or determine serotype using reverse transcription polymerase chain reaction (rt-pcr), or detect ns1, or igg and igm antibodies against the virus. a common mechanism used by laboratories to maintain accuracy and quality of diagnosis is external quality assessment (eqa) or proficiency testing, whereby an external agency distributes blinded samples to a laboratory for analysis and then verifies and reports the results. eqa can be used to compare laboratory performance, reveal potential problems associated with diagnostic kits or procedures, indicate areas in a laboratory requiring improvement and identify training needs.13 the who regional office for the western pacific recently launched an eqa for dengue diagnostics testing in 2013, under the asia pacific strategy for emerging diseases (apsed) 2010.14 this eqa is based largely on the who eqa for influenza15 and uses proficiency testing to assess national-level public health laboratory performance in detecting denv nucleic acid, ns1 antigen and anti-denv antibodies using molecular and serological assays. it is proposed that it will be an annual exercise, free of charge or at low cost to the laboratories and with the gradual inclusion of other pathogens. as well as ensuring the accurate diagnosis of dengue, the eqa programme also links participating laboratories with international reference laboratories that can assist in more specialized diagnostics or analytical functions as required. the objective of this manuscript is to summarize the first round of eqa of dengue diagnostics undertaken in the who western pacific region in 2013. methods participating laboratories nineteen national-level public health laboratories from 18 countries and areas (two from viet nam) in the who western pacific region where dengue is endemic or where imported cases have been detected were invited to participate in the eqa; all 19 agreed (figure 1). an eqa panel was dispatched to these laboratories between may and july 2013. figure 1. national-level public health laboratories that participated in eqa of dengue diagnostics, who western pacific region, 2013 click to download figure 1. jpg, 701kb sar, special administrative region. preparation of eqa panel the who collaborating centre for reference and research of arbovirus and their associated vectors, located at the environmental health institute of the national environment agency in singapore, was selected as the eqa provider as it had the necessary technical expertise, access to samples and the required resources. the panel for the 2013 eqa of dengue diagnostics consisted of two modules (a and b) containing serum with inactivated denv (module a) and serum samples from a dengue patient (module b) (table 1). all samples were heat-inactivated and contained no detectable hiv, hepatitis b surface antigen or hepatitis c virus antibody. table 1. characteristics of modules used in eqa of dengue diagnostics, who western pacific region, 2013 click to download table 1. jpg, 370kb * b2013-s01 and b2013-s02 were the same sample collected from a recently recovered dengue patient used to assess the reproducibility of laboratory results. id, identification; ns1, non-structural protein 1. for module a, samples a2013-v01 and a2013-v03 contained at least 106 rna copies/ml of in vitro-cultured denv of different serotypes – denv-1 genotype iii and denv-2 cosmopolitan clade ii, deposited in genbank with accession numbers kp685233 and kp685236, respectively. these were diluted in pathogen-free human serum (seracare life sciences, milford, massachusetts, usa). the presence of ns1 antigen in the samples was confirmed using commercial dengue ns1 assays, and virus non-infectivity after heat-inactivation was verified through three passages of an in-house cell-based viral infectivity assay. sample a2013-v02 (serum only) was confirmed denv-negative by real-time rt-pcr16 and commercial dengue ns1 assays, and negative for anti-dengue antibodies using commercial enzyme-linked immunosorbent assay (elisa) and the plaque-reduction neutralization technique (prnt).17 for module b, samples b2013-s01 and b2013-s02 were split serum samples from a convalescent dengue patient included to assess reproducibility of testing by the participating laboratories. these samples were confirmed by prnt to contain neutralizing antibodies against denv 1–4 (> 1:1000) and confirmed denv-negative as described above. they were additionally verified using several commercial dengue antibody-based detection assays (alere, waltham, massachusetts, usa; standard diagnostics inc., yongin-si, gyeonggi-do, republic of korea; focus diagnostics inc., cypress, california, usa; and bio-rad laboratories inc., hercules, california, usa). seracare human serum was used as the negative sample b2013-s03. all eqa samples were confirmed externally by an independent international organization for standardization (iso) 15189-accredited laboratory before dispatch to participating laboratories. participating laboratories could request to receive either one or both of the modules shipped on dry ice from the eqa provider by courier. the laboratories were requested to inform the eqa provider when they received the panels and to report whether the samples arrived frozen. participants were provided with a unique identifier, an instruction and results submission form, a good laboratory practices survey and quality of shipment and feedback forms. participants were requested to test samples in triplicate independent runs (to assess reproducibility) by the routine methods used in their laboratories and to submit background technical information on methods, kits and reagents used. test results were required within 30 days. analysis of results in module a, two points each were awarded for the correct detection of denv by rt-pcr or ns1 assay and accurate serotyping of denv. in module b, two points each were awarded for the correct detection of anti-denv igg and igm antibodies. using in-date reagents scored an additional three points. awardable points were based solely on the assays performed on each sample. the final score was the proportion of points earned out of the possible awardable points. accuracy for each assay (e.g. serotyping) was defined as the proportion of laboratories scoring 100% for that assay. quantitative data (rt-pcr cycle threshold values and elisa values) submitted were used for reference and for assessing reproducibility of laboratory results. for elisa assays, the percentage coefficient of variation (cv) was calculated from values recorded in triplicate runs to evaluate the reproducibility of results. a limit of ≤ 15% cv was used,18 mirroring manufacturers’ guidelines on inter-/intra-sample variation specified in the product inserts accompanying commercial elisa kits. large variations were flagged for attention in assessment reports sent to each laboratory. results laboratory proficiency in dengue diagnostics the most common assay performed was the anti-denv igm elisa; 16 of the 18 laboratories that conducted this test detected igm in all of the samples (two laboratories detected igm in only one of the split samples), achieving an overall accuracy of 88.9% for this assay (figure 2). figure 2. proportion of participating laboratories by test conducted and results, eqa of dengue diagnostics, who western pacific region, 2013 click to download figure 2. jpg, 341kb ns1, non-structural protein 1; rt-pcr, reverse transcription polymerase chain reaction. sixteen laboratories used rt-pcr for nucleic acid detection. as one laboratory reported equivocal results for the negative sample in module a, the overall accuracy for rt-pcr was 93.8%. these 16 laboratories also conducted virus serotyping with 100% accuracy (figure 2). one laboratory conducted rt-pcr only, while another used an expired reagent for a viral rna assay, although this had no effect on accuracy. the capacity to detect ongoing or recent dengue infection was demonstrated by the 15 laboratories that conducted both rt-pcr and igm anti-denv elisa. testing for anti-denv igg and ns1 antigen were the next most common assays, employed by 13 and nine laboratories, respectively, with 100% accuracy for both tests (figure 2). the seven laboratories that conducted all five assays (rt-pcr, serotyping, ns1, igm and igg assays) achieved 100% accuracy in each of them. module a: viral rna and ns1 antigen of those laboratories using rt-pcr in module a, the majority (11/16) used the qiamp viral rna mini kit (qiagen, valencia, california, usa) for extraction and purification of denv rna and commercial kits to perform rt-pcr. more than half (56.3%) used real-time rt-pcr, while the remainder used conventional rt-pcr methods (table 2). the laboratory reporting equivocal results for the negative sample in module a used the real-time methodology. most laboratories (87.5%) used in-house positive controls for viral detection and serotyping. denv genome regions targeted for virus detection and serotyping varied, with non-structural protein 5 and capsid being the most commonly used. to detect ns1 antigen, seven of nine laboratories employed the platelia dengue ns1 ag kit (bio-rad laboratories inc.), one used the sd dengue ns1 ag elisa (standard diagnostics inc.) and the other an in-house elisa. table 2. number and proportion of participating laboratories by assay type used, eqa of dengue diagnostics, who western pacific region, 2013 click to download table 2. jpg, 468kb elisa, enzyme-linked immunosorbent assay; ns1, non-structural protein 1; and rt–pcr, reverse transcriptase polymerase chain reaction. of seven laboratories detecting ns1 in triplicate runs using commercial elisa kits, three demonstrated lower reproducibility (up to 30% cv) between runs. though the final interpretation of results was not affected, large deviations in cv warrant greater adherence to work processes. module b: serology all 18 laboratories that requested module b chose the elisa methodology to detect anti-denv igm (table 2). half used the panbio dengue igm capture elisa (alere inc.) with two also using a rapid diagnostic test (panbio dengue duo cassette, alere inc.). the two laboratories detecting anti-denv igm in only one of the split samples used an in-house igm mac-elisa protocol and a commercial dengue igm elisa kit (euroimmun, luebeck, germany), respectively. these were not used by any other laboratories. elisa was also the methodology of choice for anti-denv igg detection, with 11 out of 13 (84.6%) of laboratories using commercial indirect elisa and/or high titre igg capture elisa kits. the remaining two laboratories performed in-house denv haemagglutination inhibition assays. participating laboratories demonstrated reproducible igg assay results (≤ 15% cv on average) in module b; however, a ≥ 30% cv between sample runs for igm assays was observed in a third of the participating laboratories. this included the two laboratories with incorrect results for the split samples. logistics most (17/19) laboratories returned results within the month allotted; the average time between receipt of samples and completed results was 27.8 days. one laboratory was five days late and another requested a 13-day extension while waiting for the delivery of reagents. there were no major logistics issues with shipping the panels to participating countries; all deliveries arrived on time and with cold chain intact. flight rescheduling was announced ahead of time and deliveries were targeted to ensure a laboratory member was available and that national holidays or weekends were avoided. obtaining import permits from respective governments or agencies added a significant amount of time to the preparatory work before sending the panels. eleven laboratories had to request permits, which took a median of 1.5 months to obtain (ranging from one week to 2.5 months). one laboratory had a standing import permit. the eqa time frame was also delayed as some participating laboratories had to be recruited through official ministry/department of health channels rather than directly; the longest recruitment took 1.5 months. discussion this study reports on an eqa programme established for dengue diagnostics for national-level public health laboratories in the western pacific region. it provided the first indication of the proficiency of the participating laboratories in diagnosing dengue samples and demonstrated the range of assays used by participants to diagnose dengue. it also facilitated communication between national laboratories and the who collaborating centre for reference and research of arbovirus and their associated vectors, which will be useful for future public health emergencies. the appropriate dengue diagnostic tools must be employed at the correct time to ensure the most effective diagnostic capability.19 it is therefore important for national/reference laboratories to be equipped with the tools to detect both denv rna/ns1 antigen and anti-dengue antibodies. it is encouraging that 15 of the 19 participating laboratories employed assays to detect both denv rna and anti-denv igm as part of their routine diagnostic algorithm for ongoing/recent dengue infection. of the remaining four laboratories, one performed rt-pcr but not antibody testing, and three performed antibody testing but not rt-pcr. the diagnostic capacity of these laboratories could be quickly strengthened through the use of commercial elisa assays for the detection of ns1 antigen or anti-denv antibodies. anti-denv igm assays were performed by all 18 laboratories that tested module b. using commercial elisas for anti-denv igm detection was the most common approach and the majority of laboratories delivered accurate and reproducible results on almost all samples. discrepancies reported in anti-denv igm assay results may be attributed to operational issues (such as unfamiliarity with elisa, insufficient adherence to work processes, inadequate reagent handling skills and pipetting techniques). in-house elisas were used by three laboratories, one of which reported incorrect results. while in-house assays may appear to be economical, the maintenance of test validity, reagent quality and appropriately trained staff must remain a priority. as anticipated, dengue rapid diagnostic tests were rarely employed at the national laboratory level. thirteen of the 18 laboratories participating in module b also performed assays for the detection of anti-denv igg. two types of commercial anti-denv igg elisas were employed; four laboratories used high titre igg elisas suitable for detecting ongoing/recent infections, six used low titre igg elisas for the detection of a prior dengue infection (such as in seroprevalence studies) and one laboratory used both. high titre igg elisas, when used on acute-phase sera, can differentiate between primary and secondary dengue infections in endemic areas; however, low titre elisas have no diagnostic value unless they are used in conjunction with an igm elisa. the presence of igm alone is highly indicative of an ongoing/recent infection, whereas detection of igg at low titre can occur indefinitely after dengue infection. as national laboratories are more likely to test samples from ongoing/recent infections, this may explain the more prevalent use of igm kits. several of the laboratories that did not test for anti-denv igg reported this was because they did not have igg kits available or did not routinely test for igg. reproducibility is also an important component of eqa. high variability (≥ 15% cv) between experimental runs was observed in several laboratories participating in module b, particularly in two laboratories incorrectly diagnosing the split samples in module b. this highlights the importance of using validated assays and adhering to standard operating procedures to ensure accurate and reproducible test results, as well as the continual training of laboratory technicians. the interpretation of this calculation is limited due to the small number of samples used (the two samples repeated in triplicate gives only six data points per laboratory); however, the results have provided an indication of variability and potential operational issues, which was the aim of this initial exercise. participation in audits, such as eqa, is useful for laboratories to ascertain areas requiring improvement. the high accuracy of participating laboratories to diagnose dengue using serological and molecular tests were similar to that observed by the european network for diagnostics of “imported” viral diseases (enivd) for their initial four-sample panel for serology but not for their eqa panel of 20 samples where 79% of participating laboratories required improvement in correctly detecting anti-denv antibodies.20 likewise, the recent enivd eqa for molecular detection of denv found that 80.4% of laboratories needed improvement in identifying dengue and non-dengue samples and serotypes.21 in contrast to our eqa, participating laboratories were in countries where dengue is not endemic, and samples were composed of different dilutions of denv or patient serum and included other arboviruses or anti-sera against them as controls. panels in upcoming rounds of the eqa in the western pacific region will be composed of more dengue serotypes and titre ranges, as well as other arboviruses of priority to the region. despite encountering no major logistical issues and eqa being executed mostly as intended, valuable administrative lessons were learnt. the delays in acquiring import permits and recruiting laboratories through government channels were unexpected. more time to accommodate these steps will therefore be allotted in the future. this first round of eqa of dengue diagnostics had some limitations. the modules comprised three samples each, limiting the variety of samples that could be included such as blinded samples to assess reproducibility. module size also prevented the inclusion of other arboviruses or anti-sera against them and the inclusion of multiple titrations of virus for determining assay sensitivity. however, the aim of this first round of eqa was to attain an initial overview of dengue diagnostic testing in the region. the findings presented here need to be further substantiated during upcoming rounds of eqa with more comprehensive panels. this first round of eqa in the western pacific region showed that using the existing influenza eqa programme facilitated eqa for another priority pathogen. despite the small number of samples tested, this exercise showed that laboratory diagnosis of dengue in the western pacific region is good and provided lessons for subsequent iterations. therefore this ongoing eqa programme for dengue, which will be expanded to include other priority pathogens, should strengthen the regional public health laboratory system for detecting emerging infectious diseases, in line with apsed (2010). conflicts of interest none declared. funding this programme was in large part financially supported by the u. s. agency for international development emerging pandemic threats (ept) programme’s identify project. acknowledgements the authors are grateful to the national-level public health laboratories that participated in the eqa and to professor leo yee sin of the tan tock seng hospital, singapore, for assistance in obtaining dengue antibody-positive serum samples. we would also like to thank sandy walker for critical reading of the manuscript. list of participating laboratories pathwest laboratory medicine, qeii medical centre (australia), ministry of health, department of laboratory services (brunei darussalam), institut pasteur du cambodge (cambodia), chinese center for disease control and prevention, national institute for viral diseases control and prevention (china), fiji centre for communicable disease control (fiji), institut louis malardé (french polynesia), public health laboratory centre, virology division (hong kong sar, china), national institute of infectious diseases, virology 1st (japan), korea national institute of health, division of arboviruses (republic of korea), national center for laboratory and epidemiology (the lao people’s democratic republic), health bureau, public health laboratory (macau sar, china), department of medical microbiology, university of malaya (malaysia), national center for zoonotic diseases, ministry of health (mongolia), institut pasteur de nouvelle-calédonie, laboratoire de biologie médicale (new caledonia), institute of environmental science and research ltd, clinical virology (new zealand), papua new guinea institute of medical research, environmental & emerging diseases unit (papua new guinea), research institute for tropical medicine, department of virology (the philippines), national institute of hygiene and epidemiology, virology department, and pasteur institute in ho chi minh, laboratory of arboviruses (viet nam). references: arima y et al. epidemiologic update on the dengue situation in the western pacific region, 2012. western pacific surveillance and response journal, 2015, 6(2). doi:10.5365/wpsar.2014.5.4.002 dengue: guidelines for diagnosis, treatment, prevention and control. geneva, world health organization, 2009. available from: http://www.who.int/tdr/publications/ documents/dengue-diagnosis.pdf [accessed 17 june 2015]. bhatt s et al. the global distribution and burden of dengue. nature, 2013, 496: 504–507. doi:10.1038/nature12060 pmid:23563266 lee ks et al. dengue virus surveillance in singapore reveals high viral diversity through multiple introductions and in situ evolution. infection, genetics and evolution, 2012, 12:77–85. doi:10.1016/j.meegid.2011.10.012 pmid:22036707 ritchie sa. dengue vector bionomics: why aedes aegypti is such a good vector. in: gubler dj, ooi ee, vasudevan s and farrar j, eds.dengue and dengue hemorrhagic fever. oxfordshire, cabi. 2014, 455–480. doi:10.1079/9781845939649.0455 banu s et al. dengue transmission in the asia-pacific region: impact of climate change and socio-environmental factors. tropical medicine & international health, 2011, 16:598–607. doi:10.1111/j.1365-3156.2011.02734.x pmid:21320241 wilder-smith a, gubler dj. geographic expansion of dengue: the impact of international travel. the medical clinics of north america, 2008, 92:1377–1390, x. doi:10.1016/j.mcna.2008.07.002 pmid:19061757 dengue situation update – 25 december 2013. manila, world health organization regional office for the western pacific, 2013. available from: http://www.wpro.who.int/entity/emerging_diseases/dengue.biweekly. 24dec2013.pdf [accessed 17 june 2015]. communicable disease surveillance in singapore 2013. singapore, ministry of health, 2014. available from: https://www.moh.gov.sg/content/moh_web/home/ publications/reports/2014/communicable-diseases-surveillance-in singapore-2013.html [accessed 25 june 2015]. governments of malaysia and singapore. joint media release: unitedengue cross-border data sharing provides countries with timely risk alerts. singapore, national environment agency, 2014. available from: http://www.moh.gov.my/index.php/ database_stores/attach_download/337/573 [accessed 17 june 2015]. dengue situation update 22 april 2014. manila, world health organization regional office for the western pacific, 2014. available from: http://www.wpro.who.int/ emerging_diseases/dengue.biweekly.22apr2014.pdf [17 june 2015]. guzman mg, alvarez m, halstead sb. secondary infection as a risk factor for dengue hemorrhagic fever/dengue shock syndrome: an historical perspective and role of antibody-dependent enhancement of infection. archives of virology, 2013, 158:1445–1459. doi:10.1007/s00705-013-1645-3 pmid:23471635 laboratory quality management system. geneva, world health organization, 2011. available from: http://www.who.int/ihr/training/laboratory_quality/ 10_b_eqa_contents.pdf [accessed 17 june 2015]. asia pacific strategy for emerging diseases (2010). manila, world health organization regional office for the western pacific, 2011. available from: http://www.wpro.who.int/emerging_diseases/documents/asped_2010/en/ [accessed 17 june 2015]. who external quality assessment project for the detection of influenza virus type a by pcr. manila, world health organization regional office for the western pacific, 2012. available from: http://www.who.int/influenza/gisrs_laboratory/external_quality_ assessment_project/en/ [accessed 17 june, 2015]. lai yl et al. cost-effective real-time reverse transcriptase pcr (rt-pcr) to screen for dengue virus followed by rapid single-tube multiplex rt-pcr for serotyping of the virus. journal of clinical microbiology, 2007, 45:935–941. doi:10.1128/jcm.01258-06 pmid:17215345 morens dm et al. simplified plaque reduction neutralization assay for dengue viruses by semimicro methods in bhk-21 cells: comparison of the bhk suspension test with standard plaque reduction neutralization. journal of clinical microbiology, 1985, 22:250254. pmid:4031038 food and drug administration. guidance for industry: bioanalytical method validation. maryland, united states department of health and human services, 2001. available from: http://www.fda.gov/downloads/drugs/guidancecompliance regulatoryinformation/guidances/ucm070107.pdf [accessed 17 june 2015]. peeling rw et al. evaluation of diagnostic tests: dengue. nature reviews microbiology, 2010, 8 suppl;s30–38. doi:10.1038/nrmicro2459 pmid:21548185 donoso mantke o et al. quality control assessment for the serological diagnosis of dengue virus infections. journal of clinical virology, 2004, 29:105–112. doi:10.1016/s1386-6532(03)00110-0 pmid:14747029 domingo c et al. 2nd international external quality control assessment for the molecular diagnosis of dengue infections. plos neglected tropical diseases, 2010, 4:e833. doi:10.1371/journal.pntd.0000833 pmid:20957194 high agreement between the new mongolian electronic immunization register and written immunization records: a health centre based audit original research jocelyn chan,a,b,c tuya mungun,a,d narangerel dorj,e baigal volody,f uranjargal chuluundorj,f enkhtuya munkhbat,f gerelmaa danzan,f cattram d nguyen,a,b,g sophie la vincentea,b and fiona russella,b,c a pneumococcal research, murdoch childrens research institute, parkville, australia. b department of paediatrics, university of melbourne, parkville, australia. c centre for international child health, murdoch childrens research institute, parkville, australia. d national center for communicable diseases, ministry of health, ulaanbaatar, mongolia. e division for surveillance and emergency operations, ministry of health, ulaanbaatar, mongolia. f immunization unit, national center for communicable diseases, ulaanbaatar, ministry of health, mongolia. g clinical epidemiology & biostatistics unit, murdoch childrens research institute, parkville, australia. correspondence to jocelyn chan (email:jocelyn.chan@mcri.edu.au). to cite this article: chan j, mungun t, dorj n, volody b, chuluundorj u, munkhbat e, et al. high agreement between the new mongolian electronic immunization register and written immunization records: a health centre based audit. western pac surveill response j. 2017 sep;8(2). doi:10.5365/wpsar.2016.7.4.006. abstract introduction: monitoring of vaccination coverage is vital for the prevention and control of vaccine-preventable diseases. electronic immunization registers have been increasingly adopted to assist with the monitoring of vaccine coverage; however, there is limited literature about the use of electronic registers in lowand middle-income countries such as mongolia. we aimed to determine the accuracy and completeness of the newly introduced electronic immunization register for calculating vaccination coverage and determining vaccine effectiveness within two districts in mongolia in comparison to written health provider records. methods: we conducted a cross-sectional record review among children 2–23 months of age vaccinated at immunization clinics within the two districts. we linked data from written records with the electronic immunization register using the national identification number to determine the completeness and accuracy of the electronic register. results: both completeness (90.9%; 95% ci: 88.4–93.4) and accuracy (93.3%; 95% ci: 84.1–97.4) of the electronic immunization register were high when compared to written records. the increase in completeness over time indicated a delay in data entry. conclusion: through this audit, we have demonstrated concordance between a newly introduced electronic register and health provider records in a middle-income country setting. based on this experience, we recommend that electronic registers be accompanied by routine quality assurance procedures for the monitoring of vaccination programmes in such settings. introduction monitoring of vaccination coverage is vital for the prevention and control of vaccine-preventable diseases. coverage estimates are also an important indicator of health system performance and a benchmark for progress toward reducing child mortality. in countries lacking reliable administrative data on vaccinations, the estimation of vaccination coverage relies on conducting vaccination coverage surveys, which are time-consuming and expensive. in addition, conducting such studies requires expertise to prevent selection or information bias.1 to facilitate the monitoring of vaccination coverage, countries around the world are increasingly adopting electronic immunization registers that are defined as computerised, population-based systems that collect individual-level vaccination data.2 there is strong evidence that the use of immunization registers can increase rates of vaccination.3 they can have an impact at an individual level, assisting health-care providers to ensure that individuals have received the recommended vaccinations,4 and at a population level, highlighting undervaccinated groups to guide vaccination policy.5 immunization registers are also valuable research tools and can be linked with disease surveillance databases to assess vaccine effectiveness and safety.6 the usefulness of an immunization register depends on the completeness and accuracy of the information it contains. several studies in a range of settings have highlighted the potential problem of underreporting of vaccinations,7-9 leading to systematically lower coverage estimates. one systematic review reported that out of 17 papers using immunization register data to determine vaccine effectiveness, only one addressed the accuracy of information in the register.6 this highlights the limited literature addressing immunization register data quality despite the need for such studies. while registers are increasingly widely adopted worldwide, there is limited literature about the use of electronic registers in lowand middle-income country settings such as mongolia. to coincide with the staged introduction of the 13-valent pneumococcal conjugate vaccine (pcv13), starting with two districts in mongolia, the national expanded programme of immunizations (epi) at the ministry of health (moh) developed an electronic immunization register to record pcv13 doses administered. the immunization register allows the epi team to efficiently monitor vaccination coverage and can be linked with the surveillance system for invasive bacterial and vaccine-preventable diseases (ib-vpd) to monitor vaccine impact. if successful, the moh plans to expand the immunization register to include all epi vaccines and to invlove the rest of the country. in this study, we aim to describe the electronic immunization register in mongolia and determine the completeness and accuracy of pcv13 data to calculate vaccination coverage and determine vaccine effectiveness by comparing electronic records with existing written health provider records. methods description of the electronic immunization register on 6 june 2016, the mongolian moh commenced delivery of pcv13 from all 19 immunization clinics in two districts of the capital city ulaanbaatar. infants received pcv13 at 2, 4 and 9 months of age. a catch-up campaign for older children was performed; children aged 3–23 months received two doses at one-month intervals. immunization nurses documented the following in a registration book: name, national identification (id) number (unique identification number given at birth), age, address, phone number and date of pcv13 administration. this information was entered into a web-based electronic immunization register at the end of each day. the epi team, responsible for monitoring the introduction of pcv13, is able to access data from the electronic immunization register in real time. study design we conducted a cross-sectional chart audit among children 2–23 months of age vaccinated at immunization clinics within the two districts. the main outcome measures for this audit were (1) completeness: the proportion of written records that were able to be identified on the electronic immunization register; and (2) accuracy: proportion of linked records with matching vaccination dates to within seven days. we used systematic random sampling, selecting the first 32 entries from registration books from each immunization clinic for each month of june, july and august 2016. a sample of 32 per month for each clinic was based on sample size calculated to detect an estimated 80% accuracy with a precision of 2.5% with 95% confidence, taking into account clustering within the 19 immunization clinics using an intra-class correlation of 0.01. data collection from the registration books, the following data were abstracted: national id number, district and subdistrict of vaccine administration and pcv13 vaccination dates. these entries were double-entered into epidata entryclient v2.0.10.26 (the epidata association, odense, denmark) and checked for inconsistencies. the audit was conducted in august 2016 after the completion of the catch-up campaign. the electronic database was exported twice. the first export was one week after collection of the data from the written records on 23 august 2016 and the second was on 3 october 2016 to ensure any delayed data were captured. data analysis we reviewed the data in the electronic immunization register for internal consistency by describing the proportion of doses that were invalid. we defined vaccination dates as invalid if any dose was dated as given before the date of birth, any dose was dated to have been given after the register was first exported (24 august 2016), the first dose was dated to have been given before the vaccine became available (6 june 2016), the second dose was dated to have been given less than 28 days after pcv13 first became available (4 july 2016), the first dose was dated to have been given at less than 8 weeks of age or the second dose was dated to have been given at less than 12 weeks of age. we reported proportions of invalid doses and reasons. data from the written record database were linked with the electronic immunization register using the national id number. we considered the records from the written registration books to be the gold standard for the purposes of this audit. we reported completeness and accuracy using proportions and 95% confidence intervals adjusted for clustering within subdistricts. accuracy was reported using the first export of the electronic database only. completeness was assessed for both first and second exports to capture and compare timeliness of data entry. we included both valid and invalid doses in the analyses of completeness and accuracy. we reported accuracy by district, subdistrict and month. we completed the analysis using stata ic 14 (statacorp llc, college station, texas, usa). ethics ethics approval was not sought because this audit was conducted as a part of routine quality assurance in collaboration with the epi team within the ministry of health in mongolia. no identifying information has been included as part of this report. results total and invalid vaccination doses in the electronic immunization register from 6 june to 24 august 2016, there were a total of 19 879 doses of pcv13 recorded in the electronic immunization register, including 15 650 first doses and 4229 second doses. only 87 (0.004%) doses were invalid. the most common reason for a vaccine date being invalid was that the vaccine was recorded as given before the vaccine became available (tables 1a and 1b). table 1:validity of pneumococcal conjugate vaccine dates, recorded in the electronic immunization register, mongolia, june–august 2016 click to download table 1. jpg, 271kb completeness of the electronic immunization register of the 1757 records abstracted from written immunization registers, there were 1614 unique ids (some of the records were different doses for the same patient). the number of records abstracted was slightly less than the intended sample size (n=1824) because some smaller clinics had fewer than 32 doses per month available to abstract. among the 1614 patients, 1273 were able to be linked using their unique id to the electronic immunization register abstracted on 24 august 2016, giving the electronic register a completeness of 78.9% (95% ci: 64.7–88.4). for the records that were unable to be linked, we searched the electronic record again on 3 october 2016 and were able to identify 12% additional records, increasing completeness to 90.9% (95% ci: 88.4–93.4). accuracy of the electronic immunization register for the 1273 patients that were able to be linked, there were 1386 records (or doses) that were able to be compared. the pcv13 dates recorded on the electronic record matched the written record for 93.4% (adjusted 95% ci: 84.1–97.4) of records (table 2). the accuracy of the electronic register was similar by district (table 3). for all but five subdistricts, the proportion of pcv13 vaccine dates from electronic record matched the written record by more than 90% (table 4). the accuracy of the electronic register declined over time (p<0.001) (table 5). table 2: accuracy of pneumococcal conjugate vaccine dates recorded in the electronic immunization register, mongolia, june–august 2016 click to download table 2. jpg, 149kb table 3: accuracy of pneumococcal conjugate vaccine dates recorded in the electronic immunization register by district, mongolia, june–august 2016 click to download table 3. jpg, 163kb table 4: accuracy of pneumococcal conjugate vaccine dates recorded in the electronic immunization register by subdistrict, mongolia, june–august 2016 click to download table 4. jpg, 263kb table 5: accuracy of pneumococcal conjugate vaccine dates recorded in the electronic immunization register by month, mongolia, june–august 2016 click to download table 5. jpg, 162kb discussion this audit found that the overall completeness of the mongolian electronic immunization register was high (90.9%; 95% ci: 88.4–93.4) when compared to written records. the increase in completeness between the first export (one week after collection of written records) and the second export (five weeks later) indicates a significant delay in data entry. any analyses of vaccination coverage should consider this delay. the accuracy of the vaccination dates recorded on the electronic register was also high (93.3%; 95% ci: 84.1–97.4). however, these results should be considered in the context that administrative vaccination data, which we have used as our gold standard, from lowand middle-income countries may not be reliable.10 results from different audits and evaluations published in the literature have demonstrated vastly different results, reinforcing the need to validate data from registers before use. many audits, such as those from the national immunization registers in the united kingdom,11 belgium,7 australia8 and some subnational immunization registers in the united states of america (usa),12,13 have demonstrated a high degree of completeness and accuracy with coverage estimates within 10% of coverage estimated from vaccination surveys.7,8 however, other audits have demonstrated variability in completeness and accuracy with some noting an improvement in completeness over time from 71.4% to 97.7%;14 others noted an improvement in accuracy from an error rate of 59% to 18% following specific strategies.15 this audit has demonstrated variability in completeness and accuracy by clinic. details of underperforming clinics have been passed on to the epi team for follow-up. while this audit was not designed to determine reasons for poor completeness or accuracy, we anticipate that follow-up visits to underperforming clinics will provide insight into potential issues. the decline in accuracy over time suggests that a process of ongoing monitoring and serial auditing of the registry is needed to maintain quality data. as part of the quality assurance programme for the norwegian immunization registry, annual reports of children who are incompletely vaccinated or have discrepancies in their schedules are sent to the municipality health services for follow-up.16 two american registries, in wisconsin and philadelphia, noted that completeness and accuracy were greatest among clinics with electronic medical records that linked directly with registry system.12,13 while this audit has validated the data recorded in the immunization register, we have not assessed the quality of the denominator (population) data on which the calculation of accurate vaccination coverage depends. to validate vaccine coverage calculated using administrative data, we recommend conducting a vaccination coverage survey using survey methods recommended by the world health organization.1 our results indicate that the electronic registry can be used to reliably estimate vaccination coverage provided that the denominator data are accurate. there are several limitations to this study. first, this audit relies on accurate clinic health records for comparison. while we have not reviewed the quality of the clinic data, it is the current source for vaccination coverage estimates and, to our knowledge, the best available source of vaccination information. however, we have also examined completeness using another source – parent-held immunization records. between november 2016 and february 2017, 569 children recruited as part of enhanced ib-vpd surveillance were noted as having received at least one dose of pcv13 according to their parent-held immunization records. of these, 86.5% (95%ci: 83.4–89.0) were recorded in the electronic immunization register, indicating similar levels of completeness to our results using clinic data, albeit for a different time period (unpublished data). this process is ongoing. another potential method to assess vaccination coverage in this population is serosurveys; however, this may not be applicable to pneumococcal conjugate vaccines since there is debate surrounding the reliability of serology as immune correlates of protection.17,18 a second limitation is that we used systematic sampling by month. we chose this method for simplicity to ensure data collection was consistent over the 19 subdistricts. a sample was taken from the beginning of each of the three months, accounting for changes in accuracy from one month compared to another. therefore, estimates of accuracy are designed to be interpreted over the entire three-month period, and estimates from each month are not reflective of the entire month since the sample was drawn only from the beginning of that month. third, the study was conducted in an urban setting where the electronic register is being piloted and may not be applicable to other more rural settings. when the electronic register is rolled out country-wide it will be important to re-examine completeness and accuracy of the register. lastly, our study was not designed to determine reasons for decreases in data accuracy over time; an additional qualitative component may be a useful adjunct. immunization registries are increasingly being recognized as important public health tools with both the european centre for disease prevention and control and united states centers for disease control and prevention outlining goals to encourage adoption of these systems provided the data entry is timely and accurate.19,20 this audit has demonstrated that electronic registers are technically viable in an urban middle-income country setting. this paper describes an effective method for auditing the electronic registers in comparison to health provider records. comparisons with alternative sources of vaccination data, such as parent-held immunization records, should be considered to triangulate these results given the issues with reliability of administrative data in lowand middle-income countries.10 based on our experience, we would recommend the adoption of electronic registers, accompanied by routine quality assurance procedures, for the monitoring of vaccination programmes. conflicts of interest none to declare. funding this study received funding from the bill & melinda gates foundation. acknowledgements we would like to acknowledge the staff of the immunization clinics for their time and effort in adopting the use of the electronic immunization register and facilitating data collection for this audit. references world health organization vaccine coverage cluster surveys. reference manual version 3. geneva: world health organization; 2015 (http://www.who.int/immunization/monitoring_surveillance/vaccination_coverage_cluster_survey_with_annexes.pdf). pebody r. vaccine registers–experiences from europe and elsewhere. euro surveill. 2012 04 26;17(17):20159. pmid:22551493 groom h, hopkins dp, pabst lj, murphy morgan j, patel m, calonge n, et al.; community preventive services task force. immunization information systems to increase vaccination rates: a community guide systematic review. j public health manag pract. 2015 may-jun;21(3):227–48. pmid:24912082 doi:10.1097/phh.0000000000000069 bernal-gonzález pj, navarro-alonso ja, pérez-martin jj. computerised vaccination register for the murcia region, spain, 1991 to 2011. euro surveill. 2012 04 19;17(16):20150. pmid:22551463 hull bp, mcintyre pb. timeliness of childhood immunisation in australia. vaccine. 2006 may 15;24(20):4403–8. pmid:16569467 doi:10.1016/j.vaccine.2006.02.049 placzek h, madoff lc. the use of immunization registry-based data in vaccine effectiveness studies. vaccine. 2011 jan 10;29(3):399–411. pmid:21087687 doi:10.1016/j.vaccine.2010.11.007 braeckman t, lernout t, top g, paeps a, roelants m, hoppenbrouwers k, et al. assessing vaccination coverage in infants, survey studies versus the flemish immunisation register: achieving the best of both worlds. vaccine. 2014 jan 09;32(3):345–9. pmid:24269616 doi:10.1016/j.vaccine.2013.11.041 hull bp, lawrence gl, macintyre cr, mcintyre pb. immunisation coverage in australia corrected for under-reporting to the australian childhood immunisation register. aust n z j public health. 2003 oct;27(5):533–8. pmid:14651401 doi:10.1111/j.1467-842x.2003.tb00829.x khare m, piccinino l, barker le, linkins rw. assessment of immunization registry databases as supplemental sources of data to improve ascertainment of vaccination coverage estimates in the national immunization survey. arch pediatr adolesc med. 2006 aug;160(8):838–42. pmid:16894084 doi:10.1001/archpedi.160.8.838 miles m, ryman tk, dietz v, zell e, luman et. validity of vaccination cards and parental recall to estimate vaccination coverage: a systematic review of the literature. vaccine. 2013 mar 15;31(12):1560–8. pmid:23196207 doi:10.1016/j.vaccine.2012.10.089 amirthalingam g, white j, ramsay m. measuring childhood vaccine coverage in england: the role of child health information systems. euro surveill. 2012 04 19;17(16):20149. pmid:22551461 kolasa ms, chilkatowsky ap, clarke kr, lutz jp. how complete are immunization registries? the philadelphia story. ambul pediatr. 2006 jan-feb;6(1):21–4. pmid:16443179 doi:10.1016/j.ambp.2005.08.006 koepke r, petit ab, ayele ra, eickhoff jc, schauer sl, verdon mj, et al. completeness and accuracy of the wisconsin immunization registry: an evaluation coinciding with the beginning of meaningful use. j public health manag pract. 2015 may-jun;21(3):273–81. pmid:25590511 doi:10.1097/phh.0000000000000216 davidson aj, melinkovich p, beaty bl, chandramouli v, hambidge sj, phibbs sl, et al. immunization registry accuracy: improvement with progressive clinical application. am j prev med. 2003 apr;24(3):276–80. pmid:12657348 doi:10.1016/s0749-3797(02)00638-4 samuels rc, appel l, reddy si, tilson rs. improving accuracy in a computerized immunization registry. ambul pediatr. 2002 may-jun;2(3):187–92. pmid:12014978 doi:10.1367/1539-4409(2002)002<0187:iaiaci>2.0.co;2 trogstad l, ung g, hagerup-jenssen m, cappelen i, haugen il, feiring b. the norwegian immunisation register – sysvak. euro surveill. 2012;17(16). pmid:22551462 andrews nj, waight pa, burbidge p, pearce e, roalfe l, zancolli m, et al. serotype-specific effectiveness and correlates of protection for the 13-valent pneumococcal conjugate vaccine: a postlicensure indirect cohort study. lancet infect dis. 2014 sep;14(9):839–46. pmid:25042756 doi:10.1016/s1473-3099(14)70822-9 macneil a, lee cw, dietz v. issues and considerations in the use of serologic biomarkers for classifying vaccination history in household surveys. vaccine. 2014 sep 03;32(39):4893–900. pmid:25045821 doi:10.1016/j.vaccine.2014.07.005 centers for disease control and prevention (cdc). progress in immunization information systems united states, 2012. mmwr morb mortal wkly rep. 2013 dec 13;62(49):1005–8. pmid:24336133 johansen k, lopalco pl, giesecke j. immunisation registers–important for vaccinated individuals, vaccinators and public health. euro surveill. 2012 04 19;17(16):20151. pmid:22551460 a marked decline in the incidence of malaria in a remote region of malaita, solomon islands, 2008 to 2013 original research hellen oloifana-polosovai,a john gwala,a humpress harrington,a peter d massey,b elmer ribeyro,a angelica flores,a christopher speare,c edwin mcbride,d david maclarend and rick spearee a atoifi adventist hospital, atoifi, malaita, solomon islands. b health protection, hunter new england population health, tamworth, australia. c tropical health solutions pty ltd, townsville, australia. d college of medicine and dentistry, james cook university, cairns, australia. e college of public health, medical and veterinary sciences, james cook university, townsville, australia. correspondence to rick speare (e-mail: rickspeare@gmail.com). to cite this article: oloifana-polosovai h et al. a marked decline in the incidence of malaria in a remote region of malaita, solomon islands, 2008 to 2013. western pacific surveillance and response journal, 2014, 5(3). doi:10.5365/wpsar.2014.5.3.002 abstract setting: atoifi adventist hospital (aah), solomon islands, the only hospital in the east kwaio region. objective: to use routine surveillance data to assess the trends in malaria from 2008 to 2013. design: descriptive study of records from (1) aah laboratory malaria records; (2) admissions to aah for malaria; and (3) malaria treatments from outpatient records. results: aah examined 35 608 blood films and diagnosed malaria in 4443 samples comprised of 2667 plasmodium falciparum (pf) and 1776 plasmodium vivax (pv). between 2008 and 2013 the total number of malaria cases detected annually decreased by 86.5%, pf by 96.7% and pv by 65.3%. the ratio of pf to pv reversed in 2010 from 2.06 in 2008 to 0.19 in 2013. for 2013, pf showed a seasonal pattern with no cases diagnosed in four months. from 2008 to 2013 admissions in aah for malaria declined by 90.8%, and malaria mortality fell from 54 per 100 000 to zero. the annual parasite index (api) for 2008 and 2013 was 195 and 24, respectively. village api has identified a group of villages with higher malaria incidence rates. conclusion: the decline in malaria cases in the aah catchment area has been spectacular, particularly for pf. this was supported by three sources of hospital surveillance data (laboratory, admissions and treatment records). the decline was associated with the use of artemisinin-based combined therapy and improved vertical social capital between the aah and the local communities. calculating village-specific api has highlighted which villages need to be targeted by the aah malaria control team. introduction in the 22 pacific island countries and areas, malaria is endemic in papua new guinea, solomon islands and vanuatu.1 malaria is close to elimination in vanuatu only in tafea province and in solomon islands only in isabel province. solomon islands has been successful in reducing malaria incidence and mortality. the annual parasite index (api), was reduced from 82 in 2008 to 45 in 2012.2 mortality was 15.7, 7 and 3 per 100 000 in 2003, 2007 and 2012, respectively.2,3 in malaita province, the api was 137, 83 and 33.5 in 1996, 2009 and 2011, respectively.4–6 apart from reducing malaria cases and deaths, the ministry of health has the goal of eliminating malaria from two of nine provinces: isabel and temotu. the recent and ongoing outbreak of dengue in solomon islands has highlighted the challenges of vector control and health education relevant for malaria.7 a national policy for all patients to receive a diagnostic malaria test if suspected was implemented in 1968.8 in the mid-1970s, the api was 30 with malaria largely controlled by residual dichlorodiphenyltrichloroethane (ddt) sprayed inside houses.9 with the cessation of ddt use in 1993 the api rose to 400.10 insecticide treated nets (itns) were trialled in the early 1990s, and national distribution began in 1996.8,10 in 2008 artemisinin-based combination therapy (act) was made free for all ages.8 the reported malaria cases (confirmed) in solomon islands fell more than 50% between 2000 and 2009 from 368 913 (68 107) to 84 078 (33 002) cases.11,12 in the atoifi adventist hospital (aah) catchment area, the setting for this study, itns were made available in the 1990s but not distributed to all residents. new itns were distributed in november 2010 but to five villages only. in july 2009, act became the only malaria treatment available in the aah outpatients department (opd). a laboratory scientist at the aah laboratory noted a decline in the number of malaria cases and the proportion of cases due to plasmoduim falciparum (pf) between 2008 and 2013. however, the laboratory data had not been analysed. the aims of this study were to use the data from malaria tests performed at aah from 2008 to 2013 to (1) describe the trend in confirmed malaria and the proportion of pf to plasmodium vivax (pv); (2) confirm any trends in the laboratory data by assessment of malaria treatment and admission data; and (3) determine the api for the aah catchment area and for major villages in this area for 2008 and 2013. the regional action plan for the control and elimination of malaria in the western pacific (rap) calls for strengthening national routine surveillance systems to monitor malaria trends and programme impact (objective 6).1 hence, this project aligned well with the rap. methods study design descriptive study involving review of (1) laboratory records of malaria tests; (2) admissions for malaria; and (3) prescription of malaria treatments. study setting and population lying between latitudes 6° and 12° south, solomon islands is a tropical country with a total population of 515 870 (2009 census) and is ranked 143 out of 187 on the human development index.13,14 aah is in malaita province, located on the remote east coast of the island of malaita (population 137 597) at uru harbour and services the people of the east kwaio region. there is no road access to atoifi. people travel by light aircraft, boat, canoe or foot. aah is in a unique situation of being the only hospital and centre for malaria microscopy in east kwaio, and it is also the only malaria treatment centrea in the uru harbour area. aah provides primary health care services and inpatient services for patients referred from distant clinics. testing criteria: any patient presenting or referred to opd with a fever has a blood sample taken for a malaria film before administration of any treatment. this is standard practice consistent with the national policy.8 a malaria microscopist is always available and examines the film soon after collection or within 48 hours. malaria data the following details are recorded for every malaria test: date of test, patient name, age, sex, village and result. for this study, all specimens were thick blood films stained with romanovsky stain (chem-supply pty., ltd, australia). specimens were microscopically examined under oil immersion; and results recorded as malaria species: pf, pv or mixed (pf and pv). for calculations, mixed infections were counted as pf. all results were written in a malaria laboratory book. examinations were done mainly by the same two scientists; when they were away, another three laboratory technicians provided results. rapid diagnostic tests are available at aah, but so rarely are they done that no data was available. for this study each laboratory record from 2008 to 2013 was entered into microsoft excel (2010) and analysed. for a 10-week period in 2009, from 23 july 2009 to 30 september 2009, records were missing from laboratory books and could not be found. an estimate was generated for total tests and positive cases by averaging data for the missing period using matching values for 2007, 2008 and 2010. hospital admissions admissions to the hospital for malaria were obtained from the aah admission register. the case definition was based on the solomon islands health information system, whereby that a patient with clinical malaria had symptoms of malaria (confirmed), was hospitalized and was treated with antimalarial drugs. details collected included age, sex, outcome and length of stay. treatments for malaria the use of antimalarial drugs over the same period was accessed from the records of aah opd. since malaria treatment for inpatients is always initiated in opd, these records also capture inpatient treatments. demography people who access services at aah are primarily from two administrative districts, gulalofou (ward 17) and waneagu/taelanasina (ward 18). from the 2009 census, the populations of these districts were 6031 and 3478, respectively, totalling 9509.13 this figure was used as the denominator for calculating api, annual blood examination rate (aber), malaria admission rate and malaria mortality rate for the aah catchment area. api is the number of confirmed malaria cases per 1000 population per year, and aber is the number of tests done for malaria per year, expressed as a percentage of the catchment population. solomon islands has an annual 2.3% population growth.13 for malaita province the annual population growth rate was 2.51%. using 2009 as the starting point, the population was estimated for the other years using the more conservative 2.3% annual increase. over 150 villages are in the aah catchment area with the largest having approximately 300 residents. to provide a denominator to calculate api and aber at the village level, family heath cards were used. to obtain data to complete these cards, aah conducts a regular village demographic survey for the ministry of health. data were available for 2008 but not for 2013. using a conservative approach, the 2008 population numbers were used as the denominator in 2013. api and aber for villages were calculated by dividing the number of malaria cases and blood films examined by the population and multiplying by 1000. rates rates of malaria were calculated for the two-year period 2008–2009, prior to and during the introduction of the medication coartem® (novartis, usa) and compared to the most recent two-year period 2012–2013. two-year periods were used to increase the strength of the comparison. the rate ratio between periods was calculated with a 95% confidence interval (ci). assessment with the rap results for malaria control in the aah catchment area were then reviewed in line with the criteria in the rap.1 ethics approval was given by the atoifi human research ethics committee. results from 2008 to 2013 (missing 10 weeks of data in 2009), the aah examined 35 608 blood films for malaria (table 1); the number of cases tested decreased 45.2% over this period. table 1. number of all malaria tests by year, sex and age group, aah, solomon islands, 2008–2013 click to download table 1. jpg, 595kb * the data for 2009 are incomplete as 10 weeks of laboratory records were unavailable. males accounted for 44% (15 816/35 571) of the tests and children under five years for 33% (11 617/34 916) (table 1). the proportion of tests by sex and age group remained similar over the period. the number of cases of malaria and percent positive were highest in 2008 (1817 and 23.6%) and lowest in 2013 (246 and 5.8%) (figure 1 and table 2). between 2008 and 2013 the total number of positive cases of malaria decreased by 86.5%, pf by 96.7% and pv by 65.3%. the ratio of pf to pv reversed in 2010 from 2.059 in 2008 to 0.194 in 2013 (table 2). the change in ratio was greatest between 2012 and 2013. figure 1. number of malaria cases by month and year, aah, solomon islands, 2008–2013 click to download figure 1. jpg, 325kb table 2. malaria cases by species and year diagnosed at aah, solomon islands, 2008–2013 click to download table 2. jpg, 322kb pf, plasmodium falciparum; pv, plasmodium vivax. * the data for 2009 were incomplete as 10 weeks of laboratory records were unavailable. fourteen mixed infections of pf and pv were diagnosed and counted as pf. in 2012, cases of malaria, pf and pv rose, but this was reversed for pf in 2013 with a 78.8% decrease in cases, while pv had a decrease of 4.6%. for the period 2008–2009, the annual malaria incidence rate was 13 906 per 100 000 population; for the period 2012–2013, the rate was 3161 per 100 000. the rate ratio was 0.23 (95% ci: 0.21–0.25), showing a significant reduction. malaria was diagnosed in all months for pv from 2008 to 2013 and for pf from 2008 to 2012. in 2013, pf was not diagnosed in four months; the pattern of pf changed from a year-long transmission to a suggestion of a seasonal pattern with transmission mainly in the first five months of the year (figure 2). figure 2. number of malaria cases by species and month for 2008 and 2013, demonstrating marked decline in both species and development of a seasonal pattern for plasmodium falciparum in 2013, aah, solomon islands click to download figure 2. jpg, 349kb the mean age of malaria cases was lower for both males and females than negative cases (table 3). the mean age of pv cases was less than that of pf cases for both sexes for most years. the difference in mean age was greatest in 2013 (table 3). table 3. mean age of patients with positive malaria films, by sex and year, aah, solomon islands, 2008–2013 click to download table 3. jpg, 292kb pf, plasmodium falcifarum; pv, plasmodium vivax. malaria admissions hospital admission records for malaria were available for all six years except for the first three months of 2008 (table 4). males and children under five years made up 50.3% and 43.3% of total admissions, respectively. the number of admissions declined 90.8% from 2008 to 2013, and the number of deaths fell to zero from 54 per 100 000 in 2008 (table 4). length of stay did not change. hospital policy from 2009 was to keep all malaria inpatients until the course of act was complete. table 4. admissions and outcomes for patients admitted with malaria by year, aah, solomon islands, 2008–2013 click to download table 4. jpg, 337kb * missing admission records for january to march for 2008. malaria treatments over the six-year period, data were missing for 10 of the 72 months (table 5). the number of malaria treatments fell 91% from 2008 to 2013 (table 5). chloroquine, fansidar and quinine were not used after 2009. the category of “no specific details” contains records that stated malaria treatment was given, but no drug details were recorded in opd records. after july 2009, this category could include only act as all other malaria treatments were removed from the aah opd. table 5. number of people prescribed malaria drugs by year, aah opd, solomon islands, 2008–2013 click to download table 5. jpg, 336kb act, artemisinin-based combination therapy. * missing data for january to february 2008. † missing data for october to december 2009. ‡ missing data for january to february 2010. § missing data for april to june 2013. aber and api the api for the atoifi catchment area declined from 195 in 2008 to 24 in 2013, while aber halved from 83% to 40% for 2008 to 2013, respectively (table 6). table 6. aber and api for the aah catchment population, 2008–2013 click to download table 6. jpg, 325kb aber, annual blood examination rate; api, annual parasite index. * 2009 has estimates for missing data. for villages with a reliable 2008 population estimate, the highest api of 732 was for gounasuu (table 7). gounasuu also had the highest api in 2013 although it had declined by 50% to 366. table 7. aber and api for selected villages for 2008 and 2013 click to download table 7. jpg, 504kb this study reports confirmed malaria cases over six years (2008 to 2013) from a major hospital in a remote region of solomon islands. since every febrile case or suspected malaria case has a blood test, positive cases of malaria were always laboratory-confirmed cases. this contrasts with presumptive clinical reporting of malaria cases which overestimates malaria incidence.15 in our study, a presumptive clinical diagnosis of malaria would have overestimated incidence by approximately four times in 2008 and 17 times in 2013. the other unique aspect is that aah is the only source for malaria treatment in the uru harbour area. aah therefore captures a high proportion of symptomatic malaria cases in the uru harbour region. the aah data provide a reliable estimate of the incidence of malaria in the aah catchment area. a large and significant reduction in the rates of diagnosed malaria occurred during the period 2008 to 2013. the data show a remarkable fall in the number of blood films positive for malaria, particularly for pf. the fall in the number of pf cases was so great that in 2013, no cases were diagnosed in four months and a pattern consistent with seasonal transmission appeared for the first time. the seasonal pattern has been maintained in 2014 with no pf cases for two (april, may) of the first six months (personal observation of two aah staff). variation in climate is unlikely to account for this. although there are no weather records for east kwaio, the weather has not varied significantly over these years, being generally hot (> 26 °c) with at least 200 mm of rain per month. pv progressively became the dominant species over this time since its incidence fell less than pf. since primaquine is rarely used at aah for vivax malaria, some of these cases could be relapses from hypnozoites. as malaria elimination progresses globally, pv is becoming the predominant malaria species.16 the number of severe cases of malaria, as indicated by admissions, showed a similar spectacular decline, falling 91%. this was a conservative value since for the commencing year, 2008, three months of admissions data were missing, making the true reduction higher. since the national malaria admission rate was 750 per 100 000 in 2008 and 1000 in 2012, the aah rate of 1646 per 100 000 in 2008 was more than double, and the 2012 rate of 373 per 100 000 was a third of the national rate.8 solomon islands malaria-related mortality in 2007 and 2012 was 7 and 3 per 100 000, respectively.2 the aah catchment area, with its malaria mortality rate of 54 per 100 000 was almost eight times the national rate in 2008 and much lower (zero) by 2012. these results demonstrate that control of malaria in the atoifi catchment area has exceeded the national performance. the api for malaita province in 2011 was 33.0, placing it sixth among the provinces.6 atoifi achieved a lower api by 2013. prior to july 2009, malaria was treated with fansidar with or without chloroquine. the aah opd records showed quinine being prescribed to initiate therapy on admission in 2008 and 2009 but not subsequently. causation cannot be attributed from such a study. however, the fall in malaria coincided with two significant events at aah: (1) introduction of act as the only treatment available at opd in july 2009; and (2) introduction of a long-term research capacity-strengthening project in 2009 that is still ongoing.17 act was introduced nationally in 2009 with variable results and not such a large decline in malaria incidence as reported in our study.8,18 the approach taken for the research capacity-strengthening activities at atoifi is very inclusive, involving community members as well as health professionals and researchers.19 it includes community-based research of diseases of importance to the people of the area.20,21 this has made the aah more accessible to the surrounding communities.17 social capital is important in malaria control in solomon islands.22 the improved vertical social capital between the aah and the local communities, which commenced in 2009, may have also contributed to the marked decline in malaria incidence. indoor spraying is not conducted in this area and itn use has not been assessed. the initial api for the study area was much higher than that reported for solomon islands nationally and for malaita province. in 2009, the api for solomon islands was 77.0 while the api for malaita province in the same year was the highest for the solomon islands at 82.9.23 the initial incidence of malaria in the atoifi area was double the national api but similar to rates in the capital, honiara.24 the villages with the highest apis (gounasuu, wyfolonga and abitona) are clustered within two kilometres of each other in a mangrove swamp, and vector-biting rates are probably high. however, there have been no entomological studies in this area. these villages can now be targeted for special attention by the malaria control programme at atoifi. the api at atoifi, the community which includes the aah, was as high in 2008 as the apis of the surrounding less well developed villages. this may have been due to anopheles in the aah being infected by patients attending the hospital and transmitting malaria locally. as a result of this finding, in late 2013 the hospital installed mosquito screens on the windows of all hospital wards. these examples highlight the value of calculating a village api. limitations malaria was diagnosed by thick film only. this is the standard practice used in routine medical diagnostic laboratories in most developing countries. the accuracy of identifying plasmodium species by thick film is less than by thin film.25 since the same microscopists performed the majority of examinations; were trained in malaria microscopy; used a standard staining technique; had good quality, well-maintained microscopes; and results were provided to clinicians promptly, the trend data will be reliable.25,26 atoifi also meets the standards of the solomon islands laboratory quality assurance programme and both microscopists are certified. calculations for api and aber were based on hospital data (numerator) and the total population of the administrative districts of gulalofou and waneagu/taelanasina (denominator). some people from very remote parts of these districts only travel to aah for life-threatening illness or may bypass aah to travel to health clinics in other districts.27 in addition, since the southern part of ward 18 includes populations adjacent to singalagu harbour, residents may attend the singalagu clinic instead of aah, underestimating malaria incidence. however, we believe these factors have not changed over the period of the study and the trend data is reliable. although 10 weeks of data for 2009 were missing from the laboratory data, the available data had a high standard of accuracy with a low percentage of data missing. the admissions register was missing three months of data for the baseline year (2008) and for the treatment records in opd. additional problems with administrative data were illustrated by the lack of details in malaria treatment records. aah has now requested opd to record specific details of treatment given. this study illustrates the value of analysing routinely collected administrative data to provide trends in disease. laboratory results, hospital admissions and malarial treatments provided the indicators relevant to incidence and severity of malaria. the rap states that successful implementation of malaria programme activities is expected to result in six achievements by 2015.1 it is interesting to compare progress at atoifi against five of these, bearing in mind that the rap uses 2007 as a baseline and 2015 as the endpoint (table 8). table 8. trends in malaria at aah compared with the malaria elimination progress criteria in the rap (p. 31)1 click to download table 8. jpg, 438kb conclusion the decline in the incidence and severity of malaria in the aah catchment area has been spectacular, particularly for pf. this was supported by three sources of hospital administrative data (laboratory, admissions and treatment records). the marked decline appears to be associated with the use of act and improved vertical social capital between aah and the surrounding communities. calculating village-specific api has highlighted which villages need to be targeted by the aah malaria control team. the study illustrates the value of using routinely collected hospital administrative data in monitoring disease trends in a tropical resource-poor setting. conflicts of interest none declared. funding this study received financial support from tdr, the special programme for research and training in tropical diseases, cosponsored by united nations children’s fund, united nations development programme, the world bank and who (grant 1–811001688). references regional action plan for malaria control and elimination in the western pacific (2010–2015). manila, world health organization regional office for the western pacific, 2012:63. available from: http://www.wpro.who.int/mvp/documents/malaria_ regional_action_plan_final.pdf [accessed 11 september 2014]. solomon islands–australia partnership for development. independent performance assessment panel – assessment for 2012: final report. honiara, government of solomon islands, 2013. available from: http://aid.dfat.gov.au/countries/pacific/ solomon-islands/documents/solomon-islands-p4d-independent-assessment 2012.pdf [accessed 11 september 2014]. monitoring and evaluation plan: 1 may 2011–31 december 2014. multi-country western pacific rolling continuation channel malaria grant 15 june 2011. honiara, solomon islands national malaria control programme, 2014. available from: https://www.spc.int/frp/index2.php?option=com_docman&task=doc _view&gid=476&itemid=33 [accessed 11 september 2014]. over m et al. impregnated nets or ddt residual spraying? field effectiveness of malaria prevention techniques in solomon islands, 1993–1999. the american journal of tropical medicine and hygiene, 2004, 71 suppl;214–223. pmid:15331840 o’sullivan m et al. malaria elimination in isabel province, solomon islands: establishing a surveillance-response system to prevent introduction and reintroduction of malaria. malaria journal, 2011, 10:235. doi:10.1186/1475-2875-10-235 pmid:21834995 progress in malaria control and moving towards elimination in solomon islands and vanuatu. manila, world health organization regional office for the western pacific, 2012. available from: http://www.wpro.who.int/world_health_day/2014/progress inmalariacontrolsolvan.pdf [accessed 11 september 2014]. nogareda f et al. ongoing outbreak of dengue serotype-3 in solomon islands, january to may 2013. western pacific surveillance and response journal, 2013, 4:28–33. doi:10.5365/wpsar.2013.4.2.013 pmid:24319611 world malaria report 2013. geneva, world health organization, 2013:238. available from: http://www.who.int/malaria/publications/world_malaria_report_2013/en/ [accessed 11 september 2014]. avery jg. a review of the malaria eradication programme in the british solomon islands protectorate. papua and new guinea medical journal, 1974, 17:61–67. kere nk et al. permethrin-impregnated bednets are more effective than ddt house-spraying to control malaria in solomon islands. medical and veterinary entomology, 1996, 10:145–148. doi:10.1111/j.1365-2915.1996.tb00720.x pmid:8744706 world malaria report 2010. geneva, world health organization, 2011:286. available from: http://www.who.int/malaria/world_malaria_report_2010/en/ [accessed 11 september 2014]. country profile – solomon islands. manila, world health organization regional office for the western pacific, 2010. available from: http://www.who.int/malaria/ publications/country-profiles/2010/mal2010_slb.pdf?ua=1 [accessed 19 september 2014]. report on 2009 population and housing census. statistical bulletin 06/2011. honiara, government of solomon islands, 2011:51. human development report 2013. the rise of the south: human progress in a diverse world. new york, united nations development programme, 2013:216. available from: http://hdr.undp.org/en/2013-report [accessed 11 september 2014]. roucher c et al. changing malaria epidemiology and diagnostic criteria for plasmodium falciparum clinical malaria. plos one, 2012, 7:e46188. doi:10.1371/journal.pone.0046188 pmid:23029433 koepfli c et al. a large plasmodium vivax reservoir and little population structure in the south pacific. plos one, 2013, 8:e66041. doi:10.1371/journal.pone.0066041 pmid:23823758 redman-maclaren m et al. mutual research capacity strengthening: a qualitative study of two-way partnerships in public health research. international journal for equity in health, 2012, 11:79. doi:10.1186/1475-9276-11-79 pmid:23249439 wijesinghe rs et al. exploring provider and community responses to the new malaria diagnostic and treatment regime in solomon islands. malaria journal, 2011, 10:3. doi:10.1186/1475-2875-10-3 pmid:21219614 redman-maclaren ml et al. research workshop to research work: initial steps in establishing health research systems on malaita, solomon islands. health research policy and systems, 2010, 8:33. doi:10.1186/1478-4505-8-33 pmid:21034512 massey pd et al. progress towards tb control in east kwaio, solomon islands. rural and remote health, 2013, 13:2555. pmid:23731167 massey pd et al. tb questions, east kwaio answers: community-based participatory research in a remote area of solomon islands. rur and remote health, 2012, 12:2139. pmid:23094978 uchiyama h, kawabata m. social capital and health in malaria-prevalent areas of the solomon islands. the kobe journal of medical sciences, 2011, 57:e49–62. pmid:22926073 atkinson ja et al. operational research to inform a sub-national surveillance intervention for malaria elimination in solomon islands. malaria journal, 2012, 11:101. doi:10.1186/1475-2875-11-101 pmid:22462770 kunimitsu a. the accuracy of clinical malaria case reporting at primary health care facilities in honiara, solomon islands. malaria journal, 2009, 8:80. doi:10.1186/1475-2875-8-80 pmid:19389239 payne d. use and limitations of light microscopy for diagnosing malaria at the primary health care level. bulletin of the world health organization, 1988, 66:621–626. pmid:2463112 durrhelm dn et al. diagnostic disagreement–the lessons learnt from malaria diagnosis in mpumalanga. south african medical journal, 1997, 87:609–611. pmid:9254820 maclaren d, kekeubata e. reorienting health services through community health promotion in kwaio, solomon islands. promotion & education, 2007, 14:78–79. doi:10.1177/10253823070140021701 pmid:17665704 responding to the health and rehabilitation needs of people with disabilities post-haiyan field investigation report mylene rose benigno,a pauline kleinitz,b liezel calina,c ma rowena alcido, a bérengère gohyd and julie lyn halla a office of the who representative in the philippines, sta cruz, manila, philippines. b world health organization regional office for the western pacific, manila, philippines. c department of rehabilitation medicine, eastern visayas regional medical center, tacloban city, leyte, philippines. d handicap international, avenue des frères lumières, lyon, france. correspondence to mylene rose benigno (email: benignom@ wpro.who.int or myles_md@yahoo.com). to cite this article: benigno mr et al. responding to the health and rehabilitation needs of people with disabilities post-haiyan. western pacific surveillance and response journal, 2015, 6(suppl 1):53–59. doi:10.5365/wpsar.2015.6.2.hyn_010 abstract introduction: it is estimated that 15% of the world’s population has a disability, and disasters increase their risk and vulnerability. rehabilitation services were limited in the area of the philippines that was affected by typhoon haiyan. this study describes the initial rehabilitation needs assessment and activities to increase rehabilitation services conducted in leyte province of region 8 after haiyan. method: a rehabilitation needs assessment for people with disabilities and injuries needing physical and functional rehabilitation care and assistive devices was conducted in health facilities, evacuation centres and selected municipalities in leyte province between 9 november 2013 and 30 april 2014 by a consortium of agencies. improvements to service delivery and referrals were documented. results: rehabilitation services were reduced immediately after haiyan, but they increased in the following months and peaked four months after haiyan. there were 2998 individuals needing medicine and rehabilitation management, functional care and assistive devices. these included persons with pre-existing disabilities whose situations had worsened and people who had sustained injuries in the typhoon. additional improvements included rehabilitation services with provision of assistive devices at the regional hospital, development of a directory of disability services in the region and advocacy through community-based rehabilitation. discussion: information services and community knowledge for people with disabilities improved in region 8 after typhoon haiyan, demonstrating that strengthening rehabilitation systems is a realistic goal after disasters. introduction more than a billion people, or about 15% of the world’s population, are estimated to live with some form of disability.1 disability, as defined by the international classification of functioning, disability and health, refers to an impairment, activity limitation or participation restriction that is the result of the interaction between health conditions and environmental and personal factors. it relates to the body functions and structures of people, the activities people do, the life areas in which they participate and the environmental factors that affect these experiences.2 disasters impact people with disabilities disproportionately; in settings where resources are limited, like the philippines, the impact of disasters on these people can be long-term and far-reaching.3 disasters affect people with existing disabilities and create a new generation of people with disabilities, most of whom will need rehabilitation services. people with disabilities are at an increased risk in emergency and disaster situations.4 they may experience increased vulnerability due to limited access to information, healthcare and rehabilitation and loss of support networks, especially if family and caregivers are killed or injured in the disaster.5 during the disaster, they may have more difficulty evacuating; following the disaster, they may have difficulty physically accessing essential service (latrines, water, etc.). losing an assistive device in a disaster, such as an artificial limb, hearing aide or spectacles, also increases vulnerability. in the philippines, rehabilitation services are limited, particularly in the public (government-funded) health sector, and are mainly found in major cities in level 3 hospitals.6 most specialists, particularly physiatrists, practice in the national capital region (manila).7 rehabilitation, as defined for the scope of this paper, is a set of measures that assist individuals with disabilities, both pre-existing and new, to achieve and maintain optimal body function in interaction with their environment.1 nationwide in 2011, there were 305 729 low-income households with members having disabilities. region 8, the area most affected by typhoon haiyan, had 13 478 low-income households in which people with disabilities lived.8 following typhoon haiyan in november 2013, all six hospitals in tacloban city, the capital of leyte province, that previously offered rehabilitation services were devastated. the entire physical therapy unit of the eastern visayas regional medical center (regional hospital) was flooded, most of the therapeutic equipment was destroyed and medical records were water damaged. shops that sold assistive devices (standard orthopaedic wheelchairs, crutches, walkers and canes) were also damaged. like the rest of the people of tacloban city, hospital and health personnel were also victims of the disaster. immediately after haiyan, all services, including rehabilitation services for people with disabilities and injuries ceased at both inand out-patient facilities. some limited services resumed a few weeks after the disaster with the help of local and international volunteers and the establishment of temporary facilities such as field hospitals. in this paper we describe the needs assessments and the activities conducted to increase access to rehabilitation and other services for people with disabilities and with injuries. the assessments were conducted by the world health organization (who), handicap international (hi), department of health (doh) and rehabilitation medicine specialists in leyte province during the acute response up to april 2014, five months post-haiyan. initial rehabilitation needs assessment and acute response a rehabilitation needs assessment for people with disabilities and injuries needing physical and functional rehabilitation care and assistive devices was conducted in health facilities (four hospitals and four temporary field hospitals), evacuation centres and selected municipalities (alang-alang, babatngon, palo, pastrana, sta fe, tacloban city, tanauan and tolosa) in leyte province, region 8 between 9 november 2013 and 30 april 2014 by hi through a grant agreement with who using the individual rehabilitation assessment form (figure 1) and by rehabilitation specialists of tertiary hospitals in tacloban city. people with injuries and disabilities were assessed according to their physical, sensorial and cognitive difficulties and functional limitations in performing activities of daily living such as eating, drinking, dressing, bathing, toileting, moving, communicating and playing with children. figure 1. individual rehabilitation assessment form used for post-haiyan needs assessment in region 8, the philippines, 2014 click to download figure 1. jpg, 621kb there were 2998 individuals identified as needing physical medicine and rehabilitation management, functional care and assistive devices, including persons with pre-existing disabilities and people who had sustained injuries in the typhoon. there was a consistent increase in the number of cases identified from november 2013 until the peak during march 2014 when a total of 889 patients were seen reflecting peak in referrals and availability of services (figure 2). figure 2. number of people with injuries and disabilities identified and accessing rehabilitation services in leyte province by month, region 8, the philippines, 9 november 2013 to 30 april 2014 click to download figure 2. jpg, 307kb more people were identified in health facilities compared to in the community (2232 versus 766, respectively) due to limited human resources and accessibility to the community (evacuation areas and houses). all needed rehabilitation services were delivered, including independence training in daily activities, proper transfer and transition techniques, therapeutic exercises, and gait and mobility training on how to use the assistive mobility devices. almost 400 devices, including 50 prostheses and 320 mobility devices (133 canes, 98 crutches, 50 walking frames and 39 wheelchairs), were provided to people with new injuries or pre-existing disabilities. many people with disabilities were evacuated to manila, however, the exact number is unknown. based on hospital records gathered from the major hospitals in manila and cebu with comprehensive rehabilitation medicine services, forty people needing critical care and rehabilitation management were transferred from region 8. improving delivery of rehabilitation services in the regional hospital prior to typhoon haiyan, there were few rehabilitation services in leyte province and they were commonly led by rehabilitation medicine specialists. of the 79 hospitals in region 8, rehabilitation services were only provided in nine (11% of hospitals); two were government hospitals offering services at reduced costs (2.5% of hospitals). one of these was the eastern visayas regional medical center (emvrcm) in tacloban city, a regional hospital which offered primarily home-based exercise programmes as physical therapy services. following haiyan, strengthening these services was a priority for hospital management and the doh. in april 2014, five months post-haiyan, evrmc established a department of rehabilitation medicine that increased the coverage of rehabilitation services to include not only physical therapy but also physiatric consultations, occupational therapy sessions and provision of prostheses and orthoses. a workshop to manufacture for prostheses and orthoses was established to cater to the demand from the rehabilitation medicine team (physiatrist, physical therapists and occupational therapist), and it became the first provider of prostheses (e.g. artificial legs) and orthoses (e.g. leg braces) in region 8. psychiatry and social services were also provided in the hospital as an integral part of rehabilitation. the who representative office in the philippines contributed to improving rehabilitation medicine by procuring rehabilitation equipment (e.g. therapeutic ultrasound, resistive exercise products and fine motor and dexterity activity sets). as a result of these improvements, the regional hospital provided rehabilitation to more patients, including those in critical care units, for a wider range of musculoskeletal and neurological conditions. the number of patients receiving rehabilitation in the regional hospital grew from 533 patients per year before haiyan to 1547 in 2014. strengthening disability referral system directory of services a directory of health, rehabilitation and disability services for region 8 was published in november 2014.9 this directory served as a guide for all personnel advocating, treating and caring for people with disabilities in the health and social welfare sectors as it provided information on available services, including health professionals and facilities, sources of assistive devices, schools and therapy centres, support groups, disabled persons organizations and professional groups. with all this information in one directory, people with disabilities had better access to information on various services and programmes. most of the key stakeholders in the disability sector (18/25, 72%) attended the launch of the directory. it was also distributed to government offices, nongovernmental organizations and their substituents in all six provinces of region 8. community-based rehabilitation initiative community-based rehabilitation (cbr) is a programmatic approach to increase awareness and inclusion of people with disabilities at the community level and was implemented by the local government with support from who. the post-haiyan cbr initiative was developed through orientation lectures, situational analysis, resource mapping, development of a plan of action and formation of a cbr working group. tacloban city was chosen as the model city for cbr, in line with the presidential order, and the mayor designated an officer and provided an office space. at the regional and provincial level, there was participation by most key stakeholders (21/25, 84%) in cbr orientation and training conducted by who from 20 to 21 november 2014. attendees included officers from the departments of persons with disability affairs office (pdao), welfare and social development, health, education, public works and highway, interior and local government, transportation and communications, budget and management as well as other components of the regional committee on disability affairs, professional groups and disabled persons organizations (dpo). at the city level, cbr orientation and workshops were conducted in tacloban city by who from 23 to 24 october 2014; these were well attended by 88% (22/25) of key stakeholders. these included local government representatives, city officials from social welfare and development, budget, health, hospitals, special education, planning, public employment service office, professional groups (doctors, teachers), dpos (autism society, parent group, pwd cooperative), nongovernmental organizations and advisers from the national council for disability affairs (ncda). a pdao-cbr technical committee was formed in tacloban city comprised of 18 members of key stakeholders, line agencies and advocates. the group worked on budget proposals and plans of actions for the city’s priority disability programmes. at the community level, cbr training and orientation was conducted at all 138 villages in tacloban city by who from 13 to 19 march 2015. information on cbr was disseminated widely through the barangay captains, health workers, day care workers and volunteers. as a result, the issues faced by people with disabilities are more widely known. during the sessions, disability issues (awareness, sensitization, data consolidation, education, livelihood, employment, organization, participation, health services, social welfare) were included in the barangay development plan and budget. the pdao-cbr technical committee will continue to guide and strengthen the tacloban city cbr program. other initiatives in march 2015, doh conducted a two-day training course on disability-inclusive health and rehabilitation services at the primary health care level. approximately 50 non-specialist doctors and nurses participated from selected cities and municipalities of region 8. the training presented the various laws regarding people with disabilities, the range of services needed, and the specific people, agencies and facilities in region 8 that can address disability needs. at the national level, the ncda produced and disseminated two advocacy documents promoting consultation and inclusion of people with disabilities in rebuilding efforts. several other tools were collaboratively developed to promote disability awareness at the community level in region 8. the most widely reproduced was a poster advocating actions for information, empowerment and respect for people with disabilities. the posters were distributed to all 510 government offices and nongovernmental organization in region 8 and promoted positive behavioural changes in the community. discussion rehabilitation services for people with disabilities are necessary and can be effective after a disaster. although rehabilitation services at the regional hospital in leyte province declined immediately after haiyan, they increased in the months following to a peak of people accessing these services four months after haiyan. this increase in patients can be attributed to the improvement in services at the regional hospital as well as increased awareness of the referral system. haiyan provided an opportunity to “build back better” in terms of infrastructure and service development, particularly at the regional hospital, which was significantly damaged. expansion of services in the region helped decentralize specialized disability services that were previously only available in manila and cebu. the fact that services, information and community knowledge for people with disabilities improved in region 8 after the initial needs assessment post-haiyan shows the importance of conducting such assessments after a disaster to critically address the specific needs of people with disabilities. in a relatively short period of time, i.e. five months, sustainable improvements in health service delivery resulted in more than double the number of people with disabilities being seen for a wider range of conditions. there were several approaches adopted which helped to ensure people with disabilities were accepted as contributing members of the community. one approach was disability-inclusive development and inclusion in recovery and rebuilding efforts; another was through the cbr initiative that resulted in the community having a better understanding of the needs of people with disabilities. an ideal cbr programme reduces the effects of poverty, promotes human rights and ensures dignity for all persons with disabilities and their family members.10 some limitations to this work were that resources did not allow support to all areas of leyte, rather it focused on selected municipalities. there were also other actors for disability that contributed to the response effort who were not part of this paper. it is likely that some underestimation of the number of people with disabilities and injuries occurred and other activities may not have been documented. this study also found that detailed pre-disaster data were limited and that having estimations and profiles of people with disabilities in communities before a disaster would improve the response. efforts to increase referral for the philippines pwd identification card is currently being conducted through active identification through the pdao office and through cbr referral efforts from the barangay health workers of tacloban city;11 this would be one way to identify people with disabilities post-disaster. the needs assessment that was conducted has been the only assessment done in region 8. accurate situational assessments of needs and available services accelerated relief and recovery efforts and mitigated some of the consequences of haiyan for this vulnerable population. developing rehabilitation services in all hospitals in the philippines will improve the quality of life and decrease the burden of disease. of significant concern is that only 11% (9 out of 79) of hospitals in region 8 offered rehabilitation services. advocating for wider implementation of republic act no. 10070, an act to establishing institutional mechanism to ensure the implementation of program and services for persons with disability in every province, city and municipality,11 will improve conditions for people with disabilities, not only after disasters, but all the time. conclusions the number of people with disabilities and injuries increases after a disaster. determining those who will need specific disability and rehabilitation services, as well as mapping these services, are vital responses following a disaster. inclusion of people with disabilities in initial health assessments should become routine after disasters. without information about the situation and the services, the conditions of people with disabilities and injuries will worsen over time. working with health, rehabilitation and disability sectors is essential for improving access to services for people with disabilities. improving the coordination and planning between these stakeholders, for example through development and utilization of the regional service directory and cbr programme development, increased access to services. this study demonstrated that improving services and increasing coordination between services, beyond pre-disaster levels, was a realistic goal. conflicts of interest none declared. funding none. acknowledgements we thank the eastern visayas regional medical center, divine word hospital and remedios t romualdez hospital for their involvement in this work. we also acknowledge hi for conducting the initial needs assessment and providing the data. references world health organization and the world bank. world report on disability. geneva, world health organization, 2011. available from: http://www.who.int/disabilities/ world_report/2011/report.pdf [accessed 11 august 2015]. international classification of functioning, disability and health (icf). geneva, world health organization, 2001. available from: http://www.who.int/ classification/icf/en/ [accessed 11 august 2015]. disasters, disability and rehabilitation. geneva, world health organization department of injuries and violence prevention, 2005. available from: http://www.who.int/violence_injury_prevention/other_injury/disaster_ disability2.pdf [accessed 11 august 2015]. world disaster report 2007 – focus on discrimination. geneva, international federation of red cross and red crescent societies, 2007. available from: http://www.ifrc.org/pagefiles/99876/2007/wdr2007-english.pdf [accessed 11 august 2015]. disaster risk management for health fact sheet: people with disabilities and older people. geneva, world health organization, 2011. available from: http://www.who.int/hac/events/drm_fact_sheet_disabilities.pdf [accessed 10 august 2015]. national objectives for health: 2011–2016. manila, department of health, 2011. available from: http://www.rchsd.ph/images/downloads/national%20 objectives%20for%20health%202011-2016.pdf [accessed 11 august 2015]. martinez r. current developments in the philippines rehabilitation services. manila, 1st public health convention on the health and wellness of persons with disabilities: increasing access to health and wellness, 6 november 2014. available from: http://www.doh.gov.ph/sites/default/files/currentdevelopmentsphilippine rehabilitationservices.pptx [accessed 24 august 2015]. national household targeting system for poverty reduction (nhts-pr). manila, department of social welfare and development, 2011. available from: http://listahanan.dswd.gov.ph/download/reports/profile_of_the_poor_/profile% 20of%20the%20poor-021213.pdf [accessed 24 august 2015]. directory of health, rehabilitation and disability services: region 8. manila, world health organization regional office for the western pacific, 2014. available from: http://www.wpro.who.int/philippines/publications/directory_disability/en/ [accessed 11 august 2015]. world health organization, united nations educational, scientific and cultural organization, international labour organization, international disability and development consortium. community-based rehabilitation: cbr guidelines. geneva, world health organization, 2010. available from: http://www.who.int/disabilities/cbr/guidelines/en/ [accessed 11 august 2015]. ordinance no. 2014–12–15: an ordinance creating persons with disability affairs office (pdao) of tacloban city. tacloban city, tanggapan ng sangguniang panlunsod, june 2014. panstop: a decade of rapid containment exercises for pandemic preparedness in the who western pacific region brief report edna moturi,a katherine horton,a leila bell,a lucy breakwell,a erica duegerab a who regional office for the western pacific, manila, philippines. b influenza division, centers for disease control and prevention, atlanta, united states of america. correspondence to erica dueger (email:wpsar@who.int). to cite this article: moturi e, horton k, bell l, breakwell l, dueger e. panstop: a decade of rapid containment exercises for pandemic preparedness in the who western pacific region. western pac surveill response j. 2018 dec;9(5). doi:10.5365/wpsar.2018.9.5.012 rapid containment (rc) is one of the five priority interventions of the world health organization (who) strategic action plan for pandemic influenza;1 it relies on the concept that mass prophylactic administration of antiviral drugs, combined with quarantine and social distancing measures, could contain or delay the international spread of an emerging influenza virus.2,3 during a rc operation, mass antiviral prophylaxis treatment and non-pharmaceutical interventions are rapidly implemented within a containment zone surrounding the initial cases; active surveillance and additional activities are extended to a broader buffer zone where cases are most likely to appear based on the movements of cases and contacts.2,4 the strategy is dependent on the rapid (within three to five days) detection, investigation and reporting of initial cases; the efficacy and availability of antivirals and vaccines; and timely risk assessment and decision-making. in the western pacific region, a stockpile of antiviral medication and personal protective equipment acquired through donations from the government of japan is warehoused in singapore under the auspices of the association of southeast asian nations (asean),5 and is managed under contract by the japan international cooperation system (jics).5 these supplies are reserved for early intervention when initial signs of increased human-to-human transmission of a highly contagious influenza virus occur. advanced planning is required for rc to ensure that all relevant partners and sectors work together in a coordinated manner within a short time frame. simulation exercises are recognized as a crucial component of pandemic preparedness, and many different types of exercises have been conducted in the asia–pacific region.6 in this paper, we describe the panstop exercises conducted by the who regional office for the western pacific to show how they have contributed to pandemic preparedness in the region. in 2007, the who regional office for the western pacific conducted the first simulated exercise known as panstop that aimed to determine the validity of procedures developed in the asia–pacific region for rc of a new, highly contagious influenza virus.5 the exercise took 11 hours over one and a half days, and was conducted in six sites, at the who regional office for the western pacific, the who country office in cambodia, jics and the japanese ministry of foreign affairs in tokyo, the asean secretariat in jakarta, and the offices of singapore technologies logistics (stl) in singapore.5 since then, the who regional office for the western pacific has conducted nine panstop exercises on rc to identify strengths and opportunities to improve planning activities for containing pandemic influenza. panstop is designed to test pandemic influenza response plans through a simulated real-world event and is not designed to evaluate individual participant performance. panstop exercises typically involve artificial but realistic scenarios where human infections of a novel influenza a virus are reported from a member state. participants, who may include who staff, ministry of health officials and people from other government agencies potentially involved in pandemic response, work through and discuss the decision-making process and actions necessary to implement rc based on their current pandemic preparedness plans. each year, member states or who country offices may request that a panstop exercise be conducted in their country to test their levels of preparedness. the regional office has also been the main player in two exercises to test and evaluate the roles and responsibilities of regional office staff for regional rc, particularity in logistics and communication. both modified functional and table-top exercises have been employed for panstop exercises (table 1). a modified functional exercise is an interactive process where multisectoral participants receive simulated outbreak information through email, telephone or actions and then respond as they would within actual designated roles. participants may carry out tasks in response to outbreak information (e.g. prepare a line list of cases, develop talking points for a press conference, calculate required doses of prophylaxis) or, when time is constrained, they may be asked to describe the actions they would take. these functional exercises have been conducted in cambodia (2007),5 the philippines (2008),7 malaysia (2009),8 mongolia (2010),9 viet nam (2013),11 and at the who regional office of the western pacific (2011),10 201412 and 201513 (table 1). all the exercises involved fictional scenarios of diseases of unknown etiology or occurrence of novel avian influenza with evidence of human-to-human transmission which necessitated the launch of a rc exercise. with the exception of panstop 2007 and 2010, all the exercises were conducted within two days. panstop exercises conducted at the who regional office of the western pacific have typically included jics and asean to test their transportation protocols when they ship items in the regional stockpile from singapore to the requested country. table 1. panstop exercises on influenza pandemic responses in the western pacific region, 2007–2018 click to download figure 1. jpg, 1523kb a table-top exercise comprises the same stakeholders, but a facilitator guides a discussion about a simulated series of events that prompts discussion of response actions from participants. table-top exercises provide an opportunity for moderated interactions of multiple sectors in addition to the ministry of health. in 2017, a table-top panstop exercise was held in fiji at the request of the fiji ministry of health to test the readiness of organizations involved in the national pandemic preparedness plan, including ministries of agriculture and transportation.14 the exercise, which lasted one and a half days, highlighted the importance of good multisectoral collaboration in ensuring a successful response. a similar table-top exercise was conducted this year in mongolia involving a fictional outbreak of novel avian influenza a(h10n8) in choibalsan province with multi-sectoral participation from the who regional office, who country office in mongolia, jics and various ministries and authorities. as for all simulation exercises, panstop is a relatively inexpensive way of assessing operational readiness and is more feasible than full-scale exercises that require extensive financial and human resource investment. panstop exercises typically last one or two days with simulated deployment of human and physical resources rather than actual movement of these resources. the exercises provide an opportunity for multisectoral engagement as rc requires involvement from both animal and human health sectors as well many other stakeholders, including administration, communication and logistics specialists (table 1). panstop exercises are overseen by evaluators who are pandemic preparedness experts. they assess the participants’ actions in terms of their appropriateness and alignment with the exercise’s goals and objectives. through consultation with participants, they also recommend improvements for operational readiness for rc. a final report is published for each conducted panstop exercise that includes the evaluation results, lessons learnt and recommendations (table 1). lessons learnt from panstop exercises include the need to (1) update national pandemic preparedness plans; (2) clarify specific sector roles during both rc and pandemic response efforts; (3) emphasize concepts to senior officials from different government agencies that may be involved in pandemic response; and (4) allow stakeholders to identify knowledge and planning gaps, such as lack of standardized operating procedures for rc initiation and availability of trained staff to execute the plans. a lesson learnt from the exercise at the regional level in 2014 was the need to improve emergency operations centre activation plans. as a result, the improved plans were developed, implemented and successfully tested in the 2015 panstop exercise (table 1). recommendations for improvements to the panstop exercise have been made so that future exercises are more effective and can potentially evolve beyond rc to test broader national systems. many national governments within the western pacific region have developed national pandemic response plans for rc to prepare for the next influenza pandemic.15 it is critical that these plans have the ability to be operationalized efficiently to mitigate the consequences of the next pandemic. panstop exercises provide an opportunity to test the rc mechanisms of these pandemic plans in the participating countries and at the regional level in a simulated environment that imitates pandemic events as they unfold. by participating in these exercises and subsequently adapting national preparedness plans based on exercise outcomes, the readiness capacity of participating governments, who and other partners in the region improves for the next influenza pandemic. acknowledgements we would like to thank panstop participants from the who regional office and member states (cambodia, fiji, malaysia, mongolia, philippines and viet nam) as well as the following individuals for maintenance of panstop momentum since 2007: li ailan, paul cox, tamara curtin-niemi, bill douglas, takeshi kasai, david knaggs, satoko otsu, jeffrey partridge, eric sergienko, nikki shindo, masaya kato and weigong zhou. yearly panstop exercises are supported in large part by the united states centers for disease control and prevention through cooperative agreement grants to the who regional office for the western pacific (nu51ip000879‐01‐00). references who interim protocol: rapid operations to contain the initial emergence of pandemic influenza interim protocol. geneva: world health organization; 2017 (https://www.who.int/influenza/resources/documents/rapid_protocol_pandemic_10_2007/en/, accessed 30 november 2018). ferguson nm, cummings da, cauchemez s, fraser c, riley s, meeyai a, et al. strategies for containing an emerging influenza pandemic in southeast asia. nature. 2005 sep 8;437(7056):209–14. doi:10.1038/nature04017 longini im jr, halloran me, nizam a, yang y. containing pandemic influenza with antiviral agents. am j epidemiol. 2004 apr 1;159(7):623–33. doi:10.1093/aje/kwh092 pmid:15033640 who strategic action plan for pandemic influenza. geneva: world health organization; 2007 (https://www.who.int/csr/resources/publications/influenza/who_cds_epr_gip_2006_2/en/, accessed 30 november 2018). exercise panstop 2007. manila: who regional office for western pacific; 2007 (https://www.who.int/iris/handle/10665/207980, accessed 28 november 2018). simulation exercises on influenza pandemic responses in the asia-pacific region. geneva: united nations system influenza coordinator; 2008 (http://un-influenza.org/?q=node/30832, accessed 30 november 2018). exercise panstop 2008. manila: who regional office for western pacific; 2008 (http://iris.wpro.who.int/handle/10665.1/14272, accessed 28 november 2018). exercise panstop 2009. manila: who regional office for western pacific; 2009 (http://iris.wpro.who.int/handle/10665.1/6151, accessed 28 november 2018). exercise panstop 2010. manila: who regional office for western pacific; 2010 (http://www.wpro.who.int/emerging_diseases/meetings/docs/2010.12_panstop.2010.mongolia.pdf?ua=1, accessed 28 november 2018). exercise panstop 2011. manila: who regional office for western pacific; 2011 (http://apps.who.int/iris/handle/10665/208556, accessed 28 november 2018). exercise panstop 2013. manila: who regional office for western pacific; 2013 (http://apps.who.int/iris/handle/10665/208524, accessed 28 november 2018). exercise panstop 2014. manila: who regional office for western pacific; 2014 (http://iris.wpro.who.int/handle/10665.1/14271, accessed 28 november 2018). exercise panstop 2015. manila: who regional office for western pacific; 2015 (http://iris.wpro.who.int/handle/10665.1/14270, accessed 28 november 2018). exercise panstop 2017. manila: who regional office for western pacific; 2017. national plans for pandemic preparedness and risk management. geneva: world health organization; 2018 (https://extranet.who.int/sph/influenza-plan, accessed 30 november 2018). retrospective use of whole genome sequencing to better understand an outbreak of salmonella enterica serovar mbandaka in new south wales, australia original research cassia lindsay,a james flint,a kim lilly,a kirsty hope,b qinning wang,c peter howard,c vitali sintchenko,c david n durrheima a hunter new england health, new south wales, australia. b health protection nsw, new south wales, australia. c centre for infectious diseases and microbiology, institute of clinical pathology and medical research, westmead hospital, new south wales, australia. correspondence to james flint (email: james.flint@hnehealth.nsw.gov.au). to cite this article: lindsay c, flint j, lilly k, hope k, wang q, howard p, et al. retrospective use of whole genome sequencing to better understand an outbreak of salmonella enterica serovar mbandaka in new south wales, australia. western pac surveill response j. 2018 april;9(2). doi:10.5365/wpsar.2017.8.4.008 abstract introduction: salmonella enterica serovar mbandaka is an infrequent cause of salmonellosis in new south wales (nsw) with an average of 17 cases reported annually. this study examined the added value of whole genome sequencing (wgs) for investigating a non-point source outbreak of salmonella ser. mbandaka with limited geographical spread. methods: in february 2016, an increase in salmonella ser. mbandaka was noted in new south wales, and an investigation was initiated. a wgs study was conducted three months after the initial investigation, analysing the outbreak salmonella ser. mbandaka isolates along with 17 human and non-human reference strains from 2010 to 2015. results: wgs analysis distinguished the original outbreak cases (n = 29) into two main clusters: cluster a (n = 11) and cluster b (n = 6); there were also 12 sporadic cases. reanalysis of food consumption histories of cases by wgs cluster provided additional specificity when assessing associations. discussion: wgs has been widely acknowledged as a promising high-resolution typing tool for enteric pathogens. this study was one of the first to apply wgs to a geographically limited cluster of salmonellosis in australia. wgs clearly distinguished the outbreak cases into distinct clusters, demonstrating its potential value for use in real time to support non-point source foodborne disease outbreaks of limited geographical spread. introduction salmonella enterica serovar mbandaka is a relatively uncommon salmonella serovar in new south wales (nsw) with an average of 17 cases notified per year over the past 10 years.1 salmonella ser. mbandaka cases reported in australia have been acquired locally and overseas in india, africa, indonesia, mexico and china.2 in australia, salmonella ser. mbandaka has been isolated from foods such as chicken, peanut butter, turkey meat and curry powder.2 whole genome sequencing (wgs) is a high-resolution typing method that can help foodborne disease investigators distinguish outbreak cases from non-outbreak cases.3 wgs has been used for public health surveillance in the united states of america, united kingdom of great britain and northern ireland, and the european union.4-6 in australia, several jurisdictional reference laboratories are developing wgs capacity and evaluating its utility for routine surveillance of enteric pathogens.7 this study examined the potential added value of wgs in assisting investigators identify the source of a community outbreak of salmonella ser. mbandaka with limited geographical spread. methods in february 2016, an increase in salmonella ser. mbandaka notifications was noted in the hunter new england and central coast local health districts of nsw. a confirmed case was defined as any resident or visitor to nsw with laboratory-confirmed salmonella ser. mbandaka infection and symptom onset from 1 january 2016 to 30 april 2016. individuals meeting the case definition were interviewed by phone, beginning 22 february 2016, using a standard salmonella hypothesis-generating questionnaire to collect demographic, clinical and risk factor information, including travel and food consumption histories during the seven days before illness onset. for reference, data from a 2016 victorian food consumption study were used to provide expected food consumption frequencies in a healthy population. this data set contains seven-day food consumption histories of approximately 500 randomly selected healthy individuals in victoria from january to april 2016, the same time period as the salmonella ser. mbandaka outbreak. the victoria data set was used because no equivalent nsw data set exists. food consumption frequencies of outbreak cases were compared to those from the victorian food consumption study using binomial probability. illness onset dates were documented during case interviews or estimated based on specimen collection dates, using the average incubation period from all other cases, for cases lost to follow-up. the wgs study was conducted retrospectively three months after the initial outbreak investigation, analysing the salmonella ser. mbandaka isolates associated with this outbreak and comparing them with 10 human strains from 2010 to 2015 and six non-human isolates from 2012 to 2015 (primarily egg farm swabs from the nsw food authority). wgs was conducted by the nsw enteric reference laboratory, institute of clinical pathology and medical research, nsw health pathology. for wgs, the dna was extracted and purified using a dneasy blood and tissue kit (qiagen, hilden, germany) according to the manufacturer's instructions. dna quantities were estimated using the qubit dsdna hs assay kit and the qubit fluorometer (thermo fisher scientific, waltham, ma, usa) according to the manufacturer's instructions. for each purified dna sample, a 100 bp library was prepared using the nexteraxt kit (illumina, inc., san diego, ca, usa), then pooled and sequenced on the nextseq500 platform (illumina). fastq files were imported into clc genomics workbench v 7.0 (clc bio, aarhus, denmark); reads were trimmed to remove nextera transposase adaptor sequences and then mapped to the reference genome salmonella ser. mbandaka str. atcc 51958 (ncbi genbank accession: cp019183.1). clusters were identified based on sequence similarity between salmonella ser. mbandaka genomes using single nucleotide polymorphism (snp) analysis. the snp phylogenetic tree was generated through the concentrated snp alignments using mega7 sequence analysis software (https://www.megasoftware.net) with a bootstrap value at 100.8 the food consumption histories were reanalysed based on the clusters identified by wgs and compared to the data from the 2016 victorian food consumption study. data were entered and analysed in epiinfo (version 7) and microsoft excel. ethics statement this work was part of an outbreak investigation and did not require ethical review and oversight by a human research ethics committee. results from 1 january 2016 to 30 april 2016, 29 cases of salmonellosis caused by salmonella ser. mbandaka were notified. the epidemic curve of cases investigated as part of this outbreak is shown in fig. 1. illness onset dates ranged from 15 january to 14 april 2016. seven case patients were hospitalized and no patients died. patients were aged from 1 to 89 years with a median age of 48 years, 14 (48%) lived in the hunter new england local health district, 16 (55%) were male and three (10%) were of aboriginal origin. commonly reported symptoms included diarrhoea (n = 21, 95%), lethargy (n = 17, 85%), abdominal pain (n = 14, 64%), fever (n = 13, 62%) and vomiting (n = 12, 55%). symptoms continued for 1-10 days (median five days). fig. 1. confirmed cases (n = 29) of salmonella ser. mbandaka in new south wales by cluster and week of illness onset, 3 january to 30 april 2016 click to download fig. 1. jpg, 220kb the initial (pre-wgs) investigation did not identify any common eating establishments or shopping venues among cases. processed cheese was identified to have a higher-than-expected consumption frequency among cases; it was consumed by 64% of cases when the expected consumption frequencies in a healthy population was 22% (binomial probability [p = 0.0008]). however, on closer analysis, several different brands of processed cheese and places of purchase were indicated, and in the absence of additional cases, no food safety investigation was initiated. other foods with a higher-than-expected consumption frequency included watermelon (63%, p = 0.0341, p = 0.04), onion (69%, p = 0.0574, p = 0.07) and green capsicum (53%, p = 0.0599, p = 0.07). wgs analysis distinguished the original outbreak cases into two main clusters: cluster a, which included 11 cases with an snp distance between 12 and 82, and cluster b, which included six cases with an snp distance between 10 and 25 (fig. 2). in addition to the two key clusters, wgs identified smaller clusters and several sporadic cases. the food consumption frequencies re-analysed by the two key clusters are shown in table 1. the consumption of processed cheese among cases in cluster a increased to 89% (p < 0.0001) and decreased in cluster b to 33%. (p = 0.5254) when compared to all cases (table 1). fig. 2. phylogenetic tree generated from whole-genome snps for outbreak and non-outbreak cases of salmonella ser. mbandaka in nsw click to download fig. 2. jpg, 317kb table 1. food consumption frequencies among all cases and by key clusters identified by wgs click to download table 1. jpg, 558kb discussion internationally, wgs is increasingly being used for enhanced foodborne disease surveillance and response due to its discrimination power for typing cases and tracing infection sources and its similar turnaround times to other laboratory techniques.5,6 wgs is also being used to understand disease transmission pathways and determinates of transmission, monitor pathogen evolution and adaptation, identify infections with epidemic potential and refine control strategies.9 in the united states, wgs is replacing pulsed-field gel electrophoresis for subtyping foodborne pathogens for outbreak surveillance.10 wgs of foodborne pathogens is used for regulatory purposes by the us food and drug administration5 and has proven valuable in outbreak investigations for differentiating sources of contamination.11,12 in european union countries and in the united kingdom, wgs is increasingly being used for foodborne disease outbreak investigations and national surveillance of infectious diseases.4,6 in australia, wgs is acknowledged as a promising typing alternative; however, it is not yet in widespread use due to limitations in standardized quality control and data interpretation, cost and infrastructure.13,14 wgs is being piloted by ozfoodnet, an australian department of health foodborne disease surveillance and response network, and has been successfully applied in multijurisdictional foodborne disease outbreaks and for routine surveillance of listeria monocytogenes.3,15 this salmonella ser. mbandaka study was one of the first in australia to apply wgs to a geographically limited cluster of salmonella. although the wgs was not conducted in real time, its potential to support an outbreak investigation was demonstrated. wgs was able to differentiate the outbreak cases of salmonella ser. mbandaka into distinct clusters and sporadic cases. analysis of food consumption histories based on phylogenetic cluster suggests two concurrent outbreaks of salmonella ser. mbandaka may have occurred in nsw. if wgs had been conducted in real time, affected individuals would have been reinterviewed to collect additional details on food items of interest and further analysis conducted. our findings support an earlier study in nsw that applied wgs retrospectively to five epidemiologically confirmed community outbreaks of salmonella enterica serovar typhimurium and found that wgs significantly increased the resolution of investigations. their study also found that for one of the outbreaks, the food source was contaminated with more than one strain of salmonella ser. typhimurium, highlighting the need to assess both laboratory and epidemiological information during an investigation. data from the victorian food consumption study allowed investigators to estimate expected food consumption frequencies in a healthy population and, using binomial probabilities, compare them to the food consumption frequencies among the outbreak cases. this method allows for rapid hypothesis generation to guide further environmental and epidemiological investigations. the absence of an equivalent nsw food consumption data set was a limitation of this study. it was assumed that food consumption habits and available foods in victoria and nsw were similar enough to permit hypothesis generation. given the potential for differences in food habits or food availability between the two populations, the associations derived need to be interpreted with caution and used for hypothesis generating rather than testing. the rapid development in advanced laboratory tools also presents challenges for public health practitioners. as public health reference laboratories have been adopting wgs, clinical laboratories are increasingly relying on culture-independent multiplexed molecular panels to test stool specimens for enteric pathogens.16 the move away from culturing enteric pathogens will reduce the number of isolates available for typing by wgs or other culture-dependent typing methods. in response, scientists are working to develop metagenomic sequencing-based tools to characterize stool specimens without the need for culture.7,17 as these developments continue to evolve, health practitioners will need to understand how they will impact surveillance systems, outbreak detection and response activities. in conclusion, this study highlighted the potential value of wgs in supporting epidemiologists to investigate a relatively small, non-point source foodborne disease outbreak in a community. if conducted in real time, wgs could have assisted with potential source detection to guide further investigations and to aid control efforts. the continued application of wgs to support foodborne disease outbreak investigations in australia will contribute to a global understanding of its potential to control outbreaks in a more timely and efficient manner. conflicts of interest none. funding none. acknowledgements we would like to thank and acknowledge marion easton (victoria department of health and human services) for sharing data from the victorian food consumption study and craig shadbolt (nsw food authority) for providing historical non-human salmonella ser. mbandaka isolates for wgs. secure analytics for population health research and intelligence (saphari). centre for epidemiology and evidence. north sydney: nsw ministry of health; 2017. bates j. australian salmonella sources by serotype: foodborne disease outbreak toolkit; 2017 (https://sites.google.com/site/outbreaktoolkit/products-services/salmonella-sources, accessed 15 march 2018). phillips a, sotomayor c, wang q, holmes n, furlong c, ward k, et al. whole genome sequencing of salmonella typhimurium illuminates distinct outbreaks caused by an endemic multi-locus variable number tandem repeat analysis type in australia, 2014. bmc microbiol. 2016 sep 15;16(1):211. doi:10.1186/s12866-016-0831-3 pmid:27629541 expert opinion on whole genome sequencing for public health surveillance. stockholm: european centre for disease prevention and control; 2016 (https://ecdc.europa.eu/sites/portal/files/media/en/publications/publications/whole-genome-sequencing-for-public-health-surveillance.pdf, accessed 15 march 2018). examples of how fda has used whole genome sequencing of foodborne pathogens for regulatory purposes. silver spring, md: us food and drug administration, 2017 (https://www.fda.gov/food/foodscienceresearch/wholegenomesequencingprogramwgs/ucm422075.htm, accessed 15 march 2018). ashton pm, nair s, peters tm, bale ja, powell dg, painset a, et al.; salmonella whole genome sequencing implementation group. identification of salmonella for public health surveillance using whole genome sequencing. peerj. 2016 apr 5;4(4):e1752. doi:10.7717/peerj.1752 pmid:27069781 octavia s, wang q, tanaka mm, kaur s, sintchenko v, lan r. delineating community outbreaks of salmonella enterica serovar typhimurium by use of whole-genome sequencing: insights into genomic variability within an outbreak. j clin microbiol. 2015 apr;53(4):1063-71. doi:10.1128/jcm.03235-14 pmid:25609719 kumar s, stecher g, tamura k. mega7: molecular evolutionary genetics analysis version 7.0 for bigger datasets. mol biol evol. 2016 jul;33(7):1870-4. doi:10.1093/molbev/msw054 pmid:27004904 sintchenko v, holmes ec. the role of pathogen genomics in assessing disease transmission. bmj. 2015 may 11;350(may11 1):h1314. doi:10.1136/bmj.h1314 pmid:25964672 carleton ha, gerner-smidt p. whole-genome sequencing is taking over foodborne disease surveillance. microbe. 2016;11(7):311-7. allard mw, luo y, strain e, pettengill j, timme r, wang c, et al. on the evolutionary history, population genetics and diversity among isolates of salmonella enteritidis pfge pattern jegx01.0004. plos one. 2013;8(1):e55254. doi:10.1371/journal.pone.0055254 pmid:23383127 lienau ek, strain e, wang c, zheng j, ottesen ar, keys ce, et al. identification of a salmonellosis outbreak by means of molecular sequencing. n engl j med. 2011 mar 10;364(10):981-2. doi:10.1056/nejmc1100443 pmid:21345093 ensuring national capacity in genomics-guided public health laboratory surveillance. canberra: department of health, 2015 (http://www.health.gov.au/internet/main/publishing.nsf/content/ohp-phln-pubs-genome-sequencing-report.htm, accessed 15 march 2018). kwong jc, mccallum n, sintchenko v, howden bp. whole genome sequencing in clinical and public health microbiology. pathology. 2015 apr;47(3):199-210. doi:10.1097/pat.0000000000000235 pmid:25730631 marder ep, cieslak pr, cronquist ab, dunn j, lathrop s, rabatsky-ehr t, et al. incidence and trends of infections with pathogens transmitted commonly through food and the effect of increasing use of culture-independent diagnostic tests on surveillance foodborne diseases active surveillance network, 10 u.s. sites, 2013-2016. mmwr morb mortal wkly rep. 2017 apr 21;66(15):397-403. doi:10.15585/mmwr.mm6615a1 pmid:28426643 wang q, holmes n, martinez e, howard p, hill-cawthorne g, sintchenko v. it is not all about snps: comparison of mobile genetic elements and deletions in listeria monocytogenes genomes links cases of hospital-acquired listeriosis to the environmental source. j clin microbiol. 2015;53(11):3492-500. doi:10.1128/jcm.00202-15 pmid:26311854 cronquist ab, mody rk, atkinson r, besser j, d'angelo mt, hurd s, et al. impacts of culture-independent diagnostic practices on public health surveillance for bacterial enteric pathogens. clin infect dis. 2012 jun;54(5) suppl 5:s432-9. doi:10.1093/cid/cis267 pmid:22572666 emergency department demand associated with seasonal influenza, 2010 through 2014, new south wales, australia original research david j muscatello,a kendall j beinb and michael m dinhb,c a school of public health and community medicine, university of new south wales, australia. b emergency department, royal prince alfred hospital. c discipline of emergency medicine, the university of sydney. correspondence to (email:david.muscatello@unsw.edu.au). to cite this article: muscatello dj, bien kj, dinh mm. emergency department demand associated with seasonal influenza, 2010 through 2014, new south wales, australia. western pac surveill response j. 2017 september;8(3). doi:10.5365/wpsar.2017.8.2.002. abstract introduction: influenza's impact on health and health care is underestimated by influenza diagnoses recorded in health-care databases. we aimed to estimate total and non-admitted influenza-attributable hospital emergency department (ed) demand in new south wales (nsw), australia. methods: we used generalized additive time series models to estimate the association between weekly counts of laboratory-confirmed influenza infections and weekly rates of total and non-admitted respiratory, infection, cardiovascular and all-cause ed visits in nsw, australia for the period 2010 through 2014. visit categories were based on the coded ed diagnosis or the free-text presenting problem if no diagnosis was recorded. results: the estimated all-age, annual influenza-attributable respiratory, infection, cardiovascular and all-cause visit rates/100 000 population/year were, respectively, 120.6 (99.9% confidence interval [ci] 102.3 to 138.8), 79.7 (99.9% ci: 70.6 to 88.9), 14.0 (99.9% ci: 6.8 to 21.3) and 309.0 (99.9% ci: 208.0 to 410.1). among respiratory visits, influenza-attributable rates were highest among < 5-year-olds and ≥ 85-year-olds. for infection and all-cause visits, rates were highest among children; cardiovascular rates did not vary significantly by age. annual rates varied substantially by year and age group, and statistically significant associations were absent in several years or age groups. of the respiratory visits, 73.4% did not require admission. the non-admitted proportion was higher for the other clinical categories. around 1 in 100 total visits and more than 1 in 10 respiratory or infection visits were associated with influenza. discussion: influenza is associated with a substantial and annually varying burden of hospital-attended illness in nsw. introduction influenza remains a public health challenge.1 it is associated with annual, varying, excess deaths in populations internationally.2,3 influenza is a vaccine-preventable disease,1 and the extent of its contribution to morbidity and mortality is poorly recognized. estimating the burden of influenza in various settings is thus a priority for the world health organization (who).4 there are few studies estimating the impact of influenza on lower severity health outcomes including hospital emergency department (ed) visits.5-8 there is increasing recognition that the impact of influenza extends beyond respiratory illness to circulatory and other diseases.2,9 influenza-related illness is poorly recorded in hospital and death databases, and counting only laboratory-confirmed influenza infections will markedly underestimate influenza's population impact. diagnoses commonly assigned to patients with an influenza infection in hospital eds in australia include fever, an unspecified infection or a non-respiratory illness.10 during influenza season, febrile convulsions in infants increase.11 thus, statistical time-series analysis is used to estimate population levels of illness and death attributable to influenza.2,10,12 we used time-series analysis to estimate the rate, number and proportion of ed visits attributable to influenza in the state of new south wales (nsw), australia by age and year for the period 2010 to 2014. since a proportion of visits lead to admission and can be included in hospitalization estimates, we also prepared estimates for non-admitted visits. methods study design and setting this was a retrospective, ecological time-series analysis of ed visits recorded in a state-wide administrative information system database for nsw over the five calendar years of 2010 to 2014. nsw is the most populous state in australia with a diverse urban and rural population of 7.5 million over 800 000 km2.13,14 data sources the available study data included all visits recorded in the nsw emergency department data collection database during the study period.15 the database contains routinely collected administrative and clinical data for patient-level visits across most public hospitals in nsw. exclusion criteria were: hospitals not submitting data for the entire study period, prearranged (planned) visits that are usually for follow-up from a previous attendance, patients dead on arrival and transfers from other facilities.15 population denominators were obtained from the australian bureau of statistics.14 prior to analysis, we assigned a single, mutually exclusive clinical category to each visit in the ed database. the category was assigned using the recorded primary ed diagnosis code, and if necessary, the presenting problem, as defined in a previous publication, which also includes examples of diagnoses in each category.15 for each ed visit, a physician selects a diagnosis name from a list used by the hospital's electronic patient medical record information system. the information system then assigns a diagnosis code depending on the diagnostic classification standard used by the hospital. classification standards vary among the information systems and can be: the international classification of diseases versions 9 or 10 (icd-9, icd-10) or the systematized nomenclature of medicine clinical terminology (snomed-ct). to estimate the contribution of influenza to population-level health outcomes, a time series representing the relative weekly change in incidence of influenza infections in the population is needed as an independent variable in the regression analysis. since all influenza infections diagnosed in microbiology laboratories in australia are notifiable to regional and state health authorities, we used influenza notifications from nsw to prepare the time series. non-identified, state-level notification data are available from the national health authority.16 outcomes we modelled outcome time series as population rates for each of respiratory, infection, cardiovascular and all-cause (total) visits. the association between influenza infection and adverse cardiovascular outcomes is becoming well known and is often included in influenza-attributable mortality studies.9 all-cause visits cast the widest net to estimate total influenza-attributable outcomes in time-series approaches to influenza burden estimation.2 time series of the total and non-admitted ed outcome rates were prepared for persons of all ages as well as age groups broadly consistent with who guidelines for influenza burden estimation: 0–4, 5–14, 15–49, 50–64, 65–84 and ≥ 85 years.4 analysis we used semi-parametric generalized additive modelling to regress the ed outcome against the influenza time series. for each clinical category, age and admission status group, the weekly rates of ed visits provided the dependent (outcome) variable for a time-series model. each time series included 260 observations covering whole weeks occurring during the study period. weekly influenza notification counts were split into separate variables for each year as there is an evident increase in influenza testing and thus notifications over time.2,17 each annual influenza time series was set to zero in all years except the year to which it referred. much of the variation in the observed time series of ed visits is not due to influenza and much of that variation may be due to seasonal and other nonlinear factors. therefore, a natural cubic smoothing spline of time (represented by consecutive week number) was included in the model as a non-parametric independent variable.12 for a given clinical category, age group and admission status group, the model equation was: in which "christmas", "new year", "school holiday", "easter" and "january week 2" were holiday indicator variables (value 0 or 1) for periods of low ed demand, identified using a box whisker plot of the distribution of week of the year counts of all-cause visits. the influenzayear variable was the respective annual weekly time series of seasonal influenza notifications. the β values were the model parameter estimates for the respective parametric independent variables, with β0 the model intercept. we specified 31 degrees of freedom for the flexibility of the smoothing spline based on previous research.12 the estimated weekly component of visits associated with the influenza variable was obtained by multiplying the influenza parameter estimate (β5,year) by the observed rate of the influenza variable (influenzayear) in each week. annual total counts were converted to rates using mid-year population estimates. estimated influenza-attributable counts and total counts, respectively, were used as the numerator and denominator for influenza-attributable proportions in each outcome category and age group. since estimates were made for numerous year, age group and visit category combinations, 99.9% confidence intervals (α = 0.001) were calculated to reduce chance statistical significance. we used the formula: parameter estimate ± 3.290 x standard error of the parameter estimate where 3.290 is the 99.9% critical value (z-value) from a standard normal distribution. standard errors for confidence intervals of five-year averages were the square root of the sum of the squared standard errors of the annual values divided by five (the number of years averaged). non-statistically significant annual values were included in averages as zero with zero standard error. sas version 9.4 (sas, cary, nc, usa) was used for analysis using procedures and options described elsewhere.12 normally distributed model residuals was assumed and this was checked using quantile-quantile (qq) plots of the residuals. lack of serial independence (autocorrelation) over time in the model residuals was checked using autocorrelation plots. sensitivity analysis as a sensitivity analysis to assess whether influenza incidence was associated with visit categories that would implausibly be caused by influenza, injury visit rates were also regressed on the influenza notification time series. ethics the study was approved by the nsw population and health services research ethics committee. information that could identify patients was not included in the study data. results characteristics of the study data used there were 11.8 million ed visits recorded between january 2010 and december 2014 of which 10.8 million visits to 115 hospitals met the inclusion criteria. of these, 7.82 million (72.8%) were not admitted. among the clinical categories included in the study, injury comprised the largest group (mean = 117 visits/100 000 population/week) followed by respiratory (49.0 visits/100 000 population/week), cardiovascular (44.2 visits/100 000 population/week) and infection (22.9 visits/100 000 population/week). among non-admitted visits, a similar pattern was observed. increased influenza testing over time was evident; of the 44 308 influenza notifications during the study period, almost one half (20 744, 46.8%) occurred in 2014. model fitting except for cardiovascular disease visits in the older population, at least one statistically significant holiday effect was identified in each clinical category and age group. apart from some departures from normality for extreme observations and some residual autocorrelation, the qq plots showed the modelling provided a good fit to the observed data. main results exceedances in visit rates associated with circulating influenza are evident in each clinical category, particularly respiratory and infection. the exceedances are most distinct in years 2012, 2013 and 2014 (fig. 1). fig. 1: observed weekly counts of influenza notifications, estimated influenza-attributable and non-influenza-attributable (background) ed visit rates/100 000 population/week for all-cause, cardiovascular, infection and respiratory clinical categories and observed visit rates/100 000 population/week in each clinical category, for persons of all ages, nsw, 2010 through 2014 (n = 260 weeks) click to download figure 1. jpg, 191kb for respiratory visits, exceedances were greatest in 2012 in < 5-year-olds (939.0 visits [99.9% confidence interval (ci) 559.4 to 1318.7]/100 000 population/year) and ≥ 85-year-olds (987.7 [99.9% ci: 793.4 to 1181.9]/100 000 population/year) (fig. s1, table s1, supplementary file 1). for infection visits, exceedances were most prominent in < 5-year-olds in 2012 (821.6 visits [99.9% ci: 657.8 to 985.4]/100 000 population/year) (fig. s2, table s1). exceedances among cardiovascular visits were more difficult to distinguish and were most evident in ≥ 85-year-olds in 2011 (433.0 [99.9% ci: 179.8 to 686.3]/100 000 population/year) (fig. s3, table s1). among all-cause visits, 2012 again stood out in < 5-year-olds (2368.0 [99.9% ci: 1544.1 to 3191.8]/100 000 population/year) and ≥ 85-year-olds (1778.4 [99.9% ci: 1060.0 to 2496.9]/100 000 population/year) (fig. s1, table s1). supplementary file 1: additional tables and figures click to download supp. file 1. pdf, 1253kb when averaged from 2010 through 2014, there was a u-shaped relationship between age and estimated respiratory visit rates with < 5-year-olds and ≥ 65-year-olds higher than 15–64-year-olds based on confidence intervals. compared with other age groups, estimated infection visit rates were highest in < 5-year-olds, followed by 5–14-year-olds, and these differences were statistically significant. the estimated infection visit rate in < 5-year-olds was significantly higher than the estimated respiratory rate in the same age group. for cardiovascular visits, significant rates were present only in the 5–14, 15–49 and 65–84 age groups, and these were not significantly different across those age groups. estimated all-cause rates were highest in < 5-year-olds and declined with age until the 50–64 year age group and then increased again with the rate in ≥ 85-year-olds about half that of < 5-year-olds (table 1). among persons of all ages, the average annual estimated influenza-attributable rate for respiratory visits was 120.6 [99.9% ci: 102.3 to 138.8]/100 000 population/year (8887 [99.9% ci: 7548 to 10 227] visits/year). for infection visits, the rate was 79.7 [99.9% ci: 70.6 to 88.9]/100 000 population/year (5856 [99.9% ci: 5192 to 6519] visits/year). for cardiovascular visits, the average was 14.0 [99.9% ci: 6.8 to 2.3]/100 000 population/year (1033 [99.9% ci: 499 to 1567] visits/year). for all-cause visits, the all-age average annual estimated rate was 309.0 [99.9% ci: 208.0 to 410.1]/100 000 population/year (22 619 [99.9% ci: 15 268 to 29 969] visits/year) (table 1). in < 50-year-olds, differences between the estimated rates in total and non-admitted visits are not significantly different. in older age groups, the rates of estimated non-admitted visits were substantially and significantly lower than those of total visits, particularly for the respiratory and infection categories. for persons of all ages, estimates for non-admitted visits were broadly similar to those of total visits. averaged across all years, these patterns were also broadly reflected. these results indicate that older persons with influenza-related illness are more likely to be admitted (tables s2 and s4, supplementary file 1). compared with total visits (table 1), a similar pattern of statistically significant associations was evident among non-admitted visits. the average annual estimated all-age rate of influenza-attributable, non-admitted respiratory visits was 88.5 (99.9% ci: 74.7 to 102.3)/100 000 population/year or 73.4% of total influenza-attributable respiratory visits/year). for non-admitted infection visits, the rate was 69.8 (99.9% ci: 61.9 to 77.7)/100 000 population/year (87.4%). for non-admitted cardiovascular visits, the rate was 12.2 (99.9% ci: 7.9 to 16.5)/100 000 population/year (87.1%). the rate of excess average annual all-cause non-admitted visits was 287.1 (99.9% ci: 196.2 to 378.0)/100 000 population/year; 92.8%) (table 2). an annual average of 4.7% of total respiratory visits and 5.6% of non-admitted respiratory visits was estimated to be attributable to influenza. among infection visits, the average annual proportion was 6.7% (non-admitted: 8.4%). among cardiovascular and all-cause visits, the average annual proportions were 0.6% (non-admitted: 1.1%) and 1.1% (non-admitted: 1.3%), respectively. the highest proportion by age was 12.4% (non-admitted: 13.6%) of infection visits in 5–14-year-olds (table s5, supplementary file 1). table 1: average annual estimated rate/100 000 population and number of influenza-attributable ed visits, by clinical category and age, nsw, 2010 through 2014 click to download table 1. jpg, 626kb table 2: average annual estimated rate/100 000 population and number of influenza-attributable non-admitted ed visits, by clinical category and age, nsw, 2010 through 2014 click to download table 2. jpg, 654kb sensitivity analysis when injury visit rates were regressed on influenza incidence, a positive statistically significant association was identified for one age group in one year (5–14 year-olds in 2013; 208.5 (99.9% ci: 44.9 to 372.2)/100 000 population/year). statistically significant negative results were identified for six of seven age groups in 2012 and three of seven age groups in 2014 (table s6, supplementary file 1). the overall proportion of estimated influenza-attributable injury visits was −0.6%. discussion we estimated that influenza was associated with approximately 1 in every 100 ed visits and more than 1 in 10 respiratory or infection visits, on average, concentrated across mid-winter to early spring. over 300 all-cause visits/100 000 population/year were associated with influenza. of these, 121 and 80/100 000 population/year were respiratory and infection visits, respectively. influenza possibly explained 14 cardiovascular visits/100 000 population/year, although age groups and years with significant associations did not appear comparable with those for respiratory and infection visits. depending on the type of visit, the burden appears to be borne to the greatest degree by the youngest and oldest age groups. over 1000 all-cause visits/100 000 population/year in children aged under 5 years were associated with influenza and over 400/100 000 population/year in ≥ 85 year-olds. approximately three quarters of influenza-attributable respiratory visits did not require admission, compared with 87% for infection visits and 93% of all-cause visits. young children were less likely than older adults to be admitted to hospital. our post-pandemic, influenza-attributable, annual respiratory visit rate estimate of 121/100 000 population/year for the period 2010–2014 in nsw was substantially lower than estimates from ontario, canada and new york, ny, usa at different time periods.5,8 varying influenza activity and virulence over time, immunization coverage and effectiveness, availability and cost of health services or different modelling approaches could explain the difference. the post-pandemic year in our study, namely 2010, did have unusually low influenza activity, and our modelling approach may provide more conservative estimates than the modelling method used in the other studies.12 interpreting variation in influenza-attributable burden from year to year requires an understanding of the influenza strains that circulated and the effectiveness of influenza vaccines. in australia, influenza vaccination is free to certain risk groups, the largest group being the older population, with coverage around 70% in ≥ 65-year-olds during the study period.18 coverage in younger persons is substantially lower: around 33% in 50–64-year-olds and below 20% in younger age groups.19 the 2009 influenza a(h1n1)pdm09 pandemic strain dominated in australia in 2010, although levels of circulation were low (table s7, supplementary file 1). this is consistent with the low levels of influenza-attributable ed demand, although there was substantial demand in the younger age groups, particularly in the infection clinical category. influenza a(h3n2) reappeared in 2011 and co-circulated with the pandemic strain, but overall levels remained relatively low (table s7). the vaccine in those years showed good effectiveness of at least 70% against the pandemic strain.20,21 the older age group experienced relatively low susceptibility to the pandemic strain due to pre-existing immunity.2,12,19,22,23 these combined factors would explain the relatively low overall levels of influenza-attributable visits in 2010–2011. the 2012 season showed the highest relative influenza circulation of the study period with a(h3n2) dominating and influenza b accounting for the remainder (table s7). this season had the highest estimated incidence of respiratory or infection ed visits of all years studied in persons of all ages and in < 5-year-olds. the rates in ≥ 65-year-olds were also highest in 2012 for respiratory, infection and all-cause visits. vaccine effectiveness in australia against the circulating h3n2 strain in that season was low at 30% in 2012, which may be due to antigenic drift in the h3n2 virus. effectiveness against influenza b was moderate (56%).24 there was relatively low overall influenza circulation in 2013. influenza a(h3n2) continued to dominate (table s7). substantial estimated influenza-attributable visits were evident in younger age groups broadly comparable to surrounding years. vaccine effectiveness against a(h3n2) in 2013 was good at 67%,24 which may explain the relatively lower levels of influenza-attributable visit rates in older age groups compared with the surrounding years. in 2014, the pandemic strain dominated but a(h3n2) co-circulated. this year had the second highest total apparent influenza circulation of the years studied (table s7). in that year, the vaccine effectiveness was moderate (55%) against pandemic a(h1n1) but low (26%) against a(h3n2),24 possibly explaining substantial influenza-attributable rates in the older population. the study had limitations. in nsw, the ed diagnosis is recorded as part of the routine workflow of physicians and not by health information managers trained in health care classification. changes in information systems over time may have led to inconsistencies in the recording of diagnoses and other information. diagnosis classifications varied across hospitals.15 we did not have information on other viruses, such as respiratory syncytial virus, which may have caused some residual confounding. biases can arise in the influenza notifications we used because the decision to test for influenza is at the discretion of the health-care provider and notifications arise from any type of medical service. on the other hand, notifications provide a combination of wide geographic coverage and are very specific to influenza. of the 186 eds in nsw, 19% did not report to the emergency department data collection database during the study period and another 3% were excluded. therefore, our results will be an underestimate of state-wide figures. non-participating and excluded hospitals were smaller regional hospitals in more remote areas.15 nevertheless, the data set we analysed included approximately 87% of public hospital visits in the state.25 ed services in nsw are almost wholly public.26,27 the statistically significant associations with injury are challenging to explain. the positive association may have been a chance finding even though we set a restrictive level of statistical significance. unmeasured confounding could have occurred due, for example, to weather or other factors that vary on a similar time scale to influenza seasons. confinement at home due to influenza may lead to fewer opportunities for injury, although this needs further study. using all-age rather than age-specific influenza notifications in the model might explain negative influenza-attributable estimates, which are, in reality, impossible. using age-specific notifications in the model may improve estimates, but this requires further research. in summary, seasonal influenza is associated with a substantial but annually varying burden of hospital-attended illness on eds in nsw and thus on the overall population. the greatest demand occurs among young children and in the oldest population in some years. varying vaccine effectiveness may have explained varying impact in the relatively well immunised older population. improved vaccines and vaccination strategies that protect young children as well as older adults are needed to reduce morbidity in the population. influenza surveillance information may be useful in forecasting and managing peaks in ed demand and to facilitate improved workload, staff and bed management. improved control of influenza may substantially reduce surges in ed demand caused by influenza. conflicts of interest all authors report no conflicts of interest relevant to this article. funding we acknowledge the nsw ministry of health and the centre for health record linkage for access to, and linkage of, data. acknowledgements we would like to acknowledge the information technology group at the who regional office for the western pacific and who headquarters, in particular, randy gongora, joven larin, and linette te for their ongoing support for this work. additionally, we would like to thank dr takuya yamagishi and other members of the who regional office for the western pacific emerging disease surveillance and response unit for their valuable input. special thanks are due to the national data contributors in the region for their ongoing contributions and support. references nicholson kg, wood jm, zambon m. influenza. lancet. 2003 nov 22;362(9397):1733–45. pmid:14643124 doi:10.1016/s0140-6736(03)14854-4 simonsen l, spreeuwenberg p, lustig r, taylor rj, fleming dm, kroneman m, et al.; glamor collaborating teams. global mortality estimates for the 2009 influenza pandemic from the glamor project: a modeling study. plos med. 2013 nov;10(11):e1001558. pmid:24302890 doi:10.1371/journal.pmed.1001558 cheng p-y, palekar r, azziz-baumgartner e, iuliano d, alencar ap, bresee j, et al. burden of influenza-associated deaths in the americas, 2002-2008. influenza other respi viruses. 2015 aug;9 suppl 1:13–21. pmid:26256291 doi:10.1111/irv.12317 a manual for estimating disease burden associated with seasonal influenza. geneva: world health organization; 2016 (http://www.who.int/influenza/resources/publications/manual_burden_of_disease/en/, accessed 15 april 2017). schanzer dl, schwartz b. impact of seasonal and pandemic influenza on emergency department visits, 2003-2010, ontario, canada. acad emerg med. 2013 apr;20(4):388–97. pmid:23701347 doi:10.1111/acem.12111 self wh, griffin mr, zhu y, dupont wd, barrett tw, grijalva cg. the high burden of pneumonia on us emergency departments during the 2009 influenza pandemic. j infect. 2014 feb;68(2):156–64. pmid:24140066 doi:10.1016/j.jinf.2013.10.005 guo rn, zheng hz, ou cq, huang lq, zhou y, zhang x, et al. impact of influenza on outpatient visits, hospitalizations, and deaths by using a time series poisson generalized additive model. plos one. 2016 02 19;11(2):e0149468. pmid:26894876 doi:10.1371/journal.pone.0149468 olson dr, heffernan rt, paladini m, konty k, weiss d, mostashari f. monitoring the impact of influenza by age: emergency department fever and respiratory complaint surveillance in new york city. plos med. 2007 aug;4(8):e247. pmid:17683196 doi:10.1371/journal.pmed.0040247 macintyre cr, mahimbo a, moa am, barnes m. influenza vaccine as a coronary intervention for prevention of myocardial infarction. heart. 2016 dec 15;102(24):1953–6. pmid:27686519 doi:10.1136/heartjnl-2016-309983 muscatello dj, amin j, macintyre cr, newall at, rawlinson wd, sintchenko v, et al. inaccurate ascertainment of morbidity and mortality due to influenza in administrative databases: a population-based record linkage study. plos one. 2014 05 29;9(5):e98446. pmid:24875306 doi:10.1371/journal.pone.0098446 polkinghorne bg, muscatello dj, macintyre cr, lawrence gl, middleton pm, torvaldsen s. relationship between the population incidence of febrile convulsions in young children in sydney, australia and seasonal epidemics of influenza and respiratory syncytial virus, 2003-2010: a time series analysis. bmc infect dis. 2011 10 26;11(1):291. pmid:22029484 doi:10.1186/1471-2334-11-291 muscatello dj, newall at, dwyer de, macintyre cr. mortality attributable to seasonal and pandemic influenza, australia, 2003 to 2009, using a novel time series smoothing approach. plos one. 2013 06 03;8(6):e64734. pmid:23755139 doi:10.1371/journal.pone.0064734 area of australia states and territories. canberra: geoscience australia; 2017 (http://www.ga.gov.au/scientific-topics/national-location-information/dimensions/area-of-australia-states-and-territories, accessed 25 august 2017). 3101.0 australian demographic statistics, mar 2016. canberra: australian bureau of statistics; 2016 (http://www.abs.gov.au/ausstats/abs@.nsf/mf/3101.0, accessed 3 november 2016). dinh mm, berendsen russell s, bein kj, chalkley d, muscatello d, paoloni r, et al. understanding drivers of demand for emergency service trends in years 2010-2014 in new south wales: an initial overview of the destiny project. emerg med australas. 2016 apr;28(2):179–86. pmid:26840615 doi:10.1111/1742-6723.12542 influenza (laboratory confirmed) public dataset. canberra: australian department of health; 2017 (http://www9.health.gov.au/cda/source/pub_influ.cfm, accessed 24 august 2017). kelly ha, grant ka, tay el, franklin l, hurt ac. the significance of increased influenza notifications during spring and summer of 2010-11 in australia. influenza other respi viruses. 2013 nov;7(6):1136–41. pmid:23176174 doi:10.1111/irv.12057 healthstats nsw influenza and pneumococcal immunisation. north sydney: new south wales health; 2016 (http://www.healthstats.nsw.gov.au/, accessed 15 april 2017). muscatello dj, barr m, thackway sv, macintyre cr. epidemiology of influenza-like illness during pandemic (h1n1) 2009, new south wales, australia. emerg infect dis. 2011 jul;17(7):1240–7. pmid:21762578 doi:10.3201/eid1707.101173 kelly ha, sullivan sg, grant ka, fielding je. moderate influenza vaccine effectiveness with variable effectiveness by match between circulating and vaccine strains in australian adults aged 20-64 years, 2007-2011. influenza other respi viruses. 2013 sep;7(5):729–37. pmid:23078073 doi:10.1111/irv.12018 levy a, sullivan sg, tempone ss, wong klm, regan ak, dowse gk, et al. influenza vaccine effectiveness estimates for western australia during a period of vaccine and virus strain stability, 2010 to 2012. vaccine. 2014 oct 29;32(47):6312–8. pmid:25223268 doi:10.1016/j.vaccine.2014.08.066 hancock k, veguilla v, lu x, zhong w, butler en, sun h, et al. cross-reactive antibody responses to the 2009 pandemic h1n1 influenza virus. n engl j med. 2009 nov 12;361(20):1945–52. pmid:19745214 doi:10.1056/nejmoa0906453 muscatello dj, cretikos ma, macintyre cr. all-cause mortality during first wave of pandemic (h1n1) 2009, new south wales, australia, 2009. emerg infect dis. 2010 sep;16(9):1396–402. pmid:20735923 doi:10.3201/eid1609.091723 sullivan sg, carville ks, chilver m, fielding je, grant ka, kelly h, et al. pooled influenza vaccine effectiveness estimates for australia, 2012-2014. epidemiol infect. 2016 aug;144(11):2317–28. pmid:27125368 doi:10.1017/s0950268816000819 annual report annual report 2014–15 nsw health. north sydney: new south wales health; 2016 (http://www.health.nsw.gov.au/annualreport/pages/annualreport15.aspx, accessed 15 april 2017). 4390.0 private hospitals, australia, 2014–15. canberra: australian bureau of statistics; 2016 (http://www.abs.gov.au, accessed 15 april 2017). emergency department care 2014–15: australian hospital statistics. canberra: australian institute of health and welfare; 2016 (http://www.aihw.gov.au/publication-detail/?id=60129553619, 3 november 2016). identification of enterovirus c105 for the first time in new zealand case report angela todd,a susan taylorb and q sue huanga a institute of environmental science and research limited, national centre for biosecurity and infectious disease, wallaceville, upper hutt, new zealand. b middlemore hospital, otahuhu, auckland, new zealand. correspondence to angela todd (e-mail: angela.todd@esr.cri.nz). to cite this article: todd a et al. identification of enterovirus c105 for the first time in new zealand. western pacific surveillance and response journal, 2015, 6(1):60–61. doi:10.5365/wpsar.2014.5.4.003 abstract we report on the first identification of enterovirus c105 (ev-c105) in new zealand from a 52-year-old male hospitalized with mild respiratory tract symptoms. enterovirus genotyping was performed by partial sequencing of the vp1 region of the enterovirus genome. this highlights the importance of enterovirus surveillance for detection of the importation of new genotypes such as ev-c105, thus allowing a better understanding of the roles they play in disease. introduction the new zealand national poliovirus and enterovirus identification reference laboratory at the institute of environmental science and research (esr) limited, national centre for biosecurity and infectious disease routinely receives untyped enterovirus clinical specimens or cell culture isolates from four major hospitals (based in auckland, waikato, wellington and christchurch) as part of the new zealand enterovirus surveillance network. this surveillance network started in the 1980s and on average receives 150 specimens per year. the aims of this network are (1) to identify the circulation patterns of enterovirus genotypes and predominant strains; (2) to describe clinical diseases associated with circulating genotypes; (3) to detect enterovirus outbreaks to assist with public health intervention; and finally (4) to supplement the national poliovirus surveillance programme. the four laboratories in conjunction with esr service the entire population of new zealand. enterovirus surveillance operates year-round and is based on reports from routine diagnostic services for patients. each week, all enterovirus identification results are reported to esr and then collated and published nationally.1 in addition, untyped enteroviruses are referred to esr for further identification. enterovirus c105 (ev-c105) is a member of the human enterovirus group c species and was first identified in the democratic republic of congo in late 2010 in a faecal sample collected from a fatal acute flaccid paralysis patient during a poliomyelitis outbreak.2 due to a lack of sequence data this virus was initially identified as enterovirus 109 (ev-109).3 in 2012, the virus was assigned as ev-c105 because subsequent sequencing showed that it had only 74.7% nucleotide and 82.5% amino acid identity to ev-109, thus satisfying the criteria for assignment of a new enterovirus serotype.4 since then, ev-c105 has also been identified in a patient in peru and in another patient in cyprus, both with respiratory disease.5,6 this suggests a global distribution although the overall incidence appears to be very low. a greater awareness of ev-c105 may help to detect this virus with increased frequency and to find out more about the pathogenic role and disease association of this particular genotype. here we report on the identification of ev-c105 for the first time in new zealand from a patient with mild lower respiratory tract symptoms during an admission to a hospital in auckland through the national enterovirus surveillance system. case report a 52-year-old maori male was admitted to a hospital in auckland, new zealand in october 2013. unrelated to the reason for presenting to the hospital, cough and wheeze were noted on the second day of his admission and a nasopharyngeal swab for respiratory virus testing was collected. the patient remained afebrile. the nasopharyngeal swab tested negative for influenza, adenovirus, respiratory syncytial virus, human metapneumovirus, parainfluenza viruses 1–3 and rhinovirus.7 enteroviral rna was detected using real-time reverse transcription polymerase chain reaction.6 a partial vp1 sequence was then obtained by amplification and sequencing of a 375bp region.9 the sequence was compared to known vp1 sequences in genbank using tblastx (which searches a translated nucleotide database using a translated nucleotide query).10 it showed 99% amino acid identity to ev-c105 with sequence coverage of 100% (genbank accession number: afg25720), an ev-c105 strain that was identified in cyprus in 2012. the next closest genotype was ev-109 with 89% amino acid identity (genbank accession number: adk22861), another group c enterovirus. discussion we have reported the identification of ev-c105 for the first time in the asia-pacific region from a 52-year-old male with mild lower respiratory tract symptoms. ev-c105 has been identified only rarely in various countries including the democratic republic of congo, peru and cyprus. prior to detecting the ev-c105 case in new zealand, ev-c105 has been previously identified in a faecal sample from an acute flaccid paralysis patient and respiratory samples taken from paediatric patients. the identification of newly-identified enteroviruses such as ev-c105 illustrates the importance of ongoing enterovirus surveillance in allowing the identification of emerging and re-emerging enterovirus genotypes and has the potential to inform public health interventions. increased awareness of ev-c105 may allow for improved detection of the virus; however, further analysis is required to determine the pathogenic role, disease association, mode of transmission, global occurrence and public health implications of this rare enterovirus. conflicts of interest none declared. funding the national poliovirus/enterovirus surveillance is funded by the new zealand ministry of health, which kindly permitted the use of relevant data for publication. acknowledgements we wish to acknowledge w allan nix, research microbiologist in the picornavirus laboratory at the centers for disease control and prevention, for his assistance with the enteroviral typing analysis and review of this paper. references: public health surveillance [internet]. information for new zealand public health action. available from: https://surv.esr.cri.nz/virology/virology_weekly_report.php [accessed 20 november 2014]. grard g et al. type 1 wild poliovirus and putative enterovirus 109 in an outbreak of acute flaccid paralysis in congo, october–november 2010. eurosurveillance: european communicable disease bulletin, 2010, 15(47):pii:19723. pmid:21144443 lukashev an et al. novel serotypes 105 and 116 are members of distinct subgroups of human enterovirus c. the journal of general virology, 2012, 93:2357–2362. doi:10.1099/vir.0.043216-0 pmid:22894922 oberste ms et al. molecular evolution of the human enteroviruses: correlation of serotype with vp1 sequence and application to picornavirus classification. journal of virology, 1999, 73:1941–1948. pmid:9971773 richter j et al. newly emerging c group enteroviruses may elude diagnosis due to a divergent 5′-utr. international journal of infectious diseases, 2013, 17:e1245–1248. doi:10.1016/j.ijid.2013.07.010 pmid:24080070 tokarz r et al. genomic analysis of two novel human enterovirus c genotypes found in respiratory samples from peru. the journal of general virology, 2013, 94:120–127. doi:10.1099/vir.0.046250-0 pmid:23034595 centers for disease control and prevention (cdc). cdc real-time rt-pcr assays for non-influenza respiratory viruses. atlanta, centers for disease control and prevention, 2010. oberste ms et al. comparative evaluation of taqman real-time pcr and semi-nested vp1 pcr for detection of enteroviruses in clinical specimens. journal of clinical virology, 2010, 49:73–74. doi:10.1016/j.jcv.2010.06.022 pmid:20667767 nix wa, oberste ms, pallansch ma. sensitive, seminested pcr amplification of vp1 sequences for direct identification of all enterovirus serotypes from original clinical specimens. journal of clinical microbiology, 2006, 44:2698–2704. doi:10.1128/jcm.00542-06 pmid:16891480 altschul sf et al. basic local alignment search tool. journal of molecular biology, 1990, 215:403–410. doi:10.1016/s0022-2836(05)80360-2 pmid:2231712 tuberculosis among children, adolescents and young adults in the philippines: a surveillance report surveillance report snow k,a,b yadav r,c denholm j,d,e sawyer sf,g,h and graham sa,i a centre for international child health, university of melbourne, department of paediatrics and murdoch children’s research institute, royal children’s hospital, melbourne, australia. b school of population and global health, university of melbourne, melbourne, australia. c who country office for the philippines, manila, philippines. d victorian tuberculosis program, melbourne health, melbourne, australia. e department of microbiology and immunology, university of melbourne, melbourne, australia. f centre for adolescent health, royal children’s hospital, melbourne, australia. g murdoch children’s research institute, melbourne, australia. h department of paediatrics, the university of melbourne, melbourne, australia. i international union against tuberculosis and lung disease, paris, france. correspondence to kathryn snow (email:kathryn.snow@unimelb.edu.au). to cite this article: snow k, yadav r, denholm j, sawyer s, graham s. tuberculosis among children, adolescents and young adults in the philippines: a surveillance report. western pac surveill response j. 2018 nov;9(2). doi:10.5365/wpsar.2017.8.4.011 abstract the philippines, a country with a young population, is currently experiencing an intense and persistent tuberculosis epidemic. we analysed patient-based national surveillance data to investigate the epidemiology of reported tuberculosis among children (aged 0–9 years), adolescents (aged 10–19 years) and young adults (aged 20–24 years) to better understand the burden of disease and treatment outcomes in these age groups. descriptive analyses were performed to assess age-related patterns in notifications and treatment outcomes. data quality was assessed against international benchmarks at the national and regional levels. overall, 27.3% of tuberculosis notifications for the philippines in 2015 pertained to children, adolescents and young adults aged 0–24 years. treatment outcomes were generally favourable, with 81% of patients being cured or completing treatment. the data quality assessment revealed substantial regional variation in some indicators and suggested potential under-detection of tuberculosis in children aged 0–4 years. children, adolescents and young adults in the philippines constitute a substantial proportion of patients in the national tuberculosis surveillance dataset. long-term progress against tuberculosis in the philippines relies on improving the control of tuberculosis in these key age groups. introduction the world health organization (who) estimates that 1.8 million people living in the western pacific region developed active tuberculosis (tb) in 2016, and of these, 573 000 (32%) lived in the philippines.1 the philippines has one of the highest tb incidence rates in the region, estimated at 554 cases per 100 000 in 2016, a rate that has not declined significantly since 2007.1 half (52%) of the population of the philippines is under 25 years of age, compared to a regional average of 43%.2 age influences tb risk in a variety of biological and social ways, and tb epidemiology changes with population age structure as nations undergo demographic shifts.3 children under 5 years of age are at high risk of developing clinical tb after infection and are prone to developing severe forms of tb such as tb meningitis and disseminated tb, particularly if not protected by bacillus calmette-guérin (bcg) vaccination.4 in contrast, adolescents and young adults (“young people”, aged 10–24 years) more often develop infectious pulmonary tb.4 young people who attend educational institutions or reside in institutional settings may have multiple extended respiratory contacts per day.5 furthermore, recent research suggests that young people may be at increased risk of discontinuing tb treatment before completion (previously referred to as “defaulting”).6 the first step in improved tb control is to understand the epidemiology of the disease to inform and implement evidence-based interventions for at-risk groups. the aim of this study was to describe the age-related epidemiology and outcomes of reported tb in the philippines using patient-based national tb surveillance data with a focus on individuals aged 0–24 years. the second aim was to evaluate surveillance data quality against international benchmarks for childhood tb. methods this analysis used data from the national tb surveillance system of the philippines, the integrated tuberculosis information system (itis).7 this is a case-based electronic surveillance system with data entry performed at the health-facility level. we calculated crude notification rates nationally and for each of the philippines’ 17 regions for the 2015 calendar year. we also calculated ageand sex-specific rates using population estimates from the 2015 census.8 we calculated the proportion of tb that was extra pulmonary by age group, and we assessed the risk of each unfavourable treatment outcome by age group and sex (using all registered patients of each group as the denominator). for consistency with available population data, we analysed five-year age groups across the 0–24-year age span (young children aged 0–4, older children aged 5–9, young adolescents aged 10–14, older adolescents aged 15–19 and young adults aged 20–24) to allow detailed description of outcomes across different age groups. to compare the risks of unfavourable treatment outcomes (premature discontinuation, treatment failure, death or no recorded outcome) by age, we stratified the adult age group into 25–49 and ≥50 years as mortality on tb treatment is known to be higher among older adults.3 we calculated risk ratios with 95% confidence intervals for successful treatment using the 25–49 year age group as the reference group. to assess the quality of the surveillance data regarding child tb at national and regional levels, we evaluated data in itis using selected items from who’s standards and benchmarks checklist for tb surveillance data. we evaluated data quality using the two who benchmarks for tb surveillance relevant to childhood tb:1 in a middle-income country, 5–15% of all new tb patients are expected to be younger than 15 years;2 and the ratio of children 0–4 years old to those aged 5–14 years old is expected to be between 1.5:1 and 3.0:1.9 we repeated this assessment by administrative region to determine the variability in these key indicators within the country. we also calculated the percentages of notifications by five-year age groups to compare regional variation in age-related burden of reported disease. unit record data were managed and analysed in stata 13 (statacorp, college station, texas, usa), and aggregate data were managed and analysed in microsoft excel (microsoft, redmond, washington, usa). patients with multidrug-resistant tb were excluded from all analyses. ethics this study was approved by the human ethics advisory group at the department of paediatrics, university of melbourne and by the national tuberculosis program of the philippines, who provided access to the data. results epidemiology there were 299 005 patients of known age and sex registered on treatment for new or relapsed tb in the philippines in 2015. all records in the dataset were complete with regard to age, sex, registration date, treatment history and a patient identifier. a very small number (0.4%) of records did not specify the basis for diagnosis (clinical vs. microbiologic). the crude notification rate for the country was 296 cases per 100 000 person-years. at the regional level, notification rates varied from 144 cases per 100 000 person-years to 364 cases per 100 000 person-years (median rate = 291, interquartile range [iqr]: 262–333). nationwide, 38 694 (12.8%) of the patients were children and young adolescents aged 0–14 years; 43 923 (14.5%) were older adolescents and young adults aged 15-24 years. only 1.9% of all reported tb cases were classified as exclusively extrapulmonary in nature. the frequency and rates of new or relapsed tb, stratified by age group and sex, are shown in fig. 1. the number of notifications and the notification rates were higher in males than females in most age groups. the 20–24 year age group had the highest absolute number of notifications nationally in both sexes; however, per capita the rates of notification rose steadily across the adult age groups, peaking in the 75–79 year age group and then falling in the ≥80 year age group. fig. 1. notifications (thousands) and notification rates for tb by age and sex (thousands of cases per 100 000 person years), the philippines, 2015 click to download figure 1. jpg, 499kb of all new and relapsed patients registered in 2015, 242 629 (81.2%) were treated successfully according to their final recorded outcomes, 36 881 (12.3%) had no outcome recorded, and the remaining 19 495 (6.5%) experienced an unfavourable outcome (discontinuation, treatment failure or death). young children (aged 0–4 years) were more likely to be treated successfully than adults aged 25–49 (risk ratio [rr]=1.06, 95% confidence interval [ci]: 1.05, 1.07). compared to adults aged 25–49 years, young adults (aged 20–24 years) had the same likelihood of treatment success (rr=1.01, 95% ci: 1.00, 1.02), while adults over 50 years of age were slightly less likely to be treated successfully (rr=0.97, 95% ci 0.96–0.97). missing outcome data were equally common in all age groups, varying between 11.2% in children under 5 and 13.0% in adolescents aged 10–14 years. treatment discontinuation was somewhat more common among adolescents and adults than among children. young men aged 20–24 years had the highest risk of discontinuation of any age group: 5.1% of young men discontinued treatment prematurely (fig. 2). fig. 2. percentage of patients with unfavourable treatment outcomes by age and sex, new and relapse tb patients, the philippines, 2015 click to download figure 2. jpg, 398kb data quality indicators the proportion of new and relapsed tb among children and young adolescents aged 0–14 years was 12.8% nationally, but varied substantially by region, ranging from 3.5% to 27.9% of all tb cases, suggesting significant geographic variation in data quality regarding paediatric tb. the ratio of children under 5 to children and young adolescents aged 5–14 years ranged from 0.3:1 to 1.1:1 across the regions, with no region meeting the who benchmark of 1.5:1. nationally, the ratio was 0.8:1. discussion this study reviewed the epidemiology and outcomes of tb in the philippines in 2015 using the patient-based national surveillance dataset.7 we observed a high proportion of notifications among children, adolescents and young adults albeit with regional variation in data quality indicators for childhood tb. treatment outcomes were largely favourable, although outcome data were missing for a substantial proportion of patients across all age groups. consistent with the country’s young population, over one quarter of tb patients in the philippines are children, adolescents and young adults. this proportion is comparable to that seen in cambodia (26%) but markedly higher than that in viet nam (9.6%) or the lao people’s democratic republic (9.5%), the other high-burden countries in the western pacific region.10 the high proportion of patients aged under 25 in the philippines has implications both in the short term, during which the burden of disease among children and young people is substantial, and in the longer term, as the current generation ages with a high prevalence of latent tb infection. improving the quality of tb prevention, diagnosis and management among these age groups would contribute to tb control in the philippines both immediately and in the longer term. we identified potential problems in surveillance data quality in some regions that warrant further investigation. the proportion of cases affecting children has risen considerably in recent years from 2.1% in 201310 to 12.8% in 2016, following national efforts to improve detection of childhood tb. in a high transmission setting, children aged 0–4 years are disproportionately impacted due to their high risk of progression to active disease relative to older children.4 that the number of notifications from 0–4 year olds and 5–14 year olds is almost equal in the philippines (rather than the expected ratio of 1.5–3.0:1)9 suggests that tb in children aged 0–4 is being under-diagnosed or underreported. the regional variability in the proportion of reported tb cases contributed by children and young adolescents aged 0–14 suggests substantial variation in diagnostic and reporting practices within the country. the low mortality rate among young children likewise suggests the possibility of under-diagnosis or underreporting of disseminated tb and tb meningitis. the proportion of notifications in the 10–14 year age group was consistently low throughout the philippines in spite of marked variations in other indicators between the regions. the transiently reduced risk of tb in this age group has been well described in historical tb epidemics,11 though there may also be an elevated risk of under-detection in this age group, who can fall between child and adult health services.12 notification rates in the philippines rise markedly across the adolescent and young adult age groups as seen in both historical and modern tb epidemics in many settings.3,4 the most recent national tb prevalence survey in the philippines revealed substantial gaps in case detection in the country with a prevalence to notification ratio of 3.0.13 the survey observed the greatest gap between notifications and prevalence in the 15–24 year age group (the youngest group included in the survey), suggesting that the true burden of disease in this age group is over fourfold higher than documented by the notification data presented here.13 the major limitations of this study reflect the limitations of the data source used. we used data from the first year in which itis was operational nationally, and some facilities and regions may still have been adjusting to the new system. tb surveillance systems capture a limited number of variables, and some details that would have been valuable were not available, for example, dates of diagnosis and subsequent disengagement from care or bcg vaccination status. if age, diagnostic data or treatment outcome were recorded inaccurately, this will have affected our results. nonetheless, the data used in this study are the most detailed and complete source of data on tb in the philippines, and a data quality evaluation was included in this analysis. this study described the epidemiology and outcomes of tb among children and young people in the philippines who constitute one quarter of all registered patients nationally. our study together with the recent national prevalence survey13 highlight the need for improved tb control in the younger age groups who will play a key role in the philippines’ progress against tb over the coming decades. conflicts of interest none. funding this work was supported by the australian national health and medical research council centre for research excellence in tuberculosis (nhmrc tb-cre) and by the henry and rachael ackman travelling scholarship. acknowledgements the authors wish to thank ms donna mae geocaniga-gaviola (national tuberculosis program, philippines) for her kind assistance in accessing and interpreting the data used in this analysis. references world health organization. global tuberculosis report 2017. geneva: global tb programme; 2017 (http://www.who.int/tb/data/en/, accessed 15 december 2017). united nations population division. world population prospects, 2015 revision. new york, ny: united nations, department of economic and social affairs; 2015 (http://esa.un.org/unpd/wpp/dvd/, accessed 15 december 2017). mori t, leung cc. tuberculosis in the global aging population. infect dis clin north am. 2010 sep;24(3):751–68. doi:10.1016/j.idc.2010.04.011 pmid:20674802 marais bj, gie rp, schaaf hs, hesseling ac, obihara cc, nelson lj, et al. the clinical epidemiology of childhood pulmonary tuberculosis: a critical review of literature from the pre-chemotherapy era. [state of the art]. int j tuberc lung dis. 2004 mar;8(3):278–85. pmid:15139465 mossong j, hens n, jit m, beutels p, auranen k, mikolajczyk r, et al. social contacts and mixing patterns relevant to the spread of infectious diseases. plos med. 2008 mar 25;5(3):e74. doi:10.1371/journal.pmed.0050074 pmid:18366252 snow k, hesseling ac, naidoo p, graham sm, denholm j, du preez k. tuberculosis in adolescents and young adults: epidemiology and treatment outcomes in the western cape. int j tuberc lung dis. 2017 jun 1;21(6):651–7. doi:10.5588/ijtld.16.0866 pmid:28482959 integrated tuberculosis information system, 2015 ed. manila: national tuberculosis control program, philippines; 2016. philippines statistics authority. manila: philippines statistics authority; 2017 (https://psa.gov.ph/population-and-housing, accessed 15 december 2017). standards and benchmarks for tuberculosis surveillance and vital registration systems. geneva: world health organization; 2014. global tuberculosis database. geneva: world health organization; 2017 (http://www.who.int/tb/data/en/, accessed 15 december 2017). comstock gw, livesay vt, woolpert sf. the prognosis of a positive tuberculin reaction in childhood and adolescence. am j epidemiol. 1974 feb;99(2):131–8. doi:10.1093/oxfordjournals.aje.a121593 pmid:4810628 rachas a, lefeuvre d, meyer l, faye a, mahlaoui n, de la rochebrochard e, et al. evaluating continuity during transfer to adult care: a systematic review. pediatrics. 2016 jul;138(1):e20160256. doi:10.1542/peds.2016-0256 pmid:27354452 department of health, republic of the philippines. provisional ntps 2016 technical report. manila: foundation for the advancement of clinical epidemiology; 2017. evaluation of an ad hoc paper-based syndromic surveillance system in ibaraki evacuation centres following the 2011 great east japan earthquake and tsunami surveillance system implementation matthew m griffith,a yuichiro yahata,a fujiko irie,b hajime kamiya,a aika watanabe,c yusuke kobayashi,c tamano matsui,a nobuhiko okabe,d kiyosu taniguchi,e tomimasa sunagawaa and kazunori oishia a infectious disease surveillance center, national institute of infectious diseases, tokyo, japan. b ibaraki prefectural government, ibaraki, japan. c field epidemiology training program, national institute of infectious diseases, tokyo, japan. d kawasaki city institute for public health, kawasaki, japan. e national mie hospital, division of clinical research, mie, japan. correspondence to matthew griffith (email:griffith@niid.go.jp). to cite this article: griffith mm, yahata y, irie f, kamiya h, watanabe a, kobayashi y, et al. evaluation of an ad hoc paper-based syndromic surveillance system in ibaraki evacuation centres following the 2011 great east japan earthquake and tsunami. western pac surveill response j. 2018 dec;9(5). doi:10.5365/wpsar.2017.8.3.006 abstract outbreaks of infectious diseases can occur after natural disasters as vital services are disrupted and populations move into evacuation centres. national notifiable disease surveillance may be inadequate in these situations because of resource-consuming disease confirmation or system interruptions. although syndromic surveillance has been used as an alternative in post-disaster situations, no systematic evaluations of it have been published. we evaluated the ad hoc paper-based syndromic surveillance system implemented in evacuation centres in ibaraki prefecture after the 2011 great east japan earthquake and tsunami. we assessed the simplicity, acceptability, data quality, timeliness and portability of this system and reviewed its usefulness. we concluded that the system was simple, acceptable, portable and useful. the documentation and monitoring of disease events and trends were useful for developing interventions in evacuation centres and have since been used to improve post-disaster infectious disease and surveillance knowledge in japan. we believe timeliness was a challenge due to the chain of data transmission and communication passing through an intermediary. future implementations of this system could consider a more direct chain of data transmission and communication from collectors to analysers. too few key informant interviewees and the inability to obtain original paper-based data from evacuation centres limited our findings; we conducted this evaluation four years after the response occurred. future evaluations should be completed closer to when operations cease. the usefulness of the system suggests adopting it in future disasters. a simple, plain-language manual should be developed to improve future employment. introduction on 11 march 2011, the world’s fourth most powerful earthquake since 1900 (magnitude 9.1), struck north-eastern japan.1 the earthquake and subsequent tsunami killed 15 894 people and injured 6152,2 and 470 000 were moved into evacuation centres.3 although the national epidemiological surveillance of infectious diseases (nesid), japan’s passive system of sentinel and notifiable-disease reporting, was functional, surveillance staff in the affected areas were drawn into response activities that limited their time for nesid. the infectious diseases surveillance center (idsc) in japan’s national institute of infectious diseases, therefore, designed an ad hoc paper-based syndromic surveillance system in evacuation centres to detect outbreaks among displaced populations. syndromic surveillance of symptoms indicative of disease has been used in evacuation centres after previous disasters,4–7 although no system has been systematically evaluated. we aimed to evaluate the ad hoc paper-based syndromic surveillance system implemented after the 2011 great east japan earthquake and tsunami to understand its performance and appropriateness for future disasters and to contribute to post-disaster surveillance knowledge. methods we conducted this evaluation according to the centers for disease control and prevention’s (cdc) updated guidelines for evaluating public health surveillance systems8 four years after the great east japan earthquake and tsunami had occurred. system description the objectives of the ad hoc paper-based syndromic surveillance system were to: (1) collect daily counts of syndromes of evacuation centre residents; (2) assess daily outbreak risk; (3) and generate timely recommendations to prevent the spread of disease. idsc requested that public health nurses and non-health-care staff at evacuation centres record the number of residents presenting with each syndrome (table 1) by age group (<5 years, 5 to <65 years and ≥65 years) on paper forms and then fax them each day to the local public health centre or prefecture public health department, depending on jurisdictional arrangement. for cases of suspected influenza, public health nurses used rapid influenza kits to test for infection. positive tests were to be reported as influenza and negative as acute respiratory infection syndrome. a form was to be submitted each day that residents were in the centre, and zero reporting was required. local public health centres faxed the forms to the prefecture where they were compiled into an electronic spreadsheet and emailed to idsc by 12:00 the following day. table 1. definitions for reportable syndromes from evacuation centres following the 11 march 2011, great east japan earthquake and tsunami, ibaraki prefecture, japan, 21 march–15 may 2011 click to download table 1. jpg, 339kb idsc monitored the data daily for unusual increases and, if detected, would communicate with the prefecture public health department to verify information and discuss response actions. each week, idsc also summarized the data, developed histograms for each syndrome, made maps of evacuation centre locations and stratified syndrome counts by municipality and evacuation centre. idsc used this information, in combination with reported nesid data from surrounding areas, to assess the risk for outbreaks in evacuation centres using the world health organization’s (who) communicable disease risk assessment: protocol for humanitarian emergencies.9 summaries, assessments and recommendations were fed back weekly on electronic slides to the prefecture public health department, which distributed them to local public health and evacuation centres. evaluation description this evaluation was conducted to assess the system’s sensitivity, data quality, simplicity, acceptability, timeliness, and portability.8,10 we could not assess sensitivity without a gold standard or comparative system with which to compare. data sources included forms submitted daily to idsc from the ibaraki public health department with the numbers of syndromes, evacuation centres, and evacuation centre residents, as well as additional comments; electronic slides sent from idsc to ibaraki public health; e-mails containing those data and slides; and qualitative information obtained through interviews. we interviewed a staff member of the ibaraki public health department who had worked on the surveillance system’s operations and two staff from idsc: one who oversaw the design and implementation of the system and one who designed and operated the system, analysed its data and developed and disseminated assessments and recommendations. we conducted interviews in november 2015–march 2016. attribute assessment to assess data quality, we counted the number of missing values in cells where data were expected and expressed that number as a percentage of completeness. this included fields for syndrome counts and the number of evacuees, but not optional cells such as comments. we estimated validity by cleaning the data, counting the number of errors identified and expressing the sum as a percentage of the total number of non-missing values. errors were defined as values out of the acceptable range or logically inconsistent with other values. we assessed simplicity by reviewing information flow, case definitions and operating procedures. to assess portability, we reviewed procedural documentation as well as adaptations made to the system and their effects on performance. we assessed acceptability by reviewing prefecture and dissemination reports to determine what percentage conformed with the requirements that (1) a report be submitted each day by 12:00 from the prefecture public health department to idsc; and (2) dissemination reports were fed back weekly from the idsc to the prefecture public health department. all three attributes were included in the interviews. to assess timeliness, we estimated reporting delay by calculating the number of hours between close of business and the time the e-mail containing data was sent from the public health department to idsc as indicated in the e-mail time stamp and rounded to the closest hour. we then obtained range, interquartile interval (iqi) and median. we calculated implementation time by counting the number of days, rounded to the nearest whole day, between the date of the disaster and the date of the first report from the public health department, based on the email time stamp. we asked key informants about their perceived timeliness of procedures and implementation. we reviewed the usefulness of this system by asking interviewees about how the system-generated information was used to prevent disease or improve knowledge. we reviewed trends in reported syndromes to determine if any responses should have been triggered. we analysed quantitative data with epi info 7.1.5. (cdc, atlanta, ga, usa). results system implementation idsc offered this system to the four most affected prefectures; ibaraki prefecture was the only one to implement it. of the others, one experienced massive population emigration, which led to the closure of evacuation centres; one developed a different surveillance system in collaboration with a local university; and one adopted parts of this system late in the post-disaster period but analysed their data internally. there were 95 evacuation centres open in ibaraki prefecture with residents reaching a single-day maximum of 3305 and minimum of 139. in total, 152 syndromes were reported: 127 acute respiratory infection syndromes, 15 acute gastroenteritis infection syndromes, five “other” without clarification, four influenza and one wound-associated infection (fig. 1). data quality among 38 875 expected data cells, 18 665 were missing values (48%), and 403 of the non-missing values contained errors (2.0%). an additional 22 values should have been blank, giving 425 total errors (2.1%). fig. 1. number of persons identified for each syndrome (n = 152) and number of evacuation centre residents, by date of report, following the 11 march 2011, great east japan earthquake and tsunami, ibaraki prefecture, japan, 21 march– 15 may 2011 click to download figure 1. jpg, 488kb simplicity case definitions were in plain language with recognizable symptoms. syndrome counts were collected at the evacuation centres without investigation, follow-up or laboratory tests (except for suspected influenza that used rapid tests that could only be employed by public health nurses). these counts were recorded each day with a total evacuation centre resident count. after the third day of system operations, the information flowed through three units only: evacuation centre, prefecture public health department and idsc. prior to this, there was an additional reporting unit. in addition, the reporting of all syndromes together and not by age group also changed from day three, which improved the simplicity of the system. data were analysed at idsc by one person using descriptive statistics, histograms and maps. risk assessments were performed according to an established tool. interviewees perceived the system to be mostly simple, except that the risk assessments tried to cover too many topics, lacked local context and were not written in plain language. portability no procedural documentation or manual existed for the surveillance system, yet changes were made to the system without disruption. these included the submission of total syndrome counts only and direct reporting to the public health department instead of through public health centres first. acceptability the public health department reported to idsc on 52 of 53 days (98.1%) with seven reports (13.5%) received before the established time. over eight weeks, seven (87.5%) dissemination reports were fed back. interviewees revealed all evacuation centres were participating within three days of accepting residents and reported data on most non-holiday weekdays. interviewees reported that most operators within the system were willing to participate. timelines the median reporting delay between close of business on the day the data were collected and the time the email containing those data was sent from the public health department to idsc was 26 hours (iqi: 24–71; range: 2–194) (fig. 2). implementation time was 10 days after the disaster occurred. fig. 2. reporting delay in hours from 18:00 on day of collection to receipt at idsc, 21 march–15 may 2011 click to download figure 2. jpg, 365kb usefulness the system met its objectives: daily counts of syndromes for evacuation centre residents were collected on 52 of 53 days, the daily outbreak risk was assessed and weekly assessments with recommendations were generated. the surveillance system data had no trends that should have triggered a response. interviews revealed four usefulness themes: (1) risk assessments could have been more useful for evacuation centre staff by prioritizing syndromes, considering local context and using language more appropriate for non-health care staff; (2) disease trends and risk assessments were valuable for prefecture authorities; (3) dissemination reports were used for developing interventions; and (4) disaster epidemiology knowledge increased since syndrome trends documented by this system have been presented to disaster and medical associations throughout japan. discussion we evaluated the ad hoc paper-based syndromic surveillance system implemented in evacuation centres in ibaraki prefecture, japan, after the 2011 great east japan earthquake and tsunami. the straightforward collection, reporting, analysis and feedback procedures of the system made it simple; the influenza testing kits and language used for feedback were the major complications. interviewee responses, daily reporting and weekly assessments with feedback showed the system’s good acceptability. the simplicity of the system and evidence of adaptation without disruption showed its portability. finally, the system met its objectives and contributed to situational awareness, interventions and post-disaster surveillance knowledge. data quality and timeliness were the system’s major challenges. this is the first published report of a systematic evaluation of a syndromic surveillance system for outbreak detection in evacuation centres following a natural disaster. similar surveillance system benefits have been identified from other disasters: documenting and monitoring disease events and trends,4–7 measuring the burden of disease,5 increasing awareness about reporting,4 dispelling rumours4 and serving as a daily interface with shelter residents.7 other benefits included measuring the effects of control measures and being timely.4,5,7 timeliness issues may have been due to evacuation centres being operational every day, while the public health department kept its regular hours. the delay in reporting most likely occurred at the public health department since the longest delays occurred on fridays, saturdays and during the golden week (four national holidays that occur over seven days in late april and early may) when office hours were reduced. these delays improved over time, possibly due to an overworked public health department early on and then an improving post-disaster situation. challenges in post-disaster surveillance systems that have been previously published include changing evacuation centre status,4,5 competing surveillance systems,4 unstandardized patient recording systems4 and limited coverage.4 in this evaluation, we found that coverage was limited to one prefecture but included all evacuation centres in it. the patient recording systems used were simple and acceptable among participants within the system. there were no changes to evacuation centre status; when a centre closed, the health department reported zero residents. data quality was a challenge with low data completeness. among missing values, >95% were for missing syndrome counts, potentially because zero reporting was not conducted. there was only one zero reported for a syndrome throughout the period. if missing syndrome counts did mean zero syndromes, then documented counts and trends remain valid; however, there is the possibility that some syndromes were not reported. ad hoc paper-based surveillance systems like this one can benefit public health professionals in disaster settings because of their ease of implementation and usefulness during and after the disaster. fax machines, however, may not be operational in all situations, which may limit the usefulness of this system. where there is greater destruction, alternative reporting methods may be necessary, such as mobile phone–based applications that have been shown to improve timeliness, although they require careful planning and training before the disaster.11 our evaluation was limited by the lack of evidence from evacuation centres, no interviews with evacuation centre staff and no paper-based forms containing the original data. the small convenience sample of interviewees reduced the generalizability of findings, and the long duration between the disaster and interviews may have resulted in recall bias. interviewees did consult emails, notes and other files to improve recall. future evaluations should be completed soon after operations cease and include representation from all reporting levels of the system. finally, we were unable to assess the sensitivity of the system because of a lack of comparative information. for future post-disaster surveillance systems, we recommend that the chain of communication be as direct as possible: preferably, evacuation centre to central command. the public health department should receive the daily summaries but not be directly involved in the system. removing influenza testing would increase simplicity and avoid needing trained professionals for confirmatory testing, and syndromic data should be sufficient. a manual of operations written in plain language is also recommended, and this should clearly describe zero reporting, the communication of risk assessment findings and the dissemination of reports to non-health care staff. finally, we recommend pilot testing this system on a mobile phone application. to conclude, this simple and acceptable ad hoc paper-based surveillance system can be employed quickly and usefully in disaster situations where there are no other options. a simple, plain-language manual should be developed to ensure optimal operation. acknowledgements we thank natsuki nagasu, junko kurita and izumi nakayama for their input and support on this evaluation. 20 largest earthquakes in the world. reston, va: united states geological survey; 2017 (https://earthquake.usgs.gov/earthquakes/browse/largest-world.php, accessed 14 december 2017). damage situation and police countermeasures associated with the 2011 tohoku district—off the pacific ocean earthquake. tokyo: national police agency of japan; 2016 (http://www.npa.go.jp, accessed 14 june 2016). ranghieri f, ishiwatari m. learning from megadisasters: lessons from the great east japan earthquake. washington, dc: world bank; 2014 (https://openknowledge.worldbank.org/handle/10986/18864). doi:10.1596/978-1-4648-0153-2 ridpath ad, bregman b, jones l, reddy v, waechter h, balter s. challenges to implementing communicable disease surveillance in new york city evacuation shelters after hurricane sandy, november 2012. public health rep. 2015 jan-feb;130(1):48–53. doi:10.1177/003335491513000106 pmid:25552754 centers for disease control and prevention (cdc). surveillance in hurricane evacuation centers–louisiana, september-october 2005. mmwr morb mortal wkly rep. 2006 jan 20;55(2):32–5. pmid:16424855 centers for disease control and prevention (cdc). rapid health response, assessment, and surveillance after a tsunami–thailand, 2004-2005. mmwr morb mortal wkly rep. 2005 jan 28;54(3):61–4. pmid:15674183 murray ko, kilborn c, desvignes-kendrick m, koers e, page v, selwyn bj, et al. emerging disease syndromic surveillance for hurricane katrina evacuees seeking shelter in houston’s astrodome and reliant park complex. public health rep. 2009 may-jun;124(3):364–71. doi:10.1177/003335490912400304 pmid:19445411 german rr, lee lm, horan jm, milstein rl, pertowski ca, waller mn; guidelines working group centers for disease control and prevention (cdc). updated guidelines for evaluating public health surveillance systems: recommendations from the guidelines working group. mmwr recomm rep. 2001 jul 27;50 rr-13:1–35, quiz ce1–7. pmid:18634202 communicable disease risk assessment: protocol for humanitarian emergencies. geneva: world health organization; june 2007 (http://www.who.int/diseasecontrol_emergencies/guidelines/com_dis_risk_ass_oct07.pdf). cdc working group. framework for evaluating public health surveillance systems for early detection of outbreaks. atlanta, ga: centers for disease control and prevention; 2004 (https://www.cdc.gov/mmwr/preview/mmwrhtml/rr5305a1.htm). yang c, yang j, luo x, gong p. use of mobile phones in an emergency reporting system for infectious disease surveillance after the sichuan earthquake in china. bull world health organ. 2009 aug;87(8):619–23. doi:10.2471/blt.08.060905 pmid:19705013 sudden increase in human infection with avian influenza a(h7n9) virus in china, september-december 2016 surveillance report lei zhou,a* ruiqi ren,a* lei yang,b* changjun bao,c jiabing wu,d dayan wang,e chao li,a nijuan xiang,a yali wang,a dan li,a haitian sui,a yuelong shu,e zijian feng,f qun lia and daxin nia a public health emergency center, chinese center for disease control and prevention, beijing, china. b chengdu prefecture center for disease control and prevention, sichuan, china. c jiangsu provincial center for disease control and prevention, jiangsu, china. d anhui provincial center for disease control and prevention, anhui, china. e institute for viral disease control and prevention, chinese center for disease control and prevention, beijing, china. f chinese center for disease control and prevention, beijing, china. correspondence to daxin ni (email:nidx@chinacdc.cn). * these authors contributed equally to this work. to cite this article: zhou l, ren r, yang l, bao c, wu j, wang d, et al. sudden increase in human infection with avian influenza a(h7n9) virus in china, september-december 2016. western pac surveill response j. 2017 jan;8(1). doi:10.5365/wpsar.2017.8.1.001. abstract since the first outbreak of avian influenza a(h7n9) virus in humans was identified in 2013, there have been five seasonal epidemics observed in china. an earlier start and a steep increase in the number of humans infected with h7n9 virus was observed between september and december 2016, raising great public concern in domestic and international societies. the epidemiological characteristics of the recently reported confirmed h7n9 cases were analysed. the results suggested that although more cases were reported recently, most cases in the fifth epidemic were still highly sporadically distributed without any epidemiology links; the main characteristics remained unchanged and the genetic characteristics of virus strains that were isolated in this epidemic remained similar to earlier epidemics. interventions included live poultry market closures in several cities that reported more h7n9 cases recently. introduction the first three h7n9 cases were reported in china on 31 march 2013.1 four epidemics have been observed in china between february 2013 and september 2016. studies have shown that the demographic, epidemiologic and virologic characteristics of h7n9 cases from these epidemics remained unchanged while, the epidemic curve illustrated a decline in the magnitude of outbreaks over time, particularly in the third and fourth seasons in 2015 and 2016.2,3 however, since september 2016, not only has the fifth outbreak started earlier than usual, but a steep increase in the number of humans infected with h7n9 virus has also been observed, causing domestic and international concern. on 9 january 2017, china notified the world health organization through the international health regulations mechanism of 106 cases.4 an analysis of recently reported human cases with h7n9 was conducted to describe the epidemiological characteristics of the current epidemic. as the epidemic is ongoing, china remains vigilant and is monitoring outbreaks closely. methods surveillance system the surveillance system and identification procedure for h7n9 infection has not changed in china since 2013.1 a suspected h7n9 case in china is identified through the chinese surveillance system for pneumonia of unexplained etiology (pue). in addition, suspected h7n9 cases with mild or moderate illness are identified from the chinese sentinel surveillance system for influenza-like illness (ili). the information from these systems are reported to the internet-based national notifiable infectious disease report and surveillance system (nnidrss). each clinically diagnosed h7n9 case is confirmed by real-time reverse transcriptase polymerase chain reaction (rt-pcr), conventional rt-pcr, virus isolation, or a four-fold rise in h7n9 antibody titres in serology using laboratory methods and procedures as previously described.5 according to the national protocol of h7n9 disease control and prevention,6 once a suspected h7n9 case is identified in one jurisdiction, the local center for disease control and prevention (cdc) conducts a field investigation, defines and monitors the close contacts for seven days, enhances ili and pue surveillance in medical institutions that are secondary level and above for two weeks, and collects environmental samples from possible exposure locations and tests them for h7n9 virus. the method of identification and follow-up of close contacts has been described previously.1 data collection the epidemics were defined according to the seasonality of the disease. for comparability with a prior report,2 we defined the epidemic duration from 1 september to 31 august of the following year, with the exception of the first epidemic. the first epidemic started on 19 february 2013. this date corresponds to the illness onset date of the first h7n9 case. therefore, 1 september 2016 marks the beginning of the fifth season. in this study, the demographic information of recent h7n9 cases, including age, sex, location of residence and occupation, were obtained from the nnidrss. the field epidemiological investigation reports were collected from local cdcs as a supplementary source to determine clinical severity and time interval between date of illness onset and date of first visit to clinic, first hospitalization, diagnosis and receiving oseltamivir treatment. the protocol for diagnosis and treatment for human infection with a(h7n9) influenza virus7 was followed to define a severe case as having any of the following: a chest x-ray indicative of multilobar lesions or a >50% increase in the size of the lesions within a 48 hour period; dyspnea or a respiratory rate of greater than 24 times per minute for adults; severe hypoxia defined as less than or equal to 92% oxygen saturation while receiving 3-5 litres of supplemental oxygen per minute; or shock, acute respiratory distress syndrome or multiple organ dysfunction syndrome. field investigation reports were reviewed to collect information regarding control measures and interventions implemented by local governments. detailed exposure information was abstracted from the field investigation reports. to assess exposure to live poultry markets (lpms), we defined lpm as a market where live poultry is sold and could be touched. individuals were considered to have a history of live poultry-related exposure in our analysis if they went to an lpm or bought poultry or other food in an lpm or touched poultry that was bought from an lpm within the past seven days. the definitions of other exposures, including direct and indirect contact with poultry, are previously described in a prior study conducted by china cdc.8 data analysis to describe the epidemic, maps illustrating the geographic distribution of cases at provincial level were generated. using the date of illness onset of confirmed h7n9 cases, an epidemic curve was generated to illustrate five epidemics between 2013 and 2016. a separate epidemic curve was created specifically for the 2016 epidemic. the number of reported cases, affected provinces, counties and newly affected counties were compared among the second, third, fourth and fifth epidemics. we also described the demographic and epidemiological characteristics of confirmed cases in the fifth epidemic and compared them to the earlier epidemics. for the purpose of this analysis, hong kong sar (china), macao sar (china) and taiwan, china were not included. ethics approval and consent to participate all the case information was collected according to the regulations of the law of communicable diseases prevention and control of the people’s republic of china as part of an emergency response; therefore, the study was exempt from obtaining ethics approval and participant consent. results as of 31 december 2016, a total of 889 confirmed h7n9 cases, including 361 deaths, were reported from 19 provinces in china since the first cases were reported in 2013. nine provinces reported cases in all five epidemics (fig. 1a). the h7n9 epidemics usually occurred within the winter-spring season except for the first epidemic in 2013. the outbreaks usually started in october, significantly increased in late december and then peaked in january of the next year (fig. 1b). however, since september 2016, not only has the fifth epidemic begun earlier than usual, but a steep increase in the number of humans infected with h7n9 virus has also been observed in early december. as of 31 december 2016, 114 confirmed cases, including 42 deaths, have been reported from seven provinces, affecting 75 counties (fig. 1c). the first case of the fifth epidemic had illness onset on 28 september 2016 in zhejiang province. in september, october and november 2016, a total of eight cases were reported in four provinces (jiangsu, zhejiang, fujian, guangdong), which is similar to the number of cases during the same period in prior epidemics. however, since 1 december 2016, the number of cases has substantially increased, with 106 cases reported in december 2016 alone (fig. 1d). as of 31 december 2016, the number of reported cases in the fifth epidemic was 11.4, 2.7 and 6.1 times that observed in the corresponding periods in the second (10 cases), third (31 cases) and fourth (16 cases) epidemics, respectively. click to download figure 1a. jpg, 610kb click to download figure 1b. jpg, 322kb click to download figure 1c. jpg, 637kb click to download figure 1d. jpg, 388kb in the fifth epidemic, the number of cases were higher and the cases were more widespread than the second, third and fourth epidemics (table 1). the number of provinces affected by the h7n9 virus in the fifth epidemic increased from four provinces (jiangsu, zhejiang, fujian and guangdong) in september, october and november 2016, to seven provinces (jiangsu, zhejiang, anhui, guangdong, fujian, hunan, shanghai) by 31 december 2016. in the fifth epidemic, the number of newly affected counties, where no case was reported in prior epidemics, was 23, while the number of newly affected counties in the second, third and fourth epidemics was 4, 13 and 0, respectively (table 1). among the 114 cases reported to china cdc in the fifth epidemic, the median age was 55 years (range: 23-91); 68% were male (77/114); a quarter (29/114) were farmers, followed by retirees, persons who perform housework and persons who are unemployed. of note, detailed clinical and exposure information within 10 days before illness onset was collected on 97 (85%) of the cases. all 97 cases developed pneumonia, and 87 (90%) of them had severe illness. most (60/97, 62%) cases lived in urban areas, which remained similar to the earlier epidemics.2 but in zhejiang province, most (16/21, 76%) cases lived in rural areas, which was higher than that in the prior epidemics (60%). of the 97 cases with detailed exposure history, 87 (90%) reported exposure to live poultry, including lpms (72/87 cases, 83%) and backyard poultry (10/87 cases, 11%) and 5 (6%) were themselves poultry workers. the proportion of cases with history of exposure to lpms was higher in the current epidemic period than the 2013-2016 period (83% vs 69%) (table 2). click to download table 1. jpg, 284kb click to download table 2. jpg, 717kb in the current epidemic, the median time intervals between illness onset and initial medical consultation, hospitalization, diagnosis and time to antiviral treatment initiation were 2, 4, 9, 5 days, respectively; these remained similar to the earlier epidemics. only 5% (3/58) of cases received oseltamivir within 48 hours of symptom onset in the current epidemic. two clusters, each cluster including two cases, were identified through close contact identification and follow-up and were reported from jiangsu and anhui provinces. limited human-to-human transmission could not be ruled out in these two clusters. in jiangsu cluster, the index case was a 66-year-old man, who had illness onset on 25 november 2016 and went to a hospital for outpatient treatment on 26 and 27 november. he was admitted to the hospital on 28 november. he was diagnosed on 4 december and died on 12 december. he had no underlying medical conditions; he had visited a lpm to buy food every day within 10 days before his illness onset. he had no direct contact with live poultry in the market. he lived alone, but after his hospitalization, his 39-year-old daughter, who had taken care of her father in hospital and had close contact with her father without personal protection for three days (28-30 november), became the second confirmed case. the onset of her illness was on 6 december. she was admitted to the hospital on 8 december and diagnosed on 15 december. she had no underlying medical conditions and had no live poultry or lpm exposure before the illness onset, except taking care of her father. in the anhui cluster, the index case was a 66-year-old man who developed fever and cough on 16 december 2016, and was admitted to the nephrology ward in the hospital on 17 december because of his diabetic nephropathy and hypertension. his condition deteriorated and he was transferred from the nephrology ward to the intensive care unit on 19 december. he was diagnosed on 19 december and died on 20 december. he lived alone and had visited an lpm to buy food every day within 10 days before his illness onset. he had no direct contact with live poultry in the market. the second case in this cluster was a 62-year-old man. he was admitted to the hospital for oedema. he and the index case stayed in the same room in the nephrology ward for approximately 20 hours. he had physical contact with the index case when assisting the index case to the bathroom. he had illness onset on 22 december and oseltamivir was given to him on the same day. he was diagnosed on 23 december. he had no history of exposure to live poultry or lpm before the illness onset. during the fifth epidemic, as of 31 december 2016, a total of 33 h7n9 virus strains were isolated from 45 specimens collected from 40 confirmed cases in five provinces. all 33 viruses had completed full genetic analyses, and the genetic markers of mammalian adaptation and antiviral resistance of virus strains that were isolated in the fifth epidemics remained similar (dr yuelong shu in china cdc, unpublished data) to earlier epidemics.9 the genetic sequences of these viruses will be shared with the international community through the usual channels. discussion our analysis showed that the current epidemic corresponding to the fifth h7n9 epidemic started in september and experienced a steep increase in early december. this indicates that the fifth epidemic began earlier than the epidemics in 2013-2015 that started in october, significantly increased in late december and reached their peaks in january of the following year. in the fifth epidemic, the number of cases seemed to increase more rapidly than was observed in prior epidemics. there were newly affected counties in the fifth epidemic in comparison with the earlier epidemics, indicating a geographic spreading of the virus. except in two clusters, the cases had no epidemiological link, indicating human infection with h7n9 virus in china was still sporadic. regardless, the demographic characteristics of cases, such as age and sex distribution and exposure history in the fifth epidemic, were similar to those in earlier epidemics.2,3 consistent with a prior report,10 elderly people, especially those with underlying medical conditions, remain the most vulnerable population. live poultry exposure, especially lpm exposure, remained the major risk factor of infection. previous studies determined that lpm exposure was associated with increased risk of infection with h7n9 virus.8,10 the proportion of cases with history of lpm exposure was higher than that in earlier epidemics, indicating that lpm exposure remained the major risk factor of infection in the fifth epidemic. control measures at lpms had been determined to be effective to control h7n9 outbreaks.11 to control the epidemic, strict market management measures, such as market closures, had been implemented by the local governments of severely affected jurisdictions such as suzhou (from 26 december 2016), wuxi (from 29 december 2016) and changzhou (from 30 december 2016) in jiangsu province,12-14 and hefei (from 7 january 2017) in anhui province [dr jiabing wu in anhui cdc, personal communication]. while in zhejiang and guangdong provinces,15,16 live poultry trade has been permanently prohibited in the main urban areas in all prefectures, and all live poultry slaughtering processes must be centralized. as the traditional chinese new year is approaching, the consumption of poultry among the general population will be increasing, which will pose higher risk to residents, especially in the areas where lpms have not been closed. it is highly likely that sporadic cases will continue to be reported. whenever influenza viruses are circulating in poultry, sporadic infections or small clusters of human cases are possible, especially in people exposed to infected poultry or contaminated environments. there were two clusters reported in the fifth epidemic from jiangsu and anhui provinces, and limited human-to-human transmission between two individuals cannot be ruled out. although the genetic markers of mammalian adaptation and antiviral resistance of virus strains that were isolated in the fifth epidemic remained similar to earlier epidemics. continued monitoring of the virus and outbreaks is important as the pandemic potential of h7n9 remains. there were some possible reasons for the sudden increase of h7n9 cases in the fifth epidemic. one is increased environmental contamination by the h7n9 virus. environmental contamination has been determined as an alert for the emergence of h7n9 cases.17,18 according to the routine environmental surveillance in affected provinces like jiangsu, zhejiang and guangdong, the positive rate of environmental samples collected from lpms or other live poultry-related environments increased in december 2016 and was higher compared to the relative periods of the earlier years (dr changjun bao in jiangsu cdc, unpublished data; dr enfu chen in zhejiang cdc, unpublished data; and dr min kang in guangdong cdc, unpublished data). another possible reason is that it is simply an early epidemic of influenza disease. there were early increases of ili reports in the prior influenza seasons (ili surveillance weekly report by china cdc): about two months earlier for the southern provinces and one month earlier for the northern provinces. in response to the epidemic situation, a series of control measures and interventions have already been implemented by national authorities. before the beginning of the fifth epidemic, to enhance surveillance of avian influenza disease, china cdc set a monthly risk assessment mechanism with provincial cdcs that has been ongoing since august 2016. china national health and family planning commission (nhfpc) organized a multidepartment official supervision to six provinces in november 2016. china nhfpc conducted joint supervision with ministry of agriculture and ministry of industry and commerce to zhejiang, jiangsu and anhui provinces where the number of reported cases at the early stage of the fifth epidemic was higher than other provinces at the end of december 2016. china nhfpc organized a multidepartment joint technical meeting including ministry of agriculture and ministry of industry and commerce to discuss control measures. china nhfpc and china cdc strengthened risk communication with the general public through a hotline, a website, television and social chat applications such as wechat (tencent holdings limited). china cdc released a guideline to provincial cdcs to enhance h7n9 case detection and reporting, clinical management, nosocomial infection control, specimen collection and transportation, laboratory testing and virological analyses, field investigation and disease control in december 2016. the china ministry of agriculture issued a h7n9 virus elimination plan in 2014 to control infection and the spread of h7n9 virus among the poultry population, including control measures to decrease the exposure risk to residents during poultry raising, transportation and commercial trade.19 the study was unable to more thoroughly describe the fifth epidemic since the h7n9 outbreak is still ongoing. it was not possible to calculate the mortality rate as some cases are still receiving medical treatment in hospital. all close contacts during field investigation may not have been traced. some cases may have been missed because the h7n9 cases were mainly identified through the pue surveillance system, while some mild cases were identified by the ili surveillance system.20 viruses have been isolated from specimens collected from 35% (40/114) of confirmed cases as of 11 january 2017. the laboratory testing is ongoing. in conclusion, this study described the sudden increase in cases that occurred earlier than in previous years and that were mainly urban and significantly associated with exposure at lpms. aside from two instances of possible human-to-human transmission between two individuals, cases remain sporadic in china. conflicts of interest none. funding this work was supported by the national ministry of science and technology emergency research project on human infection with avian influenza a(h7n9) virus [kjyj-2013-01-02]; the china-us collaborative program on emerging and re-emerging infectious diseases; and the national mega-projects for infectious diseases (2014zx10004002-002-004). acknowledgements we thank our colleagues from the different levels of local cdcs and designated hospitals of zhejiang, guangdong, jiangsu, shanghai, hunan, fujian, anhui, jiangxi, beijing, shandong, henan, xinjiang, guangxi, jilin, guizhou, hebei, hubei, liaoning and tianjin provinces who provided health care to the infected persons, reported the epidemiology and clinical information to the china cdc information system and completed the field investigations. we also want to thank dr chin-kei lee from the world health organization china country office for providing technical support on manuscript preparation. references li q, zhou l, zhou m, chen z, li f, wu h, et al. preliminary report: epidemiology of the avian influenza a(h7n9) outbreak in china. n engl j med. 2013. xiang n, li x, ren r, wang d, zhou s, greene cm, et al. assessing change in avian influenza a(h7n9) virus infections during the fourth epidemic china, september 2015-august 2016. mmwr morb mortal wkly rep. 2016 12 16;65(49):1390-4. doi:10.15585/mmwr.mm6549a2 pmid:27977644 xiang n, iuliano ad, zhang y, ren r, geng x, ye b, et al. comparison of the first three waves of avian influenza a(h7n9) virus circulation in the mainland of the people’s republic of china. bmc infect dis. 2016 12 05;16(1):734. doi:10.1186/s12879-016-2049-2 pmid:27919225 human infection with avian influenza a(h7n9) virus – china. disease outbreak news. 17 january 2017. geneva: world health organization; 2017 (http://www.who.int/csr/don/17-january-2017-ah7n9-china/en/, accessed 18 january 2017). gao r, cao b, hu y, feng z, wang d, hu w, et al. human infection with a novel avian-origin influenza a(h7n9) virus. n engl j med. 2013 may 16;368(20):1888-97. doi:10.1056/nejmoa1304459 pmid:23577628 national health and family planning commission of prc. protocol for prevention and control for human infection with a(h7n9) influenza virus (the 3rd version) (http://www.moh.gov.cn/jkj/s3577/201401/8c1828375a7949cd85454a76bb84f23a.shtml, accessed 26 january 2014). national health and family planning commission of prc. protocol for diagnosis and treatment for human infection with a(h7n9) influenza virus (2014 version) (http://www.nhfpc.gov.cn/yzygj/s3593g/201401/3f69fe196ecb4cfc8a2d6d96182f8b22.shtml, accessed 26 january 2014). liu b, havers f, chen e, yuan z, yuan h, ou j, et al. risk factors for influenza a(h7n9) disease-china, 2013. clin infect dis. 2014 sep 15;59(6):787-94. doi:10.1093/cid/ciu423 pmid:24928293 wang d, yang l, zhu w, zhang y, zou s, bo h, et al. two outbreak sources of influenza a(h7n9) viruses have been established in china. j virol. 2016 05 27;90(12):5561-73. doi:10.1128/jvi.03173-15 pmid:27030268 zhou l, ren r, ou j, kang m, wang x, havers f, et al. risk factors for influenza a(h7n9) disease in china, a matched case control study, october 2014 to april 2015. open forum infect dis. 2016 aug 30; 3(3):ofw182. yu h, wu jt, cowling bj, liao q, fang vj, zhou s, et al. effect of closure of live poultry markets on poultry-to-person transmission of avian influenza a(h7n9) virus: an ecological study. lancet. 2014 feb 08;383(9916):541-8. doi:10.1016/s0140-6736(13)61904-2 pmid:24183056 suzhou municipal government. circular on suspension of live poultry trading in urban areas (http://www.suzhou.gov.cn/news/szxw/201612/t20161225_831175.shtml, accessed on 17 january 2017). wuxi municipal government. circular on suspension of live poultry trading in urban areas (http://www.wuxi.gov.cn/doc/2016/07/15/1106288.shtml, accessed on 17 january 2017). changzhou municipal government. circular on suspension of live poultry trading in urban areas (http://www.changzhou.gov.cn/ns_news/209148297210161, accessed on 17 january 2017). zhejiang provincial government. management for the administration of live poultry trading in zhejiang (http://www.zj.gov.cn/art/2014/6/4/art_12455_161981.html, accessed on 17 january 2017). guangdong provincial government. management for the administration of live poultry trading in guangdong (http://zwgk.gd.gov.cn/006939748/201412/t20141215_559975.html, accessed on 17 january 2017). kang m, he j, song t, rutherford s, wu j, lin j, et al. environmental sampling for avian influenza a(h7n9) in live-poultry markets in guangdong, china. plos one. 2015 05 01;10(5):e0126335. doi:10.1371/journal.pone.0126335 pmid:25933138 he f, chen ef, li fd, wang xy, wang xx, lin jf. human infection and environmental contamination with avian influenza a(h7n9) virus in zhejiang province, china: risk trend across the three waves of infection. bmc public health. 2015 09 21;15(1):931. doi:10.1186/s12889-015-2278-0 pmid:26392274 ministry of agriculture. national progrom for the eliminate of h7n9 virus among the poultry (http://www.moa.gov.cn/govpublic/syj/201406/t20140625_3950377.htm, accessed on 17 january 2017). xu c, havers f, wang l, chen t, shi j, wang d, et al. monitoring avian influenza a(h7n9) virus through national influenza-like illness surveillance, china. emerg infect dis. 2013 aug;19(8):1289-92. doi:10.3201/eid1907.130662 pmid:23879887 missed detections of influenza a(h1)pdm09 by real-time rt–pcr assay due to haemagglutinin sequence mutation, december 2017 to march 2018, northern viet nam original research hoang vu mai phuong,a ung thi hong trang,a nguyen le khanh hang,a nguyen thanh thuy,a le thi thanh,a nguyen vu son,a nguyen phuong anh,a tran thi thu huong,a vuong duc cuonga and le quynh maia a national institute of hygiene and epidemiology, hanoi, viet nam. correspondence to le quynh mai (email: lom9@hotmail.com or ltqm@nihe.org.vn). to cite this article: hoang pvm, nguyen hlk, tran htt, nguyen tt, nguyen ap, le tt, et al. missed detections of influenza a(h1)pdm09 by real-time rt–pcr assay due to haemagglutinin sequence mutation, december 2017 to march 2018, northern viet nam. western pac surveill response j. 2019 mar;10(1). doi:10.5365/wpsar.2018.9.3.003 abstract introduction: there are two methods of reverse transcription polymerase chain reaction (rt–pcr) that have been the common methods to detect influenza infections: conventional and real-time rt–pcr. from december 2017 to march 2018, several missed diagnoses of influenza a(h1)pdm09 using real-time rt–pcr were reported in northern viet nam. this study investigated how these missed detections occurred to determine their effect on the surveillance of influenza. methods: the haemagglutinin (ha) segments of a(h1n1)pdm09 from both real-time rt-pcr positive and negative samples were isolated and sequenced. the primer and probe sets in the ha gene were checked for mismatches, and phylogenetic analyses were performed to determine the molecular epidemiology of these viruses. results: there were 86 positive influenza a samples; 32 were a(h1)pdm09 positive by conventional rt–pcr but were negative by real-time rt–pcr. sequencing was conducted on 23 influenza (h1n1)pdm09 isolates that were recovered from positive samples. eight of these were negative for a(h1)pdm09 by real-time rt–pcr. there were two different mismatches in the probe target sites of the ha gene sequences of all isolates (n = 23) with additional mismatches only at position 7 (template binding site) identified for all eight negative real-time rt–pcr isolates. the prime target sites had no mismatches. phylogenetic analysis of the ha gene showed that both the positive and negative real-time rt–pcr isolates were grouped in clade 6b.1; however, the real-time rt–pcr negative viruses were located in a subgroup that referred to substitution i295v. conclusion: constant monitoring of genetic changes in the circulating influenza a(h1n1)pdm09 viruses is important for maintaining the sensitivity of molecular detection assays. introduction influenza a(h1n1)pdm09 is a novel influenza detected in humans in 2009, causing the first influenza pandemic in more than 40 years.1 since then, the virus has become a seasonal influenza virus and continues to circulate worldwide in humans and pigs.1,2 in viet nam, influenza a(h1n1)pdm09 spread quickly into communities in july 2009 and predominated, comprising about 85–90% of all influenza viruses during august and september of the 2009 season. after that, influenza a(h1n1)pdm02 became endemic, co-circulating with influenza a(h3n2) and b viruses.3–5 from december 2017 to march 2018, there was circulation of both influenza a and b, with influenza a(h1n1)pdm09 again predominating in viet nam. influenza a(h1n1)pdm09 was also the cause of outbreaks in other asian countries and territories including india, singapore, hong kong special administrative region (sar) and others.6–8 the gold standard assay for influenza diagnosis is the reverse transcription polymerase chain reaction (rt–pcr) assay. of the two methods, real-time rt-pcr has many advantages over conventional rt-pcr. most notably, it is time-saving, the data can be collected at the exponential phase of the reaction, and quality of amplification can be monitored during the run. real-time rt–pcr can also detect a single target in a very small concentration of dna or rna because it uses a fluorescent dye that binds to targets. despite these benefits, conventional rt–pcr is the dominant method in genetics-based diagnostic testing for influenza in viet nam because it is less expensive. sensitivity and specificity are key characteristics for diagnostic tools, and a high sensitivity is important when the test is used to identify emerging infectious diseases. both conventional rt–pcr and real-time rt–pcr assays are rapid, sensitive methods for detecting the genetic material of influenza viruses. however, mutations in the viral genome that generate novel variants cause the sensitivity of these molecular tests to decrease and may lead to false-negative results. the a(h1)pdm09 primers and probe used in viet nam were adopted from the united states centers for disease control and prevention (cdc) developed in 20099,10 and are commonly applied in public health laboratories throughout viet nam. in viet nam, the national sentinel influenza surveillance system, administered by the national institute of hygiene and epidemiology (nihe) of viet nam’s ministry of health, comprises sentinel clinics linked to regional public health laboratories. throat swabs collected from influenza-like illness (ili) and severe acute respiratory infection (sari) patients are tested for influenza using both conventional and real-time rt–pcr.4 in this study, we investigated a(h1n1)pdm09 virus isolates that could not be subtyped using real-time rt–pcr from surveillance specimens collected in late 2017 and early 2018. these misdiagnoses may affect the sensitivity of real-time rt–pcr assays used for influenza surveillance in viet nam. methods source of samples between december 2017 and march 2018, there were 256 throat swabs collected from ili and sari patients according to who case definitions11 as part of the national sentinel influenza surveillance system. among 256 specimens, 60 samples were from cases of ili and 196 were cases with sari. viral isolation the respiratory swabs positive for influenza a(h1n1)pdm09 were inoculated on madin-darby canine kidney (mdck) cells according to the standard operating procedures (sops) of the national influenza center (nic) located at nihe in hanoi. the viruses were harvested and stored at −80 °c until analysis. genetic characterization molecular testing assays ribonucleic acid (rna) extraction was conducted on a 140μl aliquot of each sample using the qiaamp viral rna mini kit (qiagen, hilden, germany) according to the manufacturer’s instructions. influenza detection was performed using both standard molecular methods (conventional rt–pcr and real-time rt–pcr), employing specific primer and probe sets targeted to the matrix, haemagglutinin (ha) gene and nucleoprotein gene according to the sops of the nic at nihe in hanoi (fig. 1). these primers and probes were constructed following guidelines of the cdc and the world health organization.10,12 fig. 1. comparison nucleotide sequences of primer–probe sets and ha sequences of influenza a(h1n1)pdm09 click to download figure 1. jpg, 717kb nucleotide sequencing and phylogenetic analysis the influenza a(h1n1)pdm09 isolates were collected after growth in mdck cells and their identify confirmed by using haemagglutination inhibition assay kits, provided by the cdc in 2017. the isolates with ha titre of more than 8 haemagglutinating units were selected for ha genetic analysis. rna extraction was conducted on a 140 μl aliquot of each isolate using the viral rna extraction kit (qiagen, valencia, ca, usa) according to the manufacturer’s instruction. sanger sequencing was used to determine the nucleotide sequence of the ha gene. briefly, cdna was first performed using the influenza a virus universal primer (uni 12) agc aaa agc agg as described (superscript® iii first-strand synthesis system, thermo scientific, ma, usa), followed by pcr with ha specific primer (hotstar hifidelity polymerase kit, qiagen, valencia, ca, usa). the pcr products were purified with pcr purification kits (qiagen, valencia, ca, usa) and sequenced using big dye terminator v3.1 (thermo scientific, ma, usa) on an abi 3130 automatic dna sequencer. analysis of nucleotide sequence data sequences were assembled using dnastar v.8.013 and multiple sequences alignment by bioedit v.7.0.5.14 the 1140 bp haemagglutinin domain 1 (ha1) sequences were constructed into a phylogenetic tree by mega7, using a maximum likelihood method with bootstrap supported values.15 reference ha genes (the recent recommended vaccine strains a/california/07/2009, a/michigan/45/2015 and others) were obtained from the national center for biotechnology information in bethesda, md, usa. all study sequences were deposited in genbank (mh636827 to mh636834).16 primer and probe binding regions were aligned with recent circulating a(h1n1)pdm09 viruses to check for mismatches by using geneious v.8.1.8 software.17 ethics the routine surveillance activities were approved by the ethic committee and the scientific committee of nihe. results detection of influenza a(h1)pdm09 during study period there were 86 samples positive for influenza a by both conventional rt–pcr and real-time rt–pcr during the study period (table 1). using conventional rt–pcr for subtyping, there were 82 samples (95.4%) that were a(h1n1)pdm09 positive and four samples (4.6%) that were a(h3) positive; we were able to subtype all of these samples. using real-time rt–pcr testing, 50 samples (58.2%) were positive for a(h1)pdm09, four samples were positive for a(h3) (4.6%) and 32 (37.2%) samples could not be subtyped (table 1). the distribution of subtypes by real-time rt–pcr was significantly different from that of conventional rt–pcr (χ2 test p value table 1. number and proportions of a(h1)pdm09-positive isolates by subtyping using real-time rt–pcr and conventional rt–pcr click to download table 1. jpg, 270kb phylogenetic tree of ha1 gene influenza a(h1n1)pdm09 the ha1 phylogenetic analysis compared 23 influenza a(h1n1)pdm09 isolates, eight of which were negative for a(h1)pdm09 by real-time rt-pcr, along with other influenza a viruses that circulated in viet nam during 2016-2018 (fig. 2). the a(h1n1)pdm09 viruses collected before this study period (september 2016 to february 2017) were mostly in the phylogenetic clade 6b, whereas most of the circulating viruses in 2017 and early 2018 were from subgroup 6b.1, represented by a/michigan/45/2015. a small proportion of viruses were grouped in subgroup 6b.2 (fig. 2). fig. 2. ha1 phylogenetic tree of influenza a(h1)pdm09 circulating in northern viet nam, 2016–2018 click to download figure 2. jpg, 589kb all of the 23 influenza a(h1n1)pdm09 isolates from this study belonged to subgroup 6b.1, and amino acid analysis showed differences at residues s84n, s162n and i216t in the ha protein of subgoup 6b.1 compared to those in subgroup 6b.2 (fig. 2). these isolates were closely related to viruses circulating in australia, the hong kong sar and singapore. the eight isolates that were positive by conventional rt–pcr but negative by real-time rt–pcr gathered in new subgroups that derived from 6b.1 with a change at residue s74r and i295v. the mutation s164t appeared in only six isolates of which five had been collected in early 2018. examining mismatches between primer and probe sequences used in the real-time rt–pcr assay and circulating a(h1n1)pdm09 viruses there were no mismatches and no significant changes in the forward and reverse primers in either the negative and positive real-time rt–pcr viruses in this study. however, three mismatches at position 7 (a to g), 9 (a to g) and 17 (a to g) at the probe’s target sites were unique to the real-time rt–pcr negative viruses (fig. 1); six of these had a mismatch at the 7th base, one had two mismatches at the 7th and 9th bases, and the other had three mismatches at the 7th, 9th and 21st bases (fig. 1). all positive and negative influenza a(h1)pdm09 viruses by real-time rt–pcr had mismatches at the 16th (g to a) and 27th (a to g) bases in the probe’s site, implying that the real-time rt–pcr conditions likely tolerated these mismatches. analysing the ha protein of a(h1)pdm09 real-time rt–pcr negative isolates, the substitution i295v (ha1 numbering) referred to a single nucleotide mutation at position 7 in the probes (fig. 3). this mutation is one of the two mutations related to new subgroups derived from group 6b.1 (fig. 2, 3). fig. 3. the substitutions found in the ha protein of influenza a(h1n1)pdm09 compared to the probe sequence click to download figure 3. jpg, 613kb discussion this study reports point mutations in the ha gene at specific probe sequence positions, which may have caused the false-negative subtyping results using real-time rt–pcr for influenza a(h1)pdm09 from december 2017 to march 2018 in viet nam. the mutation was located at the 7th base in the probe’s hybridization site that may not distinguish real-time rt–pcr negative and positive a(h1)pdm09 isolates and likely reduce the probe binding efficiency. all isolates with this mutation were in subgroup 6b.1, similar to a(h1n1)pdm09 viruses circulating worldwide recently.1 among these mutations, substitution i295v represents a mismatch between the real-time rt–pcr probes and the ha segment. however, the mutation at position 295 in ha1 protein has minor impact on rt–pcr performance; therefore, conventional rt–pcr may be the best assay to use for influenza a(h1)pdm09 detection where a new probe is being modified or developed.18 molecular assays, such as rt–pcr, have been accepted as the gold standard diagnostic tool for the detection of influenza viruses, and real-time rt–pcr has been a key development in pcr-based technology, significantly increasing the sensitivity and reducing the turnaround time compared with conventional pcr. however, this study shows that monitoring the evolution of influenza a viruses and adapting the rt–pcr probes and primers accordingly are required to minimize the risk of missed detections.19 recently developed next-generation sequencing technology and advanced molecular assays may also be useful tools to identify virus subtypes from clinical specimens when the samples cannot be subtyped and support rapid and accurate detection of an influenza outbreak allowing for appropriate patient care and treatment.18–21 this study is limited in that it was based on samples collected from a small number of sentinel sites in northern viet nam with a small number of isolates (n = 23). therefore the results may not be representative of all regions in viet nam or even of all areas in northern viet nam. however, that there was a mutation detected that may have resulted in the false-negative results by real-time rt–pcr demonstrates the influence of sequence variation in influenza viruses, which can result in probe mismatches on real-time rt–pcr assays for influenza detection in viet nam. this indicates a need for newly designed or modified primers and probes to effectively detect variant influenza viruses. to sustain sentinel influenza surveillance in viet nam, the evolution of influenza viruses should be monitored to determine genetic variants related to reduced sensitivity of diagnostic assays in a timely manner. this would be useful information not only for viet nam’s national surveillance system but also for other influenza surveillance systems worldwide. the mismatch detected at position 7 on the probe nucleotide sequence site indicates that the real-time rt–pcr conditions likely tolerated these mismatches. this limits the effectiveness of real-time rt–pcr for detecting a(h1n1)pdm09 in clinical samples and isolates and should be monitored. alternatively, conventional rt–pcr could be used as the preferred method or for those isolates where real-time rt–pcr cannot determine a subtype. it is also recommended that the primers and probes used be monitored and that a validation process for real-time rt–pcr primer–probe systems be developed. acknowledgements we gratefully acknowledge the contribution of health workers at sentinel sites of the national influenza surveillance system and acute severe respiratory infection surveillance system for sample collection. references evolution of a pandemic. geneva: world health organization; 2013 (http://www.who.int/influenza/resources/publications/evolution_pandemic_ah1n1/en/). surveillance report: influenza virus characterisation. solna: health communication unit, european centre for disease prevention and control; 2013 (https://ecdc.europa.eu/en/publications-data/influenza-virus-characterisation-summary-europe-december-2013). nguyen hkl, nguyen ptk, nguyen tc, hoang pvm, le tt, vuong cd, et al. virological characterization of influenza h1n1pdm09 in vietnam, 2010-2013. influenza other respir viruses. 2015 jul;9(4):216–24. doi:10.1111/irv.12323 pmid:25966032 nguyen yt, graitcer sb, nguyen th, tran dn, pham td, le mtq, et al. national surveillance for influenza and influenza-like illness in vietnam, 2006-2010. vaccine. 2013 sep 13;31(40):4368–74. doi:10.1016/j.vaccine.2013.07.018 pmid:23911781 western pacific region global influenza surveillance and response system. epidemiological and virological characteristics of influenza in the western pacific region of the world health organization, 2006-2010. plos one. 2012;7(5):e37568. doi:10.1371/journal.pone.0037568 pmid:22675427 influenza update n° 308. geneva: world health organization; 2018 (https://www.who.int/influenza/surveillance_monitoring/updates/2018_02_05_surveillance_update_308.pdf). influenza update n° 306. geneva: world health organization; 2017 (https://www.who.int/influenza/surveillance_monitoring/updates/2018_01_08_surveillance_update_306.pdf). countries in the temperate zone of the northern hemisphere, bi-weekly influenza situation update. manila: who regional office for the western pacific; 2016 (http://iris.wpro.who.int/bitstream/handle/10665.1/14173/influenza-20160621.pdf). the use of pcr in the surveillance and diagnosis of influenza. geneva: world health organization; 2011 (http://www.who.int/influenza/gisrs_laboratory/final_who_pcr__meeting_report_aug_2011_en.pdf). cdc protocol of realtime rtpcr for influenza a(h1n1). geneva: world health organization; 2009 (http://www.who.int/csr/resources/publications/swineflu/cdcrealtimertpcr_swineh1assay-2009_20090430.pdf). who surveillance case definitions for ili and sari. geneva: world health organization; 2019 (https://www.who.int/influenza/surveillance_monitoring/ili_sari_surveillance_case_definition/en/). chen lm, davis ct, zhou h, cox nj, donis ro. genetic compatibility and virulence of reassortants derived from contemporary avian h5n1 and human h3n2 influenza a viruses. plos pathog. 2008 05 23;4(5):e1000072. doi:10.1371/journal.ppat.1000072 pmid:18497857 protocols for bioedit/mega2 lab. burnaby, bc: simon fraser university (http://www.sfu.ca/~donyang/arch335/protocols%20for%20bioedit.pdf). software for molecular biology and sequence analysis. madison, wi: dnastar (https://www.dnastar.com/workflows/molecular-biology/#alignment). tamura k, peterson d, peterson n, stecher g, nei m, kumar s. mega5: molecular evolutionary genetics analysis using maximum likelihood, evolutionary distance, and maximum parsimony methods. mol biol evol. 2011;28(10):2731–9. doi:10.1093/molbev/msr121 nucleotide. bethesda, md: national center for biotechnology information (https://www.ncbi.nlm.nih.gov/nuccore/?term=influenza++ha++h1n1pdm09). miller h, olsen c, moir r. geneious r7: a bioinformatics platform for biologist. san francisco, ca (https://www.scribd.com/document/232812003/geneious-r7-a-bioinformatics-platform-for-biologists). mukherjee s and chakrabarti ak. impact of microarray technology in influenza virus research and diagnostics. j proteomics bioinform s6:002. doi:10.4172/jpb.s6-002 tenorio-abreu a, eiros bouza jm, rodríguez molins e, bermejo martín jf, domínguez-gil m, vega alonso t, et al. [influenza surveillance by molecular diagnosis]. rev esp quimioter. 2009 dec;22(4):214–20. [spanish] pmid:20082043 van den hoecke s, verhelst j, vuylsteke m, saelens x. analysis of the genetic diversity of influenza a viruses using next-generation dna sequencing. bmc genomics. 2015 feb 14;16(1):79. doi:10.1186/s12864-015-1284-z pmid:25758772 kawai y, kimura y, lezhava a, kanamori h, usui k, hanami t, et al. one-step detection of the 2009 pandemic influenza a(h1n1) virus by the rt-smartamp assay and its clinical validation. plos one. 2012;7(1):e30236. doi:10.1371/journal.pone.0030236 pmid:22295077 sex matters – a preliminary analysis of middle east respiratory syndrome in the republic of korea, 2015 brief report andreas jansen,a may chiew,a frank konings,a chin-kei leea and li ailanb on behalf the world health organization regional office for the western pacific mers event management team a emerging disease surveillance and response unit, division of health security and emergencies, world health organization regional office for the western pacific, manila, philippines. b division of health security and emergencies, world health organization regional office for the western pacific, manila, philippines. correspondence to outbreak@wpro.who.int. to cite this article: jansen a et al. sex matters – a preliminary analysis of middle east respiratory syndrome in the republic of korea, 2015. western pacific surveillance and response journal, 2015, 6(3). doi:10.5365/wpsar.2015.6.3.002 convincing evidence suggests that females and males are different in regard to susceptibility to both infectious and non-infectious diseases. sex and gender influences the severity and outcome of several infectious diseases, including leptospirosis, tuberculosis, listeriosis, q fever, avian influenza and sars.1,2,3 sex and gender differences have been observed in vaccine response and antibiotic treatment regimens.4,5 although the exact mechanisms are largely unknown, behavioural as well as biological variances are likely to contribute to these differences. collecting and sharing data on sex during outbreaks is valuable in improving our understanding of its role on emerging infectious diseases, including middle east respiratory syndrome (mers). mainstreaming sex and gender into surveillance and outbreak investigations is a priority under the asia pacific strategy for emerging diseases (2010).6 identifying sex and gender differences may guide response to public health emergencies ultimately minimizing the health, economic and social impact of emerging diseases. the 2015 outbreak of mers in the republic of korea has been the largest health-care-associated outbreak of mers outside the saudi arabia and the rest of middle east. as of 30 june 2015, there have been 183 mers cases reported since the first imported case on 20 may 2015, including one from china. to understand possible variances of the susceptibility and transmission of the disease, we conducted a sex-based analysis of the data. data on demographic characteristics and type of exposure for laboratory-confirmed mers cases reported in the republic of korea from 20 may to 30 june 2015 were obtained from the publically available line list.7 for single proportions, the one-sample z test was used, and the mann-whitney test was used to compare quantitative variables. a p-value of for the mers cases from the republic of korea, the median age for males was 55 years (range 16–87 years, n = 110); for females, it was 57 years (range 24–84 years, n = 73) (p = 0.522). the predominance of male cases in the republic of korea (60%) was similar to that observed in the middle east, where has been related to more frequent occupational exposure to camels (the putative animal reservoir of mers-cov).8,9 a similar predominance of male cases was also observed in nosocomial outbreaks in the middle east;10 however, reasons for this have not been investigated. for the republic of korea outbreak, exposure to camels was unlikely for the primary cases. when the mers cases were stratified by age and sex, the highest numbers were observed for males aged 40–49 years (23 males compared with 11 females; p = 0.036) (figure 1). this age and sex distribution was different from the overall korean population that has a large proportion of young and middle-aged adults in both sexes.11 however, the source population for the mers cases (i.e. population exposed at hospitals) might be different from the general population. although the sex ratio among mers cases appeared biased towards males, there was some evidence – as shown below – that more females were exposed. stratification by type of exposure, including hospital patients (n = 92), hospital visitors (n = 61) and health-care workers (hcw; n = 24) (six cases with unknown or undefined exposure were not included) revealed further details (figure 1). figure 1. number of reported mers-cov cases in total, by age group, sex and type of exposure, republic of korea, 20 may to 30 june 2015 (n = 183) click to download figure 1. jpg, 445kb * six cases where type of exposure was unknown and the index case were excluded. first, the male-to-female ratio was similar for cases exposed as hospital patients and hospital visitors (1.70:1 and 1.75:1, respectively); the opposite was seen for hcw (ratio 0.7:1). although the preponderance of hcw female cases might be explained by more females working in the health-care sector, the number of female hcw is at least three times that of male hcw.12 therefore, if the risk of infection is not associated with sex, then a male-to-female ratio of 0.3:1 or below would be expected. second, the age distribution between the sexes was comparable for both patients and hcw; among visitors, the age distribution varied between males and females. for visitors, while most of the younger cases were males, the age group wuth the highest number of female cases was 60–69 years. one possible reason for this might be differences in perceptions and behaviours related to hygienic measures as observed in the influenza a(h1n1) pandemic in the republic of korea in 2009;13 however, the overall predominance of males among visitors is enigmatic as it has been shown that females in the republic of korea are more likely to care for their sick relatives.14 that most cases were males also suggests that more visitors (i.e. spouses) and subsequent cases were female. another possible explanation for the excess of male cases could be differences in health-seeking behaviour and access that resulted in subsequent surveillance bias with underdiagnosing and underreporting of female patients. however, this seems unlikely as active surveillance and case finding were conducted in this outbreak. in addition, a recent study demonstrated that medical care utilization in the republic of korea is considerably higher in females.15 a predominance of male cases has also been documented in patients with pneumonia caused by influenza a(h1n1) infections, and smoking was the most relevant and independent risk factor during the 2009 influenza a(h1n1) pandemic in the republic of korea.16 while middle-aged males in the republic of korea have the highest prevalence of smoking in all organization for economic co-operation and development countries (40%), females have one of the lowest (6%).17 however, detailed case-based clinical data are necessary to provide more insight into the possible correlation of smoking and mers-cov infection. there are several limitations to this analysis which have to be considered. we provide only a preliminary analysis of the available data to generate initial hypotheses about sex-specific differences for the mers outbreak in the republic of korea. case-based data on other potential risk factors were not available. also, denominators for the exposure groups by sex were unknown. however, this initial assessment could have immediate implications for disease prevention and control. in addition to more targeted prevention measures, future clinical and epidemiological studies on mers should include sex and gender-specific analysis, as comparing groups with different proportions of male or female subjects may introduce confounding effects. this analysis of the outbreak of mers in the republic of korea revealed relevant sex-specific differences. while this preliminary analysis cannot provide a complete picture of sex and mers, it raises awareness among public health professionals and health-care providers to recognize sex as a relevant determinant in the epidemiology of mers. further epidemiological and virological investigations are needed to better understand the nature of this disease as many unknowns remain, including those related to sex and gender. conflicts of interest none declared. funding none. acknowledgements we acknowledge the korea centers for disease control and prevention for providing the mers data. other members of the who western pacific region mers event management team: takeshi kasai, kidong park, byung ki kwon, kotaro tanaka, helena humphrey, jan-erik larsen, warrick junsuk kim, charito aumentado, yuji jeong, david koch, raynal c squires, qui yi kyut, cindy hsin yi chiu, alisson clements-hunt, shang mei, seongju choi, sung kyu chang, myeongshin lee, motoi adachi, hyobum jang, souphantsone houatthongkham, peter hoejskov. references jansen a et al. sex differences in clinical leptospirosis in germany: 1997–2005. clinical infectious diseases, 2007, 44:69–72. doi:10.1086/513431 pmid:17143818 karlberg j, chong ds, lai wy. do men have a higher case fatality rate of severe acute respiratory syndrome than women do? american journal of epidemiology, 2004, 159:229–231. doi:10.1093/aje/kwh056 pmid:14742282 arima y et al. human infections with avian influenza a(h7n9) virus in china: preliminary assessments of the age and sex distribution. western pacific surveillance and response journal, 2013, 4(2):1–3. doi:10.5365/wpsar.2013.4.2.005 pmid:24015363 van lunzen j, altfeld m. sex differences in infectious diseases-common but neglected. journal of infectious diseases, 2014, 209 suppl 3:s79–80. doi:10.1093/infdis/jiu159 pmid:24966193 giefing-kröll c et al. how sex and age affect immune responses, susceptibility to infections, and response to vaccination. aging cell, 2015, 14:309–321. doi:10.1111/acel.12326 pmid:25720438 asia pacific strategy for emerging diseases (2010). manila, world health organization regional office for the western pacific, 2011. available from: http://www.wpro.who.int/emerging_diseases/apsed2010/en/ [accessed 17 july 2015]. mers-cov cases in the republic of korea as of 14/7/2015. geneva, world health organization, 2015. available from: http://www.who.int/emergencies/mers-cov/en/ [accessed 15 july 2015]. update on mers-cov transmission from animals to humans, and interim recommendations for at-risk groups. geneva, world health organization, 2014. available from: http://www.who.int/csr/disease/coronavirus_infections/mers_cov_ ra_20140613.pdf?ua=1 [accessed 15 july 2015]. müller ma et al. presence of middle east respiratory syndrome coronavirus antibodies in saudi arabia: a nationwide, cross-sectional, serological study. lancet infectious diseases, 2015, 15:559–564. doi:10.1016/s1473-3099(15)70090-3 pmid:25863564 oboho ik et al. 2014 mers-cov outbreak in jeddah–a link to health care facilities. the new england journal of medicine, 2015, 372:846–854. doi:10.1056/nejmoa1408636 pmid:25714162 statistics korea. available from: http://kostat.go.kr/portal/english/index.action [accessed 15 july 2015]. jung si et al. sero-epidemiology of hepatitis a virus infection among healthcare workers in korean hospitals. journal of hospital infection, 2009, 72:251–257. doi:10.1016/j.jhin.2009.03.015 pmid:19446368 park jh et al. perceptions and behaviors related to hand hygiene for the prevention of h1n1 influenza transmission among korean university students during the peak pandemic period. bmc infectious diseases, 2010, 10:222. doi:10.1186/1471-2334-10-222 pmid:20663229 rhee ys et al. depression in family caregivers of cancer patients: the feeling of burden as a predictor of depression. journal of clinical oncology, 2008, 26:5890–5895. doi:10.1200/jco.2007.15.3957 pmid:19029423 chun h et al. explaining gender differences in ill-health in south korea: the roles of socio-structural, psychosocial, and behavioral factors. social science & medicine, 2008, 67:988–1001. doi:10.1016/j.socscimed.2008.05.034 pmid:18632197 choi sm et al. the impact of lifestyle behaviors on the acquisition of pandemic (h1n1) influenza infection: a case-control study. yonsei medical journal, 2014, 55:422–427. doi:10.3349/ymj.2014.55.2.422 pmid:24532513 health statistics oecd. 2014 how does korea compare? paris, organisation for economic co-operation and development, 2015. availalble from: www.oecd.org/els/health-systems/briefing-note-korea-2014.pdf [accessed 15 july 2015]. trends in adult chlamydia and gonorrhoea prevalence, incidence and urethral discharge case reporting in mongolia from 1995 to 2016 – estimates using the spectrum-sti model original research jugderjav badrakh,a setsen zayasaikhan,a davaalkham jagdagsuren,a erdenetungalag enkhbat,a narantuya jadambaa,b sergelen munkhbaatar,c melanie taylor,d,e jane rowley,f guy mahianég and eline korenromph a mongolia national center for communicable diseases (nccd), aids/sti surveillance and research department. b world health organization country office mongolia. c mongolia global fund-supported project on aids and tb. d world health organization, dept. of reproductive health and research, geneva, switzerland. e centers for disease control and prevention, division of std prevention, atlanta, georgia, usa. f london, united kingdom. g avenir health, glastonbury, ct, usa. h avenir health, geneva, switzerland. correspondence to eline korenromp (email:ekorenromp@avenirhealth.org). to cite this article: badrakh j, zayasaikhan s, davaalkham j, enkhbat e, jadambaa n, munkhbaatar s, et al. trends in adult chlamydia and gonorrhoea prevalence, incidence and urethral discharge case reporting in mongolia from 1995 to 2016 – estimates using the spectrum-sti model. western pac surveill response j. 2017 nov;8(4). doi:10.5365/wpsar.2017.8.2.007 abstract objective: to estimate mongolia's prevalence and incidence trends of gonorrhoea and chlamydia in women and men 15–49 years old to inform control of stis and hiv, a national health sector priority. methods: we applied the spectrum-sti estimation model, fitting data from two national population surveys (2001 and 2008) and from routine gonorrhoea screening of pregnant women in antenatal care (1997 to 2016) adjusted for diagnostic test performance, male/female differences and missing high-risk populations. prevalence and incidence estimates were then used to assess completeness of national case reporting. results: gonorrhoea prevalence was estimated at 3.3% (95% confidence interval, 1.6–3.9%) in women and 2.9% (1.6–4.1%) in men in 2016; chlamydia prevalence levels were 19.5% (17.3–21.9%) and 15.6% (10.0–21.2%), respectively. corresponding new incident cases in women and men in 2016 totalled 60 334 (36 147 to 121 933) and 76 893 (35 639 to 254 913) for gonorrhoea and 131 306 (84 232 to 254 316) and 148 162 (71 885 to 462 588) for chlamydia. gonorrhoea and chlamydia prevalence declined by an estimated 33% and 11%, respectively from 2001 to 2016. comparing numbers of symptomatic and treated cases estimated by spectrum with gonorrhoea case reports suggests that 15% of symptomatic treated gonorrhoea cases were reported in 2016; only a minority of chlamydia episodes were reported as male urethral discharge cases. discussion: gonorrhoea and chlamydia prevalence are estimated to have declined in mongolia during the early 2000s, possibly associated with syndromic management in primary care facilities and improving treatment coverage since 2001 and scale up of hiv/sti prevention interventions since 2003. however, prevalence remains high with most gonorrhoea and chlamydia cases not treated or recorded in the public health system. introduction control of sexually transmitted infections (stis) and hiv is a health sector priority in mongolia. since 2001, syndromic case management is implemented in primary care facilities that lack capacity for laboratory diagnosis. prevention services targeted at high-risk groups have been intensified since 2003 with support from the global fund to fight aids, tuberculosis and malaria.1 in mongolia, laboratory-diagnosed syphilis, gonorrhoea and trichomoniasis, as well as syndromically diagnosed male urethral discharge (ud) and genital ulcer disease from health facilities not doing laboratory diagnosis, are reportable; approximately 15 000 new sti cases are registered annually.2-5 however, the true burden is believed to be higher due to undiagnosed and untreated cases, cases treated but not reported through private-sector facilities and those self-treated through pharmacies.6-8 syphilis surveillance draws on periodic serological surveys and routine, near-universal screening among pregnant women attending antenatal care (anc). for gonorrhoea and chlamydia, however, no such systematic measurement is in place. in 2017 mongolia, with support from the world health organization (who) and avenir health, estimated its adult prevalence trends for chlamydia and gonorrhoea using the spectrum-sti model9 to inform strategic planning for its sti response and strengthen its sti surveillance system. the spectrum-sti tool estimates trends in adult prevalence and incidence of stis at the national level using data from routine sti surveillance and population-based surveys.9 this article presents spectrum estimates of adult prevalence and incidence of gonorrhoea and chlamydia in mongolia from 1995 to 2016 using prevalence survey data. estimated male gonorrhoea and chlamydia case numbers were compared to ud case reports to estimate treatment coverage and reporting completeness. this study represents the first national-level sti trend estimation in an asian country using an internationally agreed approach and assumptions. methods overview the spectrum-sti tool (http://avenirhealth.org/software-spectrum.php)9 estimated prevalence and incidence of gonorrhoea and chlamydia in adults aged 15-49 years. data and assumptions were reviewed at a three-day technical workshop held in mongolia in february 2017. participants included representatives of the ministry of health, hiv/aids and maternal and child health programmes, the central reference laboratory and partners supporting or implementing the national hiv/sti response. mongolia-specific parameter values and results from the base-case analysis were agreed at the workshop and are summarized here. spectrum default parameter values have been described elsewhere.9 prevalence estimation national prevalence levels for adult women were estimated over time as a moving average through all data points. for both stis, prevalence data were identified from studies conducted between 1995 and 2016 in representative general adult populations. for mongolia, this included pregnant women attending anc; no prevalence data were identified from any other low-risk populations. prevalence data from each study were adjusted for sensitivity and specificity of diagnostic tests used10-12 (supplemental digital content (sdc) 1). for gonorrhoea the national data from routine screening of women attending anc (sdc2) used culture or gram stain on cervical or vaginal swabs; sensitivity of these tests was set at 35% to reflect challenges in testing in routine care settings. each prevalence data point was adjusted upward by 10% to account for the contribution of higher-risk populations.10 national sample surveys were assigned a weight of 100% (the maximum, given that these should be nationally representative). routine screening data were assigned a 40% weight, as agreed at the national workshop, as these were not nationwide or systematically sampled. since the 40% value was somewhat arbitrary, we present estimates using different weights as sensitivity analysis. since no prevalence data were available for men, male prevalence was inferred from female estimates by applying a time-constant male-to-female prevalence ratio of 0.86 (range 0.58–1.15) for gonorrhoea and 0.80 (range 0.53–1.07) for chlamydia with uncertainty bounds incorporating both uncertainty in female prevalence and in the male-to-female ratio.10 the 95% uncertainty or confidence intervals were generated to account for binomial sampling variability in prevalence observed in the data and modelling error.9 test-adjusted prevalence rates were simulated (in 10 000 replications) following β distributions to which we added random terms in the logit scale; the random terms were sampled from a uniform distribution on residuals obtained after fitting the original data set. supplemental digital contents (sdcs) click to download sdcs. pdf, 345kb incidence estimation and sti episode durations incidence was estimated by dividing estimated prevalence by an assumed average duration of infection.13 the 95% confidence intervals on incidence reflect uncertainty in both the underlying prevalence (estimated by bootstrap) and in the duration of infection set at ± 50%. sti episode durations were as assumed in the who 2012 global and regional estimates.10 in the who estimates, the region that mongolia is a member of was assumed to have intermediate treatment coverage.10 however, following discussions at the national workshop, and lacking national population-based data about sti treatment coverage, we decided to use longer sti durations, reflecting low treatment coverage. assuming 35% treatment coverage of symptomatic gonorrhoea and chlamydia episodes in men and 22.5% in women,10,14 we calculated average durations of gonorrhoea and chlamydia episodes weighted between the fractions treated and untreated (sdc3). the average duration in men was 0.32 years for gonorrhoea and 0.86 years for chlamydia and 0.47 years for gonorrhoea and 1.22 years for chlamydia in women (sdc3). sti case reporting completeness an expected case load for ud was estimated from spectrum-estimated case incidence, assuming that 64% of gonorrhoea cases and 14% of chlamydia cases are symptomatic and 35% of these are treated10 (sdc3). the spectrum estimates of symptomatic gonorrhoea cases and ud cases were then compared to national-level case reports for laboratory-diagnosed gonorrhoea and ud (a non-overlapping set of cases without laboratory diagnosis) from 1995 to 2016 collected by the national center for communicable diseases15,16 (sdc4) to estimate reporting completeness. sensitivity analysis univariate sensitivity analyses assessed the sensitivity of 2016 estimates to key assumptions and mongolia-specific input data and assumptions: the weight of routine anc screening data points; gonorrhoea relative to national anc surveys; the sensitivity of culture and wet-mount in routine anc gonorrhoea screening; the gonorrhoea prevalence data used; the decline rate in chlamydia (based on few data points) relative to that in gonorrhoea (based on a longer and more continuous time series); and (as determinant of reporting completeness) the gonorrhoea incidence rate in men 50–64 years. more general and global assumptions of the spectrum methodology were addressed elsewhere.9 results gonorrhoea and chlamydia prevalence two national surveys were identified from the general population; both measured gonorrhoea and chlamydia in pregnant women attending anc in 200117 and 200818 (sdc2, fig. 1a & b). for gonorrhoea, national prevalence data were also available for 1997 to 2016 from routine screening of women attending anc. for gonorrhoea in women, spectrum estimated a stable 5.0% prevalence from 1995 to 2001 followed by a decline to 3.3% (95% confidence interval, 1.6–3.9%) in 2016 (fig. 1a). for chlamydia, estimated prevalence fell from 2001 (the year of the first survey) and 2008 (the year of the second and final survey), and the model thereafter assumed stable prevalence. in 2000–2001 chlamydia prevalence was 21.9% (19.5–24.4%) and in 2016 19.6% (17.3–21.9%, fig. 1b). from 2001 to 2016, gonorrhoea and chlamydia prevalence declined by 33% and 11%, respectively. no data were identified for men; therefore, male gonorrhoea and chlamydia estimates were based on female estimates (see methods). in men, gonorrhoea prevalence was estimated at 4.3% between 1995 and 2001 and falling to 2.9% (1.6–4.1%) by 2016. for chlamydia, prevalence was estimated at 17.5% (15.6–19.5%) in 2000 and 15.6% (10.0–21.2%) in 2016. prevalence of (a) gonorrhoea and (b) chlamydia and incidence rate of (c) gonorrhoea and (d) chlamydia in women 15–49 years in mongolia click to download figure 1. jpg, 239kb gonorrhoea and chlamydia incidence fig. 1c & d show estimated trends in gonorrhoea and chlamydia incidence. in 2016, spectrum estimated 60 334 (36 147–121 933) and 76 893 (35 639 to 254 913) new gonorrhoea cases in women and men aged 15–49 years, respectively and 131 306 (84 232 to 254 316) new cases of chlamydia in women and 148 162 (71 885 to 462 588) in men (table 1). for both stis, incidence was higher in men than in women despite higher prevalence in women, reflecting longer average duration of both infections in women than in men. gonorrhoea's estimated case incidence rate declined in women from 11 650/100 000 in 1995 to 7409 in 2016 and in men from 13 991 to 9316 (fig. 1c). over this period, chlamydia incidence fell from 17 953 to 16 023/100 000 in women and from 20 374 to 18 184/100 000 in men (fig. 1d). for chlamydia, annual incident case numbers increased slightly from 1995 to 2002, a period when prevalence (fig. 1b) and incidence rates (fig. 1d) were estimated to have been stable; population growth implied slightly increasing annual case numbers (fig. 2b). from 2002 to 2016, annual chlamydia cases were stable (fig. 2b), reflecting the counterbalancing effects of declining prevalence and incidence rates (fig. 1b and 1d) and population growth. spectrum-estimated prevalence and incidence rate (per 100 000 person-years) of gonorrhoea and chlamydia in women and men 15–49 years, mongolia in 2016 click to download table 1. jpg, 151kb spectrum-estimated incident gonorrhoea and chlamydia cases in men 15–49 years by treatment and reporting status, mongolia click to download figure 2. jpg, 204kb gonorrhoea reporting completeness and treatment coverage fig. 2a shows spectrum-estimated incident gonorrhoea cases in men from 1995 to 2016 split into episodes symptomatic and asymptomatic, treated and untreated and reported and unreported. comparing national gonorrhoea case reports (sdc4) with spectrum estimates of the number of men who were symptomatic and treated, reporting completeness for gonorrhoea cases treated in clinics improved from 8% in 1997 to 15% in 2016 (table 2). incident cases of gonorrhoea, chlamydia and urethral discharge and the subset who are treated and reported in men 15–49 years in mongolia, 2016 click to download table 2. jpg, 179kb chlamydia treatment and reporting coverage, 1995–2016 of the spectrum-estimated 148 162 chlamydia cases in men aged 15–49 years in 2016, some 20 743 were expected to be symptomatic of which 7260 would have been treated (table 2 and fig. 2b). laboratory diagnosis is not commonly practiced for chlamydia and chlamydia is not reportable; chlamydia cases in men should instead be reported as ud cases per the syndromic management policy. however, reported ud cases ranged between just 342 and 1648 in 2001 and in 2005 to 2015; years 2002 to 2004 were missing. in 2016, of population-level estimated incident gonorrhoea plus chlamydia cases (76 893 gonorrhoea plus 148 162 chlamydia; total 225 055), the reported 2625 gonorrhoea cases plus 606 ud cases covered only 1.4 %. this calculation assumed all ud cases were due to gonorrhoea and/or chlamydia; in reality, not all ud cases are caused by gonorrhoea or chlamydia (sdc5), thus these reporting completeness estimates are optimistic. most unreported chlamydia cases were asymptomatic (69% in 2016, fig. 2b), symptomatic but not treated (20% at 2016) or treated but not reported (10% in 2016). sensitivity analysis excluding routine anc data from estimations, increased estimated gonorrhoea rates in 2016 (4.2% instead of 2.9% in men) and reporting completeness of male gonorrhoea cases was correspondingly lower. conversely, when anc routine data points were given an increased weight, namely the same weight as each anc survey, the estimated gonorrhoea prevalence and incidence fell slightly (male prevalence 2.7% instead of 2.9%) and gonorrhoea reporting completeness increased. gonorrhoea results were also very responsive to the assumed sensitivity of culture in routine anc-based screening: when varying the sensitivity between 25-75.7%9 male prevalence in 2016 varied from 1.5-3.9% and gonorrhoea reporting completeness from 11–29%. had gonorrhoea prevalence in mongolian men in 2016 been as low as 1.28% (the who 2012 estimate for men in east asia) instead of our national estimate of 2.9%, then gonorrhoea reporting completeness would have been 34% instead of 15% completeness. our analysis assumed that national case report was for men 15-49 years old. in fact, some reported cases will have been from older men. estimated gonorrhoea reporting completeness would be 13% instead of the best estimate of 15% if we assume additional gonorrhoea and chlamydia cases to occur in men above 49 years at a rate equal to men 15–49 years. finally, spectrum estimates for chlamydia were based on two national surveys (2001 and 2008) and it was assumed that prevalence was constant after 2008. if chlamydia prevalence, however, fell between 2008 and 2016 at the same rate as gonorrhoea prevalence fell, the chlamydia prevalence in 2016 would have been 13% rather than 15.6%. discussion prevalence trend estimations for mongolia generated using the spectrum-sti model and data from anc-based surveys and routine screening indicate that prevalence of both chlamydia and gonorrhoea fell from 2001 to 2016. however, prevalence levels remained extremely high: for both stis, mongolia's estimated prevalence in 2012 was considerably above who estimates for the east asia and central asia regions10 (fig. 1a & b). chlamydia was estimated five times more prevalent than gonorrhoea as shown in the who 2012 estimates globally and for asia.10 from 2001 to 2016, the estimated decline was stronger for gonorrhoea than for chlamydia, reflecting the gonorrhoea decline observed in anc routine testing. we cannot exclude that for chlamydia the decline from 2001 to 2008 also continued after 2008 (see table 3); however, there are no data post-2008 to establish this. conversely, the estimated chlamydia decline from 2001 to 2008, based on two surveys, is our best estimate but is not as robust as a trend estimate based on multiple data points might have been. estimates of chlamydia rates and especially their time trend are therefore less certain than for gonorrhoea. sensitivity analysis – effect of varying (selected) assumptions and values on national estimates of gonorrhoea and chlamydia prevalence and incidence and the estimated reporting completeness for symptomatic treated gonorrhoea in mongolian men 15–49 years, in 2016 click to download table 3. jpg, 194kb the declines in gonorrhoea and chlamydia prevalence are attributable to several factors including the expanded hiv/sti response and scale-up of (global fund-supported) hiv/sti prevention interventions including outreach services with communication, counselling and hiv and sti testing for key groups since 2003.1 the declines are in line with spectrum estimations for syphilis in anc women.20 declining prevalence of both gonorrhoea and chlamydia based on anc data contrasts with stable or possibly increasing gonorrhoea and chlamydia prevalence in female sex workers (fsw) in ulaanbaatar sampled through integrated bio-behavioural surveillance; fsw gonorrhoea prevalence increased from 13.6% in 200221,22 to 15.6% in 200923 and from 19.3% to 24.5% for chlamydia. this trend may be a true increase or reflect that in 2009 a higher-risk fsw population was sampled. while gonorrhoea is the predominant cause of ud cases seen in clinics,15,16 at the population level the prevalence, incidence and case numbers are much higher for chlamydia. still large numbers of gonorrhoea and especially chlamydia cases are not treated because many infections in both men and women do not cause symptoms and because over half of symptomatic chlamydia-infected adults do not access treatment. comparison of reported male gonorrhoea case numbers with spectrum-estimated incident cases suggests that in 2016 15% of male symptomatic gonorrhoea cases were treated and reported through public sector providers. estimated reporting completeness improved after 2001 (8%), coinciding with mongolia's phased roll-out of syndromic sti treatment from a who-supported pilot in 20011 to nationwide implementation in 2005.24,25 in spectrum simulations, treatment rates were assumed constant over time. if, however, treatment coverage improved then annual numbers of new cases (for a given prevalence) may have been higher and reporting completeness lower. the low reporting completeness highlights the need to strengthen mongolia's national reporting system and ensure it covers both public and private providers.8 national surveys in 2010 and 2014 found that up to half of self-reported sti treatments were in the private sector (including purchases from pharmacies),14,26 yet only 9% of reported cases were from private clinics in 2015.24 despite recent declines, mongolia has sti rates higher than neighbouring countries. this probably reflects persistent poor coverage of effective sti treatment by qualified providers and not widespread high-risk behaviours since mongolia has maintained <0.1% hiv prevalence in the general population.27 nevertheless, the high sti rates constitute a persistent risk factor for the possible future spread of hiv. limitations the estimations are limited by the quality and quantity of prevalence data, modelling assumptions and assumptions made when data was lacking.9 for prevalence estimation, uncertain assumptions include that all prevalence data were from anc women who may (as for hiv) not be representative for non-anc non-pregnant women.28 uncertainties particularly affected results for men (based on female estimates, applying a global fixed male-to-female prevalence ratio) and results for chlamydia (with less national data than gonorrhoea). incidence estimates depended on treatment coverage and assumed durations of treated and untreated infections for which longitudinal data are lacking. assumed proportions of episodes that become symptomatic were calibrated on who estimates for the east asia region10 not on mongolia-specific data. proportions of symptomatic episodes that get treated were also taken from regional-level who assumptions10 where we situated mongolia as a country with low treatment coverage, an assumption we could not validate against population-based local data. finally, the assessment of gonorrhoea and ud case reporting completeness required additional assumptions, most of which were global rather than mongolia-specific. implications for surveillance and programmatic response the last national sti survey in mongolia was conducted in 2008 in anc women, and as of 2017 no survey has measured sti prevalence levels in low-risk men. mongolia would benefit from regular population-based prevalence measurements looking at multiple stis in low-risk men and women. these do not need to be large surveys but should be carefully designed to identify trends over time. opportunities may be developed for tagging affordable sentinel sti screening onto existing data collection platforms. for example, screening and treatment for chlamydia in adolescents, as recommended in the who global sti strategy 2016–2021,29 may yield useful data but is as yet not implemented in mongolia. reliable monitoring of both stis would, furthermore, benefit from strengthening the national reporting system and expanding it to track cases treated in private-sector services, including self-treatment with drugs dispensed by pharmacies. our analyses confirm challenges mongolia faces with sti case reporting; with access to laboratory facilities for diagnosis, which is largely limited to ulaanbaatar serving just half of the national population;3,7,8 and with adherence to syndrome-based case reporting. at present, mongolia reports negligible numbers of ud cases because most providers do not follow the syndromic approach by which sti patients would get recorded by syndrome whether or not subsequently an etiological diagnosis is established. more consistent implementation of the syndromic approach for both treatment and reporting may improve completeness of treatment (avoiding loss of patients between initial syndromic diagnoses, referral to the laboratory, and waiting time for diagnosis and referral for treatment) as well as case reporting to become more usable for surveillance and planning. additionally, reporting from pharmacies of clients presenting with ud symptoms might support surveillance. however, self-treatment with over-the-counter drugs should not be encouraged as a treatment policy due to risks of spreading antimicrobial resistance among gonococcal isolates.30 in conclusion, model-based estimations based on prevalence surveys suggest that gonorrhoea and chlamydia have declined in mongolia but remain high. the high sti rates, much of which remains undiagnosed and untreated, bring a substantial burden of sequelae including infertility, pelvic inflammatory disease and ectopic pregnancy; they are a behavioural marker and biomedical cofactor for hiv transmission. these results, and the wide confidence intervals around most estimates, argue for improved data input though periodic prevalence surveys beyond key populations. our findings also highlight a largely hidden burden of untreated chlamydia that merits intensification of control efforts beyond routine clinical services. screening should be intensified in primary care settings, among key populations, within antenatal care and for youth, e.g. via school-based clinics. new diagnostic and delivery approaches and affordable point-of-care tests29 should facilitate clinic-based and non-clinic-based screening thus improving treatment coverage and surveillance and reducing disease burden. references country coordinating mechanism mongolia. proposal hiv/aids to the global fund to fight aids, tuberculosis and malaria, round 2. ulaanbaatar; 2002 (http://docs.theglobalfund.org/program-documents/gf_pd_001_f771ef3f-1539-4470-8678-178997acf2bd.pdf). mongolia ministry of health & hiv/sti program. mongolian national strategic plan on hiv/aids/stis 2010–2015. ulaanbaatar; 2010 (http://www.wpro.who.int/mongolia/topics/sexually_transmitted_infections/nsp_hiv_aids_eng.pdf?ua=1). mongolia ministry of health & hiv/sti program. country progress report mongolia, reporting period 1 january 2012–31 december 2013. ulaanbaatar; 2014 (http://files.unaids.org/en/dataanalysis/knowyourresponse/countryprogressreports/2014countries/mng_narrative_report_2014.pdf, accessed 23 october 2017). mongolia center for health development. health statistical information annual reports. ulaanbaatar; 2016 (http://www.chd.mohs.mn/images/pdf/english%20indicator-2015.pdf, accessed 23 october 2017). baigalmaa j, erdenechimeg c, narantuya j, bulbul a, tugsjargal j, dolgion e, et al. increasing syphilis notifications in mongolia: results from national surveillance for 2001-2011. west pac surveill response. 2012 12 21;3(4):86–93. pmid:23908947 doi:10.5365/wpsar.2012.3.2.008 purevdawa e, moon td, baigalmaa c, davaajav k, smith ml, vermund sh. rise in sexually transmitted diseases during democratization and economic crisis in mongolia. int j std aids. 1997 jun;8(6):398–401. pmid:9179652 doi:10.1258/0956462971920190 mongolia national center for communicable diseases aids/sti surveillance and research department. situation of sexually transmitted infections in mongolia, 2001–2010. mongolia; 2011. world health organization. review of the surveillance system for sexually transmitted infections in mongolia. mongolia; 2014 july. korenromp el, mahiané g, rowley j, nagelkerke n, abu-raddad l, ndowa f, el-kettani a, el-rhilani h, mayaud p, chico rm, pretorius c, hecht k, wi t. estimating prevalence trends in adult gonorrhoea and syphilis prevalence in lowand middle-income countries with the spectrum-sti model: results for zimbabwe and morocco from 1995 to 2016. sex transm infect. 2017 march 21;sextrans-2016–052953. pmid:28325771 doi:10.1136/sextrans-2016-052953 newman l, rowley j, vander hoorn s, wijesooriya ns, unemo m, low n, et al. global estimates of the prevalence and incidence of four curable sexually transmitted infections in 2012 based on systematic review and global reporting. plos one. 2015 12 08;10(12):e0143304. pmid:26646541 doi:10.1371/journal.pone.0143304 chico rm, mayaud p, ariti c, mabey d, ronsmans c, chandramohan d. prevalence of malaria and sexually transmitted and reproductive tract infections in pregnancy in sub-saharan africa: a systematic review. jama. 2012 may 16;307(19):2079–86. pmid:22665107 doi:10.1001/jama.2012.3428 orroth kk, korenromp el, white rg, changalucha j, de vlas sj, gray rh, et al. comparison of std prevalences in the mwanza, rakai, and masaka trial populations: the role of selection bias and diagnostic errors. sex transm infect. 2003 apr;79(2):98–105. pmid:12690128 doi:10.1136/sti.79.2.98 el-kettani a, mahiané g, bennani a, abu-raddad l, smolak a, rowley j, et al. trends in adult chlamydia and gonorrhea prevalence, incidence and urethral discharge case reporting in morocco over 1995 to 2015 – estimates using the spectrum-sexually transmitted infection model. sex transm dis. 2017 sep;44(9):557–64. pmid:28806354 doi:10.1097/olq.0000000000000647 national statistics office of mongolia, unicef, united nations population fund (unfpa). multiple indicator cluster survey in mongolia, 2013–2014. report. mongolia: unicef2014 (http://mics.unicef.org/files?job=w1siziisijiwmtyvmdmvmzavmtkvmjkvmdgvodi3l01vbmdvbglhxziwmtnfmtrftuldu19fbmdsaxnolnbkzijdxq&sha=71927f28ca7b8642, https://mics-surveys-prod.s3.amazonaws.com/mics5/east%20asia%20and%20the%20pacific/mongolia/2013-2014/final/mongolia%202013-14%20mics-siss_english.pdf). schwebke jr, aira t, jordan n, jolly pe, vermund sh. sexually transmitted diseases in ulaanbaatar, mongolia. int j std aids. 1998 jun;9(6):354–8. pmid:9671251 doi:10.1258/0956462981922269 binderya g, editor. etiology of urethral discharge in ulaanbaatar. ulaanbaatar: tackling infectious diseases, information for action; 2016. amindavaa o, kristensen s, pak cy, khalzan d, chultemsuren b, randall as, et al. sexually transmitted infections among pregnant women attending antenatal clinics in mongolia: potential impact on the mongolian hiv epidemic. int j std aids. 2005 feb;16(2):153–7. pmid:15807944 doi:10.1258/0956462053057693 gantumur t, solongo a, iliza a, khandsuren b, ider d, narantsetseg v. report of the sti epidemiological study among pregnant women attending anc-2008. ulaanbaatar; 2008. korenromp el, sudaryo mk, de vlas sj, gray rh, sewankambo nk, serwadda d, et al. what proportion of episodes of gonorrhoea and chlamydia becomes symptomatic? int j std aids. 2002 feb;13(2):91–101. pmid:11839163 doi:10.1258/0956462021924712 erdenetungalag e, korenromp el, badrakh j, zayasaikhan s, baya p, orgiokhuu e, jadambaa n, munkhbaatar s, khishigjargal d, khad n, mahiané g, davaalkham j, taylor m. estimating adult female syphilis prevalence, congenital syphilis case incidence and adverse birth outcomes due to congenital syphilis using the spectrum sexually transmitted infection surveillance tool, mongolia 2000–2016. submitted for publication (september 2017). tugsdelger s, amgalan t, baasansuren a, erdenetuya g, ganbold n, jugderjav b, et al. second generation hiv surveillance: mongolia. mongolia, ulaanbaatar: ministry of health of mongolia, world health organization, global fund supported project on aids and tb; 2005 (http://www2.wpro.who.int/nr/rdonlyres/654921dc-89aa-40c6-92d3-c97ea1c8afc4/0/finalsgss2005.pdf, ). baigalmaa c, byambaa c. second generation hiv/sti surveillance report, 2002 ulaanbaatar 2002. mongolia ministry of health, mongolia global fund supported project on aids and tb. second generation hiv/sti surveillance report, 2009. mongolia: ulaanbatar; 2009 (http://www.aids.mn/files/docs/sudalgaanii%20tailan2009.pdf, accessed 23 october 2017). mongolia national center for communicable diseases aids/sti surveillance and research department. annual reports of hiv, aids, sti cabinet registration. ulaanbaatar; 2017. national center for communicable diseases, mongolia ministry of health. national guideline on hiv/aids and sti diagnosis and treatment care services. approved by health ministerial order #429. ulaanbaatar; 2009, amended in 2014 by the health ministerial order #278 (http://http://www.mohs.mn/uploads/files/4a760aed1f3a200a96b7b0dd9a6ce07a.pdf). national statistics office of mongolia, unicef, united nations population fund (unfpa). multiple indicator cluster survey in mongolia 2010 (mics-4)report. mongolia: unicef2013 (https://mics-surveys-prod.s3.amazonaws.com/mics4/east%20asia%20and%20the%20pacific/mongolia/2010/final/mongolia%202010%20mics_english.pdf). bulbul a, erdenetungalag e, davaalkham j, editors. mongolia hiv estimation using the spectrum aids incidence model. 1st national conference of female scientists: "tackling public health issues-female scientists' role in solution"; 2017 may; ulaanbaatar: mongolian female scientists' association. montana ls, mishra v, hong r. comparison of hiv prevalence estimates from antenatal care surveillance and population-based surveys in sub-saharan africa. sex transm infect. 2008 aug;84 suppl 1:i78–84. pmid:18647871 doi:10.1136/sti.2008.030106 global health sector strategy on sexually transmitted infections 2016–2021. towards ending stis. report. report no.: who/rhr/16.09. geneva: world health organization; 2016 june (http://apps.who.int/iris/bitstream/10665/246296/1/who-rhr-16.09-eng.pdf?ua=1). report on global sexually transmitted infection surveillance 2015. geneva: world health organization; 2016 august (http://www.who.int/reproductivehealth/publications/rtis/stis-surveillance-2015/en/). rapid health assessments of evacuation centres in areas affected by typhoon haiyan field investigation report ruth alma ramos,ab vikki carr de los reyes,b ma nemia sucalditob and enrique tayagb a field epidemiology training program, epidemiology bureau, department of health, sta cruz, manila, philippines. b department of health, sta cruz, manila, philippines. correspondence to ruth alma ramos (email: ruthmd_ramos@yahoo.com). to cite this article: ramos ra et al. rapid health assessments of evacuation centres in areas affected by typhoon haiyan. western pacific surveillance and response journal, 2015, 6(suppl 1):39–43. doi:10.5365/wpsar.2015.6.2.hyn_003 abstract introduction: typhoon haiyan caused thousands of deaths and catastrophic destruction, leaving many homeless in region 8 of the philippines. a team from the philippine field epidemiology training program conducted a rapid health assessment survey of evacuation centres severely affected by haiyan. methods: a descriptive study was conducted whereby a convenience sample of evacuation centres were assessed on the number of toilets per evacuee, sanitation, drinking-water, food supply source and medical services. results: of the 20 evacuation centres assessed, none had a designated manager. most were located in schools (70%) with the estimated number of evacuees ranging from 15 to 5000 per centre. only four (20%) met the world health organization standard for number of toilets per evacuee; none of the large evacuation centres had even half the recommended number of toilets. all of the evacuation centres had available drinking-water. none of the evacuation centres had garbage collection, vector control activities or standby medical teams. fourteen (70%) evacuation centres had onsite vaccination activities for measles, tetanus and polio virus. many evacuation centres were overcrowded. conclusion: evacuation centres are needed in almost every disaster. they should be safely located and equipped with the required amenities. in disaster-prone areas such as the philippines, schools and community centres should not be designated as evacuation centres unless they are equipped with adequate sanitation services. introduction immediately after a disaster, a rapid health assessment is usually conducted to determine basic health needs of the affected population to identify response priorities. without rapid assessments, significant gaps or overlapping assistance may occur that can further burden the affected population.1 rapid health assessments have been conducted by the philippine field epidemiology training program (fetp) since 1990 for events such as typhoons, volcanic eruptions, flash floods and man-made disasters such as a chemical spill from a sunken ship, a trash slide in a dump site and the post-armed conflict in zamboanga city. prior to typhoon haiyan in november 2013, evacuation centres in schools, churches and public buildings were designated by the local government, and the public was encouraged to evacuate. in november 2013, two weeks after typhoon haiyan, a team from the philippine fetp conducted a rapid health assessment of evacuation centres in region 8 to assess the health needs of the affected population, to inspect the facilities available at each evacuation centre and to make recommendations for improvements to evacuation centres. methods we conducted rapid health assessments between 22 november and 1 december 2013, two weeks after typhoon haiyan’s landfall. we used the health assessment tool that had been developed by previous fetp fellows, although additional variables were added that were specific to the haiyan response. the assessment tool collected information on demographics, nutritional and immunization status of the evacuees, food and water sources, living conditions, health services and environmental sanitation of each evacuation centre. a guide on data collection, including the definition of terms, was produced and distributed to all assessors. two teams of five members conducted the evaluations. twenty evacuation centres that were readily accessible in region 8 (the area of maximum typhoon devastation) were selected by convenience sampling. face-to-face interviews were conducted with either the village leader, school principal or a teacher, government staff and evacuees in each evacuation centre. members of the evaluation team counted toilets, verified food and water sources and conducted a visual inspection. evacuation centres were divided into large (≥ 1000 evacuees), medium (250–999) and small (2 data were entered and analysed using microsoft excel. results of the 20 evacuation centres assessed, 14 (70%) were schools and six (30%) non-schools (tent city, church, orphanage, civic/convention centres and barge). the estimated number of evacuees in each evacuation centre ranged from 15 to 5000 (figure 1). there were six large, six medium and eight small evacuation centres (table 1). figure 1. location of evacuation centres assessed by type and population size, post-typhoon haiyan, region 8, the philippines, november 2013 click to download figure 1. jpg, 679kb table 1. needs assessment and services available in evacuation centres post-typhoon haiyan, region 8, the philippines, november 2013 click to download table 1. jpg, 728kb none of the evacuation centres had a designated manager or a registry list of evacuees. therefore data on the age, gender, former residence or health status of evacuees were unavailable. similarly, documentation of the number of deaths, number of injuries and number of medical consultations was not available, even in centres where medical consultation teams had visited. four of the 20 evacuation centres (20%) met the who standard for number of toilets. nine (45%) had at least half the recommended number of toilets; none of the large evacuation centres had at least half the recommended number of toilets. two of the 14 schools (14%) and two of the six non-schools (33%) had an adequate number of toilets per evacuee(table 1). all evacuation centres had available drinking-water; nine (45%) had a functioning local water system, three had rationed bottled water, five were using water bladders (refilled with local spring water), one was using collapsible refillable water containers and one had a deep well (table 1). none of the evacuation centres had performed post-disaster water quality testing at the time of assessment. seven (35%) evacuation centres did not provide food to evacuees, including two of the five large evacuation centres (40%). four of the eight (50%) small evacuation centres provided food irregularly. none of the evacuation centres had garbage collection, vector control activities or standby medical teams (table 1). fourteen (70%) evacuation centres had onsite vaccination activities for measles, tetanus and polio. four of the five (80%) large evacuation centres conducted vaccination activities. three evacuation centres (15%) had mental health services and psychosocial services (table 1). many evacuation centres appeared overcrowded. at one evacuation centre at a school in tacloban city, there was an average of 10 families per room. some schools serving as evacuation centres were also damaged by the typhoon. discussion in a study of the 2011 great east japan earthquake, it was found that three factors influenced the health of evacuees: (1) presence of persons in charge of providing health services; (2) size of evacuation centre; and (3) status of water supply.3 in this study, there were no managers at any evacuation centre and no list of evacuees. the size of the evacuation centres varied, yet the supply of drinking-water was adequate. although managing evacuation centres is a local government unit’s responsibility in the philippines, most of the affected municipalities suffered loss of staff as a result of haiyan and so their capacity to provide services was diminished. having managers who monitored the migration in and out of evacuation centres and the services that were being provided would have allowed for initial health assessments to provide better information on the population. managers could also have assisted in the efficient provision of services from governmental health staff and nongovernmental organizations. in a survey conducted in evacuation centres two weeks after the great east japan earthquake,3 it was found that promptly placing persons in charge of health matters at evacuation centres was a practicable and effective measure, and allocating of at least one such person per 50 evacuees was desirable. another study reported that initially after an earthquake, most evacuation centres were managed by local teachers or volunteers; however, as the evacuation period lengthened, evacuees themselves started taking initiatives to manage the centres.4 the size of evacuation centres was an important determinant of quality of services provided in japan post-disaster,3 with smaller centres offering better health conditions for residents. smaller centres seemed to function better due to better interpersonal relationships and an environment that enabled the emergence of strong leadership.5 in our study, service quality varied among centres of all sizes, with the large centres providing good vaccination services but limited food and poor sanitation services. none of the evacuation centres had garbage disposal or vector control activities; therefore, evacuees were at risk of contracting diarrhoeal and vector-borne diseases. the situation of overcrowding in evacuation centres and presence of breeding sites for mosquitoes may lead to increased transmission of diseases with the potential for large outbreaks. although all evacuation centres in this study had access to water, no water quality testing had been conducted at the time of the assessments. minimum standards for humanitarian services include not only a sufficient quantity of water but also disinfection of the water sources to reduce risk of contamination and the threat of an outbreak of diarrhoeal disease.6 food supply varied in evacuation centres. lack of food is particularly problematic in large evacuation centres where alternative sources of food may be limited. food was more commonly supplied to school evacuation centres compared with non-school centres. following the 2004 tsunami in aceh, indonesia, community-based health evaluations concluded that access to sanitation and clean water as well as primary care services were the most essential health-related services.7 one toilet per 20 individuals is the recommended ratio in an evacuation centre housing people for more than a few days,2 yet in our study, none of the large evacuation centres met this recommended ratio. schools are often used as evacuation centres in the philippines as these are thought to have the capacity to shelter large numbers of people. however, toilet volume in schools is designed to accommodate a specific number of students for a limited number of hours each day. only 14% of schools had the recommended number of toilets per person. there were some limitations to this study. the assessments were conducted quickly, therefore, accuracy of the data may have been compromised. managers were not in place in evacuation centres; hence, the information obtained was prone to bias as many estimates were used. there could have been an underestimation of the volume of services needed because only an estimation of population figures was used. the centres were purposively chosen and therefore may not have been representative of all evacuation centres. certain centres were not assessed due to issues of access and security. evacuation centres are needed in almost every disaster. in disaster-prone areas in the philippines, evacuation centres should be safely located and equipped with adequate services and a proper management structure. as evacuation centres are already identified in every municipality in the philippines, we recommend that a management team be assigned to each evacuation centre with staff from municipal health offices and rural health units. since schools are primarily used as evacuation centres in the philippines, school principals or head teachers could also be on the management team. only schools equipped with adequate sanitation services should be used as evacuation centres. registration and information management is important in every evacuation centre. a logbook should be available at all evacuation centres to register all evacuees indicating the name, age, sex, family head, place of origin and members of the family. this would give details on the profile of disaster victims and of family members with special needs. the goal of better managed evacuation centres can be achieved through advanced planning and preparation that include well-defined leadership and responsibility. conflicts of interest none declared. funding none. acknowledgements we are grateful for the cooperation and support of the head and staff of regional epidemiology and surveillance unit from region 8, fetp batches 23 and 24 and fetp graduates who conducted these assessments and the partcipants from the evacuation centres. we also thank dr michael o’reilly for his review. references arii m. rapid assessment in disasters. japan medical association journal, 2013, 56(1):19–24. available from: https://www.med.or.jp/english/journal/ pdf/2013_01/019_024.pdf [accessed 18 august 2015]. rapid health assessment protocols for emergencies. geneva, world health organization, 1999. available from: http://www.wpro.who.int/vietnam/ publications/rapid_health_assessment_protocols.pdf [accessed 18 august 2015]. tokuda k et al. a survey conducted immediately after the 2011 great east japan earthquake: evaluation of infectious risks associated with sanitary conditions in evacuation centers. journal of infection and chemotherapy, 2014, 20:498–501. doi:10.1016/j.jiac.2014.04.012 pmid:24861538 ranghieri f, ishiwatari m, editors. learning from megadisaster: lessons from the great east japan earthquake. washington, dc, the world bank, 2014. available from: https://openknowledge.worldbank.org/handle/10986/18864 [accessed 18 august 2015]. the great east japan earthquake: a story of a devastating natural disaster, a tale of human compassion. manila, world health organization regional office for the western pacific, 2012. available from: http://www.wpro.who.int/publications/ docs/japan_earthquake.pdf [accessed 18 august 2015]. humanitarian charter and minimum standards in disaster response. geneva, the sphere project, 2011. available from: http://www.sphereproject.org/ [accessed 18 august 2015]. brennan rj, rimba k. rapid health assessment in aceh jaya district, indonesia, following the december 26 tsunami. emergency medicine australasia, 2005, 17:341–350. doi:10.1111/j.1742-6723.2005.00755.x pmid:16091096 international health regulations (2005) facilitate communication for in-flight contacts of a middle east respiratory syndrome case, hong kong special administrative region, 2014 case report poon kwok-ming,ab wong miu-ling,ab leung yiu-hong,a sin ka-wai,a to may-kei lizaa and chuang shuk-kwana a surveillance and epidemiology branch, centre for health protection, department of health, hong kong special administrative region. b field epidemiology training programme, hong kong special administrative region. correspondence to poon kwok-ming (e-mail: mo_fetp1@dh.gov.hk). to cite this article: poon et al. international health regulations (2005) facilitate communication for in-flight contacts of a middle east respiratory syndrome case, hong kong special administrative region, 2014. western pacific surveillance and response journal, 2015, 6(1):62–65. doi:10.5365/wpsar.2015.6.1.008 abstract the international health regulations (ihr) (2005) require world health organization member states to notify events fulfilling two of four criteria: (1) serious public health impact; (2) unusual or unexpected event; (3) significant risk of international spread; or (4) significant risk of international travel or trade restrictions.1 in-flight transmission of infections like severe acute respiratory syndrome is well documented.2 with the enormous amount of air travel today, the risk of increasing in-flight transmission and subsequent international spread of infections are increasing. prompt notification and information sharing under the ihr mechanism is critical for effective contact tracing and prompt control measures. we report on a case of in-flight exposure to an infection with significant public health risks that was successfully resolved using ihr (2005) guidelines. introduction the government of the hong kong special administrative region launched the preparedness plan for middle east respiratory syndrome (mers) in june 2014, upholding established principles of rapid control of disease transmission and responsive risk communication.3 it sets out a multidisciplinary disease control framework involving the department of health, hospital authority, the travel industry and airlines, etc. under the plan, the centre for health protection of the department of health developed protocols for case and contact management. its risk-based classifications of “close” and “other” contacts determine subsequent public health actions, including quarantine/travel restrictions for close contacts, medical surveillance, referral, isolation and laboratory investigation. on 2 october 2014, the world health organization (who) western pacific regional office informed through the ihr mechanism of hong kong special administrative region that a chinese national, whose point of origin was hong kong special administrative region, sat near a mers case on a flight from qatar to austria. subsequent investigations revealed that a hong kong special administrative region tour group of 42 members was on the same flight. we report investigations and public health measures for these in-flight contacts while they were still on their journey in europe. methods we obtained information on the index case and a passenger list detailing points of origin and seat numbers from the who regional office through ihr communications. contact tracing was performed according to the preparedness plan for mers whereby “close contacts” were defined as passengers seated in the same row or up to two rows in front of/behind the case, and “other contacts” as other passengers seated in the same cabin or passengers from the same tour group. the airline provided the aircraft seating plan, and the travel agency provided a tour member list. we crosschecked the tour member list with the list provided by the who regional office and the aircraft seating plan. the health conditions of all contacts were ascertained over the phone and health advice was provided. using the international health regulations (ihr) mechanism, we informed relevant overseas health authorities of our epidemiological findings and collaborated with them to implement control measures for the contacts. we continued medical surveillance after the contacts had returned to hong kong special administrative region and provided risk communications to hong kong special administrative region general public. results the index case was a citizen of saudi arabia who had symptoms of upper respiratory tract infection and fever from 17 september 2014. she was still symptomatic when she travelled on a flight from qatar to austria on 22 september. austrian health authorities confirmed she was a case of mers on 29 september. on 2 october, the who western pacific regional office informed through the ihr mechanism of hong kong special administrative region that a hong kong special administrative region citizen who had been seated within two rows of the index case on the flight. the passenger list included an additional 42 passengers with hong kong special administrative region as their points of origin. we classified the hong kong special administrative region citizen (seat 12d) as a close contact (within two rows of index case: seat 10f); he was the tour guide of the 42 other hong kong special administrative region passengers. twenty of these passengers were seated in the same cabin as the index case, however all 42 tour members were managed as other contacts (figure 1). all contacts were travelling through europe and had reached poland on 1 october. on 2 october (day 10 of last exposure from the flight), we ascertained that none had been sick since 22 september. we advised the tour guide to minimize contact with the group and for the whole group to wear face masks during their journey. we issued a press release on 2 october. figure 1. seating plan of the aircraft from qatar to austria click to download figure 1. jpg, 246kb we alerted poland health authorities on 2 october to the whereabouts of the tour group. the return flight of the tour guide was postponed to 6 october (day 14 – maximum incubation period of mers) to avoid potential risk to other travellers in case the tour guide developed symptoms during his flight back to hong kong special administrative region. poland health authorities conducted medical surveillance of the tour guide who voluntarily stayed in a hotel in poland until 6 october. he did not develop symptoms. the 42 tour members boarded the scheduled return flight departing from poland on 3 october. with assistance from the airline, we arranged for them to sit at the back of the aircraft and stay on board after arrival at hong kong special administrative region for health screening. all were asymptomatic upon return to hong kong special administrative region. their health status was monitored by telephone interview until 20 october (day 28 – twice the maximum incubation period of mers) with good compliance. a tour member who reported respiratory symptoms on 6 october was promptly isolated; she tested negative for mers. through the ihr mechanism, we communicated our actions to poland and austria health authorities and other ihr colleagues in europe. discussion international air travel of a symptomatic mers case constitutes a potential risk of international spread of mers-coronavirus and sufficient criteria for ihr notification.1 with the successfully triggered ihr mechanism, the who regional office informed through ihr mechanism of hong kong special administrative region within three days of diagnosis of the case. this communication facilitated effective contact tracing and prompt implementation of control measures and was timely in preventing the tour guide from boarding the return flight. communication under the ihr mechanism has been widely adopted and used in the western pacific region since the endorsement of ihr in 2007, especially regarding information on emerging infectious diseases. the hong kong special administrative region has been active regarding notification and information exchange with who.4 the ihr mechanism has facilitated contact tracing for infectious diseases among member states in the past.4 well-established channels of communication under ihr have also enabled efficient collaboration between health authorities across continents. in this case, smooth implementation of control measures required a great deal of international coordination. while poland’s health authorities took charge of necessary local measures, we helped to reschedule the tour guide’s return flight. this efficient collaboration and timely arrangement stopped him from boarding another international flight, reducing the potential risks if he had in-flight onset of symptoms. under the preparedness plan for mers, the response was based on risk-based contact management. only the tour guide’s return flight was postponed until day 14; the other tour members travelled back to hong kong special administrative region as scheduled. the multidisciplinary disease control framework among the department of health, the travel industry and airlines allowed for smooth communications and precautionary travel arrangements for the tour members on their return flight and the subsequent return of the tour guide. the preparedness plan also resulted in immediate referral, isolation and testing of the symptomatic tour member after their return, relying on coordinated efforts among the department of health, hospital authority and the ambulance centre under the fire services department. although there are international risk assessment guidelines regarding aircraft transmission of various infectious diseases,5 guidelines for emerging infections like mers are still evolving and differ by country. for instance, the public health agency of canada considers passengers in the same row and up to three rows in front of/behind as priority, recommending all passengers should be followed up when feasible;6 the health protection agency in the united kingdom defines close contacts as those sitting in the same row and up to two rows in front of/behind.7 who defines close contacts as those travelling together with a mers case in any kind of conveyance.8 such variations result in different management of contacts among countries. despite the small risk to the 42 tour members on board, we took a precautionary approach and managed them all as other contacts, taking into account the uncertainties of unrecognized in-flight exposure in the same cabin and the common practice of seat swapping among tour group members. we also adopted a more stringent approach than most international guidelines for the length of contact tracing. who recommends that close contacts should be monitored for the appearance of respiratory symptoms for 14 days after last exposure;9 we decided to extend health monitoring to 28 days, taking into account the potential risks of hidden chains of transmission within the tour group and the availability of our resources. we acknowledged the inter-organizational differences in risk assessment and extent of information sharing and adhered to our protocol. we extended our scope of contact tracing and identified additional contacts by combining all sources of information from who, the airline and the tour member list obtained from the travel agency. fortunately, all other contacts were from the same tour group, greatly facilitating investigation and control measures. conclusions three lessons were learnt from this public health event. first, timely information sharing and communications under ihr mechanisms greatly facilitated our contact tracing and management by allowing efficient collaboration with overseas health authorities and the who regional office. second, effective contact tracing enabled prompt control measures for flight rescheduling and precautionary travel arrangements to minimize further disease transmission. third, a well-established preparedness plan, including a protocol for contact management, ensured efficient management of in-flight contacts of an overseas mers case. conflicts of interest none declared. funding none. acknowledgement we would like to thank all staff of the hong kong special administrative region surveillance and epidemiology branch of the centre for health protection who contributed in the investigation and control of this outbreak. we would also like to thank dr alain moren and dr marta valenciano for their advice in report writing. references: who guidance for the use of annex 2 of the international health regulations (2005). decision instrument for the assessment and notification of events that may constitute a public health emergency of international concern. geneva, world health organization, 2008. available from: http://www.who.int/ihr/revised_annex2_ guidance.pdf [accessed 19 february 2015]. olsen sj et al. transmission of the severe acute respiratory syndrome on aircraft. new england journal of medicine, 2003, 349:2416–2422. doi:10.1056/nejmoa031349 pmid:14681507 press release: preparedness plan for middle east respiratory syndrome launched. hong kong special administrative region, centre for health protection, department of health, 12 june 2014. available from: http://www.chp.gov.hk/en/ view_content/35026.html [accessed 24 november 2014]. fearnley e, li a. international health regulations (2005): public health event communications in the western pacific region. western pacific surveillance and response journal, 2013, 4:26–27. doi:10.5365/wpsar.2013.4.3.003 pmid:24319610 ecdc technical report: risk assessment guidelines for infectious diseases transmitted on aircraft. stockholm, european centre for disease prevention and control, 2009. available from: http://www.hpsc.ie/a-z/vectorborne/viral haemorrhagicfever/guidance/file,4661,en.pdf [accessed 19 february 2015]. public health management of human illness associated with middle east respiratory syndrome coronavirus (mers-cov): interim guidance for containment when imported cases with limited human-to-human transmission are suspected/confirmed in canada. ontario, public health agency of canada, 2013. available from: http://www.phac-aspc.gc.ca/eri-ire/coronavirus/guidance-directives/mers-cov -srmo-2-eng.php [accessed 24 november 2014]. health protection agency uk novel coronavirus investigation team. evidence of person-to-person transmission within a family cluster of novel coronavirus infections, united kingdom, february 2013. euro surveillance: european communicable disease bulletin, 2013, 18(11):pii=20427. pmid:23517868 interim surveillance recommendations for human infection with middle east respiratory syndrome coronavirus (as of july 2014). geneva, world health organization, 2014. available from: http://www.who.int/csr/disease/ coronavirus_infections/interimrevisedsurveillancerecommendations_ ncovinfection_14july2014.pdf?ua=1 [accessed 24 november 2014]. who guidelines for investigation of cases of human infection with middle east respiratory syndrome coronavirus (mers-cov) (july 2013) geneva, world health organization, 2013. available from: http://www.who.int/csr/disease/coronavirus_ infections/mers_cov_investigation_guideline_jul13.pdf?ua=1 [accessed 24 november 2014]. characteristics of individuals with tuberculosis in an urban, poor population in osaka city, japan — a case-control study original research akira shimouchi,1,3 yuko tsuda,2 jun komukai,2 kenji matsumoto,2 hideki yoshida,2 akihiro ohkado3 nishinari district public health office, osaka city, japan. osaka city public health office, japan. the research institute of tuberculosis, japan anti-tuberculosis association, tokyo, japan. correspondence to akira shimouchi (email: ak-shimouchi@city.osaka.lg.jp). to cite this article: shimouchi a, tsuda a, komukai j, matsumoto k, yoshida h, ohkado a. characteristics of individuals with tuberculosis in an urban, poor population in osaka city, japan — a case-control study. western pac surveill response j. 2020 mar;11(1). doi:10.5365/wpsar.2018.9.1.005 objective: to identify individual characteristics related to the development of pulmonary tuberculosis (ptb) among residents in the airin area (airin), osaka city, japan. methods: we conducted a retrospective case-control study of individual characteristics potentially related to the development of ptb by comparing ptb patients and residents without tuberculosis (tb) in airin. the following binominal data of characteristics were compared: age (65); body mass index (bmi) (18.5); diabetes mellitus (diagnosed or not diagnosed); smoking (currently smoking any amount or not smoking); and alcohol use (currently drinking any amount or not drinking). results: we compared the individual characteristics of 192 ptb patients notified from january 2015 to december 2018 and 190 residents of supportive houses who attended a health education programme from april 2016 to march 2018. univariable analysis showed that the following characteristics were significantly related with ptb: bmi p < 0.001) and current alcohol use (or: 1.88; 95% ci: 1.24–2.85, p = 0.003). multivariable analysis showed similar results: bmi p < 0.001) and current alcohol use (aor: 2.15, 95% ci: 1.36–3.42, p = 0.001). discussion: undernutrition and alcohol use are individual characteristics associated with ptb among residents in airin, osaka city. to strengthen the tb control programme further, it is suggested to develop new programmes for primary prevention. osaka city had the highest tuberculosis (tb) notification rate (32.4 per 100 000) of any city in japan (national average: 13.3 per 100 000) in 2017.1 the rate is particularly high in the densely populated airin area, where 21 500 residents live in 0.62 km2. in 2017, 88 tb patients were notified (409 notifications per 100 000 people).2 according to a 2015 city government survey, 43% of the residents of airin are enrolled in a public assistance programme, 52% are pensioners and daily-paid labourers without public assistance and some without health insurance, and 5% are homeless individuals living in shelters, on the streets or in parks.2 public assistance is provided for people who are unable to maintain a minimum standard of living. the recent increase in the number of persons enrolled in the public assistance programme in airin is due in part to the ageing of daily-paid labourers.3 to apply for public assistance, an individual or supporter must meet the following eligibility conditions: (i) there are no savings, insurance, assets or property; (ii) monthly income is below the local minimum wage; and (iii) there are no relatives to provide financial support. people who meet those conditions are entitled to receive a standard amount of cash, which is close to the local minimum wage. among other services, free medical services are available for all persons on public assistance, as long as a medical board agrees to the appropriateness of each treatment during a monthly review. with regard to the housing condition in airin, 89% of residents lived in apartments, the majority of which did not have a toilet or bath in each room, and 11% lived in detached houses or semi-detached houses in 2005.4 since then, the number of apartments has increased, but reports on housing conditions specific to airin have not been published. certain risk factors can impact an individual’s vulnerability to developing tb. reported risk factors for tb can be divided into two groups: socio-environmental factors (e.g. lack of education, low income, unemployment, overcrowding and poor ventilation in the houses) and individual characteristics (e.g. 65 years and older, tobacco use, alcohol use, diabetes mellitus, undernutrition and weak immune status).5–10 in airin, the tb control programme implemented by the osaka city government has so far emphasized active case finding by chest x-ray and patient support. free medical services and residences are provided for persons who are low income or homeless, in collaboration with the district social welfare office.11 to strengthen the tb programme further, we consider that ascertaining the individual characteristics of the population at the highest risk of developing tb would lead to more effective health education programmes for the prevention and early detection of tb. this study aims to identify individual characteristics related to the development of pulmonary tb (ptb) among residents in airin, osaka city, japan. methods we conducted a retrospective case-control study of individual characteristics potentially related to the development of ptb by comparing ptb patients and residents without tb in airin, osaka city, japan. selection of cases cases were ptb patients registered in airin from january 2015 to december 2018. we excluded patients with extrapulmonary tb in this analysis because they are bacteriologically confirmed less frequently than ptb patients. furthermore, the clinical diagnosis of extra-pulmonary tb, especially tb pleuritis (pleural effusion as a chest x-ray finding) is less certain than that of ptb. all tb patients are diagnosed at medical facilities and reported to the osaka city public health office. the tb diagnostic committee of osaka city confirms ptb diagnoses by reviewing radiologic (chest x-ray with or without computed tomography [ct] films) bacteriological and clinical test results. after a tb patient is registered, public health nurses (phns) in each district provide individualized support until treatment completion. patients are either bacteriologically confirmed or clinically diagnosed. bacteriologically confirmed ptb is defined as the presence of mycobacterium tuberculosis in sputum using smear, culture, and identification by immuno-chromatography or nucleic acid amplification methods. clinically diagnosed ptb is defined as a physician’s decision based on clinical evidence, such as a chest x-ray, ct and interferon-gamma release assays (igra). lastly, we excluded homeless ptb patients because it is too difficult to obtain agreement to collect data on individual characteristics of homeless persons as controls within the framework of current tb control activities. data collection for ptb patients to collect data on the targeted characteristics of ptb patients, phns used structured patient cards developed and updated by the osaka city public health office. printed on each card was a list of signs and symptoms such as cough, fever, haemoptysis, general malaise, loss of body weight, difficulty breathing, chest pain and loss of appetite. for each ptb patent, phns looked for signs and symptoms. if a patient showed any sign or symptom, phns asked when the sign or symptom started and recorded the date accordingly. smoking and drinking habits were self-reported. diabetes mellitus was diagnosed by a physician without distinction of type 1 or 2. phns measured body weight and height of the patient at the initial interview. ptb patients who did not have a complete data set for targeted characteristics were excluded to increase the reliability of the statistical analysis. body mass index (bmi) is a measure of body weight (kg) divided by height (m). low bmi is known as a proxy indicator of malnutrition, contributing to tb development. however, as body weight loss is also a typical symptom of tb, low bmi could be a result of tb disease.12 therefore, frequency of low bmi would be overestimated as a risk factor of tb when patients with body weight loss are included. thus, to assess bmi before tb developed, we divided tb patients into two groups: patients with body weight loss before tb diagnosis and patients without body weight loss. selection of controls controls were selected from among non-ptb residents in eight “supportive houses” in airin.13 the living conditions of supportive houses – one-room apartments without bath or toilet – were similar to those of the apartments housing the ptb patients enrolled in the study – small, single rooms (4.6 m2) without toilet or kitchen. an exception is that supportive houses have staff who help residents in aspects of daily life. this may include assistance in attending clinics/hospitals and administration of prescribed drugs, as needed. in addition, they have a common room for residents where phns can hold health education sessions. data collection for controls from april 2016 to march 2018, phns compiled data on the same targeted characteristics of case controls as was used for the case patients, taking advantage of health education sessions held every two months in supportive houses. among the controls, diagnosis of diabetes mellitus was self-reported without a physician’s confirmation. to reduce the possibility of a control having ptb without symptoms, phns asked about the history of chest x-ray screening and attendance at medical facilities in the previous year. defining study group characteristics from the collected data, binomial risk factor data were defined as follows: age (65); bmi (18.5); diabetes mellitus (diagnosed or not); smoking (currently smoking any amount or not smoking); and alcohol use (currently drinking any amount or not drinking). phns recorded these data on an electronic spreadsheet. analysis univariable analysis was done to make sure that there was no statistical difference of frequency of characteristics between bacteriologically confirmed ptb patients and clinically diagnosed ones. to ascertain association between targeted characteristics and tb disease, univariable and multivariable logistic regression analyses were used to calculate the odds ratio (or) and adjusted odds ratio (aor), respectively, and their corresponding 95% confident interval (ci). we applied backward stepwise selection for multivariable analysis. a p-value of less than 5% was considered statistically significant. all statistical analyses were performed using spss version 11.0j for windows (spss inc., chicago, il, usa). ethical considerations the ethical review committee of the research institute of tuberculosis, japan anti-tuberculosis association, tokyo, japan, approved the study (authorization number: rit/irb 29–12). results overall, 337 tb patients were registered in airin from january 2015 to december 2018. there were 14 patients with extrapulmonary tb (tb pleuritis: 7, miliary tb: 2, vertebral tb: 2, skin tb: 1, cervical lymphadenitis: 2). of the 323 ptb patients, 93 were homeless and therefore excluded from the analysis, and 230 were residents of either one-room apartments or semi-detached houses (both had rental agreements with rents of semi-detached houses slightly higher). of the 230 ptb patients living in one-room apartments or semi-detached houses, 38 ptb patients with incomplete data sets were further excluded. we distinguish two types of residence: one-room apartment and semi-detached house with a few rooms. all controls were living in one-room apartments, while four of the 192 ptb patients with complete data sets were living in semi-detached houses (figure 1). click to download figure 1. jpg, 327kb of the 192 ptb patients, 141 were on public assistance, and 51 were not on public assistance. there was no statistical difference in frequencies of characteristics between these two groups except for sex and age. ptb patients not on public assistance had higher rates of females (18% vs 3%) and persons aged table 1). click to download table 1. jpg, 211kb phns interviewed 215 residents in eight supportive houses to determine eligibility for inclusion as controls. two residents receiving ongoing tb treatment were excluded. the interviews indicated that the prevalence of tb was 2/215 (0.93%) or 930 per 100 000 population, which is higher than the tb notification rate in the entire airin area. subsequently, 23 residents with incomplete data on characteristics were excluded. the remaining 190 persons with complete data sets for targeted characteristics were chosen as controls. of them, 170 persons were on public assistance, and 20 persons were not on public assistance. there was no statistical difference in frequencies of characteristics between these two groups. of the 190 controls, 162 (85%) regularly attended medical clinics to receive care for chronic illnesses such as hypertension, liver disease, heart disease and diabetes mellitus, and 134 (71%) had a chest x-ray examination at a clinic or the tb screening programme within one year. in total, 180 (95%) had attended medical clinics or had a chest x-ray screening within one year. as of july 2019, none of the controls was notified as a tb patient in airin. for the 192 ptb patients, univariable analysis showed that the following characteristics were significantly related with ptb: bmi p < 0.001) and current alcohol use (or: 1.88, 95% ci: 1.24–2.85, p = 0.003). multivariable analysis showed similar results: bmi p < 0.001) and current alcohol use (aor: 2.15, 95% ci: 1.36–3.42, p = 0.001). in the same way, for the 146 ptb patients without body weight loss, univariable analysis and multivariable analysis showed that following characteristics were significantly related with ptb: bmi p < 0.001) and current alcohol use (or: 1.94, 95% ci: 1.24–3.03, p = 0.004), and bmi p < 0.001) and current alcohol use (aor: 2.00, 95% ci: 1.26–3.20, p = 0.004), respectively. lastly, for ptb cases with body weight loss, univariable analysis showed that bmi p < 0.001), and multivariable analysis showed that bmi p < 0.001) and diabetes mellitus (aor: 3.45, 95% ci: 1.44–8.26, p = 0.005) were significantly related with ptb (table 2). click to download table 2. jpg, 410kb discussion our research revealed two individual characteristics related to ptb among residents of airin: bmi there was no statistical difference in the proportion of any of the characteristics between patients with bacteriologically confirmed ptb and clinically diagnosed ptb (table 1). it would infer that the quality of the clinical diagnosis of ptb in the study is reliable. therefore, it would be proper to combine both ptb patient groups to increase the number of cases to obtain significant statistical results. malnutrition impairs cell-mediated immunity, which increases vulnerability to specific infectious diseases,13,14 including tb. bmi, skinfold thickness and cross-sectional arm muscle area have been used as indicators of malnutrition and are considered reliable.10 however, among them, bmi is the most easily measured, most standardized, and most frequently used in large, population-based cohort studies in many countries, including in japan.15–18 in these cohort studies, bmi of 8 and the republic of korea,19 countries that are socioeconomically close to japan. when we measure the effect of low bmi (a sign of undernutrition) on the development of tb, neither case-control nor cross-sectional studies are suitable because they cannot distinguish the direction of the cause–effect relationship. one strength of this study is that we separated ptb patients without body weight loss from those with body weight loss as a tb symptom. by doing this, we could exclude tb-related weight loss and examine bmi solely as a baseline condition before the development of tb, even if it is not perfect. as a result, low bmi was related with ptb in both patients without body weight loss as well as patients with body weight loss. thus, low bmi was confirmed to be an important factor for the development of ptb. diabetes mellitus is only in association with ptb patients with body weight loss. however, as body weight loss is a typical sign of diabetes mellitus, selection of ptb patients with body weight loss seemed to make ptb patients with diabetes mellitus over-present. as diabetes mellitus is not statistically related with ptb patients without body weight loss, we do not consider diabetes mellitus as a risk to develop ptb among residents in airin. alcohol is often consumed in confined spaces with others, such as bars, which may lead to increased exposure to tb patients.20 in airin, there are many small bars that can accommodate around 10 customers, although there is no official report. some tb patients visited bars frequently, but the majority of patients drank alcohol alone in their room. most importantly, alcohol use impairs the immune system, resulting in increased susceptibility to tb infection and reactivation of latent tb.21–24 in addition, one meta-analysis showed that people who drink more than 40 g of alcohol per day and/or have an alcohol use disorder have a substantially elevated risk of active tb.24 in our study, the volume of alcohol intake was not specified. however, for health education, it is important to communicate that reducing alcohol intake could reduce the risk of development of tb. the main limitation of this study is that the controls were not randomly selected, but they were recruited among supportive house residents who had voluntarily sought health consultations. therefore, the controls might not be representative of all residents in airin. the eight supportive houses are located in the subdivision where the tb notification rate has always been the highest in airin. thus, the tb notification rate in supportive houses was, in fact, higher than that of the entire airin area. an earlier study by the osaka social medical center25 investigated the nutrient intake of persons on public assistance who attended hospital outpatient departments from july to october 2015. according to the study, 37.6% (47/125) of the respondents drank alcohol, which is not statistically significant (p = 0.23) from the controls of our study (31.1%, 59/190). in the same manner, the average bmi of the respondents was 24.9, which is also not statistically significant from the bmi of our controls (24.4). therefore, the controls in our study may be representative of the residents in airin. we conclude that undernutrition and alcohol use are individual characteristics associated with ptb of the residents in airin, osaka city. to strengthen the tb control programme further, it is possible to develop new programmes for primary prevention. we already obtained data on bmi, alcohol use and the number of meals a day of residents who participate in the health education programmes in the eight supportive houses. therefore, as the first step, we would advise residents to reduce their daily alcohol intake and eat an appropriate number of meals, for example, three meals a day, to promote general health and to reduce the risk of development of tb. we also encourage residents with these risks to schedule regular chest x-rays for early case finding of tb disease. after the above model is proven to be effective, the same activity would be applied to other residents in airin. acknowledgements the authors are grateful for phns of nishinari district public health offices for their hard work and data collection. this research is partly supported by the research programme on emerging and re-emerging infectious diseases from japan agency for medical research and development, amed (reference number: 17fk0108114h0001). references statistics of tb in japan 2018. tokyo: japan anti-tuberculosis association; 2018 (in japanese). available from: https://jata.or.jp/english/dl/pdf/tb_in_japan_2018.pdf tuberculosis control in nishinari district: report of special tb project in nishinari district. nishinari public health office; march 2017 (in japanese). current status of public assistance programme. in: osaka city [website] (in japanese). available from: https://www.city.osaka.lg.jp/fukushi/page/0000086901.html report on basic investigation of social structure in airin. research group on community action network (can) in japan; april 2009 (in japanese). available from: http://www.npokama.org/kaihou/kaihou14/kaihou14-3.htm duarte r, lönnroth k, carvalho c, lima f, carvalho acc, muñoz-torrico m, et al. tuberculosis, social determinants and co-morbidities (including hiv). pulmonology. 2018 mar-apr;24(2):115–9. pmid:29275968 srivastava k, kant s, verma a. role of environmental factors in transmission of tuberculosis. dynamics of human health. 2015:2(4). narasimhan p, wood j, macintyre cr, mathai d. risk factors for tuberculosis. pulm med. 2013;828939. pmid:23476764 restrepo bi. diabetes and tuberculosis. microbiol spectr. 2016 dec;4(6). pmid:28084206 slama k, chiang cy, enarson da, hassmiller k, fanning a, gupta p, et al. tobacco and tuberculosis: a qualitative systematic review and meta-analysis. int j tuberc lung dis. 2007 oct;11(10):1049–61. pmid:17945060 cegielski jp, arab l, cornoni-huntley j. nutritional risk factors for tuberculosis among adults in the united states, 1971–1992. am j epidemiol. 2012 sep 1;176(5):409–22. pmid:22791739 shimouchi a. fight against urban tuberculosis problems and program effects in osaka city. kekkaku. 2009 nov;84(11):727–35 (in japanese, english abstract). pmid:19999595 bhargava a, chatterjee m, jain y, chatterjee b, kataria a, bhargava m, et al. nutritional status of adult patients with pulmonary tuberculosis in rural central india and its association with mortality. plos one. 2013 oct 24;8(10):e77979. pmid:24205052 chandra rk. nutritional deficiency and susceptibility to infection. bull world health organ. 1979;57(2):167–77. pmid:108017 chandra rk. numerical and functional deficiency in t helper cells in protein energy malnutrition. clin exp immunol. 1983 jan;51(1):126–32. pmid:6219837 corrada mm, kawas ch, mozaffar f, paganini-hill a. association of body mass index and weight change with all-cause mortality in the elderly. am j epidemiol. 2006 may 15;163(10):938–49. pmid:16641311 adams kf, leitzmann mf, ballard-barbash r, albanes d, harris tb, hollenbeck a, et al. body mass and weight change in adults in relation to mortality risk. am j epidemiol. 2014 jan 15;179(2):135–44. pmid:24173550 flegal km, kit bk, graubard bi. body mass index categories in observational studies of weight and risk of death. am j epidemiol. 2014 aug 1;180(3):288–96. pmid:24893710 murayama h, liang j, bennett jm, shaw ba, botoseneanu a, kobayashi e, et al. trajectories of body mass index and their associations with mortality among older japanese: do they differ from those of western populations? am j epidemiol. 2015 oct 1;182(7):597–605. pmid:26363514 kim sj, ye s, ha e, chun em. association of body mass index with incident tuberculosis in korea. plos one. 2018 04 18;13(4):e0195104. pmid:29668698 diel r, schneider s, meywald-walter k, ruf cm, rüsch-gerdes s, niemann s. epidemiology of tuberculosis in hamburg, germany: long-term population-based analysis applying classical and molecular epidemiological techniques. j clin microbiol. 2002 feb;40(2):532–9. pmid:11825968 imtiaz s, shield kd, roerecke m, samokhvalov av, lönnroth k, rehm j. alcohol consumption as a risk factor for tuberculosis: meta-analyses and burden of disease. eur respir j. 2017 jul 13;50(1):1700216. pmid:28705945 rehm j, samokhvalov av, neuman mg, room r, parry c, lönnroth k, et al. the association between alcohol use, alcohol use disorders and tuberculosis (tb). a systematic review. bmc public health. 2009 dec 5;9(1):450. pmid:19961618 molina pe, happel ki, zhang p, kolls jk, nelson s. focus on: alcohol and the immune system. alcohol res health. 2010;33(1–2):97–108. pmid:23579940 lonnroth k, williams bg, stadlin s. jaramillo e, dye c. alcohol use as a risk factor for tuberculosis – a systematic review. bmc public health. 2008 aug 14;8:289. pmid:18702821 study group on social medicine. investigation on diseases and diet in airin, document no.73, 2016. an internal report of the osaka social medical center (in japanese). tuberculosis in foreign students in japan, 2010–2014: a comparison with the notification rates in their countries of origin surveillance report masaki ota,a kazuhiro uchimuraa and seiya katoa a research institute of tuberculosis, japan anti-tuberculosis association, kiyose, tokyo, japan. correspondence to masaki ota (email:otam@jata.or.jp). to cite this article: ota m et al. tuberculosis in foreign students in japan, 2010–2014: a comparison with the notification rates in their countries of origin. western pacific surveillance and response journal, 2016, 7(2):1–6. doi:10.5365/wpsar.2015.6.4.009 abstract this study characterizes the foreign students with tuberculosis (tb) registered in japan from 2010 to 2014 and compares their tb notification rates with those in their countries of origin. the tb notification rates in foreign students were retrieved from the national epidemiological surveillance of infectious disease system in japan. national tb notification data from 16 countries and areas were extracted from the world health organization’s and the official health websites of the countries and areas. there were 1128 foreign students in japan who developed tb between 2010 and 2014; nearly half of the cases were from china (n = 530, 46.9%), and 688 (61.0%) were male with a median age of 23 years. the tb notification data for foreign students were highest in students from the philippines (675/100 000 person years, 95% confidence interval: 372–977). the notification rates in foreign students from seven countries were significantly higher than the average notification rate in their countries of origin (china, indonesia, mongolia, myanmar, nepal, the philippines and viet nam). the republic of korea and taiwan, china had significantly lower rates in foreign students than in their countries of origin. the notification rates for foreign students in japan may reflect a more accurate risk of developing tb among the immigrants to japan than the tb notification rates in their countries of origin. these results may be helpful to identify the immigrants’ countries/areas of origin with the necessity of pre-entry tb screening. introduction japan has successfully reduced the burden of tuberculosis (tb) in the past six decades from 590 684 cases (698 per 100 000 population) in 1951 to 19 615 cases (15.4 per 100 000 population) in 2014.1,2 however, imported tb from immigrants is still a challenge in eliminating tb in japan. the proportion of immigrants among all tb cases in japan has steadily increased from 2.4% in 2000 to 5.6% in 2014. immigrants accounted for 43% of the tb cases among those aged 20 to 29 years in 2014.1,3 the tb notification rates in foreign countries can be referenced for assessing the risk of tb importation from their immigrants. however, the estimate might not reflect the actual disease burden accurately.4–6 calculating the notification rates for tb in immigrants to japan by country of origin is a challenge since some cases are temporary visitors who cannot be distinguished in the record. illegal and undocumented immigrants who do not count in the denominator for calculating the tb notification rates may lead to overestimating the tb burden. for most of the immigrant occupation designations, the total number of people engaged in that occupation (i.e. denominator) is not available. to our best knowledge, it is only possible to determine the tb notification rate in foreign students in japan because the national tb surveillance system of japan records the cases’ occupations, and foreign students (student visa holders) are surveyed by the japan students services organization (jasso) annually.7 this study characterizes the foreign students with tb registered from 2010 to 2014 and compares their notification rates with those in their countries of origin to investigate if there are discrepancies between them. methods study population this study aimed to include all foreign students in japan. both long-term and short-term (with a stay of less than one year) students were included. the study included students from 16 countries and areas: bangladesh; cambodia; china; taiwan, china; india; indonesia; malaysia; mongolia; myanmar; nepal; the philippines; republic of korea; the russian federation; sri lanka; thailand and viet nam. other foreign countries were excluded as tb cases were less than four in the study period or the number of students from those countries was too small (less than 300 students) to be listed in the jasso survey. foreign students studying at accredited educational institutions, including high schools, colleges/universities and vocational/professional schools, make up about 75% of foreign students in japan.7 they undergo health screening at entry to the schools with chest x-rays as required by the school health and safety act of 1958.8 the other 25% of foreign students, mostly entering unaccredited japanese language schools, may or may not be offered health screening. suspected tb cases are referred to nearby health facilities for tb laboratory confirmation testing (confirmed by sputum smear, tb culture, polymerase chain reaction and other identification tests such as a capilia tb-neo test [tauns co. ltd., izunokuni, shizuoka, japan] that are described elsewhere).9 the national tb surveillance system the national tb surveillance system of japan has been described elsewhere.10 briefly, once a tb case is diagnosed, physicians are required by law to report the diagnosis to the local health department using a standard notification form. collected data include the patient’s identity, demographics, epidemiological, clinical and laboratory testing information. a public health nurse from the local health office interviews the case to obtain additional information (for example, occupation and details about the case contacts for contact investigation). data are then deposited into the national epidemiological surveillance of infectious disease system of japan (nesid).10 tb data of local and foreign students were retrieved from nesid for analysis. tb notification data among foreign students in japan information on age, sex, year of registration, mode of detection and country of origin of the tb cases, who were local and foreign students, were obtained from nesid. the notification rates for tb among foreign students were calculated as the number of tb cases registered in japan from 2010 to 2014 divided by the number of foreign students in japan at that period by country/area. the number of foreign students in japan was obtained from jasso’s annual survey.7 national tb notification data in foreign countries and areas the national tb notification data were obtained from the world health organization’s website.2 tb notification data for taiwan, china were obtained from the website of the centers for disease control, department of health, taiwan, china.11 population estimate of different countries and areas were obtained from the united nations population division’s web site.12 statistical methods descriptive analyses were done for the tb cases and notification rates in the foreign students and those of their countries of origin. the 95% confidence intervals (ci) were calculated by binomial test. statistical analyses were conducted by r software version 3.0.1 (r foundation for statistical computing, vienna, austria). ethics statement this is a review of routine tb surveillance data, and we obtained a waiver of ethical clearance from the institutional review board of the research institute of tuberculosis, tokyo, japan (irb#: 27–16). results total tb cases in total, there were 1128 tb cases among the foreign students registered in japan between 2010 and 2014; 688 (61.0%) were males with a median age of 23 years. in comparison, among the japanese students with tb (n = 872), 57.2% were males and the median age was 21 years old. the majority (86.7% of the foreign students and 91.5% of the japanese students) of the student tb cases were age 18 to 27 years. these cases were detected either through health screening at the educational institutions (57.3% for foreign students and 45.1% for japanese students) or during self-health-care seeking at clinics and hospitals (42.7% for foreign students and 54.9% for japanese students) (table 1). the foreign students with tb accounted for 56.4% of all the students with tb (n = 2000) and for 1.05% of all the tb cases (n = 107 335) in japan registered in the same period. the number of tb cases with known occupations was 104 862 in that period. the majority of the foreign students with tb were from china (530 cases, 46.9%) followed by viet nam (131 cases, 11.6%) and nepal (127 cases, 11.2%) (figure 1). information on the countries of origin was unavailable in about 5% of the cases. table 1. number of tb cases in students, japan, 2010–2014 click to download table 1. jpg,248kb tb, tuberculosis. figure 1. geographical distribution of countries and areas of origin of tb cases among foreign students who studied in japan, 2010–2014* click to download figure 1. jpg, 877kb * non-asian countries and countries having fewer than four tb cases or fewer than 300 students are not shown. tb, tuberculosis. tb notification rates the overall tb notification rates in foreign students are shown in figure 2 with an increasing trend from 104 to 140 per 100 000 population between 2011 and 2014. tb notification rates for foreign students were highest in students from the philippines (675/100 000 person years [pys], 95% ci: 372–977/100 000 pys) followed by myanmar (617/100 000 pys, 95% ci: 417–817/100 000 pys) and nepal (498/100 000 pys, 95% ci: 385–611/100 000 pys). tb notification rates in other countries were less than 400/100 000 pys (figure 3). figure 2. tb notification rates among foreign students, japan, 2010–2014 click to download figure 2. jpg, 241kb error bars indicate 95% confidence intervlas of the estimates. tb, tuberculosis. figure 3. tb notification rates in foreign students in japan and that of their countries and areas of origin, 2010–2014 click to download figure 3. jpg, 388kb error bars indicate 95% confidence intervals of the estimates. py, person years; tb, tuberculosis. the tb notification rates in foreign students from seven countries were significantly higher than the average notification rate in their countries of origin: china (101 versus 65/100 000 pys, indonesia (361 versus 130/100 000 pys), mongolia (363 versus 166/100 000 pys), myanmar (617 versus 272/100 000 pys), nepal (498 versus 131/100 000 pys), the philippines (675 versus 234/100 000 pys) and viet nam (231 versus 112/100 000 pys). the notification rates in students from the republic of korea (38 versus 95/100 000 pys) and taiwan, china (27 versus 52/100 000 pys) were significantly lower than that in their original countries and areas (figure 3). in the other countries, the differences between the two notification rates were not statistically significant (p > 0.05). discussion to our knowledge, this is the first report on tb in an immigrant subpopulation in japan. almost all of the tb cases among foreign students were captured because most educational institutions in japan conduct entry health screening with chest x-rays as required by law. our results show that the overall tb notification rates in foreign students increased from 2010 to 2014. increases in enrolment of foreign students from countries with higher notification rates of tb such as viet nam and nepal in recent years may be the reason for the increase in the overall tb notification rate in foreign students in japan.2,7 the national tb programmes of many countries might not capture all the tb cases either because of insufficient technical and managerial capacity or because tb patients seek health care from the private sector and are not reported to the programme4,5 unless special arrangements are made.6 therefore their tb notification rates appear to be lower than in reality. this might explain the higher notification rates in foreign students than the overall tb notification rates in their original countries. this explanation is also supported by the findings of a previous study, which screened for tb in united states of america immigrants, that found a high prevalence of smear-negative tb (more than 500 per 100 000 population) in those born in china, the philippines and viet nam.13 some of the student tb cases detected in japan may not be incident cases but rather may be prevalent cases who had developed tb before they were screened at the educational institutions. this might have made the student tb notification rates higher than the overall notification rate in their original countries and areas. however, about half of the tb patients sought health care only after they had arrived in japan, suggesting they were incident cases. we believe the student tb notification rates mostly represent incidence of tb with some reflection of prevalence, although we do not know to what extent. on the other hand, certain students may have come from regions with a higher tb notification rate than their national average.14 also, students who had already developed tb may have transmitted the disease to other students after arriving in japan. this could lead to a cluster of tb cases in the immigrant community and result in higher notification rates in this group than their national averages. in addition, in some countries and areas, tb burden is highest in the elderly population. most of the foreign students from the republic of korea and taiwan, china were aged 18 to 27 years, and the results show that their tb notification rates were lower than the national averages of their own countries and areas.2,11 this study is based on routine surveillance data and has its limitations. first, the tb diagnostic data might have misclassifications or misdiagnoses. we were also unable to verify the occupational status data for each case. second, about 5% of the foreign students with tb and information on their countries of origin were not available. the notification rates might be underestimated. third, the survey conducted by jasso might not capture all the students in japan (nevertheless we were able to include short-term students who accounted for about 8% of the foreign students in this study). furthermore, it is practically impossible to distinguish whether tb infections in the foreign students occurred before or after entering japan. however, considering the low tb notification rate of japanese residents, particularly young adults (less than 10 per 100 000 population in 2014 for those aged 15 to 34 years)1 with whom foreign students are likely to socialize, the number of cases infected with tb after entering japan is considered negligible. we were unable to compare the case detection proportion between health screening at the education institutions (active screening) and self-health-care seeking at clinics and hospitals (passive screening) in this study as the total numbers of screened subjects in the two screening systems were not available. this should be addressed in future research. most countries with a low burden of tb in europe, the middle east, north america and oceania have implemented systemic tb screening for immigrants,13,15 and such measures should be considered in japan to further reduce the tb burden.16,17 in most south-east asian countries, the peak age of developing tb is now shifting to the elderly (65 years or older).2 in assessing the risk of developing tb among immigrants who are mostly aged 20–50 years, the tb notification rates in a subpopulation of immigrants may reflect the true tb rate better than the overall tb notification rate in their countries of origin especially when age-specific rates of these countries are not available. in future tb control programme management in japan, the notification rates among foreign students can serve as a good reference to identify the immigrants’ countries of origin with the necessity of pre-entry screening. conflicts of interest none declared. funding this study was supported through a grant-in-aid for research program on emerging and re-emerging infectious diseases (15fk0108004h001) by japan agency for medical research and development and ministry of health, labour, and welfare. references kekkaku no toukei 2015 (statistics of tb 2015) [in japanese]. tokyo, kekkaku yobo kai (jata), 2015. tuberculosis country profiles. geneva, world health organization, 2015. available from: http://www.who.int/tb/country/data/profiles/en/ [accessed 22 march 2016]. tuberculosis surveillance center; rit; jata. [tuberculosis annual report 2013–(1) summary of tuberculosis notification statistics and foreign-born tuberculosis patients]. kekkaku, 2015, 90:437–443. pmid:26477115 kumar m, kumar s. tuberculosis control in india: role of private doctors. lancet, 1997, 350(9087):1329–1330. doi:10.1016/s0140-6736(05)62497-x pmid:9357438 the burden of disease caused by tb. in: global tuberculosis report 2014. geneva, world health organization, 2014:7–31. available from: http://apps.who.int/iris/bitstream/10665/137094/1/9789241564809_eng.pdf [accessed 22 march 2016]. maung m et al. private gps contribute to tb control in myanmar: evaluation of a ppm initiative in mandalay division. international journal of tuberculosis and lung diseases, 2006, 10(9):982–987. pmid:16964788 result of an annual survey of international students in japan, 2014 [in japanese]. tokyo, japan students services organization, 2014. available from: http://www.jasso.go.jp/about/statistics/intl_student_youryo/index.html [accessed 22 march 2016]. regulations related to the school safety and health act of 1958 [in japanese]. tokyo, ministry of education, culture, sports, science and technology, 2008. available from: http://law.e-gov.go.jp/htmldata/s33/s33f03501000018.html [accessed 22 march 2016]. national standard of tuberculosis care (revised in 2016) [in japanese]. tokyo, ministry of health labour and welfare, 2016. available from: http://www.mhlw.go.jp/file/06-seisakujouhou-10900000-kenkoukyoku/0000110838.pdf [accessed 22 march 2016]. ohmori m et al. computerized surveillance system of tuberculosis in japan: its evolution, achievement and challenges. kekkaku, 2012, 87(1):15–23. pmid:22416477 centers for disease control annual report 2015. taiwan, china, ministry of health and welfare, 2015. available from: http://www.cdc.gov.tw/uploads/files/201509/ c9b61bbe-4a3b-40a9-8dce-0f8b3d9cc2c7.pdf [accessed 22 march 2016]. data query: total population by sex (thousands). new york, united nations population division, 2015. available from: http://esa.un.org/unpd/wpp/dataquery/ [accessed 22 march 2016]. liu y et al. overseas screening for tuberculosis in u.s.-bound immigrants and refugees. new england journal of medicine, 2009, 360(23):2406–2415. doi:10.1056/nejmoa0809497 pmid:19494216 wang l et al. tuberculosis prevalence in china, 1990-2010; a longitudinal analysis of national survey data. lancet, 2014, 383(9934):2057–2064. doi:10.1016/s0140-6736(13)62639-2 pmid:24650955 aldridge rw et al. pre-entry screening programmes for tuberculosis in migrants to low-incidence countries: a systematic review and meta-analysis. lancet infectious diseases, 2014, 14(12):1240–1249. doi:10.1016/s1473-3099(14)70966-1 pmid:25455991 ministry of foreign affairs et al. stop tb japan action plan. tokyo, stop tb partnership japan, 2014. available from: http://www.stoptb.jp/ dcms_media/other/action%20plan(f).pdf [accessed 5 april 2016]. systematic screening for active tuberculosis: principles and recommendations. geneva, world health organization, 2013. available from: http://www.who.int/tb/tbscreening/en/ [accessed 22 march 2016]. diphtheria diagnostic capacity in the western pacific region regional analysis santosh gurung,a amy trindall,b lucy reeve,b adroulla efstratioub and varja grabovaca a expanded programme on immunization unit, division of communicable diseases, who regional office for the western pacific, manila, philippines. b public health england, london, united kingdom. correspondence to santosh gurung (email: gurungs@who.int; r_gees@hotmail.com). to cite this article: gurung s, trindall a, reeve l, efstratiou a, grabovac v. diphtheria diagnostic capacity in the western pacific region. western pac surveill response j. 2019 dec;10(4). doi:10.5365/wpsar.2019.10.2.008 diphtheria is an acute infectious disease affecting the upper respiratory tract and occasionally the skin and is caused by the action of diphtheria toxin produced by corynebacterium diphtheriae, corynebacterium ulcerans and corynebacterium pseudotuberculosis. corynebacterium infections are usually difficult to control due to their epidemic patterns, the emergence of new strains, novel reservoirs and their dissemination to susceptible human and animal populations.1 although c. diphtheriae is largely controlled through mass immunization programmes, diphtheria escalated to epidemic proportions within the russian federation and the former soviet republics in the 1990s, highlighting the potential for this disease to cause morbidity and mortality when immunization programmes are disrupted.2 a recent review of global diphtheria epidemiology, which included an analysis of cases and information about age, showed age distribution shifts and found that the majority of cases occur in adolescents and adults.3 shifts in age distribution, from children to adolescents and adults, were observed from countries in the western pacific region such as the lao people’s democratic republic,4 the philippines3 and viet nam.5 early and accurate microbiological diagnosis of each suspected case is essential to inform management and treatment of the case and close contacts. to assess the diphtheria diagnostic capacity across laboratories in the western pacific region, a survey was undertaken as part of a gap analysis (see appendix 1) by the world health organization collaborating centre for diphtheria and streptococcal infections with the who regional office for the western pacific. the objectives of the gap analysis were to: assess current microbiological capability for the laboratory diagnosis of diphtheria in the western pacific region; assess public health impact in individual countries where diphtheria diagnostic activities may be limited; assess availability of specialized reagents for diphtheria diagnostics in the western pacific region; assess training needs for scientists/medical/public health staff in this specialized area and identify best practices/gaps in diphtheria diagnostics to establish laboratory training workshops; and assess availability of policies and guidelines related to management and control of diphtheria. methods a questionnaire used by the european centre for disease prevention and control (ecdc) to assess diphtheria diagnostic capacity6 was adapted and sent to laboratories identified as part of the laboratory network for invasive bacterial diseases in the western pacific region. key topics covered in the survey included: diptheria surveillance; laboratory capacity and diagnostic services; laboratory training, external quality assurance (eqa) and support needs; serology and population immunity screening; and public health (i.e. use of guidelines/manuals for diagnostics and case management, and availability of antitoxin). responses were validated by the public health england (phe) team. this included following up significant omissions or inconsistencies. a set of criteria was defined against which diagnostic capacity could be evaluated and any gap identified. the criteria were adapted from those used by ecdc, which were originally developed based on the advice of a group of experts from phe, ecdc and the who regional office for europe.6 the criteria assessed for minimum standards in three areas: area 1: microbiological and epidemiological surveillance area 2: laboratory diagnostic capacity area 3: expertise in laboratory diagnostics. the survey was sent to 18 laboratory contacts in 15 who western pacific region countries, and responses were received from 17 contacts in 14 different countries. the pacific island countries were assumed to have limited diphtheria diagnostic capacity and the questionnaire was sent to fiji only; however, there was no response from fiji. the responses from two countries indicated that there were no laboratories capable of diphtheria diagnostic tests within their country. these same countries, however, did not return full survey responses and we were unable to infer the status of surveillance, policies and guidelines. these countries were excluded from the analysis due to missing/unknown information. they were therefore excluded from the analysis, but this already highlights a gap in diphtheria diagnostics within the region. in summary, responses were received from 17 laboratories (94%) in 14 countries (93%); however analysis was done for 15 laboratories (83%) in 12 countries (80%). the denominator for area 1 was based on 12 countries, because this area assessed the gap in micro/epi surveillance for which the survey responses were required. the denominator for area 2 was based on 14 countries because this area assessed the gap in lab capacity, for which there were limited responses from cambodia and papua new guinea. results area 1: microbiology and epidemiological surveillance gaps in microbiology and epidemiological surveillance were assessed against the following criteria: diphtheria should be a notifiable disease in every country. every country should have a surveillance system in place for diphtheria. every country should have close collaboration in place between microbiology and epidemiology for diphtheria surveillance. all 12 countries reported diphtheria was a notifiable disease and had surveillance systems in place. of these, 87% of laboratories reported a case-based surveillance system in their country (n = 13), and 13% reported aggregate surveillance (n = 2). one laboratory reported having a combination of case-based and aggregate surveillance. one country did not report a close collaboration between microbiology and epidemiology for surveillance. overall, area 1 of the gap analysis was met by 92% (n = 11) of countries. area 2: laboratory diagnostic capacity gaps in laboratory diagnostic capacity were assessed against the following criterion: each country should ideally have at least one laboratory at the reference laboratory level with additional expertise available through a regional reference laboratory and the who reference centre when required. to reach reference laboratory standards, a laboratory must have at least one method for three analyses: microscopic examination (gram stain or other), primary culture (blood agar or tellurite agar) and biochemical identification and toxigenicity by either polymerase chain reaction (pcr) or modified elek immunoprecipitation test. of the 14 surveyed countries, nine countries (64%) reported full reference-level capacity based on culture, biochemical identification and toxigenicity testing methods, and three countries (21%) reported partial diagnostic capacity. two countries (14%) had no diphtheria laboratory diagnostic capacity at all. specific diagnostic issues identified include the following: only six laboratories reported having capacity for molecular typing. a range of tests were used for toxigenicity testing; the majority of laboratories use pcr-based methods (73%); six of laboratories (40%) use the elek test. four out of 15 (27%) laboratories experienced problems in obtaining culture media for diphtheria diagnostics, and four reported issues with supplies of antitoxin for laboratory diagnostics. area 3: expertise in laboratory diagnostics gaps in expertise in laboratory diagnostics were assessed against the following criterion: at least one current laboratory staff member should have received official training under the auspices of who on diphtheria identification and toxigenicity testing in the last five years. no laboratory staff attended comprehensive external training workshops in the last five years, and 73% of contacts from 15 laboratories felt that a training workshop was needed. other findings none of the countries stated whether their surveillance encompassed c. ulcerans and c. pseudotuberculosis as well as c. diphtheriae. if surveillance is based on the who case definition,7 then only c.diphtheriae is likely to be captured. there is a lack of eqa for this specialized area of laboratory diagnostics. only four of 12 countries had the capability to undertake serological tests and had undertaken studies previously. nine laboratories (60%) across nine countries have diphtheria antitoxin procurement in place. conclusions key areas for action the gap analysis demonstrated that there were gaps in diphtheria diagnostics within the who western pacific region, with all responding countries fulfilling the minimum criteria for surveillance, specialized laboratory diagnostics and expertise. the areas with the greatest gaps are related to laboratory diagnostics expertise and surveillance of all three potentially toxigenic corynebacteria: corynebacterium diphtheriae, c.ulcerans and c.pseudotuberculosis. considering the adequate availability of funds for diphtheria, further studies are necessary. the following areas are highlighted as requiring further action: surveillance systems should ideally be in place for all three pathogens to detect and respond to diptheria; however, this is not mandatory at the moment as the who case definition only captures the disease diphtheria as caused by toxigenic strains of c.diphtheriae. the laboratory diagnostic capability must be enhanced in some countries to isolate the causative pathogen, detect toxigenicity and undertake molecular characterization of the above pathogens; hence, there is an urgent need for some countries’ laboratory staff to attend a laboratory training workshop for diphtheria diagnostics. an eqa with participation from countries attending the next training workshop needs to be established. adequate availability of specialized media and reagents for diphtheria diagnosis must be assured within the region. updated guidelines for laboratory diagnosis of diphtheria should be made available. risks related to the lack of availability and procurement of dat should be addressed. references bonnet jm, begg nt; world health organization. control of diphtheria: guidance for consultants in communicable disease control. commun dis public health. 1999 dec;2(4):242–9. pmid:10598380 hardy ir, dittmann s, sutter rw. current situation and control strategies for resurgence of diphtheria in newly independent states of the former soviet union. lancet. 1996 jun 22;347(9017):1739–44. doi:10.1016/s0140-6736(96)90811-9 pmid:8656909 review of the epidemiology of diptheria: 2000–2016. geneva: world health organization; 2017. available from: http://www.who.int/immunization/sage/meetings/2017/april/1_final_report_clarke_april3.pdf sein c, tiwari t, macneil a, wannemuehler k, soulaphy c, souliphone p, et al. diphtheria outbreak in lao people’s democratic republic, 2012-2013. vaccine. 2016 aug 5;34(36):4321–6. doi:10.1016/j.vaccine.2016.06.074 pmid:27422343 diphtheria in viet nam 2014–17, tag 26. manila: who regional office for the western pacific; 2018. available from: https://www.who.int/immunization/sage/meetings/2018/april/26th_tag_meeting_report.pdf european centre for disease prevention and control. gap analysis on securing diphtheria diagnostic capacity & diphtheria antitoxin availability in the eu/eea. stockholm: ecdc; 2017. available from: https://ecdc.europa.eu/sites/portal/files/documents/diphtheria%20gap%20analysis%20final%20with%20cover%20for%20web.pdf who surveillance standards for vaccine-preventable diseases: 2018. geneva: world health organization; 2018. available from: https://www.who.int/immunization/monitoring_surveillance/burden/vpd/standards/en/ chelonitoxism outbreak: sorsogon, philippines, october 2014 letter to the editor imelda deveraturda,ab ray justin ventura,ab vikki carr de los reyes,b ma nemia sucaldito,b michael o’reillyc and enrique tayagb a field epidemiology training program, epidemiology bureau, department of health, san lazaro compound, sta cruz, manila, philippines. b department of health, san lazaro compound, sta cruz, manila, philippines. c emerging disease surveillance and response unit, division of health security and emergencies, world health organization regional office for the western pacific, manila, philippines. correspondence to imelda deveraturda (email: deveraturdamel@gmail.com). to cite this article: deveraturda i et al. chelonitoxism outbreak: sorsogon, philippines, october 2014. western pacific surveillance and response journal, 2015, 6(2):90–91. doi:10.5365/wpsar.2015.6.1.021 recently, a chelonitoxism (turtle poisoning) outbreak in arteche, eastern samar, philippines was featured by the western pacific surveillance and response journal (wpsar) describing the dangers of turtle meat consumption.1 as highlighted by the authors, 68 cases were identified with a 6% case fatality ratio (cfr). also, the results revealed that there was a dose-dependent relationship between turtle meat or soup consumption and risk of illness. we investigated another episode of a chelonitoxism outbreak in the village of liang, irosin, sorsogon, philippines in october 2014. a clinical chelonitoxism case was defined as a well individual who developed epigastric pain, nausea, vomiting or diarrhoea2 in the village of liang, irosin, sorsogon from 8 to 10 october 2014. we reviewed medical records of all clinically defined cases at the irosin district hospital, and we interviewed the clinically defined cases using a standard questionnaire developed by our field investigators. questions included demographic profile and history of food intake with emphasis on the food intake time. data were stratified by age, familial unit, food items and incubation period for analysis using microsoft excel. a total of six clinically defined chelonitoxism cases were identified among 33 people who ingested turtle meat (attack rate = 18%). age of the six cases ranged from 1 to 48 years (median = 19 years). three out of six (50%) were children aged between 1 and 5 years, four (66%) were male, and five out of six (83%) cases came from the same household. all cases had ingested turtle meat within two days of symptom onset. the most common symptoms were epigastric pain (83%), vomiting (83%) and dizziness (67%). the incubation period ranged between 1 and 45 hours (median = 4 hours). four (66%) cases developed symptoms within 5 hours of consuming turtle meat/soup while two (33%) cases developed symptoms between 44 and 45 hours after exposure. the cfr was 50% (figure 1). all human deaths occurred in one household. three out of three (100%) paediatric cases (age figure 1. case distribution after consuming turtle meat or soup, sorsogon, philippines, 8 to 10 october 2014 (n = 6) click to download figure 1. jpg, 210kb according to the investigation results, we did not find any association between dose of turtle meat ingested and probability of survival. two rectal swab specimens were collected from two available cases for bacteriologic culture and no enteropathogenic isolates were yielded. unfortunately, as with many turtle meat poisoning outbreaks in south-eastern asia,3 we were not able to confirm chelonitoxism directly via laboratory confirmation of toxins due to insufficient laboratory capacity. based on the results, we characterized this outbreak to be: (1) familial clustering; (2) bimodal distribution of incubation period; and (3) mortality restricted to children. as clinical case definitions for chelonitoxism are nonspecific, we recommend building referral mechanisms to existing laboratories doing chelonitoxism outbreak confirmation. stricter enforcement of existing laws against hunting and sea turtle consumption could limit the morbidity and mortality of chelonitoxism in the philippines and other countries with turtles as a common food source.4 conflicts of interest none declared. funding none. references ventura rj et al. chelonitoxism outbreak caused from consuming turtle, eastern samar, philippines, august 2013. western pacific surveillance and response journal, 2015, 6(2). doi:10.5365/wpsar.2015.6.1.003 chelonitoxism – clinical signs [internet]. tokyo, medqa-jp, 2010. pavlin bi et al. mass poisoning after consumption of a hawksbill turtle, federated states of micronesia, 2010. western pacific surveillance and response journal, 2015, 6(1):25–32. doi:10.5365/wpsar.2014.5.3.006 republic act no. 9147: wildlife resources conservation and protection act. quezon city, eleventh congress of the philippines, 2001. available from: http://www.lawphil.net/statutes/repacts/ra2001/ra_9147_2001.html [accessed 8 may 2015]. screening for latent tuberculosis infection by an aboriginal community controlled health service, new south wales, australia, 2015 original research hannah visser,a megan passey,a emma walkea and sue devlinb a university centre for rural health, lismore, nsw australia. b north coast public health unit, lismore, nsw australia. correspondence to hannah visser (email: frau.hannahvisser@gmail.com). to cite this article: visser h, passey m, walke e, devlin s. screening for latent tuberculosis infection by an aboriginal community controlled health service, new south wales, australia, 2015. western pac surveill response j. 2019 dec;10(4). doi:10.5365/wpsar.2019.9.2.010 objective: ongoing transmission of tuberculosis (tb) continues in indigenous communities in new south wales (nsw), australia. in a pilot project, a public health unit tb team partnered with an aboriginal community controlled health service (acchs) in a community with a cluster of tb to augment screening for latent tb infection (ltbi) using interferon-gamma release assay (igra). this study examined screening data and programme outcomes at 12 months post hoc to advise practice and policy formulation. methods: we conducted a retrospective, cross-sectional analysis of demographic and clinical data of acchs patients, stratified by igra testing status. differences in sex and age distribution between the groups and cases of a genetically and epidemiologically linked tb cluster in aboriginal people in nsw were assessed using non-parametric tests. results: of 2019 aboriginal and torres strait islander people seen by general practitioners during the study period, 135 (6.7%) participated in the screening. twenty-four (17.8%) participants were igra positive. one person was diagnosed with active tb. twelve participants received a chest x-ray at the time of the positive test, and six participants had an additional chest x-ray within 12 months. none commenced preventive treatment for ltbi. discussion: acchs screening for ltbi reached individuals in the age group most commonly affected by tb in these aboriginal communities. no conclusions can be made regarding the population prevalence due to the low screening rate. further strategies need to be developed to increase appropriate follow-up and preventive treatment. tuberculosis (tb) is a major public health issue and a leading cause of death worldwide.1 despite the low incidence of tb in australia (5.7 cases per 100 000 population in 2014), tb is still endemic in indigenous communities.2 sociocultural factors and individual risk factors for infection contribute to ongoing tb transmission in australian indigenous communities.3 ltbi is infection with mycobacterium tuberculosis, in the absence of clinical signs or symptoms of active tb.4 the lifetime risk of tb reactivation is 5–10%, with most developing active tb in the first five years after infection.5 treating ltbi decreases the risk of active tb by 60–90%.6 the most commonly used treatments for ltbi are sixor nine-month courses of isoniazid.7 the world health organization (who) set the goal of tb elimination by 2050 and initiated the end tb strategy in 2014.8 in australia, the national tuberculosis advisory committee (ntac) guidelines assist tb services with achieving programme targets. indigenous australians are included in the populations who and ntac recommends for targeted testing and treatment for ltbi.8,9 there is no gold standard for the diagnosis of ltbi. the two tests currently used are the tuberculin skin test (tst) and interferon-gamma release assay (igra). while tst involves two encounters with specialized staff 48–72 hours apart, igra is a one-visit, whole-blood test that measures the immune response to antigens of m. tuberculosis. who recommends either tst or igra to test for ltbi.10 at the time of this project, ntac recommended tst to diagnose ltbi, but “igras may be a preferred option where resources, distance or other factors make tst impractical to administer;”11 igra was only funded under medicare in australia for immunocompromised patients. in 2017 the ntac position statement was revised and now recommends “either tst or igra for the investigation of ltbi in most circumstances”.12 since 2000, 48 genetically and epidemiologically linked cases of active tb (mycobacterial interspersed repetitive units [miru] pattern 23’3425153322) have been diagnosed in aboriginal people. many of these patients resided in an aboriginal community controlled health service (acchs) catchment area in northern new south wales (nsw), australia. tb transmission has occurred despite implementation of tb control measures such as household contact tracing and community-based screening events using tst.13 with concerns about ongoing tb transmission and after consultations with aboriginal people of the affected communities and tb expert committees, the local public health unit (phu) collaborated with the acchs in a pilot project to offer screening for ltbi and to provide preventive therapy. to eliminate tb, the support of primary care providers who care for high-risk populations is essential.7 previous collaborations between acchs and nsw ministry of health highlight the benefits of partnerships.14 the overall objectives of the ongoing project include: to better understand the epidemiology of ltbi in the communities served by the acchs; to identify who is reached by the acchss offering screening; to strengthen the partnership between the acchs and phu tb team; to raise tb awareness in the acchs setting; and to advise practice and policy formulation, including igra funding and incorporation of tb screening in annual health assessment in at-risk communities. we describe a retrospective epidemiological analysis of data from the igra screening project with the following aims: assess the reach of this model of tb screening for a rural australian aboriginal population; compare the demographic characteristics of people in the project with the general acchs patient population and those in the tb miru pattern 23’3425153322 cluster in nsw; and evaluate the tb screening outcomes at 12 months. methods general practitioners (gps) and all clinical staff working for the acchs providing services in three aboriginal communities in northern nsw received basic tb training and were encouraged to screen for tb and offer igra testing to their patients who presented for medical consultations at the central or one of the two outreach clinics between 3 june 2013 and 27 january 2015. the decision to test with igra was intended to treat those with tb as identified by the gps and the phu tb team (tb doctors, tb nurses and aboriginal tb community engagement officers). all patients were eligible for testing; however, testing was offered as part of a gp consultation; therefore, study inclusion was at the gp’s discretion. the igra used in this project was quantiferon tb gold (qiagen gmbh, hilden, germany). trained nurses at the acchs or at a private pathology service collected the samples, which were then sent to brisbane for incubation and analyses within 16 hours. patients provided verbal consent to participate in the project, which included consent for sharing of their demographic and tb-related clinical data (igra, chest x-ray and sputum test results) with the phu tb team. at the time of blood collection, nurses ensured that patients understood they were having an igra test, and patients provided signed consent to proceed. participants were questioned about active tb symptoms (cough, night sweats, weight loss). participants’ data were recorded in their medical files at the acchs and in the notifiable conditions information management system (ncims) database, administered by nsw health ministry. acchs doctors notified all participants of their results. if the igra test was positive or there were clinical concerns, participants were referred for a chest x-ray (at a private radiology service in the town of the main acchs clinic), sputum test for acid-fast bacilli (afb) with smear, polymerase chain reaction (pcr) and culture (at a private pathology service) and to a tb specialist clinician to explore treatment options. the phu tb team contacted all referred patients and offered a range of support services for further assessment and preventive tb treatment. when preventive treatment was declined or deemed inappropriate, the referring gp was informed and a repeat chest x-ray was offered to the patient 12 months after the positive igra result. case definitions we defined ltbi as a positive igra test in the absence of clinical manifestations of active tb based on symptoms, radiology and sputum test results. the tb cluster cases are 37 epidemiologically linked, active tb cases in aboriginal people in nsw with the miru pattern 23’3425153322 diagnosed between october 2000 and february 2015. cluster cases diagnosed outside nsw and diagnosed after the study period were not included in the analysis. data collection we compared non-identifiable data retrieved from ncims and acchs. demographic data including age, sex, indigenous status and resident postcode of people screened with igra and people within the tb cluster were retrieved from ncims. only indigenous people were included in the study. variables used for the outcome analysis of the people who screened positive for ltbi (igra result, sputum test results, chest x-ray at 0 and 12 months and tst results from previous screening) were also extracted from ncims. demographic data of patients presenting to the acchs between 3 june 2013 and 27 january 2015 were requested from the executive officer of the acchs and extracted from medical director software using the pencat tool.15 data analysis we undertook a descriptive analysis on the screening outcomes data. all data used were from people identifying as aboriginal and torres strait islander. data from non-indigenous people accessing the acchs were excluded. we compared the demographic characteristics of the acchs’s patient population, the individuals screened by igra and the individuals within the tb cluster cases in nsw. χ2 tests were used to assess differences in sex distribution between four groups (acchs patients, igra screening participants, igra screening participants who tested positive for ltbi and tb cluster cases). a non-parametric kruskal–wallis test and mann–whitney u post hoc tests were used to compare median ages. further analysis was undertaken to describe the outcomes of the igra screening project 12 months later, using the clinical data extracted from ncims. ethics this study was approved by the aboriginal health and medical research council (1093/15) with a waiver of informed consent, the north coast nsw ethics committee (ncnsw hrec no lnr 121) and received a site specific assessment approval (lnrssa/15/ncc). results between 3 june 2013 and 27 january 2015, 2019 aboriginal and torres strait islander peoples presented to the acchs for a gp consultation. a total of 135 individuals (61 males [45%] and 74 females [55%]) were screened for tb using igra, or 6.7% of all indigenous-patient gp presentations in this period. we do not have data on how many patients declined igra screening. overall, 24 of the 135 participants tested (17.8%) were igra positive; one (4.2%) was diagnosed with active tb. between october 2000 and february 2015, 37 epidemiologically linked tb miru pattern 23’3425153322 cluster cases in aboriginal people were diagnosed in nsw; these individuals were not necessarily patients of the acchs. gender and median age comparison the gender and median ages of the acchs clinic patients, igra participants and patients of the tb cluster are presented in table 1. click to download table 1. jpg, 198kb no statistically significant difference in sex distribution was found between acchs patients and patients screened by igra (χ2 = 0.11, p = 0.74) and igra participants who screened positive for ltbi (p = 0.63). significantly more of the cases within the tb cluster were among men (76%) compared to all acchs attendees (47%, p ≤ 0.01), all igra participants (45%, p ≤ 0.01) and igra participants who screened positive for ltbi (42%, p ≤ 0.01). the median ages of patients tested by igra (male 44 years/female 43 years; range 3 to 75 years), those who were igra positive (male 48 years/female 49 years; range 19 to 66 years), and those within the tb cluster (male 41 years/female 41 years; range 0 to 65 years) were significantly higher compared to the general acchs patient population (male 20 years/female 24 years; range 0 to 88 years; p ≤ 0.01 for all groups and both sexes.) outcome analysis out of 135 igra tests, 102 (75.6%) were negative, nine (6.7%) were indeterminate and 24 (17.8%) were positive for tb. in this report, indeterminate test results were not included in the screening outcome analysis. positive igra tests of the 24 people who tested igra positive, 13 (54.2%) were newly diagnosed with ltbi and one (4.2%) was diagnosed with active tb. the other 10 (41.7%) participants with ltbi had positive tsts before the igra screening documented in the ncims database, but the tst results were not documented in the acchs medical records and had not been disclosed by the participants at the time of igra screening. eight of the 24 participants who were igra positive (33.3%) reported having a cough; one participant reported cough, weight loss and night sweats, and one participant reported general malaise. all 24 participants who were igra positive were referred for chest x-ray and sputum testing for afb. sixteen participants (64%) had a chest x-ray. eleven (68.8%) were reported as normal and five (31.3%) were abnormal (reported findings were atelectasis, chronic obstructive pulmonary disease, pulmonary nodules and pleural effusion, consolidation and bilateral consolidation). five of the 24 participants (20.8%) had sputum tested for afb. the sputum of one participant was smear and pcr positive for afb and culture positive for m. tuberculosis. this participant had reported night sweats and weight loss, and active tb was considered at the time of presentation. the participant completed treatment for active tb. in summary, of the 24 igra positive participants referred for sputum testing and chest x-ray 21 (87.5%) had a chest x-ray and/or sputum tested. one participant had chest x-ray and sputum testing resulting in a diagnosis of active tb, 16 had chest x-ray only; 4 had sputum testing only; and 3 did not have chest x-ray or sputum testing. the active tb case was the participant with tb-like symptoms and consolidations on chest x-ray. 12 months follow-up twelve of the 14 participants (85.7%) with a new positive tb screening result (13 ltbi and 1 active tb) had a chest x-ray at the time of the positive test, and 6 of these 12 (50%) had a repeat chest x-ray at 12 months. one person died of other causes before the scheduled chest x-ray at 12 months. four participants (40%) of the 10 who tested igra positive with a previous positive tst had a chest x-ray at the time of their positive igra test but did not have a repeat chest x-ray at 12 months. referral for preventive treatment and assessment of previous tb contact and counselling was offered to all patients with newly diagnosed ltbi; however, none who had ltbi detected by igra screening commenced preventive treatment for ltbi. the patient diagnosed with active tb completed treatment for tb. discussion this screening project involving 135 participants reached both males and females. the median age for patients tested with igra was 44 years for males and 43 years for females. twenty four of the 135 (18%) screened by igra had positive tests. twenty one (87.5%) of those who tested positive had chest x-ray and/or sputum testing. one case of active tb was diagnosed. none of those with positive igra results that were interpreted as indicative of latent tb infection initiated treatment. of the 2019 acchs presentations, 135 (7%) participated in the igra screening. it is unknown how many patients were offered igra; however, the participating gps reported that most patients accepted it. symptoms reported by participants can create selection bias, but we did not assess how these reports influenced gps’ decisions to offer screening. other biases that potentially increased screening included gp awareness of tb in the household or other tb contact (unknown to the patient), knowledge of lifestyle factors (such as smoking and drug use), the patient’s living circumstances and gp’s tb knowledge. both providers and participants may have been influenced by their awareness of tb in local communities or the diagnosis of a case of active tb at the acchs. we tried to mitigate bias by providing basic tb training and tb screening instructions to all clinical staff at the acchs before commencement of this project. research into what encourages provider and patient participation in tb screening in this setting is required. the screening project reached both males and females, including men in the age group most affected by tb in the miru pattern 23’3425153322 cluster.13 previous informal reviews of tb screening activities by the phu tb team displayed a disproportional low participation rate among men. we believe that the established doctor–patient relationship between the gps offering igra screening to their male patients contributed to our results. furthermore, unpublished research involving interviews with aboriginal men affected by tb suggest tb screening in the annual aboriginal and torres strait islander health assessment at the acchs would further enhance participation. a formal comparison of outcomes from contact screening in this setting with the igra project would assist in adapting targets and interventions to local epidemiology as recommended by who.16 we found that 17.8% of the people screened were infected with m. tuberculosis. this result should be interpreted with caution as only 7% of the target population was screened; therefore, population prevalence cannot be inferred from this study. the median estimated population prevalence for ltbi in australia is between 0% and 10%, which is lower than our findings.17 follow-up studies are needed to make conclusions about the tb prevalence in this community. access to specialized tst and ltbi follow-up services are limited for the widely dispersed rural aboriginal communites in northern nsw. tst has proven insufficient for preventing ongoing tb transmission in these communites. we believe igra offered in acchss with the support of a specialized tb service would further understanding of the prevalence of tb and allow screening in communities that may have high infection rates. medicare funding for igra has increased since implementation of this pilot project, but it only covers screening if a patient is a contact of an active case, even in groups with higher tb notification rates. indigenous peoples are a “vulnerable and hard-to-reach group” as defined by who, and interventions must be designed to increase access to tb services.16 medicare-funded igra is required for acchss to provide autonomous services to identify, treat and manage ltbi. the number of indeterminate igra test results reinforced that igra screening must include staff training on specimen collection, particularly on proper processing time frames and storage of specimens. the participation rate for sputum collection for afb, smear and culture (20.8%) might have been influenced by low rates of cough and by the logistics of sputum collection and delivery to the private pathology laboratory. on-the-spot sputum collection in the acchs setting and transport to the laboratory is being promoted to increase the number of people who have at least one sputum specimen tested for afb. early diagnosis of active tb is a valuable tool for tb prevention.18 improving the rate of sputum collection and follow-up chest x-ray at 12 months can enhance the diagnosis of early tb. cxrs to diagnose active tb were obtained from 85.7% of the participants with newly diagnosed ltbi, and 50% repeated a chest x-ray 12 months later. identifying and addressing aboriginal and torres strait islander peoples’ concerns regarding radiological testing may improve follow-up rates. ltbi treatment reduces the risk of progression to active disease for high-risk individuals.16 a population-based study with indigenous populations in the united states of america, greenland and canada found ltbi screening and treatment were associated with significant decreases in tb notification rates.19 in our study, none of the participants with newly diagnosed ltbi were treated for latent tb despite a range of patient-centred services offered by the acchs and the phu tb team. aboriginal health workers facilitated communication between the patient, gp and the phu tb team and provided care coordination and emotional support to the patient. convenient appointment times during business hours, and transport to specialist appointments were also offered. it is likely that health service and patient influences were barriers to treatment for ltbi, including treatment length, presence of contraindicating medical conditions, the potential for adverse medication reactions and access to specialist tb services, which have been shown in previous studies.20,21 health services must elicit and be receptive to aboriginal and torres strait islanders peoples’ views on ltbi treatment and find a way forward together to prevent tb. regularly providing tb specialist services at the acchs could improve follow-up, strengthen the acchs-tb team partnership, increase tb knowledge in gps, and contribute to two-way learning with aboriginal and torres strait islander peoples. since the start of the pilot project, many aboriginal and torres strait islander people have requested further information on tb or referred someone they knew with a history of tb to the acchs. the phu tb team, respiratory medical specialists and gps with tb knowledge and experience continue to provide outreach and education support for tb to acchs staff, including the doctors working in this community. limitations we could not estimate ltbi prevalence because only 7% of the target population was screened. financial support for the igra tests was limited and we were unable to continue to offer screening. the study design with a discretionary, gp-led approach to offering igra screening does not allow any conclusions regarding the reasons for or against participation by the patient. furthermore, we are unable to comment on the reasons or restraints to offering igra by the gp. a structured approach for igra screening (for example in the annual health assessment) as well as documented reasons as to why a patient declined the offered screening will improve evaluations of this model of care. limited data were available to compare participant characteristics. this study was not able to compare the igra screening outcomes with those for routine tb screening methods. conclusion tb incidence for the australian aboriginal and torres strait islander population is significantly higher than the australian-born non-indigenous population,2 and accessible and socioculturally appropriate health services are required to support the unique structures and care needs of aboriginal communities. two of the main limiting factors of this pilot project were the costs of igra and a discretionary approach to screening. further research, with a structured approach, needs to further evaluate the effectiveness of this model of care. we recommend that igra becomes accessible under medicare for aboriginal and torres strait islander people and for tb screening to be incorporated into the annual health assessment as a routine screening. ongoing community engagement and collaboration is necessary to develop tb elimination strategies for vulnerable and hard-to-reach groups. increasing access to screening and specialist care through the acchs will support this. this project identified policy and practice issues that need to be addressed to implement a sustainable tb screening programme with igra in an acchs. conflict of interest none. funding this project was supported by the department of health as an academic post for dr hannah visser. acknowledgements the authors wish to thank the acchs board of directors and all staff for their work, ongoing advice and support for this study and the aboriginal community for their participation, engagement and guidance. we would like to thank dr amelia kasper, associate professor michael douglas and ms tracie reinten, the north coast phu director, the manager of nsw tuberculosis program, tb nurses and aboriginal tb community engagement officers for their support. we acknowledge the aboriginal health and medical research council of nsw, the nsw tuberculosis advisory committee and the nsw ministry of health. references global tuberculosis report 2017. geneva: world health organization; 2017. available from: https://www.who.int/tb/publications/global_report/en/ toms c, stapledon r, coulter c, douglas p. tuberculosis notifications in australia, 2014. commun dis intell q rep. 2017 sep 1;41(3):e247–63. pmid:29720074 robertus lm, konstantinos a, hayman ne, paterson dl. tuberculosis in the australian indigenous population: history, current situation and future challenges. aust n z j public health. 2011 feb;35(1):6–9. doi:10.1111/j.1753-6405.2010.00663.x pmid:21299692 mack u, migliori gb, sester m, rieder hl, ehlers s, goletti d, et al.; c. lange; tbnet. ltbi: latent tuberculosis infection or lasting immune responses to m. tuberculosis? a tbnet consensus statement. eur respir j. 2009 may;33(5):956–73. doi:10.1183/09031936.00120908 pmid:19407047 comstock gw, livesay vt, woolpert sf. the prognosis of a positive tuberculin reaction in childhood and adolescence. am j epidemiol. 1974 feb;99(2):131–8. doi:10.1093/oxfordjournals.aje.a121593 pmid:4810628 menzies d, al jahdali h, al otaibi b. recent developments in treatment of latent tuberculosis infection. indian j med res. 2011 mar;133:257–66. pmid:21441678 latent tuberculosis infection: a guide for primary care providers. atlanta: centers for disease control and prevention; 2013. available from: https://www.cdc.gov/tb/publications/ltbi/pdf/targetedltbi.pdf the end tb strategy. geneva: world health organization; 2014. available from: https://www.who.int/tb/strategy/end-tb/en/ national tuberculosis advisory committee of communicable diseases. the strategic plan for control of tuberculosis in australia: 2011-2015. commun dis intell q rep. 2012 sep 30;36(3):e286–93. pmid:23186241 latent tuberculosis infection: updated and consolidated guidelines for programmatic management. geneva: world health organization; 2018. available from: https://www.who.int/tb/publications/2018/latent-tuberculosis-infection/en/ national tuberculosis advisory committee. position statement on interferon-γ release assays in the detection of latent tuberculosis infection. commun dis intell q rep. 2012 mar 31;36(1):125–31. pmid:23153089 bastian i, coulter c; national tuberculosis advisory committee (ntac). position statement on interferon-γ release assays for the detection of latent tuberculosis infection. commun dis intell q rep. 2017 dec 1;41(4):e322–36. pmid:29864386 devlin s, passmore e. ongoing transmission of tuberculosis in aboriginal communities in nsw. n s w public health bull. 2013 jul;24(1):38–42. doi:10.1071/nb12113 pmid:23849029 rudge s, massey pd. responding to pandemic (h1n1) 2009 influenza in aboriginal communities in nsw through collaboration between nsw health and the aboriginal community-controlled health sector. n s w public health bull. 2010 jan-feb;21(1-2):26–9. doi:10.1071/nb09040 pmid:20374691 pen cs [website]. melbourne: pen cs; 2015. available from: https://www.pencs.com.au/ framework towards tb elimination in low-incidence countries. geneva: world health organization; 2014. available from: https://www.who.int/tb/publications/elimination_framework/en/ houben rm, dodd pj. the global burden of latent tuberculosis infection: a re-estimation using mathematical modelling. plos med. 2016 oct 25;13(10):e1002152. doi:10.1371/journal.pmed.1002152 pmid:27780211 national guidelines for the public health management of tb. canberra: communicable disease network australia (cdna); 2015. available from: https://www.health.gov.au/internet/main/publishing.nsf/content/cdna-song-tuberculosis dehghani k, lan z, li p, michelsen sw, waites s, benedetti a, et al. determinants of tuberculosis trends in six indigenous populations of the usa, canada, and greenland from 1960 to 2014: a population-based study. lancet public health. 2018 mar;3(3):e133–42. doi:10.1016/s2468-2667(18)30002-1 pmid:29426597 atchison c, zenner d, barnett l, pareek m. treating latent tb in primary care: a survey of enablers and barriers among uk general practitioners. bmc infect dis. 2015 aug 13;15(1):331. doi:10.1186/s12879-015-1091-9 pmid:26268227 hirsch-moverman y, shrestha-kuwahara r, bethel j, blumberg hm, venkatappa tk, horsburgh cr, et al.; tuberculosis epidemiologic studies consortium (tbesc). latent tuberculous infection in the united states and canada: who completes treatment and why? int j tuberc lung dis. 2015 jan;19(1):31–8. doi:10.5588/ijtld.14.0373 pmid:25519787 mass poisoning after consumption of a hawksbill turtle, federated states of micronesia, 2010 original research boris i pavlin,a jennie musto,b moses pretrick,c joannes sarofalpiy,c perpetua sappa,d siana shapucyd and jacobus koolb a office of the who representative in papua new guinea, port moresby, papua new guinea. b division of pacific technical support, world health organization, suva, fiji. c department of health and social affairs, government of the federated states of micronesia, pohnpei, federated states of micronesia. d chuuk state hospital, chuuk state department of health services, chuuk, federated states of micronesia. correspondence to boris i pavlin (e-mail to: pavlinb@wpro.who.int). to cite this article: pavlin bi et al. mass poisoning after consumption of a hawksbill turtle, federated states of micronesia, 2010. western pacific surveillance and response journal, 2015, 6(1):25–32. doi:10.5365/wpsar.2014.5.3.006 abstract background: marine turtles of all species are capable of being toxic. on 17 october 2010, health authorities in the federated states of micronesia were notified of the sudden death of three children and the sickening of approximately 20 other people on murilo atoll in chuuk state. the illnesses were suspected to be the result of mass consumption of a hawksbill turtle (eretmochelys imbricata). an investigation team was assembled to confirm the cause of the outbreak, describe the epidemiology of cases and provide recommendations for control. methods: we conducted chart reviews, interviewed key informants, collected samples for laboratory analysis, performed environmental investigations and conducted a cohort study. results: four children and two adults died in the outbreak and 95 others were sickened; 84% of those who ate the turtle became ill (n = 101). the relative risk for developing illness after consuming the turtle was 11.1 (95% confidence inteval: 4.8–25.9); there was a dose-dependent relationship between amount of turtle meat consumed and risk of illness. environmental and epidemiological investigations revealed no alternative explanation for the mass illness. laboratory testing failed to identify a causative agent. conclusion: we concluded that turtle poisoning (also called chelonitoxism) was the cause of the outbreak on murilo. the range of illness described in this investigation is consistent with previously reported cases of chelonitoxism. this devastating incident highlights the dangers, particularly to children, of consuming turtle meat. future incidents are certain to occur unless action is taken to alter turtle-eating behaviour in coastal communities throughout the world. introduction marine turtles of all species, particularly hawksbill turtles (figure 1), can contain a variety of toxins including heavy metals (e.g. cadmium and mercury), organic compounds (e.g. pesticides such as chlordane and polychlorinated biphenyls) and biotoxins such as those produced by various blue-green algae on which turtles feed (e.g. lyngbyatoxin a from lyngbya majuscula).1 intoxication from consumption of marine turtles is called chelonitoxism. symptoms of chelonitoxism vary according to the toxin and include gastrointestinal symptoms of nausea, vomiting and oro-esophageal ulceration, sometimes followed in severe cases by neurologic signs such as paresis, agitation and coma.1,2 despite these hazards and despite the endangered status of all marine turtle species, these turtles are eaten by coastal communities throughout the world.1 figure 1. a typical hawksbill turtle click to download figure 1. jpg, 938kb source: http://commons.wikimedia.org/wiki/ file:hawksbill_sea_turtle_carey_de_ concha_(5840602412).jpg. the island nation of the federated states of micronesia comprises of 607 islands in the north pacific ocean (figure 2). on sunday, 17 october 2010, the federated states of micronesia department of health and social affairs and the world health organization (who) were notified of the sudden death of three children and the sickening of approximately 20 other people on murilo atoll, a small, isolated island with a population of approximately 330, located 161 kms from the main population centre of weno island in chuuk state. the illnesses were suspected to be the result of mass consumption of a hawksbill turtle (eretmochelys imbricata) that had been prepared and served on the afternoon of 15 october. shortly after the initial report, the deaths of another child and two hospitalized adults were reported; dozens of residents developed sore throats, and several dogs died suddenly. figure 2. location of murilo, chuuk state, federated states of micronesia click to download figure 2. jpg, 696kb source: chuuk state map was reproduced from wikimedia commons, the free media repository (http://commons.wikimedia.org/wiki/file: chuuk.png), and the inset map of the federated states of micronesia was reproduced from who division of pacific technical support ( http://www.wpro.who.int/southpacific/pacelf/ countries/fsm/en/). a response team set up a field hospital on murilo, and a investigation team was sent to confirm the cause of the outbreak, describe the epidemiology of cases and provide recommendations to prevent additional cases or outbreaks. methods hypothesis generation the outbreak investigation team held a community meeting on murilo on 25 october to explain the purpose of the investigation, gather initial information and answer questions from community members. on the morning of 26 october, the team interviewed all 20 community members who did not eat the turtle but who reported feeling ill to determine whether there was any other threat besides turtle poisoning that could explain the reported illnesses. information on all known ill persons was reviewed to determine onset dates and whether there was an ongoing environmental threat or an infectious condition. key informants from the community were interviewed about foods consumed as part of the turtle feast; presence of unusual environmental conditions such as chemical spills, algal blooms, fish die-offs and changes in reef ecology; and possibility of infectious etiology. case series a case was defined as a resident of murilo who had sudden death, sore throat, mouth sores or excessive thirst with onset of illness between 15 and 28 october. all cases who had eaten turtle (or were breastfed by mothers who had eaten turtle) were interviewed to determine the amount of turtle consumed, onset of illness and clinical features. proxy interviews were conducted with the local health assistant and family members of the six deceased cases; the medical charts of the two decedents who had been hospitalised were also reviewed. cohort study a retrospective cohort study was conducted to determine risk factors for illness using the same case definition as per the case series. all persons present at the turtle feast and their household members were interviewed (or proxy interviewed if deceased) with a standardized questionnaire. this comprised questions on demographics, preparation and consumption of turtle, consumption of other foods and drinks and illness. the quantity of turtle soup consumed was reported as multiples of a 70 ml jar. data were analysed using microsoft excel 2003, epiinfo 3.5.1 and stata 9. univariate logistic regression was used to examine the relationship between illness and the risk factors of age, sex, village, involvement in turtle preparation and consumption of turtle (no other food items were common to more than a few people). any risk factors approaching significance (p environmental investigation members of the investigation team together with an authority from the chuuk department of marine resources conducted an environmental assessment to look for evidence of contamination. additionally, every effort was made to secure food samples from the turtle feast for laboratory testing. laboratory testing samples of patient sera, turtle scutes (shell plates) and bones, internal organs from a deceased dog and algae were sent to forensic and scientific services, queensland, australia. testing was conducted for the following marine toxins: lyngbyatoxin a, debromoaplysiatoxin, okadaic acid, gymnodimine, pectenotoxin 2 and dinophysistoxins. ethics approval was not required as this investigation was conducted as part of a public health intervention. informed consents were obtained from all participants and for deceased cases from their next-of-kin. results hypothesis generation of the 20 ill people who did not eat turtle, 10 were diagnosed as influenza-like illness. the remaining 10 were attributed to various other ailments. all cases had a date of illness onset on or before 22 october, with the exception of three outliers (figure 3). many residents of murilo reported eating reef fish and other local foods around the time of the turtle feast and they did not become ill. figure 3. cases of turtle poisoning by date of onset of illness click to download figure 3. jpg, 187kb the turtle was captured alive from the murilo lagoon using a hook and line (no chemicals) approximately one week before the turtle feast and was apparently healthy. it was kept alive on land, but it died in the early part of the day of the feast, thought to be from heat exhaustion. the turtle was prepared simply by chopping all meat and organs into a single pot for cooking; it was not gutted. the turtle was then boiled in fresh water for two to three hours, after which the contents of the first pot were further chopped and boiled a second time after discarding and replacing the water. each household (including members of the extended family) was given a bowl of the turtle stew. in almost all instances, the stew was consumed immediately after it was served. each household ate its own variety of accompaniments with the stew (e.g. rice, breadfruit, taro); there were no other common foods served at the feast. the two adult brothers who died were involved in the butchering and cooking of the turtle. they were reported to have eaten a large amount of turtle at the feast (but not more than several others); it was also reported that the brothers may have eaten large amounts of turtle during cooking and preparation. residents reported that sea turtles were consumed on the island approximately twice a month, with most being green sea turtles (chelonia mydas). there had never been an incident related to turtle poisoning on murilo before this outbreak. other hawksbill turtles had been consumed in the past year without incident. residents were not aware of any hazard associated with consuming sea turtles. case series of the 120 people who consumed turtle (or who were breastfed by mothers who ate turtle), 101 ill people met the case definition. females accounted for 51% of cases (n = 52) and the median age was 17 years (range = 5 weeks to 70 years). the median incubation period from turtle consumption to illness was two days (range = 2 hours to 13 days) (figure 3). medical attention was sought by 37% of cases (n = 37). interviews were conducted 12 days after the exposure; only 27 of the 101 ill people had recovered at the time of interview. all surviving patients have reportedly since recovered. sore throat was the most frequently reported symptom, occurring in 84% of cases for whom responses were available (n = 76). other commonly reported symptoms included mouth pain (78%, n = 72), thirst (71%, n = 66) and burning throat (54%, n = 47; table 1). table 1. number and proportion of reported symptoms in cases, murilo, 2010* click to download table 1. jpg, 297kb * number of respondents varies as not all patients responded to all questions because several of the patients were infants. eight cases were breastfed infants whose mothers had consumed turtle, although two infants also consumed turtle themselves. several patients whose mouths were examined had pale yellow exudative lesions of the oropharynx and tongue. this was ubiquitous among those who had eaten turtle and had presented to the field hospital. fatal cases case 1 was a previously healthy five-year-old girl who consumed turtle meat at approximately 16:00 on 15 october and then vomited once approximately 24 hours after the meal. her only other reported symptom was thirst; however, she refused all oral liquids when offered. within 36 hours after consumption, on the morning of 17 october, she developed seizures and died shortly afterwards. case 2 was a previously healthy two-year-old girl and the sister of case 1 who died within minutes of her sibling. the mother reported that the child woke irritable, distressed and with abdominal pain at approximately 03:00 on 16 october, was settled after breastfeeding but died shortly after. case 2 consumed a small amount of turtle meat but was breastfed by her mother within three hours after she had eaten turtle. case 3 was a previously healthy two-year-old boy who did not consume turtle but was breastfed by his mother after she consumed large amounts of turtle. case 3 had two episodes of diarrhoea on the night of 16 october and another in the early morning of 17 october. he died shortly thereafter. case 4 was a previously healthy 21-year-old man who consumed turtle at approximately 16:00 on 15 october. approximately two hours later he experienced nausea but did not vomit. the following evening, he vomited more than 10 times and then eventually went to sleep. the next morning he felt better and went fishing. while at sea he developed haematemesis and was evacuated to chuuk state hospital on weno island by a nearby supply ship. on the boat he became restless and disoriented and did not recognize his relatives. ambulance drivers on weno noted the case had an unusual smell unlike anything they had experienced. at the hospital he was agitated and combative and required sedation. he was placed in the intensive care unit and administered intravenous fluids: mannitol for presumed ciguatera intoxication and dexamethasone for presumed cerebral oedema. a neurologic exam found the patient was profoundly lethargic with pinpoint pupils and hyperreflexia in all extremities. vital signs were within normal ranges except for an elevated respiratory rate. laboratory values were unremarkable except for mild neutrophilia. radiography was unremarkable. over the following two days, the patient remained profoundly lethargic and developed sustained clonus and an upward plantar reflex. his chemistries were notable for markedly elevated aminotransferases, amylase and creatinine. the patient remained in this state until 21 october when he developed respiratory distress requiring intubation and mechanical ventilation. he was removed from the ventilator at the request of his family in the early morning of 22 october and died at 04:00. case 5 was the brother of case 4, a previously healthy 22-year-old man who consumed turtle at approximately 16:00 on 15 october. three hours later he felt nauseated, did not vomit but reported thirst. on the following evening he vomited several times. on the third day he was noted to have headache, weakness, fever, disorientation and agitation. he was taken to the hospital intensive care unit on the morning of 19 october and placed on intravenous fluids: mannitol for presumed ciguatera intoxication and dexamethasone for presumed cerebral oedema. he was restless and disoriented but otherwise unremarkable. initial radiography and laboratory investigation were also unremarkable. over the course of the evening the patient became agitated and combative and required sedation. on the evening of 21 october the patient developed severe respiratory distress, and he died at 01:00 on 22 october. case 6 was a previously healthy four-year-old boy who ate turtle on the evening of 15 october. he vomited on the evenings of 16 and 17 october, then appeared well until he reported a sore throat on 21 october. in the early morning of 22 october he vomited once, collapsed and died. for all decedent cases, except for case 4 whose serum was sent for laboratory analysis, no samples were taken and autopsies were not performed. cohort study the cohort study included 186 residents of murilo present at the turtle feast and their household members. consumption of turtle stew had an attack rate of 84% (101/120). the relative risk of developing illness after consuming turtle stew in univariate analysis was 11.1 (95% confidence interval: 4.8–25.9). in multivariate analysis, consumption of turtle was the only risk factor associated with illness; village and involvement in the preparation of turtle were not (data not shown). there was a statistically significant dose-response relationship between the amount of turtle consumed and the odds of developing illness (table 2) with the exception of the last category (four or greater). when stratified by age under 10 versus 10 and above, the dose response was similar (data not shown). table 2. dose-response of odds of illness for amounts of turtle consumed, murilo, 2010 click to download table 2. jpg, 306kb * 1 dose was a 70 ml cup. this table does not include five cases who were exclusively breastfed and 11 cases where the amount consumed is unknown. environmental investigation no obvious evidence of acute environmental contamination was found. the reef surrounding murilo was in extremely poor condition, consisting of predominantly dead coral and large amounts of algae presumed to be lyngbya majuscula (figure 4). figure 4. abundant algae presumed to be lyngbya majuscula, also known as “mermaid’s hair” click to download figure 4. jpg, 758kb no leftover turtle meat was found – the community consumed most of the turtle and discarded the remainder into the sea. however, the scutes and several bones were recovered. these were sent for laboratory analysis. at least six dogs were reported to have died suddenly, presumably after eating turtle leftovers. all but two of these dogs were subsequently discarded or consumed (there were no reports of illness after consuming dogs). of the remaining two, one was completely decomposed; the other, not completely decomposed, was dissected and stomach contents were sent for laboratory analysis. laboratory testing all samples tested were below the limit of detection for all toxins tested. discussion this investigation shows strong epidemiologic evidence that chelonitoxism was the cause of mass illness on murilo. the convincing dose-response relationship particularly supports that turtle was the cause of illness. we suspect that the dose-response failure of those who reported eating more than four servings of turtle was due to consumption of less turtle stew than reported. children are expected to be more severely affected by chelonitoxism due to their lower body mass and more sensitive immune systems.1 therefore the death of several children in this outbreak was not unexpected. it is not clear why one child (case 6) reported a non-serious illness only to die suddenly several days later. it is also not clear why the two adult males developed serious disease and died, although there was some evidence that they may have eaten larger amounts of turtle than the others before the feast. that they alone may have eaten raw turtle during preparation is likely not relevant as most chelonitoxins are heat-stable.3 several infants developed illness without eating turtle but had been breastfed from a mother who ate turtle. passage of chelonitoxins through breast milk has been documented.3 the toxins are thought to be virtually eliminated from the body within a few days, posing no ongoing threat for breastfeeding infants in murilo. there is no other known transmission of these toxins from person to person. the range of illness described in this investigation, from relatively mild mucus membrane irritation to coma and death, is consistent with previously reported cases of chelonitoxism.2 despite intensive care, patients may succumb to the effects of the poison as there is no specific treatment for chelonitoxism. one possible toxin that may explain the widespread illness reported during this investigation is lyngbyatoxin a, the major toxin produced by lyngbya majuscula. it has a direct inflammatory effect on tissue,4 which my have caused the sore throats, mouth pain and oral ulcers. although there is little evidence of neurotoxicity of lyngbyatoxin, it is possible that large quantities may account for the neurologic toxicity seen in the fatal cases and as documented in other reports of severe chelonitoxism.2 lyngbyatoxin a has been isolated from a green sea turtle (chelonia mydas) associated with fatal chelonitoxism5 but not a hawksbill turtle. although hawksbill turtles are carnivores, they also feed on sea grasses and algae,6 so algal toxins cannot be ruled out. the clinical picture of chelonitoxism caused by chelonia mydas is the same as that caused by eretmochelys imbricata,7,8 hence the toxin could have been either of these. in this study, all human, animal and algal samples were negative for all toxins tested. chelonitoxins have not been found previously in patient sera and only have been isolated from turtle meat,5 not scutes or bones, which were the only turtle tissues available here. although the algae tested, which appeared to be lyngbya majuscula, did not contain toxins, we cannot rule out the possibility that lyngbyatoxin was the etiology, as the turtle may have grazed from a different algal site. alternatively, another toxin that was not tested for may have been the cause. it is possible that failure to detect toxins resulted from inadequate sampling or incomplete testing rather than true absence of toxins in the consumed turtle. hawksbill turtles have routinely been eaten on murilo, yet there is no history of previous poisoning related to turtle consumption. it is not clear why the turtle eaten in this outbreak was toxic; however, most sea turtle species, particularly hawksbill turtles, can be poisonous if consumed.3 there is no reliable way to determine which individual turtles are poisonous, but it is more likely if they have eaten foods that may contain high levels of toxins. foods high in toxins include blue-green algae such as lyngbya majuscula and also a variety of sponges and other marine organisms. turtle eggs are also known to have high levels of a variety of toxins.1 there have been reports of other turtle poisonings in the federated states of micronesia including on sapwuahfik, pohnpei state, in april 2010 (d buden, personal communication) and two previous incidents (including three deaths) on the same island in 1997.9 as any turtle or turtle eggs may be toxic (i.e. murilo is not unique), we recommended the cessation of consumption of turtle products throughout the federated states of micronesia. even though sea turtles are relatively abundant in chuuk, they are endangered throughout the world (hawksbill turtles are critically endangered);10 therefore, efforts to protect human health by reducing turtle capture have the added benefit of helping to conserve these rapidly disappearing species. the devastating incident on murilo highlights the dangers, particularly to children, of consuming turtle meat. future incidents are certain to occur unless action is taken to alter turtle-eating behaviour in coastal communities throughout the world. since all turtles and their eggs are capable of being toxic, we strongly recommend ceasing consumption of any turtles or their eggs to protect public health. funding none. conflicts of interest none declared. acknowledgements we would like to acknowledge the assistance of the community of murilo, the chuuk police department, department of health services, and department of marine resources in our investigation. particular thanks goes to ismael shapucy, kachusy farek, pastor mesenty, dave williander, tafson menesio, riten billias, curtis sos, alex narruhn and benty rickson. we also thank forensic and scientific services, queensland, australia, for providing laboratory testing of samples. finally, we acknowledge the clinical care and data provided by the late herliep nowell. references: aguirre aa et al. hazards associated with the consumption of sea turtle meat and eggs: a review for health care workers and the general public. ecohealth, 2006, 3:141–153. doi:10.1007/s10393-006-0032-x fussy a et al. chelonitoxism: new case reports in french polynesia and review of the literature. toxicon, 2007, 49:827–832. doi:10.1016/j.toxicon.2006.12.002 pmid:17250862 limpus cj. sea turtles. in: covacevich j, editor. toxic plants and animals: a guide for australia. brisbane, queensland museum, 1987:189–194. osborne njt, webb pm, shaw gr. the toxins of lyngbya majuscula and their human and ecological health effects. environment international, 2001, 27:381–392. doi:10.1016/s0160-4120(01)00098-8 pmid:11757852 yasumoto t. fish poisoning due to toxins of microalgal origins in the pacific. toxicon, 1998, 36:1515–1518. doi:10.1016/s0041-0101(98)00142-1 pmid:9792166 limpus cj. hawksbill turtle, eretmochelys imbricata (linnaeus). in: fein l, editor. a biological review of australian marine turtle species. brisbane, queensland environmental protection agency, 2009: 1–53. champetier de ribes g et al. un problème de santé réémergent à madagascar: les intoxications collectives par consommation d’animaux marins. aspects épidémiologiques, cliniques et toxicologiques des épisodes notifiés de janvier 1993 à janvier 1998 [in french]. archives de l’institut pasteur de madagascar, 1998, 64: 71–76. champetier de ribes g et al. intoxications par animaux marins vénéneux à madagascar (ichtyosarcotoxisme et chélonitoxisme): données épidémiologiques récentes [in french]. bulletin de la société de pathologie exotique, 2007, 90: 268–272. buden dw. the reptiles of sapwuahfik atoll, federated states of micronesia. micronesia, 2000, 32:245–56. iucn red list of threatened species. version 2014.3. cambridge, united kingdom, international union of conservation of nature and natual resources, 2014. available from: http://www.iucnredlist.org [accessed 4 december 2014]. is the response over? the transition from response to recovery in the health sector post-typhoon haiyan perspective allison gocotano,a lester sam geroy,a ma rowena alcido,ab miguel manuel dorotan,ab gloria balboab and julie lyn halla a office of the who representative in the philippines, sta cruz, manila, philippines. b health emergency management bureau, department of health, sta cruz, manila, philippines. correspondence to allison gocotano (emails: gocotanoa@who.int or allisongocotano@gmail.com). to cite this article: gocotano a et al. is the response over? the transition from response to recovery in the health sector post-typhoon haiyan. western pacific surveillance and response journal, 2015, 6(suppl 1):5–9. doi:10.5365/wpsar.2015.6.2.hyn_007 the philippine national disaster risk reduction and management plan divides disaster management into four phases: (1) prevention and mitigation; (2) preparedness; (3) response; and (4) recovery and rehabilitation.1 the recovery process is defined as “a sequence of interdependent and often concurrent activities that progressively advance a community toward a successful recovery” and extends from ongoing preparedness to long-term recovery with an overlap between the acute response and short-term and intermediate recovery.2 in this paper, this period of overlap between response and recovery in the philippines occurred three to seven months post-typhoon haiyan – february 2014 to july 2014. the need to define when recovery began post-haiyan had programmatic implications which included (1) waiving the normal policy of donated medicines and shouldering the tax duties of donors, (2) waiving the licence to practise medicine for foreign professionals and (3) expedited government and non-government administrative processes during an emergency. government and humanitarian actors needed a common understanding of the different phases of the emergency to determine programme priorities. for instance, the tuberculosis programme prioritized tracing all patients (and records) and restoring their treatment in the response phase; in the recovery phase, active case finding was resumed.3 the philippines’ surveillance in post extreme emergencies and disasters (speed), the mobile-based early warning system, was implemented during the response phase and should be shifted to the philippine integrated disease surveillance and response system in the recovery phase.4 during the overlap period between response and recovery activities, the authors were all working in the health sector at the national level supporting coordination and strategic planning with government and partners and at the field level implementing response activities and revisiting the mediumand long-term programming approach to recovery. it is from this perspective, combined with data from existing documents such as plans, reports and policies, that we highlight the need to define a period of transition from response to recovery of the health sector as it may have important implications on the health system functioning as a whole. response phase the philippine government declared a state of national calamity on 11 november 2013, three days after the typhoon, triggering the involvement of the international community. the philippine health sector response started before this declaration and was characterized by the deployment of personnel, monetary assistance and the distribution of goods for lifesaving measures in preparation for anticipated health needs. the emergency relief coordinator formally activated an inter-agency standing committee (iasc) level 3 emergency response the following day (12 november), noting that the magnitude of this sudden-onset humanitarian crisis justified system-wide resource mobilization.5 a massive international response was launched, and more than 450 international, surge-capacity staff of various expertise were deployed within three weeks. the united nations humanitarian coordination team in the philippines issued a humanitarian action plan on the same day as level 3 activation.6 a month later, in december 2013, the office of the presidential assistant for recovery and rehabilitation (oparr) was established. oparr was an ad hoc government agency mandated to coordinate, facilitate, and integrate the short-, mediumand long-term recovery plans with an overall strategic vision. prior to typhoon haiyan, disaster rehabilitation efforts were overseen by the philippine national economic and development authority (neda) that worked with oparr to monitor and evaluate the rehabilitation effort. plans issued from nongovernment and government sectors detailed damage and needs assessments, and the funding requirements for response. one month after haiyan, the strategic response plan was released by the united nations humanitarian coordination team detailing the health sector’s priorities to provide life-saving measures, immediate access to water, sanitation, hygiene and to re-establish health services to prevent increased morbidity and mortality.7 the government, through neda, issued reconstruction assistance on yolanda (ray), a strategic plan to guide the recovery and reconstruction of areas affected by typhoon haiyan (yolanda) over the short (2013 to 2014) to medium term (2015 and beyond).8 the health priorities of ray were repair and reconstruction of public facilities to their pre-disaster state; risk reduction and community resilience, support for health services; mental health and psychosocial support; and governance strengthening. transition phase there were differing views as to when the response phase ended and recovery began. from the international view, iasc confirmed the deactivation of the level 3 response on 11 february 2014 (three months after it was issued).5,9 from the national view, it ended when the philippines officially transitioned from the humanitarian relief phase to the rehabilitation and recovery phase on 4 july 2014 (seven months post-haiyan).10 this four-month difference between declarations represented the overlap between the response and recovery phases for typhoon haiyan from both perspectives, and in the context of this discussion, is labelled as the ‘transition phase’. when level 3 was de-activated, speed was seeing a decline in consultations to the level similar to normal conditions.11 almost half of the foreign medical teams left after the first month of the response (figure 1).12 figure 1. timeline of the response and recovery phases for typhoon haiyan, the philippines, november 2013 to august 2014 click to download figure 1. jpg, 717kb speed, surveillance in post extreme emergencies and disasters. the decline of consultations and utilization of medical missions coincided with the work of nongovernmental organizations (ngos) supplementing the health sector. most of the ngo medical missions were funded and active between four and six months post-haiyan. since consultations had reduced, there was no urgency to continue their services. around the fourth month, local governments took over the bulk of health service delivery to the people. many of the international partners handed over patients and donated surplus medical equipment and supplies to local health authorities when they left. of the health partners who stayed on, a shift from an emergency to a mediumto long-term development agenda was observed. during this period, coordination of remaining health actors also evolved. while a cluster system of coordination was still operational at the national and regional levels, in march 2014, oparr requested all health actors develop rehabilitation plans. these then formed the master rehabilitation plan, including activities for health facility repairs and construction for social services through support to several public health programmes.13 the private sector contribution was also documented in the oparr master plan. in may 2014, two months later, the transition to recovery was formalized when the national emergency response health cluster structure transitioned into the health sector rehabilitation and reconstruction coordination group.14 this national-level action was reflected at subnational government levels in three ways: (1) individual cluster meetings (health; water, sanitation and hygiene; nutrition; and mental health and psychosocial support) were integrated; (2) the frequency of meetings decreased from daily to monthly by june 2014; and (3) activities initially supported by the international co-cluster leads were gradually handed over to the government. the previously established five subnational level health coordination hubs (ormoc, roxas, cebu, tacloban and eastern samar) were reduced to four with the remaining hubs coordinating recovery work.15 as well as the ongoing disaster-related activities, annual operational plans had to be implemented by the government. in some instances this caused tension between international and government health workers. international health workers felt a strong responsibility to the still affected population and national health workers had a strong desire to rebalance priorities.6 given this, minor setbacks in achieving routine outcomes were expected during this period. however, this was not the case post-haiyan, as setbacks were minimal. similar indications of transition were observed in service delivery and health programmes during this four-month period. there was an increase in the percentage of functional health facilities in the affected area from 48% (139/289) in november 2013 to 61% (177/289) in december (figure 1);16 functionality was an indication of continuity of basic health-care services. in addition, the increase in the number of toilets installed from 428 in december 2013, to 6479 in february 2014 addressed water and sanitation concerns.17 the local heath capacity was further improved with several trainings on long-term health programming. the package of essential noncommunicable disease interventions for primary health care in low resource settings (pen) started in june 2014 to address early detection and treatment in the community;18 the mental health gap action programme (mhgap), with more than 130 health professionals, institutionalized the mental health services at the primary care level.19 another sign of a recovering health system was the improvement in selected indicators (figure 1).3 the iasc, in its evaluation, concluded that transition included a change in (1) the nature of affected people’s needs (emergency to early recovery); (2) the type of programme approaches to meet changing needs (humanitarian to recovery to development); and (3) structures and systems for coordination of assistance (closure of response clusters).6 the lack of familiarity with the capacities of a middle-income country; differences between international and national planning time frames; and different views on the boundaries and linkages between emergency relief, early recovery and recovery all contributed to the complexities of transitioning from relief to recovery programming. further complications were that sectors and regions recovered at different paces and uncertainty on the government’s timetable to begin large-scale recovery programmes.6 conclusion labelling a temporal mark between response and recovery may have varying implications. first, the degree of significance of the emergency in terms of local and global attention could be altered with consequences on funding opportunities. second, the declaration of recovery does not imply a reduced humanitarian need or that ongoing interventions can cease; rather, that there is a change in the type of assistance needed. third, activities might be the same but are now viewed more from the outlook of proactive governance. this change in outlook from victims to survivors is an important factor in the normalization of day-to-day activities which facilitates recovery. there is a growing notion that recovery starts immediately after an event, but the haiyan experience showed the transition period was an overlap of different activities among non-government and government agencies at different levels of the health sector. there may have been variability in the way transition was experienced by key stakeholders, operationally and for reprogramming, and there were some improvements within the health system, such as the decrease of external medical teams, handing over patients to local health authorities, increase in functional health facilities as well as capacity-building activities through trainings like pen and mhgap. therefore, we suggest that there is no one-time point in which recovery begins, rather there is a transition period of response to recovery that may be different for each disaster. this transition involves the complex network of stakeholders and actions that define the transition period – a period where remaining gaps in response are addressed and that identifies the direction and speed of improving the state of the public’s health to better than what it was before the disaster. conflicts of interest none declared. funding none. acknowledgements the authors would like to thank the philippines department of health, in particular the health emergency management bureau and regional offices 6, 7 and 8. we also extend our gratitude to the staff of who representative office in the philippines for sharing their experiences and expertise. finally, we would like to acknowledge those who worked on the front lines for the typhoon haiyan response and recovery. references the national disaster risk reduction and management plan 2011–2028: final version december 2011. manila, national disaster risk reduction and management council (philippines), 2012. available from: http://www.ndrrmc.gov.ph/attachments/ article/41/ndrrm_plan_2011-2028.pdf [accessed 10 august 2015]. national disaster recovery framework: strengthening disaster recovery for the nation. washington, dc, federal emergency management agency (us), 2011. available from: http://www.fema.gov/pdf/recoveryframework/ndrf.pdf [accessed 10 august 2015]. lew w et al. re-starting tuberculosis programme post-haiyan. western pacific surveillance and response journal, 2015, 6(supp 1):91–85. doi:10.5365/wpsar.2015.6.2.hyn_009 tante s et al. which surveillance systems were operational after typhoon haiyan? western pacific surveillance and response journal, 2015, 6(supp 1):66–70. doi:10.5365/wpsar.2015.6.2.hyn_015 inter-agency standing committee transformative agenda reference document: 2. humanitarian system-wide emergency activation – definition and procedures. geneva, inter-agency standing committee, 2012. available from: https://interagencystandingcommittee.org/system/files/legacy_files/2.%20system-wide%20%28level%203%29%20activation%20%2820apr12%29.pdf [accessed 10 august 2015]. hanley t et al. iasc inter-agency humanitarian evaluation of the typhoon haiyan response. new york, united nations office for coordination of humanitarian affairs, 2014. available from: http://www.alnap.org/resource/19318.aspx [accessed 10 august 2015]. philippines humanitarian country team. philippines: strategic response plan for typhoon haiyan (november 2013–november 2014). new york, united nations office for coordination of humanitarian affairs, 2013. available from: http://www.unocha.org/cap/appeals/philippines-strategic-response-plan-typhoon-haiyan-november-2013-november-2014 [accessed 10 august 2015]. official gazette: reconstruction assistance on yolanda. manila, national economic and development authority, 2013. available from: http://www.gov.ph/2013/12/18/ document-reconstruction-assistance-on-yolanda/ [accessed 10 august 2015]. iasc principals meeting on 14 february 2014 philippines and south sudan – final action points. geneva, inter-agency standing committee, 2014. available from: https://interagencystandingcommittee.org/system/files/legacy_files/iasc%20 principals%20ad%20hoc%2014%20february%202014_%20final%20 action%20points.pdf [accessed 10 august 2015]. typhoon yolanda: a year later. manila, republic of the philippines, 2014. available from: http://www.gov.ph/crisis-response/updates-typhoon-yolanda/ [accessed 10 august 2015]. department of health (philippines) and world health organization. ewarn weekly summary report: week 18, final report (reporting period 10 november 2013 to 08 march 2014). manila, world health organization in the philippines, 2014. available from: http://www.wpro.who.int/philippines/typhoon_haiyan/media/ewarn-10nov2013-8mar2014.pdf?ua=1 [accessed 10 august 2015]. brolin m, hawajri o, von schreeb j. foreign medical teams in the philippines after typhoon haiyan 2013 – who were they, when did they arrive and what did they do? plos currents disasters, 2015. yolanda rehabilitation and recovery efforts: consolidated as of 28 july 2014. taguig, office of the presidential assistant for rehabilitation and recovery, 2014. available from: http://president.gov.ph/wp-content/uploads/2014/08/revised-draftyolanda-rehab-briefer-as-of-1-aug-2014-w-status-report.pdf [accessed 10 august 2015]. minutes of the meeting/records of discussion: health partners coordination meeting on rehabilitation post-yolanda, 13 may 2014. manila, department of health, 2014 [internal document, unpublished]. department of health (philippines) and world health organization. philippines health cluster bulletin, issue #5, 3 december 2013. manila, world health organization in the philippines, 2013. available from: http://www.wpro.who.int/philippines/ typhoon_haiyan/media/haiyan.healthclusterbulletin5.03dec2013.pdf?ua=1 [accessed 10 august 2015]. health emergency alert reporting system plus report, 10 january 2014. manila, health emergency management bureau, department of health, 2014. [internal document, unpublished] health emergency alert reporting system plus report, 24 february 2014. manila, health emergency management bureau, department of health, 2014 [internal document, unpublished]. martinez re et al. use of who pacakage of essential noncommunicable disease interventions after typhoon haiyan. western pacific surveillance and response journal, 2015, 6(supp 1):18–20. doi:10.5365/wpsar.2015.6.2.hyn_024 mcpherson m, counahan m, hall jl. responding to typhoon haiyan in the philippines. western pacific surveillance and response journal, 2015, 6(supp 1): 1–4. doi:10.5365/wpsar.2015.6.4.hyn_026 a retrospective cohort study on cassava food poisoning, santa cruz, davao del sur, philippines, october 2015 outbreak investigation report johnette peñas,a vikki carr de los reyes,a ma. nemia sucaldito,a denisse lou manalili,a herdie hizona and rio magpantaya a department of health, philippines. correspondence to johnette peñas (email:penasjohnettea@gmail.com). to cite this article: peñas j, de los reyes vc, sucaldito mn, manalili dl, hizon h, magpantay r. a retrospective cohort study on cassava food poisoning, santa cruz, davao del sur, philippines, october 2015. western pac surveill response j. 2018 oct;9(4). doi:10.5365/wpsar.2017.8.1.010 abstract objective: on 2 october 2015, the event-based surveillance and response unit of the department of health (doh), philippines received a report of foodborne illness cases in santa cruz, davao del sur. a team from doh was sent to conduct an investigation to identify the implicated source and determine risk factors. methods: a retrospective cohort study was done. a suspect case was defined as a previously well individual in compound a, santa cruz who developed abdominal pain, headache, dizziness, diarrhoea or vomiting on either 1 or 2 october 2015. a confirmed case was a suspect case positive for cyanide in urine. family members who prepared the food were interviewed. urine specimens were collected to test for thiocyanate, and cassava tuber and soil samples were tested for cyanide and other chemicals. result: fourteen cases with two deaths were identified (case fatality ratio: 14%). all cases consumed cassava on 1 october 2015 except for one child who spat it out. urine samples were all negative (36, 100%) for thiocyanate so there were no confirmed cases. the cassava sample had a cyanide level of 68.94 ug/g and was identified as bitter cassava, also known as a potentially dangerous kind. insufficient food preparation was noted. in the retrospective cohort study, intake of cassava (rr = 208, 95% ci: 19.94–2169.32) was associated with the illness. discussion: this study identified insufficiently processed cassava root crop as the source of the foodborne illness. the cassava consumed was the bitter variety that contains greater than 50 ug/g of hydrogen cyanide and requires thorough preparation before consumption. community education was provided on identifying and preparing cassava appropriately. introduction cassava is the third most important source of calories in the tropics.1 millions of people depend on cassava in africa, latin america and asia both for food security and income generation.2 in the philippines, cassava is advocated as an alternative staple to rice under the department of agriculture – food staple self-sufficiency program.3 however, several cases of acute poisoning, some leading to death, following consumption of a cassava-based meal have been reported.4–7 common symptoms include dizziness, nausea, headache, abdominal pain and diarrhoea.8 this is due to the toxic chemical linamarin which occurs in varying amounts in all parts of the cassava plant. ingested linamarin can release cyanide in the gut during digestion, causing illness and sometimes death.9 cassava is generally classified into two main types: sweet cassava and bitter cassava. cassava roots with less than 50 ug/g hydrogen cyanide on fresh weight basis are considered sweet; above this level, cassava roots are considered bitter.10 sweet cassava roots can be made safe to eat by peeling and thoroughly cooking. for bitter cassava, one traditional way to effectively reduce its cyanide content is by peeling the root crop followed by grating, prolonged soaking (18–24 hours), squeezing and thorough cooking.11 on 2 october 2015, the davao department of health (doh) regional office, reported to the event-based surveillance and response unit of doh several foodborne illness cases in santa cruz, davao del sur. santa cruz is a municipality located in davao region, which is part of the mindanao group of islands. the municipality is situated about 988 km south-east of the philippine capital manila. a team from doh was sent to conduct an investigation to identify the implicated source and determine risk factors. methods epidemiological investigations a suspect case was defined as a previously well individual in compound a, a residential area shared by seven families in santa cruz, who developed abdominal pain, headache, dizziness, diarrhoea or vomiting on either 1 or 2 october 2015. a confirmed case was defined as a suspect case positive for cyanide in the urine. case finding was done by reviewing medical records in cereville medical clinic, davao del sur provincial hospital and southern philippines medical center. a retrospective cohort study was done in compound a. all residents were interviewed using a standard questionnaire comprising questions on demographics, symptoms, hygiene practices and 24-hour food recall. a parent was interviewed for the two fatal cases, and children were interviewed along with their parents for all other cases. we calculated relative risks (rr), 95% confidence intervals (ci) and p values using epi info 3.5.4. risk factors approaching significance (p < 0.2) in bivariate analysis were retained for multivariable logistic regression using a forward stepwise procedure. laboratory examination twenty-eight blood specimens (from nine ill and 19 not ill people) were collected to measure sulfhaemoglobin and methaemoglobin levels to determine exposure to oxidizing drugs or toxins. thirty-six urine samples (from 10 ill and 26 not ill people) were collected for thiocyanate testing to identify the presence of cassava derivatives.12 cassava tuber from the same cassava plant consumed by the families and soil samples from where it was planted were collected to test for cyanide and pesticides. a cyanide level of more than 50 ug/g would classify the cassava as bitter type.10 all samples were collected on 6 october 2015. blood specimens were sent to east avenue medical center, quezon city. urine, cassava and soil samples were analysed at chempro analytical services laboratories inc., pasig city. environmental investigation a site visit was conducted in compound a to identify the circumstances surrounding the event. we interviewed family members who cooked the cassava crop about its source and preparation. we also inspected the source-farm where the raw cassava was harvested. information on the variety of cassava was elicited from the municipal agriculturist. we asked the farmer about pesticides and other chemicals used in growing cassava. results cases fourteen cases were identified. the incubation period ranged from one hour to 12 hours (median = 3.25 hours). the earliest onset of illness was at 17:00, one hour after intake of the cassava; this was the peak of the epidemic curve (fig. 1). the last case was a 1-year-old child who was fed by her mother with two spoonfuls of cassava, which the child spat out. most of the cases had abdominal pain (13/14, 93%) followed by diarrhoea (4/14, 29%), headache (3/14, 21%), dizziness (3/14, 21%) and vomiting (3/14, 21%). thirteen cases sought medical care, but three refused hospital admission. two cases were referred for further management but died before they were transported to another facility (case fatality ratio = 14%). fig. 1. number of cases by date and time of illness onset, cassava poisoning, compound a, santa cruz, davao del sur, october 2015 (n=14) click to download figure 1. jpg, 368kb cases ranged in age from 1 to 28 years (median = 11 years); seven (50%) were males. the most affected age group was 0–4 years old. all cases were from two families in compound a. all of them ate cassava before the onset of illness except for one child who spat it out. profile of deaths ages of the two fatalities were 4 and 2 years. both were males from the same household. the older child died three hours after manifesting symptoms. the other child was pronounced dead five hours after onset of illness. both had consumed four slices of boiled cassava. retrospective cohort study all (65, 100%) residents of compound a were interviewed. seventeen (25%) ate boiled cassava. on bivariate analysis, we found that age 0–5 years (rr = 4.91, 95% ci: 2.16–11.18) and intake of cassava (rr = 39.81, 95% ci: 5.64–280.99) were associated with the illness. handwashing before eating (rr = 0.24, 95% ci: 0.11–0.52) was found to be inversely associated with the event. after multivariable analysis, intake of cassava (rr = 208, 95% ci: 19.94–2169.32) was the only risk factor associated with the illness (table 1). table 1. factors associated with cassava poisoning, compound a, santa cruz, davao del sur, october 2015 click to download table 1. jpg, 573kb environmental investigation the cassava was harvested by the father in family a and was shared with family b. the cassava was prepared by the father in family a and by a daughter in family b. the cassava was peeled, washed and boiled in water for one hour. no other ingredients were added. family a shared the cooked cassava among themselves. family b shared it with families c and d. the farmer who planted the cassava claimed that no fertilizer was used. sweet and bitter varieties were grown in the field, and all were intended to be processed into animal feed and not for household consumption. the cassava had been harvested without permission. laboratory examination sulfhaemoglobin was not detected in 28 clinical specimens. methaemoglobin was not detected in eight (29%) individuals and the rest were below 0.5 g/dl (normal limit). urine tests for thiocyanate were all negative (36, 100%). the cassava sample had a cyanide level of 68.94 ug/g. organochloride and organophosphate pesticides were not detected in cassava and soil samples. discussion this foodborne outbreak was most likely due to consumption of insufficiently processed bitter cassava. the cassava sample had a cyanide level of 68.94 ug/g, which classified it as the bitter variety. although there were no confirmed cases, all except one case had a history of boiled cassava intake, and eating cassava was a significant risk factor (rr = 208, 95% ci: 19.94–2169.32). signs and symptoms manifested by cases were consistent with those reported in other studies.4,5,8 insufficient processing of cassava was attributed to this outbreak as it has been in other outbreaks.6,7 cassava varieties are usually differentiated from one another by their morphological characteristics such as colour of stems, petioles, leaves and tubers. generally, the bitter varieties of cassava are recognized by dark leaves and stems, often tending to be reddish in colour, whereas the sweet varieties have light-green leaves and stems.13 this does not apply in the philippines where petioles and stems of several varieties of sweet cassava are pink or red. the two plants are extremely difficult to distinguish in the field, and distinction between them rests upon the content of hydrocyanic acid.14 this could explain why the father harvested the bitter variety of cassava instead of the sweet type. the cassava he harvested was meant as animal feed. the cases' sulfhaemoglobin and methaemoglobin levels were insignificant; organochloride and organophosphate pesticides were not detected in cassava or soil samples. this rejects a possible relationship of other chemicals to these food poisonings. however, it is also likely that sulfhaemoglobin and methaemoglobin tested normal or within limit because no samples were collected from the two fatalities who might have had higher exposures. this study has some limitations. there was no leftover boiled cassava for testing, and no specimens were collected from the two fatalities. all urine samples were negative for cyanide, and there were no laboratory-confirmed cases. however, as the urine samples were collected four days after the incident, it is possible that thiocyanate in the urine was not detected because most of cyanide by-products leave the body within 24 hours after exposure.15 despite these limitations, valid statistical and cause-and-effect association strongly suggest cassava as the cause of this foodborne outbreak. as a result of this outbreak, a doh memorandum on health advice on common plants containing toxins was disseminated and reiterated by the southern philippines medical center and davao doh regional office. health advice includes information on early signs of acute cyanide poisoning, management and the recommended processing (peeling outer skin, grating, soaking in water and squeezing) and cooking regardless of the variety of cassava. community education was conducted in villages of santa cruz municipality. public awareness on cassava varieties and its proper preparation is essential to prevent this kind of incident. conflicts of interest the authors declare that there is no conflict of interest. funding this foodborne outbreak investigation was funded by the department of health, philippines. acknowledgements we extend our sincere gratitude to the davao department of health regional office, davao del sur provincial health office, the local government unit of santa cruz and town residents, santa cruz municipal health office, southern philippines medical center, davao del sur provincial hospital and cereville medical clinic for the support and cooperation during the field investigation. we also thank the surveillance unit and laboratory staff of the research institute for tropical medicine, chempro analytical services laboratories incorporated, and dr visitacion p antonio of east avenue medical center for facilitating and testing of the samples. references de oliveira ej, aud ff, morales cfg, de oliveira sas, santos v. non-hierarchical clustering of manihot esculenta crantz germplasm based on quantitative traits. revista ciência agronômica. 2016 april;47(3):548–55. doi:10.5935/1806-6690.20160066 alabi oj, kumar pl, naidu ra. cassava mosaic disease: a curse to food security in sub-saharan africa. st. paul, mn: the american phytopathological society; 2011 (http://www.apsnet.org/publications/apsnetfeatures/pages/cassava.aspx). eating other crops urged for national food security. nueva ecija: philippine rice research institute; 2011 (http://www.philrice.gov.ph/eating-other-crops-urged-for-national-food-security/). akintonwa a, tunwashe ol. fatal cyanide poisoning from cassava-based meal. hum exp toxicol. 1992 jan;11(1):47–9. doi:10.1177/096032719201100107 pmid:1354460 cassava poisoning in sagam hospital. siaya: sagam community hospital; 2014 (http://www.sagamhealth.com/recent-news/cassava-poisoning-in-sagam-hospital/, accessed 4 march 2016). mlingi nlv, poulter nh, rosling h. an outbreak of acute intoxications from consumption of insufficiently processed cassava in tanzania. nutr res. 1992 june;12(6):677–87. doi:10.1016/s0271-5317(05)80565-2 ariffin wa, choo ke, karnaneedi s. cassava (ubi kayu) poisoning in children. med j malaysia. 1992 sep;47(3):231–4. pmid:1491651 bradbury jh, cliff j, banea jp. making cassava flour safe using the wetting method. south sudan med j. 2015 february;8(1):4–7. konzo disease zambia. cassava poisoning. brookline, ma: international society for infectious diseases, 2001; 2008 (http://promedmail.org/post/20150811.3570038, accessed 9 october 2015). bakayoko s, soro d, nindjin c, dao d, tschannen a, girardin o, et al. evaluation of cyanogenic potential and organoleptic properties in cassava (manihot esculenta crantz) roots of improved varieties in côte d'ivoire. afr j food sci. 2009 september 2;3(11):328–33. kwok j. cyanide poisoning and cassava. hong kong sar (china): centre for food safety; 2008 (http://www.cfs.gov.hk/english/multimedia/multimedia_pub/multimedia_pub_fsf_19_01.html, accessed 9 october 2015). haque mr, bradbury jh. simple method for determination of thiocyanate in urine. clin chem. 1999 sep;45(9):1459–64. pmid:10471648 cassava. honolulu, hi: university of hawaii at manoa; 2015 (http://www.ctahr.hawaii.edu/sustainag/extn_pub/veggie%20pubs/cassava.pdf, accessed 9 october 2015). processing c. rome: food and agriculture organization of the united nations; 1977 (http://www.fao.org/docrep/x5032e/x5032e01.htm, accessed 9 october 2015). public health statement cyanide. cyanide. atlanta, ga: agency for toxic substances and disease registry; 2006 (http://www.atsdr.cdc.gov/toxprofiles/tp8-c1-b.pdf, accessed 8 october 2015). is your drinking water safe? a rotavirus outbreak linked to water refilling stations in the philippines, 2016 outbreak investigation report niño d rebato,a vikki carr d de los reyes,a ma nemia l sucalditoa and gretchen r marina a department of health philippines. correspondence to niño rebato (email: ninorebato@gmail.com). to cite this article: rebato n, de los reyes vc, sucaldito mn, marin g. is your drinking water safe? a rotavirus outbreak linked to water refilling stations in the philippines, 2016. western pac surveill response j. 2019 feb;10(1). doi:10.5365/wpsar.2017.8.1.007 abstract introduction: in april 2016, the department of health in zamboanga peninsula reported an increase in the number of acute gastroenteritis cases reported from zamboanga city. an epidemiologic investigation was conducted to verify the existence of an outbreak, determine source/mode of transmission and recommend control measures. methods: a line list of cases was compiled from the 11 hospitals within zamboanga city and a case-series study was conducted. suspected cases were any persons from zamboanga city who had three or more episodes of acute diarrhoea within 24 hours from 15 march to 29 may 2016. confirmed cases were suspected cases with active symptoms during the investigation who had a stool sample collected with rotavirus detected. water samples were also collected for viral detection. results: there were 2936 suspected cases with 22 deaths (case fatality rate: 0.75%), an age range of 8 days to 89 years (median: 2 years), with those aged less than 5 years the most affected age group (1903/2936, 65%). the majority were males (1549/2936, 53%). from the 138 active case patients included in the case-series study, the majority reported contact with a family member who had diarrhoea (89/138, 64%) and using water refilling stations as their major source of drinking water (88/134, 64%). of the 93 stool specimens collected, 56 (60%) were positive for rotavirus. five samples from water refilling stations where case patients reported collecting drinking water were all positive for rotavirus. discussion: strict regulation of water refilling stations and boiling drinking water in households were implemented, immediately controlling the outbreak. after complying with all the requirements set by the department of health, a water safety certificate was awarded to zamboanga city in september 2018. introduction on 6 april 2016, the regional epidemiology and surveillance unit of the department of health in zamboanga peninsula reported an increase in acute gastroenteritis cases in zamboanga city to the national event-based surveillance system. zamboanga city is a highly urbanized city located in mindanao in the southern philippines with a population of 861 799 people.1 it is the sixth most populous and third largest city in the philippines.2 water production within zamboanga city water district serves only 48% of the total population with most people relying on water refilling stations. these water refilling stations sell purified water, mostly in 5-gallon containers that are delivered to the consumers’ homes. according to zamboanga city health office, the city had a rotavirus outbreak in 2010 due to water contamination, affecting around 500 individuals. in 2012, rotavirus vaccine was added to the national vaccination schedule of all infants aged between 1.5 and 3.5 months. according to zamboanga city health office, the immunization coverage in zamboanga city is around 30%, far from the national target of 90%.3 the epidemiology bureau of the department of health sent a team from 28 april to 2 may 2016 to conduct an epidemiologic investigation to verify the existence of an outbreak, determine the cause, identify the likely source and mode of transmission and recommend control and prevention measures. methods case-series study a line list of suspected cases was constructed from records on suspected case patients admitted to the 11 hospitals within zamboanga city. a suspected case was defined as any previously well individual in zamboanga city who had three or more watery stools per day from 15 march to 29 may 2016. a case-series study was then conducted for those suspected cases that were still symptomatic and admitted to hospital at the time the investigation team was present (active cases). these active case patients were interviewed for information on demographics, exposure history, medical history and other relevant information. stool samples were collected from these active case patients with a confirmed case defined as a suspected case that had rotavirus detected in stool sample. data analysis was performed using microsoft excel 2013. environmental investigation the philippine drinking-water standards require all water sources to adhere to standard parameters and values for drinking-water quality. there should be no escherichia coli; coliform or other bacteria present in every 100 ml water sample should not exceed the permissible level of biological organisms, organic and inorganic constituents (antimony, arsenic, etc.); and the chemical, disinfectant, disinfectant by-products and radiological constituents should be within standard values.4 sixty-six water sources consisting of 39 water refilling stations, 17 water district and 10 deep wells in zamboanga city were inspected by the city sanitation office to determine possible cross-contamination and non-compliance to the philippine drinking-water standards.4 laboratory examination stool specimens from active case patients were collected and sent to the research institute for tropical medicine (ritm) in manila for rotavirus, norovirus and adenovirus detection using reverse transcriptase polymerase chain reaction (rt–pcr). to rule out other potential causes of the outbreak, rectal swab specimens were also tested for bacterial pathogens according to ritm standard procedures and previously published methods.5 water samples were tested for bacterial analysis using the colilert (idexx laboratories, inc., westbrook, maine, usa) rapid test. rt–pcr and conventional pcr were used for detection of pathogen based on the world health organization’s manual for rotavirus detection.6 results suspected cases a total of 2936 suspected cases were identified with onset dates from 28 march 2016. there was a peak of cases on 3-5 april 2016 (fig. 1). the age of all suspected cases ranged from 8 days to 89 years (median: 2 years), with the majority of suspected cases aged less than 5 years (1903/2936, 65%). just over half the suspected cases were male (1549/2936, 53%). there were 22 deaths reported, giving a case fatality rate of 0.75%. the age of fatal cases ranged from 2 months to 50 years (median: 11 months) and 13 (59%) were male. fig. 1. diarrhoea cases by date of onset and case category, zamboanga city, 28 march to 29 may 2016 (n = 2936) click to download figure 1. jpg, 332kb case series there were 138 active case patients included in the case series. eighty-eight (64%) were aged less than 5 years. all had diarrhoea; others reported vomiting (112/138, 81%), abdominal pain (84/138, 61%) and fever (83/138, 60%). the majority of active case patients reported close contact with family member who had diarrhoea before their illness onset (89/138, 64%). the major source of drinking water reported among these case patients was from water refilling stations (88/138, 64%; only 44/138 or 32% reported that they drank boiled water. before eating and after using toilet, 53% (73/138) reported using hand sanitizer and 62% (86/138) reported using detergent or bath soap regularly (table 1). table 1. profile of active rotavirus cases, zamboanga city, 28 april to 2 may 2016 (n = 138) click to download table 1. jpg, 371kb environmental survey there were more than 200 water refilling stations in zamboanga city, but only 125 had a sanitary permit. non-compliant establishments were issued closure orders by the city health office due to possible contamination. violations of the philippine drinking-water standards were observed in some establishments due to presence of bacteria in water sample and biological organisms more than the permissible limit in every 100 ml sample. five water distribution pipes from zamboanga city water district were inspected. water handlers were mostly children. hand pumps are attached to the water distribution pipes to add pressure to the faucet. pipes are also submerged in the sewers. these sources also did not meet the water-quality standards and were immediately rehabilitated. laboratory examination there were 93 stool specimens from active case patients submitted to ritm for viral detection with 56 (60%) positive for rotavirus. six case patients (6%) had co-infection of rotavirus and adenovirus, and three (3%) had co-infection of rotavirus and norovirus. all specimens were negative for any bacterial pathogens. of the 66 water samples, excess total coliforms were detected in 19/39 (49%) water refilling stations, 9/17 (53%) zamboanga city water district samples and 4/10 (40%) samples from deep wells. escherichia coli were present in water samples collected from water refilling stations (4/39, 10%), zamboanga city water district (2/17, 12%) and deep wells (5/10, 50%). of the 15 water samples sent to ritm for rotavirus confirmation (five each from water refilling stations, the zamboanga city water district and deep wells) only the five refilling-station samples were positive for rotavirus rna. discussion the evidence collected during this outbreak investigation suggests that rotavirus was the cause of this outbreak. sixty per cent of cases that were laboratory tested were positive for rotavirus; water samples taken from water refilling stations, the most commonly reported water source used by active case patients, were also positive for rotavirus. the symptoms reported were consistent with rotavirus,7 as was the age distribution with most cases aged less than 5 years. rotavirus was the most common cause of diarrhoeal deaths globally in children under 5 years old, accounting for 215 000 child deaths in 2013 based on the estimates of the world health organization.8 this underscores the need for prevention in this particular age group. rotavirus is the major cause of hospital admissions, emergency department visits and clinic visits in the philippines among infants with diarrhoea.9 rotavirus vaccine was introduced in 2012 as part of the expanded program on immunization, but because of inadequate supply, some areas, including zamboanga city, have not received the vaccine since 2014. vaccination could help prevent rotavirus outbreaks. rotavirus infection can easily spread from an infected person to another by close contact.7 most case patients were exposed first to a family member with vomiting and diarrhoea before onset of their symptoms. rotavirus is highly communicable; a small infectious dose of less than 100 virus particles can cause the fast spread of the illness.10 the majority of active case patients reported obtaining their drinking water from water refilling stations. this was the first rotavirus outbreak in the philippines with viral isolation of rotavirus from water refilling stations. the presence of rotaviruses in drinking water has been reported in several studies11,12 and has been the source of several epidemics originating from contaminated water.13,14 in parallel with person-to-person contamination, drinking water might play a role in the occurrence of sporadic cases. this, and the fact that many of the water refilling stations did not have sanitary permits, emphasize the need for routine inspections and water testing of water refilling stations. ritm’s protocol5 indicates that only stool specimens from cases whose onset of diarrhoea was three days before the specimen collection date could be tested. because specimen collection was only done during the time of field investigation, cases that fell outside the collection period were not sampled, hence, only 93/2936 or 3% of stool specimens were collected. this sampling method could overestimate sample positivity. however, the higher prevalence of rotavirus in younger children demonstrated by this study is similar to other rotavirus investigations in other settings.12,13,14 risk factors for this outbreak were not statistically tested due to the descriptive design of the study. also, we were not able to elicit information on the rotavirus vaccination history of the active case patients interviewed as it was not included in our questionnaire. this is a limitation of the study, although it is expected that the vaccination rate would be low based on reported vaccination rates in the city. in may 2016, as a result of this investigation, the government of zamboanga city advised households to boil drinking water and also created a technical working group focusing on water safety with emphasis on the strict regulation of water refilling stations to control the outbreak. multiagency activities were conducted to come up with the city water safety plan, and in september 2018, more than two years after the outbreak, a water safety certificate was awarded to zamboanga city after complying with all the requirements set by the department of health.15 no further outbreaks of rotavirus have been reported in zamboanga. to prevent outbreaks of this magnitude in the future, these water safety measures need to be sustained and continued. acknowledgements the authors would like to thank the regional health emergency management, surveillance and disaster response unit (rhemsdru) of zamboanga peninsula headed by mr maxell bermas and his staff for the assistance given during the entire outbreak investigation. we are also grateful to ms rowena capistrano of research institute for tropical medicine (ritm), the management of 11 zamboanga city hospitals, to dr ivy itturalde of the city health office, zamboanga peninsula pediatrics society, and to the local government of zamboanga city for the technical and laboratory support, and to ms michelle mcpherson for her diligent effort in helping get this paper published. funding this study was funded by the department of health, philippines. conflicts of interest none. references total population by city, municipality, and barangay of region ix zamboanga peninsula, manila: philippine statistics authority; 2015 (https://www.psa.gov.ph/sites/default/files/attachments/hsd/pressrelease/r09.xlsx, accessed 21 november 2018). population of the philippines. manila: national statistics office; 2010 (https://www.psa.gov.ph/content/highlights-philippine-population-2015-census-population, accessed 15 june 2016). field health services information system ver. 2012. manila: department of health (philippines); 2012 (https://chogensantos.files.wordpress.com/2016/04/fhsis.pdf). philippine national standards for drinking water 2017. manila: department of health (philippines); 2017 (http://dmas.doh.gov.ph:8080/relatedissuances?id=337128&ist=administrative%20order&isn=2017-0010). guidelines for specimen collection, transport and referral during infectious disease outbreak response. manila: research institute for tropical medicine; 2014. manual of rotavirus detection and characterization methods. geneva: world health organization, 2009 (http://apps.who.int/iris/bitstream/handle/10665/70122/who_ivb_08.17_eng.pdf;jsessionid=df854894a00e16c1a3f7cc29dfd3ee02?sequence=1, accessed 21 february 2017). payne dc, wikswo m, parashar ud. chapter 13: rotavirus. in: vpd surveillance manual, 5th edition. atlanta, ga: centers for disease control and prevention; 2013 (https://www.cdc.gov/vaccines/pubs/surv-manual/chpt13-rotavirus.pdf, accessed 28 april 2016). estimated rotavirus deaths for children under 5 years of age: 2013, 215 000. geneva: world health organization; 2016 (http://www.who.int/immunization/monitoring_surveillance/burden/estimates/rotavirus/en/, accessed 15 june 2016). carlos cc, inobaya mt, bresee js, lagrada ml, olorosa am, kirkwood cd, et al. the burden of hospitalizations and clinic visits for rotavirus disease in children aged <5 years in the philippines. j infect dis. 2009 nov 1;200(s1) suppl 1:s174–81. doi:10.1086/605044 pmid:19817598 rotavirus. atlanta, ga: centers for disease control and prevention; 2016 (https://www.cdc.gov/rotavirus/, accessed 21 february 2017). rutjes sa, lodder wj, van leeuwen ad, de roda husman am. detection of infectious rotavirus in naturally contaminated source waters for drinking water production. j appl microbiol. 2009 jul;107(1):97–105. doi:10.1111/j.1365-2672.2009.04184.x pmid:19302334 sobsey md, kellogg js. de leon ricardo, carol shieh ys. enteric virus detection in water by nucleic acid methods. denver, co: american water works association research foundation; 1996 (https://books.google.com.ph/books/about/enteric_virus_detection_in_water_by_nucl.html?id=bfxtiwf0d4oc&redir_esc=y, accessed 21 february 2017). verheyen j, timmen-wego m, laudien r, boussaad i, sen s, koc a, et al. detection of adenoviruses and rotaviruses in drinking water sources used in rural areas of benin, west africa. appl environ microbiol. 2009 may;75(9):2798–801. doi:10.1128/aem.01807-08 pmid:19270143 hopkins rs, gaspard gb, williams fp jr, karlin rj, cukor g, blacklow nr. a community waterborne gastroenteritis outbreak: evidence for rotavirus as the agent. am j public health. 1984 mar;74(3):263–5. doi:10.2105/ajph.74.3.263 pmid:6320684 exposure to h1 genotype measles virus at an international airport in japan on 31 july 2016 results in a measles outbreak brief report aika watanabe,a,b yusuke kobayashi,a,e tomoe shimada,c yuichiro yahata,c ayako kobayashi,a mizue kanai,a,e yushi hachisu,a munehisa fukusumi,b,c hajime kamiya,c takuri takahashi,c yuzo arima,c hitomi kinoshita,c kazuhiko kanou,c takehito saitoh,c satoru arai,c hiroshi satoh,c hideo okuno,b,c saeko morino,c,e tamano matsui,c tomimasa sunagawa,c keiko tanaka-taya,c makoto takeda,d katsuhiro komased and kazunori oishic a field epidemiology training program, national institute of infectious diseases. b department of epidemiology for infectious diseases, graduate school of medicine, osaka university, japan. c infectious disease surveillance center, national institute of infectious diseases. d department of virology iii, national institute of infectious diseases. e division of global infectious diseases, department of infection and epidemiology, graduate school of medicine, tohoku university, miyagi, japan. correspondence to tomoe shimada (email:tomoes@niid.go.jp). to cite this article: watananbe a, kobayashi y, shimada t, yahata y, kobayashi a, kanai m, et al. exposure to h1 genotype measles virus at an international airport in japan on 31 july 2016 results in a measles outbreak. western pac surveill response j. 2017 feb;8(1). doi:10.5365/wpsar.2016.7.4.007. in march 2015, the measles regional verification commission for the world health organization western pacific region verified that japan had achieved measles elimination1 based on the verification criteria.2 only 35 confirmed measles cases were reported in 2015, and for 2016, measles activity was low until july (n = 16, as of 3 august). however, the number of reported measles cases surged in the middle of august 2016. several cases were considered sporadic cases without a known source of infection or imported cases because they initially seemed to be unrelated. however, through vigilant daily monitoring of national surveillance data by surveillance officers at the national level, including fellows of the field epidemiology training program at the national institute of infectious diseases, and their close communication with local public health staff, five cases were found to have been present at a large international airport on the same day as a possible index case was found. recent measles situation in japan measles became a case-based notifiable disease in 2008. the case definition for measles used in national surveillance is based on clinical symptoms and laboratory tests. the diagnosis of measles is confirmed by laboratory test results, including a positive result for measles-specific immunoglobulin m (igm) titre, significant increase in measles-specific immunoglobulin g (igg) titre using paired serum, the detection of measles virus (mv) by reverse transcription polymerase chain reaction (rt-pcr) or isolation of mv in cell culture. mv detection, isolation and genotyping are performed mainly at designated local governmental (i.e. municipal or prefectural) public health institutions within each local government area. the number of reported measles cases in japan has declined markedly from 11 013 in 2008 to 35 in 2015.3 the d5 genotype strain of mv, which was endemic in japan, has not been detected since may 2010; however, limited local transmission following importation of mv has been observed, as in 2014.4 common exposure to h1 genotype mv at an international airport in 2016, although measles activity remained at the lowest level since 2008, the number of reported measles cases surged in epidemiological week 33.5 surveillance officers and field epidemiology training program fellows noted five measles cases (table 1, cases 1-5) with close onset dates reported from different prefectures that seemingly did not have any common exposure history. case 1 was a ground crew member at kansai international airport (kix) in osaka prefecture, the third largest international airport in japan, handling about 64 000 passengers per day.6 this patient had no recent history of overseas travel. case 5 had travelled domestically before the onset of measles. the other three (cases 2-4) had travelled to indonesia, the republic of korea and viet nam; they were initially suspected to have become infected with mv at their destination. however, mv was confirmed in all cases by rt-pcr and determined to be the h1 genotype strain, the predominant genotype reported from china and parts of south-eastern asia over the past three years.7 because the genotype h1 strain is not endemic in indonesia, japan or the republic of korea, we obtained epidemiological information from local health authorities at each reporting prefecture to clarify travel itineraries, including domestic transit, of the five cases. we found that these five cases had spent time on the same floor of kix on 31 july 2016. sequence analysis revealed high nucleotide sequence homology between the h1 genotype mv strains detected in the five cases. based on these findings, we concluded that kix was the likely place of exposure. alert to the general public the national institute of infectious diseases (niid) and the ministry of health, labour and welfare of japan announced an increase in the number of measles cases in late august 2016 to remind the general public to get vaccinated and to raise physicians' awareness (i.e. to consider measles when examining patients with fever, rash, and travel history and/or epidemiological information such as contact with people displaying measles-like symptoms during the incubation period). in addition, information about the cases suspected to have been exposed to h1 genotype mv on 31 july 2016 at kix were posted on niid's website to inform the general public and health-care providers of the risk of exposure to mv at kix. possible source of the h1 genotype mv at kix in late august, person a (sex not disclosed) reported information that provided insight into the source of exposure at kix. mv infection was confirmed in person a by measles-specific igm. person a reported having contact before measles onset with person b, who had returned from china to japan on 20 july 2016 and developed measles-like symptoms on 26 july. person b (sex not disclosed), who had visited kix on 31 july, consulted physicians and was diagnosed with the common cold and/or drug eruption before measles-specific igm was confirmed. given that person b returned from china during the measles incubation period and visited kix while symptomatic on 31 july, this person was considered to be the possible source of mv for all five cases, even though the confirmation of genotype h1 strain was not obtained from the case. additional cases due to transmission at kix following further investigations, the osaka prefecture local government reported on 31 august an additional 16 laboratory-confirmed cases, all of whom shared a single office at kix with case 1 (table 1), a ground crew member. the outbreak investigation in this office was conducted and its findings will be reported elsewhere. click to download table 1. jpg, 309kb discussion this cluster reminds us that an international airport is a potential hotspot for measles and may act as a mixing place for travellers from measles-endemic countries and any unvaccinated non-immune persons, as reported previously.8-10 as of 7 december 2016,5 no additional cases related to this kix cluster have been reported, and the numbers of both suspected and confirmed cases have been declining. however, authorities should remain vigilant about the risk of importation of mv from endemic countries. high-quality surveillance and high vaccination coverage must be continued for japan to preserve measles elimination status. conflicts of interest none. funding none. references brunei darussalam, cambodia, japan verified as achieving measles elimination. manila: world health organization regional office for the western pacific; 2015 (http://www.wpro.who.int/mediacentre/releases/2015/20150327/en/, accessed 2 february 2017). guidelines on verification of measles elimination in the western pacific region. manila: world health organization regional office for the western pacific; 2013 (http://www.wpro.who.int/immunization/documents/measles_elimination_verification_guidelines_2013.pdf?ua=1, accessed 2 february 2017). measles and rubella/congenital rubella syndrome in japan, as of march 2016. tokyo: national institute of infectious diseases; 2016 (http://www.nih.go.jp/niid/en/iasr-vol37-e/865-iasr/6460-434te.html, accessed 2 february 2017). takahashi t, arima y, kinoshita h, kanou k, saitoh y, sunagawa t, et al. ongoing increase in measles cases following importations, japan, march 2014: times of challenge and opportunity. western pac surveill response. 2014;5(2):31-3. doi:10.5365/wpsar.2014.5.2.001 national surveillance data on measles. tokyo: national institute of infectious diseases; 2016 (http://www0.nih.go.jp/niid/idsc/idwr/diseases/measles/measles2016/meas16-48.pdf, accessed 2 february 2017). kix traffic report. kansai: kansai airports; december 2016 (http://www.kansai-airports.co.jp/en/news/2016/379/trafficreportdecember2016.pdf, accessed 2 february 2017, accessed 2 february 2017). measles surveillance data. geneva: world health organization; 2016 (http://www.who.int/immunization/monitoring_surveillance/burden/vpd/surveillance_type/active/measles_monthlydata/en/index1.html, accessed 2 february 2017). vega js, escobedo m, schulte cr, rosen jb, schauer s, wiseman r, et al. notes from the field: measles transmission at a domestic terminal gate in an international airport -united states, january 2014. mmwr morb mortal wkly rep. 2014;63(50):1211. banerjee e, hickman c, engels k, kenyon c. centers for disease control and prevention. notes from the field: measles transmission in an international airport at a domestic terminal gate -april-may 2014. mmwr morb mortal wkly rep. 2015;64(24):679. nic lochlainn l, mandal s, de sousa r, paranthaman k, van binnendijk r, ramsay m, et al. a unique measles b3 cluster in the united kingdom and the netherlands linked to air travel and transit at a large international airport, february to april 2014. euro surveill. 2016;21(13):30177. doi:10.2807/1560-7917.es.2016.21.13.30177 time-series modelling of dengue incidence in the mekong delta region of viet nam using remote sensing data original research nga tt pham,a cong t nguyena and maria ruth b pineda-cortelb a vietnam national space center, vietnam academy of science and technology. b department of medical technology, faculty of pharmacy, university of santo tomas. correspondence to nga tt pham (email:mailto:pttnga@vnsc.org.vn). to cite this article: nga ttp, cong tn, mrb pineda-cortel, et al. time-series modelling of dengue incidence in the mekong delta region of viet nam using remote sensing data. western pac surveill response j. 2020 jan;11(1). doi:10.5365/wpsar.2018.9.2.012 objective: this study aims to enhance the capacity of dengue prediction by investigating the relationship of dengue incidence with climate and environmental factors in the mekong delta region (mdr) of viet nam by using remote sensing data. methods: to produce monthly data sets for each province, we extracted and aggregated precipitation data from the global satellite mapping of precipitation project and land surface temperatures and normalized difference vegetation indexes from the moderate resolution imaging spectroradiometer satellite observations. monthly data sets from 2000 to 2016 were used to construct autoregressive integrated moving average (arima) models to predict dengue incidence for 12 provinces across the study region. results: the final models were able to predict dengue incidence from january to december 2016 that concurred with the observation that dengue epidemics occur mostly in rainy seasons. as a result, the obtained model presents a good fit at a regional level with the correlation value of 0.65 between predicted and reported dengue cases; nevertheless, its performance declines at the subregional scale. conclusion: we demonstrated the use of remote sensing data in time-series to develop a model of dengue incidence in the mdr of viet nam. results indicated that this approach could be an effective method to predict regional dengue incidence and its trends. according to the world health organization (who),1 viet nam is among the top 10 countries with the highest reported number of dengue cases in the world (91 321 cases in 2012). studies have shown that dengue epidemics in viet nam occurred cyclically every 3–5 years and peaked approximately every 10 years.2 these cycles are thought to be influenced by the circulating viral serotypes, host immunity and climate oscillations.3 dengue transmission occurs throughout the year in viet nam with peak numbers of cases reported in the rainy season from may to october.4 since 2007, dengue has been recorded in 55 of the 63 provinces in viet nam, increasing from north to south with the mekong delta region (mdr) experiencing the highest incidence recorded during the years 2000 to 2016. several recent studies have aimed to better understand the dynamics of dengue and the influences of environmental factors on the disease and to better predict outbreaks. climate factors, in addition to multiple human, biological and ecological determinants, influence the emergence and re-emergence of infectious diseases, including dengue,5 which is transmitted by both the primary vector aedes aegypti and the secondary vector aedes albopictus.6,7 studies have found a significant correlation between rain and dengue incidence in metropolitan manila, philippines from 1996 to 2005,8 and a correlation between temperature, rain and dengue incidence in southern thailand by multiple regression analysis.9 on a regional scale, a review of the impacts of climate change on human health provided more evidence of the burden of climate change–attributable diseases and emphasized the uncertainty in attributing diseases to climate change, owing to a lack of long-term, high-quality data.10 climate change is likely to affect the seasonal and geographical distribution of dengue fever in the asia–pacific region, but more studies are needed that adjust for regional and subregional socio-environmental factors in the assessment of climate effects on dengue transmission.5 climate is only one of many environmental factors; changes in land cover by human settlements, the presence of water bodies, and vegetation type also affect dengue transmission processes.11 a range of approaches, including statistical modelling, mathematical modelling and spatial analysis, have been applied to demonstrate relationships between dengue and climate variables and to predict dengue cases and outbreaks.12,13 statistical models that are commonly constructed to predict dengue incidence cannot precisely predict the time and place of a dengue outbreak. however, they are able to quantitatively associate climactic factors such as rain, temperature and humidity with dengue epidemics at certain geographic areas with specific time lags.14 we assumed that there was a strong association between dengue incidences and climate variables; therefore, we applied a time-series autoregressive integrated moving average (arima) model for dengue prediction in the mdr of viet nam. to minimize the limitations of climate data from meteorological stations in spatial and time scales, we used the most accessible remote sensing data for climate variables: the global satellite mapping of precipitation (gsmap) for rain data and the moderate resolution imaging spectroradiometer (modis) land surface temperature n/d (mod11a2, us geological survey, reston, va, usa) for night (lstn) and day (lstd). our aim was to investigate the capability of arima to provide sufficient lead-time prediction of dengue15 for a region of high incidence in a tropical climate. this was an effort to combine advanced geospatial data in a predictive model to assist public health control and response operations in the region. methods study site the study was conducted in the lower mdr in south-western viet nam, using the average monthly number of dengue cases (fig. 1). the mdr reported up to 65% of the total cases of dengue in viet nam during the period 2000 to 2016. this is a flat and low-lying area of 40 576 km2 covering 13 provinces within a complex network of rivers, channels and floodplains. we divided this region into two subregions: subregion i has the higher dengue incidence provinces (an giang, dong thap, long an, tien giang and ben tre) and subregion ii has the lower incidence provinces (vinh long, tra vinh can tho, hau giang, soc trang, bac lieu, kien giang and ca mau), separated by a white line in fig. 1. dengue fever has been recorded as the second most frequent reason for hospitalization among communicable diseases in this region.16 click to download figure 1. jpg, 307kb remote sensing data we used gsmap data as an alternative for surface rainfall measurement in an attempt to expand the use of remote sensing data with the advantages of spatial coverage with high resolution and temporal availability. the daily gsmap-version 6 data17 with a spatial resolution of 0.1 × 0.1 degrees were extracted and accumulated to calculate monthly rain. we used monthly land surface temperature data from modis lstd and lstn (mod11a2)18 with a 1 km spatial resolution as a proxy for air temperature. in addition to climate variables, one of the most commonly used remote sensing–derived environmental variables, the normalized difference vegetation index (ndvi) from modis (mod13q1) with a 250 m spatial resolution, was also used in the model for its influence on dengue.19 these remote sensing–based parameters were aggregated to compute mean monthly variables for each province as examples presented in fig. 2, showing clear spatial variations among provinces and between variables. click to download figure 2. jpg, 296kb statistical analysis we used the box-jenkins methodology20 to fit arima models to monthly dengue incidence in 12 provinces, using the statistical forecast package in rstudio software (version 1.1) (rstudio, boston, ma, usa).21 dengue case definitions were based on who criteria22 and collected through the disease surveillance systems according to viet nam’s ministry of health regulations.23 the dengue cases reported from 2001 to 2015 were used for developing the time series model, and the cases during 2016 were used for validating the model. to avoid effects from the non-constant variance, we stabilized dengue counts by natural log transformation. first, to confirm that arima models were suitable for this analysis, we examined the data for seasonality and interannual variations of dengue incidence and climate and environmental variables (rain, lstd, lstn and ndvi) during the period 2000–2016 for each province. then, the adequacy of each model for each province was verified by histogram, by autocorrelation of the standardized residuals, and by the ljung-box test, similar to previous studies.24–26 next, the structure of the model followed the standard form for arima, (p,d,q)(p,d,q)s, where p is the order of autoregression; d, the degree of differencing; q, the order of the moving average; p, the seasonal autoregression; d, the degree of seasonal differences; q, the seasonal moving average; and s, the seasonal period. different arima model forms (combinations of p, d, q, p, d and q) were tested to fit the log-transformed time series data without environmental covariates. the best arima model was selected as that with the lowest akaike information criterion,24 a measure of the relative goodness of fit of a model across the 12 provinces (hau giang province was excluded as it had politically separated from can tho province in 2004). then, multivariate arima models were fitted with log-transformed dengue cases in relation to all the climate variables with time lags that were chosen by their best correlation with dengue. results seasonal variation of dengue and climate parameters fig. 3 presents an example of the time series of dengue, rain, lstn and ndvi during 20002016 for an giang province. the plots showed strong seasonal and interannual variations of all variables. we found this seasonal pattern apparent and consistent for all provinces in the region with higher dengue cases coinciding with rainy seasons. this enabled us to apply the arima model to the entire mdr. click to download figure 3. jpg, 281kb model in association with variables fig. 4a presents an example of an arima fitting model plot for an giang province and the comparison of fitted with reported dengue cases; fig. 4b shows the regression function with its root mean square error value for the fitted period of 2000–2015. the final model for each province was confirmed by the ljung-box test27 of the residual with no correlation for fitted data. click to download figure 4. jpg, 228kb we generated 12 final models that closely fitted dengue incidence from every province in incorporating climate and environment variables as external predictors. after careful screening, those variables with the highest correlation with dengue incidence at specific time lags were kept in the final arima models (table 1) that show the correlation value, and the monthly time lag is shown in brackets. correlations between these variables and dengue are spread over a range of time lags across provinces. dengue had the strongest correlation with rain at a 1-month time lag across all provinces, reaching 0.60 at long an province; dengue had a comparable correlation with lstd and lstn at 1-month to 4-month time lags. in addition, dengue had both positive and negative correlation with ndvi at 4-month to 5-month time lags. notably, we found that the two subregions had different climate and environmental influences on dengue based on their correlations and time lags. in subregion i, dengue was found to have a higher correlation with rain with a 1-month time lag, and ndvi had a 5-month time lag; dengue was also associated with lstd generally with a 4-month time lag and lstn with a 1-month time lag. these findings are different than those for provinces in subregion ii along the coast of the mdr where dengue was found to have a weaker correlation with rain and a negative correlation with ndvi with a 4-month time lag. for provinces in subregion ii, dengue was correlated with a 1-month shorter time lag for lstd but a 1-month longer time lag for lstn compared to subregion i. for other provinces, including vinh long, can tho, and kien giang, dengue was found to have relatively low correlations with all variables and at mixed time lags. the variability in the association between dengue and climate and environmental factors across provinces in the study region emphasizes the need for a separate time-series model for each province. click to download table 1. jpg, 217kb model validation the best time-series arima model with final independent variables found for each province was applied to predict dengue for the period from january to december 2016. in most cases, rain and lstn remained in the final model; lstd and ndvi were occasionally removed when correlations were less than 0.25. we compared predicted dengue with reported cases for the whole mdr, as shown in fig. 5. the results showed that predicted dengue in every province closely followed the trend of reported data (fig. 5a) and that these data are in good linear regression with the square of correlation of 0.65 for the whole region (fig. 5b). click to download figure 5. jpg, 231kb we also evaluated the association between monthly predicted and reported dengue incidence from january to december 2016 by calculating the pearson correlation coefficient28 for each province (the numbers presented correspond to the provinces in fig. 5a). the correlation varies significantly, from approximately 0.22 to 0.85 (with p n at a 2-month time lag, as previously mentioned. for the provinces in subregion i, predicted dengue was found to have a weaker correlation with the reported data during the period january to december 2016, even though the stronger association of dengue with rain and ndvi was shown by the time-series data from the years 2000 to 2015. discussion in an effort to overcome the limitations of spatial and time scales in climate data collected from meteorological stations, we created a high-quality data set of satellite remote sensing data for climate and environmental factors, i.e. rain data from gsmap and temperature and vegetation data from modis for the entire mdr for dengue modelling using a time-series approach. different combinations of components were evaluated to construct the best predictive arima models for 12 provinces across the study region. we decided to use the arima model because it can cope with a stochastic dependence of consecutive data and to account for autocorrelations in time series as well as seasonality, long-term trends and time lags.14 the selection of external variables was based on the best correlation of dengue with rain, lstd, lstn, and ndvi at different time lags for the 2000 to 2015 data. the results of the validation showed different performances of the arima model over the region. the correlation of predicted and reported dengue during the period january to december 2016 was found higher in subregion ii and lower in subregion i, controverting the distribution of dengue among these two subregions (as in fig. 1). this is a limitation of arima modelled with only climate factors relating to vector abundance; transmission of dengue is also affected by other factors such as population density and activities, relating human susceptibility to the disease. therefore, an assessment of prevailing vulnerabilities to dengue could be independent of its spatial distribution,29 but closely related to a combination of climate, environment and sociodemographic conditions.30 possible reasons of inconsistent effects of ndvi on dengue incidence include subprovincial variations in precipitation and a variety of land covers. climatologically, the onset of the rainy season in the mdr usually appears first along the coast (subregion ii) and moves gradually inland (toward subregion i), resulting in a different temporal time lag in relationships between rain and dengue transmission over the region. also, vegetation type and growth stage may play important roles in determining vector abundance, irrespective of their association with rain.31 an analysis of ndvi distribution in relation to land cover data over the whole region indicated that lower values of ndvi in subregion ii corresponded to more water bodies, shrubs and mixed horticulture land cover types. higher ndvis were found in subregion i, which corresponded to more rice paddy land cover. several investigators have examined the associations among climate variables, demography and dengue incidence in the southern provinces of viet nam using a wavelet time series analysis,3,32 a standard multiple regression model, arima and a poisson distributed lag model.33 we found that time-series analysis was useful in establishing the relationship between the change of weather parameters, environmental factors and the incidence of dengue diseases for the entire mdr. input variables were selected based on the best correlation of dengue with precipitation, lstd, lstn, and ndvi data, for the period 2000 to 2015 at varying time lags as in previous studies.19,33 limitations one challenge to the existing statistical approaches in modelling dengue is the difficulty of quantifying the influences of myriad human activities on vector-borne transmission. an integrated approach might be to build an index framework for underlying socioeconomic and demographic factors.29 disease transmission is also closely linked with mosquito behaviour and population dynamics that are largely influenced by climate factors.5 therefore, direct modelling by using climate data could be useful in informing health and sanitation sectors of potential increases in mosquito activity and subsequent disease risk, especially if mosquito population data can be sampled and integrated. conclusions this study focused on presenting climate and environmental factors from remote sensing data in modelling and predicting dengue fever in the mdr of viet nam. our results indicate that this approach may be effective for predicting regional dengue incidence and trends. the results also revealed that the higher correlation of dengue using a single variable does not improve the model performance, and validation of the model is crucial for assessing its accuracy. our findings support previously made conclusions that dengue prediction models vary due to their complexity and methodology and are dependent on the type of data collected and the nature of the variables.14 no universal models exist for global analysis and prediction,14 even if limited to a climatologically homogeneous area such as the mdr. we describe the first effort to apply remote sensing data to perform time-series modelling of a vector-borne disease in viet nam to enhance the dengue early warning system. similar approaches have been used throughout the world.34–36 integration of remote sensing and modelling to provide early warning of vector-borne disease outbreaks has been successfully demonstrated for malaria throughout africa35 and for dengue epidemics in brazil.14 to determine our model’s usefulness as an early warning tool, the results of our study have been presented on the internet not only for the mdr, but also for other regions of viet nam and the philippines. however, the system should be evaluated by end users for its effectiveness for dengue predictions for two countries. acknowledgements we appreciate the constructive comments from dr amelia kasper for improving the manuscript. funding this study was funded by the asia pacific network for global change research (apn) caf2016-rr11-cmy-pham. conflicts of interest no potential conflicts of interest were reported by the authors. references world health organization. global strategy for dengue prevention and control 2012–2020. geneva: who; 2012. available from: https://apps.who.int/iris/bitstream/handle/10665/75303/9789241504034_eng.pdf vu hh, okumura j, hashizume m, tran dn, yamamoto t. regional differences in the growing incidence of dengue fever in vietnam explained by weather variability. trop med health. 2014 mar;42(1):25–33. doi:10.2149/tmh.2013-24 pmid:24808744 cuong hq, vu nt, cazelles b, boni mf, thai kt, rabaa ma, et al. spatiotemporal dynamics of dengue epidemics, southern vietnam. emerg infect dis. 2013 jun;19(6):945–53. doi:10.3201/eid1906.121323 pmid:23735713 lee hs, nguyen-viet h, nam vs, lee m, won s, duc pp, et al. seasonal patterns of dengue fever and associated climate factors in 4 provinces in vietnam from 1994 to 2013. bmc infect dis. 2017 mar 20;17(1):218. doi:10.1186/s12879-017-2326-8 pmid:28320341 banu s, hu w, hurst c, tong s. dengue transmission in the asia-pacific region: impact of climate change and socio-environmental factors. trop med int health. 2011 may;16(5):598–607. doi:10.1111/j.1365-3156.2011.02734.x pmid:21320241 higa y, yen nt, kawada h, son th, hoa nt, takagi m. geographic distribution of aedes aegypti and aedes albopictus collected from used tires in vietnam. j am mosq control assoc. 2010 mar;26(1):1–9. doi:10.2987/09-5945.1 pmid:20402344 desjardins mr, whiteman a, casas i, delmelle e. space-time clusters and co-occurrence of chikungunya and dengue fever in colombia from 2015 to 2016. acta trop. 2018 sep;185:77–85. doi:10.1016/j.actatropica.2018.04.023 pmid:29709630 su gl. correlation of climatic factors and dengue incidence in metro manila, philippines. ambio. 2008 jun;37(4):292–4. doi:10.1579/0044-7447(2008)37[292:cocfad]2.0.co;2 pmid:18686509 promprou s, jaroensutasinee m, jaroensutasinee k. climatic factors affecting dengue haemorrhagic fever incidence in southern thailand. dengue bull. 2005;29:41–9. available from: https://apps.who.int/iris/handle/10665/164135 patz ja, campbell-lendrum d, holloway t, foley ja. impact of regional climate change on human health. nature. 2005 nov 17;438(7066):310–7. doi:10.1038/nature04188 pmid:16292302 crosson w, akanda a, ceccato p, estes sm, haynes ja, saah d, et al. use of remotely sensed climate and environmental information for air quality and public health applications. in: earth science satellite applications. springer; 2016. pp. 173–205. available from: https://www.researchgate.net/publication/303480960_use_of_remotely_sensed_climate_and_environmental_information_for_air_quality_and_public_health_applications/link/5761bafb08aeeada5bc500b6/download louis vr, phalkey r, horstick o, ratanawong p, wilder-smith a, tozan y, et al. modeling tools for dengue risk mapping a systematic review. int j health geogr. 2014 dec 9;13(1):50. doi:10.1186/1476-072x-13-50 pmid:25487167 pham d, nellis s, sadanand a, jamil j, khoo j, aziz t, et al. a literature review of methods for dengue outbreak prediction. the eighth international conference on information, process, and knowledge management; 2016. available from: https://umexpert.um.edu.my/file/publication/00012951_159892_71464.pdf racloz v, ramsey r, tong s, hu w. surveillance of dengue fever virus: a review of epidemiological models and early warning systems. plos negl trop dis. 2012;6(5):e1648. doi:10.1371/journal.pntd.0001648 pmid:22629476 eastin md, delmelle e, casas i, wexler j, self c. intraand interseasonal autoregressive prediction of dengue outbreaks using local weather and regional climate for a tropical environment in colombia. am j trop med hyg. 2014 sep;91(3):598–610. doi:10.4269/ajtmh.13-0303 pmid:24957546 phung d, talukder mrr, rutherford s, chu c. a climate-based prediction model in the high-risk clusters of the mekong delta region, vietnam: towards improving dengue prevention and control. trop med int health. 2016 oct;21(10):1324–33. doi:10.1111/tmi.12754 pmid:27404323 ushio t, sasashige k, kubota t, shige s, okamoto k, aonashi k, et al. okamoto ki, aonashi k, inoue t, takahashi n, iguchi t, kachi m, & oki r. a kalman filter approach to the global satellite mapping of precipitation (gsmap) from combined passive microwave and infrared radiometric data. journal of the meteorological society of japan ser ii. 2009;87:137–51. doi:10.2151/jmsj.87a.137 wan z. collection-5 modis land surface temperature products users’ guide. icess. santa barbara: university of california; 2007. available from: https://icdc.cen.uni-hamburg.de/fileadmin/user_upload/icdc_dokumente/modis/modis_lst_products_userguide_c5.pdf didan k. mod13q1 modis/terra vegetation indices 16-day l3 global 250m sin grid v006. nasa eosdis land processes daac; 2015. doi:10.5067/modis/mod13q1.006 dela cruz ac, lubrica ja, punzalan b, martin mc. forecasting dengue incidence in the national capital region, philippines: using time series analysis with climate variables as predictors. acta manila ser a. 2012;60:19–26. available from: http://www.ust.edu.ph/wp-content/uploads/2016/07/20126019-26_martinmc.pdf hyndman rj, khandakar y. automatic time series for forecasting: the forecast package for r (no. 6/07). monash university, department of econometrics and business statistics; 2007. available from: https://www.monash.edu/business/econometrics-and-business-statistics/research/publications/ebs/wp06-07.pdf world health organization. dengue: guidelines for diagnosis, treatment, prevention and control. geneva: who; 2009. available from: https://apps.who.int/iris/bitstream/handle/10665/44188/9789241547871_eng.pdf vietnam ministry of health. guidelines on the surveillance, diagnosis, and treatment of dengue hemorrhagic fever. hanoi: vietnam; 1999 (in vietnamese). available from: https://thuvienphapluat.vn/van-ban/the-thao-y-te/quyet-dinh-1537-qd-byt-2014-tai-lieu-huong-dan-chan-doan-dieu-tri-sot-xuat-huyet-dengue-y-hoc-co-truyen-241588.aspx martinez ez, silva ea, fabbro al. a sarima forecasting model to predict the number of cases of dengue in campinas, state of são paulo, brazil. rev soc bras med trop. 2011 jul-aug;44(4):436–40. doi:10.1590/s0037-86822011000400007 pmid:21860888 johansson ma, reich ng, hota a, brownstein js, santillana m. evaluating the performance of infectious disease forecasts: a comparison of climate-driven and seasonal dengue forecasts for mexico. sci rep. 2016 sep 26;6(1):33707. doi:10.1038/srep33707 pmid:27665707 wongkoon s, jaroensutasinee m, jaroensutasinee k. development of temporal modeling for prediction of dengue infection in northeastern thailand. asian pac j trop med. 2012 mar;5(3):249–52. doi:10.1016/s1995-7645(12)60034-0 pmid:22305794 ljung gm, box ge. on a measure of lack of fit in time series models. biometrika. 1978 aug 1;65(2):297–303. doi:10.1093/biomet/65.2.297 benesty j, chen j, huang y, cohen i. on the importance of the pearson correlation coefficient in noise reduction. ieee transactions on audio, speech, and language processing. 2008 may;16(4):757-65. doi:10.1109/tasl.2008.919072 hagenlocher m, delmelle e, casas i, kienberger s. assessing socioeconomic vulnerability to dengue fever in cali, colombia: statistical vs expert-based modeling. int j health geogr. 2013 aug 14;12(1):36. doi:10.1186/1476-072x-12-36 pmid:23945265 pham n, nguyen c, vu d, nakamura k. mapping of dengue vulnerability in the mekong delta region of viet nam using a water-associated disease index and remote sensing approach. apn science bulletin. 2018;8(1):480. doi:10.30852/sb.2018.480 ceccato p, connor sj, jeanne i, thomson mc. application of geographical information systems and remote sensing technologies for assessing and monitoring malaria risk. parassitologia. 2005 mar;47(1):81–96. pmid:16044677 thai kt, cazelles b, nguyen nv, vo lt, boni mf, farrar j, et al. dengue dynamics in binh thuan province, southern vietnam: periodicity, synchronicity and climate variability. plos negl trop dis. 2010 jul 13;4(7):e747. doi:10.1371/journal.pntd.0000747 pmid:20644621 phung d, huang c, rutherford s, chu c, wang x, nguyen m, et al. identification of the prediction model for dengue incidence in can tho city, a mekong delta area in vietnam. acta trop. 2015 jan;141 pt a:88–96. doi:10.1016/j.actatropica.2014.10.005 pmid:25447266 chuang tw, henebry gm, kimball js, vanroekel-patton dl, hildreth mb, wimberly mc. satellite microwave remote sensing for environmental modeling of mosquito population dynamics. remote sens environ. 2012 oct;125:147–56. doi:10.1016/j.rse.2012.07.018 pmid:23049143 ceccato p, vancutsem c, klaver r, rowland j, connor sj. a vectorial capacity product to monitor changing malaria transmission potential in epidemic regions of africa. j trop med. 2012;2012 doi:10.1155/2012/595948 pmid:22363350 health vulnerability to climate change. hanoi: vietnam national space center; updated 12 february 2019. available from: http://apn-climateandhealth.com/ new south wales annual vaccine-preventable disease report, 2013 surveillance report alexander rosewell,a paula spokesa and robin gilmoura a health protection unit, new south wales, north sydney, australia. correspondence to robin gilmour (e-mail: rgilm@doh.health.nsw.gov.au). to cite this article: rosewell a et al. new south wales annual vaccine-preventable disease report, 2013. western pacific surveillance and response journal, 2015, 6(2):37–44. doi:10.5365/wpsar.2014.5.4.009 abstract aim: to describe the epidemiology of selected vaccine-preventable diseases in new south wales, australia for 2013. methods: data from the new south wales notifiable conditions information management system were analysed by local health district of residence, age, aboriginality, vaccination status and organism. risk factor and vaccination status data were collected by public health units. results: pertussis notification rates in infants were low, and no infant pertussis deaths were reported. despite a high number of imported measles cases, there was limited secondary transmission. the invasive meningococcal disease notification rate declined, and disease due to serogroup c remained low and stable. conclusion: vaccine-preventable diseases were relatively well controlled in new south wales in 2013, with declining or stable notification rates in most diseases compared with the previous year. introduction monitoring vaccine-preventable diseases is important to identify events that may require immediate public health control measures and to better inform policy and targeted immunization efforts. new south wales is australia’s largest state and is divided into 15 local health districts (lhds).1 each lhd has a public health unit responsible for follow-up of all health-related issues including vaccine-preventable diseases. under the state’s public health legislation, medical practitioners, hospital general managers and laboratories are required to notify certain vaccine-preventable diseases.2 upon receipt of a notification, a surveillance officer from the relevant public health unit determines whether or not the notification meets the case definition of a vaccine-preventable disease according to national criteria.3 if so, data on each notified case are entered into the new south wales notifiable conditions information management system (ncims). this report describes notification data for measles, pertussis, rubella, haemophilus influenzae serotype b invasive infection, invasive meningococcal disease, mumps, tetanus, invasive pneumococcal disease and selected travel-related diseases in new south wales, australia in 2013. method data describing cases in ncims were extracted for selected vaccine-preventable diseases with a date of onset in 2013. rates were calculated using 2011 australian bureau of statistics population estimates and are presented as annual rates per 100 000 total population or population in age groups. the notification rates were analysed by geographic area of residence. risk factor and vaccination status data were collected through follow-up with either general practitioners or the australian childhood immunization register (acir) and other sources such as cases or health-care provider reports. results selected vaccine-preventable diseases haemophilus influenzae serotype b invasive infection in 2013, nine cases of h. influenzae serotype b infection were notified; five were children under 5 years and six were female. all three infants under 1 year (one 1-month-old and two 9-month-old infants) were fully vaccinated for age (one and three doses respectively). of the two infants aged 12 months or older, one 19-month-old infant was partially vaccinated for age (one dose) and one 3-year-old was fully vaccinated for age (four doses). one case was identified as being aboriginal and five lived in regional new south wales. measles in 2013, 34 cases of measles were notified in new south wales, compared to 172 in 2012 (table 1). the highest notification rates were reported among children aged 0–4 years (10 cases, 2.1 per 100 000 population), of whom four were too young to be vaccinated, and in children aged 5–9 years (six cases, 1.3 per 100 000 population) (table 2). seventeen cases (50%) were male. of the 34 cases of measles, 22 were australian-born, nine were born in countries other than australia (mostly in the asia-pacific region and europe) and no data was available on three cases. table 1. vaccine-preventable disease notifications and rates per 100 000 population, new south wales, australia, 1991 to 2013 click to download table 1. jpg, 1110kb nn, not notifiable; * incomplete data. 1991–1992 data should be interpreted with caution as the notification system was just commencing. note: major changes to the new south wales immunization programme since 1991 include: haemophilus influenzae serotype b immunization commencement in july 1993, second dose of measles-containing vaccine (measles–mumps–rubella, mmr) for all 10–16-year-olds recommended in 1993, australian measles control campaign: re–scheduling of the second dose of mmr to 4 years of age, catch–up vaccination for primary schoolchildren aged 5–12 years in 1998, mmr vaccine at 18 months as a replacement of mmr at four years in july 2013, conjugate meningococcal c vaccine introduction in 2003, 4cmenb registration in august 2013, the addition of a preschool pertussis booster in 1994, acellular vaccines (dtpa) replacement of the whole cell vaccine in the late 1990s, the replacement of the 18-month booster with an adolescent booster in 2003, dtpa funded by nsw for parents, grandparents and carers of infants aged < 12 months under cocoon strategy, 7-valent conjugate pneumococcal vaccination (pcv-7) for infants since 2005 and 13-valent conjugate pneumococcal vaccine (pcv-13) replaced pcv-7 from july 2011 (see link to further information – http://ncirs.edu.au/immunisation/history/index.php). table 2. number and rate per 100 000 population of case notifications for selected vaccine-preventable diseases by age group, new south wales, australia, 2013 click to download table 2. jpg, 504kb measles cases were notified from eight lhds; the highest rate was in the northern new south wales lhd (six cases, 2.1 per 100 000 population) (table 3). table 3. number and case notifications rate per 100 000 population for selected vaccine-preventable diseases by local health district, new south wales, australia, 2013* click to download table 3. jpg, 588kb * note: missing and overseas-acquired notifications are not included. n/a, not applicable. of the 34 cases, 18 (53%) were unvaccinated, 11 (32%) were vaccinated and five (15%) had missing vaccination status. vaccination status was validated on the acir for four (all children under 5 years) and by self or parent recall for seven. of the four cases with vaccination validated on acir, only one 2-year-old with mild disease had evidence of receiving two doses of vaccine. of the 34 cases notified in 2013, 14 (41%) were acquired overseas, 19 (56%) were acquired in new south wales, and one (3%) was acquired elsewhere in australia. there were four cases infected with measles virus genotype b3 (acquired in the philippines, nepal, pakistan), six with measles virus genotype d8 (acquired in europe, thailand, india, victoria [australia]) and six with measles virus genotype d9 (acquired in indonesia). the longest duration of linked transmission (onset in primary case to onset in last case) was 29 days, which occurred in the largest cluster (n = 6 cases) (figure 1). figure 1. measles transmissions by local health district, epidemiological week, import status, place of acquisition and genotype, new south wales, australia, 2013 click to download figure 1. jpg, 410kb meningococcal disease (invasive) in 2013, 46 cases of invasive meningococcal disease were notified in new south wales compared with 65 cases notified in 2012 (table 1). two deaths were notified among cases in 2013; one was in the 50–54-year-old age group (serogroup c), and the other was 85 years or older (serogroup y). this compares to two deaths in 2012 (both caused by serogroup b). the highest case notification rates of invasive meningococcal disease were among children aged less than 5 years at onset of illness (16 cases, 3.3 per 100 000 population) and young people aged 15–19 years (eight cases, 1.7 per 100 000 population) (table 2). of the case notifications among children under 5 years, the highest rates were reported in infants under 12 months (six cases, 7.8 per 100 000 population) and children aged 2 years (four cases, 5.6 per 100 000 population). in 2013, 24 cases (52%) with invasive meningococcal disease were male. invasive meningococcal disease was notified in four aboriginal people, all due to serogroup b infection. the highest case notification rates were from northern new south wales lhd (four cases, 1.4 per 100 000 population) (table 3). of the 46 cases notified in new south wales in 2013, a serogroup was identified for 43 (93%): 26 (60%) cases were serogroup b (for which there was no vaccine), eight (19%) were serogroup y, six (14%) were serogroup w135, and three (7%) were serogroup c. of the three untyped cases, two were not typeable (figure 2). of the three cases of disease due to serogroup c, two were ineligible for vaccination through the national immunization programme, and one was vaccinated against meningococcal c disease in 2004. the overall decline in notifications from 2012 to 2013 was associated with a decline in serogroup b disease from 43 to 26 notifications (figure 2). figure 2. annual case notifications of invasive meningococcal disease by serogroup, new south wales, australia, 2002 to 2013 click to download figure 2. jpg, 256kb mumps in 2013, 91 cases of mumps were notified in new south wales compared to 105 in 2012 (table 1). the highest case notification rates of mumps were among young adults aged 15–19 years (15 cases, 3.2 per 100 000 population) (table 2). in 2013, 50 cases (55%) were male. in new south wales, notified cases of mumps are not routinely followed up by public health units. pertussis in 2013, 2337 cases of pertussis were notified in new south wales compared to 5838 in 2012 (table 1). the highest age-specific pertussis case notification rates were in children aged 5–9 years (515 cases, 111.1 per 100 000 population) and 0–4 years (444 cases, 92.4 per 100 000 population) (table 2), a decrease from 2012. of the children under 5 years, the highest notification rates were in children aged 3 years (115 cases, 157.1 per 100 000 population). notification rates among infants under 12 months decreased from 2012 to 2013. there were no infant pertussis deaths in 2013. in 2013, 1324 cases (57%) were female. of the 444 cases aged 0–4 years, 37 (8%) were aboriginal. geographically, the highest case notification rates were reported in murrumbidgee (including albury) (245 cases; 84.8 per 100 000 population) and southern new south wales (129 cases; 64.4 per 100 000 population) (table 3). in total, 102 cases were younger than 12 months: 56 (55%) were infants too young to have received three doses of vaccine. of the 342 cases aged 1–4 years, 24 (7%) were reported to be not immunized, nine (3%) reported less than three doses of vaccine and 289 (85%) reported three or more doses. for the remainder of cases (5%), vaccine dosages were not reported. pneumococcal disease (invasive) in 2013, 471 cases of invasive pneumococcal disease were notified compared to 579 in 2012 (table 1). forty deaths occured: two were children, one aged 1-year-old (serotype 15c, non-vaccine type) and one 2-year-old (19a, vaccine type, child fully vaccinated). of the remaining deaths, two were people aged 35–49 years, eight were 50–64-year-olds and 28 were aged 65 years and older. notification rates by lhd varied from 3.2 per 100 000 population in far west lhd to 9.0 per 100 000 population in nepean blue mountains lhd (table 3). of the 361 cases aged 0–4 years or older than 50 years (age groups which are followed up by public health units), 10 (3%) were notified in aboriginal people, among whom notification rates were higher than in non-aboriginal people (17.0 and 11.9 per 100 000, respectively). notification rates in children under 5 years was 12.5 per 100 000 population. serotype 19a was the leading cause of disease (22%) in children under 5 years. vaccination data were available for 100% (60 cases) of notifications under the age of 5 years. forty (67%) cases were fully vaccinated, and eight (13%) were either partially vaccinated or too young to have received the first dose. there were eight cases of vaccine serotype disease in fully vaccinated children. serotype 19a accounted for 63% of vaccine failures and serotypes 3 (25%) and 23f (12%) were responsible for the remainder of cases. from 1 july 2011, 13-valent conjugate pneumococcal vaccine (pcv-13) replaced 7-valent conjugate pneumococcal vaccine (pcv-7) on the new south wales immunization schedule. the pcv-13 vaccine includes protection for additional serotypes 1, 3, 5, 6a, 7f and 19a. the rate of disease in children under 5 years in new south wales declined from 19.0 per 100 000 in 2011 to 12.5 per 100 000 in 2013 after the introduction of pcv-13. the percentage of disease due to vaccine serotypes fell by 29% post introduction; however, the percentage of disease due to non-vaccine serotypes increased by 29%. rubella in 2013, 12 cases of rubella were notified in new south wales compared to 10 in 2012 (table 1). all cases were aged between 15 and 60 years. seven cases (58%) were male. the highest notification rates were in the northern new south wales lhd (six cases, 2.0 per 100 000 population) (table 3). notifications have not changed markedly over the previous five years. tetanus in 2013, two cases of tetanus were notified in new south wales. one case was a 30-year-old male construction worker who reported being vaccinated. the other was an 82-year-old male who reported being vaccinated more than 10 years earlier. the number of notified cases of tetanus has remained relatively unchanged over the past five years, ranging from one to two cases annually. other travel-associated vaccine-preventable diseases cholera in 2013, two cases of cholera were notified in new south wales. one case in an unvaccinated person was acquired during a visit to bangladesh, and an occupationally acquired case was notified in a laboratory worker. hepatitis a in 2013, 62 cases of hepatitis a were reported of which 47 (75%) were acquired overseas. one case reported vaccination against hepatitis a five years before leaving australia. another seven (11%) were household contacts of those that had travelled overseas, and two (3%) reported consuming food acquired overseas. the remaining six (10%) cases were acquired locally with no source identified. typhoid in 2013, there were 59 notifications of typhoid; 54 (93%) were acquired overseas. of these 54 notifications, six reported being vaccinated against typhoid before travelling. five cases reported no overseas travel. of these, three had household contact with a confirmed case, one reported contact with overseas visitors, and the source was not identified for one case. discussion in 2013, pertussis notification rates were the lowest across all age groups since 2007. the 2013 pertussis epidemiology is consistent with a low transmission period in the threeto four-year cycle of pertussis epidemics. the high vaccination coverage among adult caregivers during the new south wales health funded cocooning vaccination programme may have also contributed to the low rates.4 as with previous years, the highest notification rates were in 5–9-year-old children. endemic measles has been eliminated in new south wales since the late 1990s;5 however, outbreaks of increasing size and duration were reported in new south wales in 2011 and 2012.6,7 in 2013, measles epidemiology was characterized by a high number of overseas-acquired infections (n = 14, 41%) with little secondary transmission. this was likely due to high levels of immunity to measles among contacts of cases and effective systems for public health response. the highest notification rates were reported in northern new south wales lhd where vaccination coverage rates are the lowest in new south wales.7 the number of notified cases of invasive meningococcal disease has declined significantly since the national meningococcal c immunization programme commenced in 2003.8 serogroup b remains predominant in new south wales; however, the largest serogroup-specific reduction in meningococcal notifications in 2013 compared to 2012 was for serogroup b notifications in the absence of vaccination.9 the death in an elderly person due to serogroup y is a reminder of increased mortality in the elderly, particularly for this serogroup.10 the meningococcal c vaccine failure may have been due to waning immunity, host factors or issues with the storage or administration of the vaccine. with the newly available vaccine against meningococcal serogroup b disease (not included in the current immunization schedule), consideration should be given to the potential impact on strain variation and carriage, adverse events following immunization, as well as how vaccine effectiveness and failure will be defined and monitored following its introduction.11 the h. influenzae serotype b immunization programme, which commenced in 1993, has achieved great success in achieving and maintaining low notifications for several years; notifications of other vaccine-preventable diseases (such as mumps, rubella and tetanus) have remained stable or declined over recent years. while there are limitations to these data, vaccine-preventable disease surveillance in new south wales enables the implementation of timely public health measures, a better understanding of disease trends and informs policy. the extremely low number of cholera, hepatitis a and typhoid cases that were vaccinated before travelling to high-risk countries highlights the great potential for pre-travel immunization. health-care providers who see travellers before travel should consider countryand region-specific vaccination, prophylaxis, and disease avoidance recommendations during the consultation.12 employers should implement a comprehensive occupational vaccination programme for workers at significant risk of acquiring a vaccine-preventable disease.13 the australian immunization handbook could consider the inclusion of cholera (and possibly other pathogens) under recommendations for vaccination of those routinely working with this pathogen. invasive pneumococcal disease continued to decline post introduction of the 13-valent conjugate pneumococcal vaccine in 2011 with overall reduction of disease in the majority of age groups. notification rates in children under 5 years in new south wales has fallen from 19.0 per 100 000 in 2011 to 12.5 per 100 000 in 2013. serotype 19a continues to be the leading cause of disease in children and also accounts for the majority of vaccine failures in this age group (0–5 years). while notification rates are not increasing in children, notification rates caused by non-vaccine-related serotypes continue to increase. notifications included in the new south wales notifiable disease database under the public health act 201014 have laboratory evidence or a link to a laboratory-confirmed case. the number of notifications reflects health-care-seeking behaviour and testing practices which vary across new south wales. consequently, the data analysed likely understates the true incidence of infection in new south wales. conclusion vaccine-preventable disease surveillance has enabled enhanced monitoring of disease trends, implementation of outbreak control measures and evaluation of prevention programmes in new south wales. the highlights of the prevention and control programmes in 2013 include the low pertussis notification rates in infants, no infant pertussis deaths, extremely limited measles transmission following overseas importation and low rates of invasive meningococcal disease due to serogroup c. challenges remain in closing the measles immunity gaps in at-risk populations, ensuring new mothers have been adequately immunized against pertussis (and influenza) as well as improved uptake of vaccination in travellers and other risk groups. high vaccination coverage and timely vaccination for infants and children is important to maintain low rates of disease. improving vaccination coverage in aboriginal communities is crucial for successful disease prevention strategies. conflicts of interest none declared. funding none. acknowledgements we wish to acknowledge disease notifiers and public health network staff who conduct investigations and follow up notifications and the new south wales health laboratory network. references: health new south wales. local health districts and specialty networks. north sydney, new south wales health, 2014. available from: http://www.health.nsw.gov.au/lhd/pages/default.aspx [accessed 15 march 2015]. rosewell a, spokes pj, gilmour re. nsw annual vaccine-preventable disease report, 2011. new south wales public health bulletin, 2012, 23:171–178. doi:10.1071/nb12086 pmid:23442994 communicable diseases network australia. australian national notifiable diseases and case definitions. canberra, department of health, 2014. available from: http://www.health.gov.au/casedefinitions [accessed 16 may 2014]. quinn he et al. parental tdap boosters and infant pertussis: a case-control study. pediatrics, 2014, 134:713–20. doi:10.1542/peds.2014-1105 pmid:25225136 heywood ae et al. elimination of endemic measles transmission in australia. bulletin of the world health organization, 2009, 87:64–71. doi:10.2471/blt.07.046375 pmid:19197406 hope k et al. measles transmission in health care waiting rooms: implications for public health response. western pacific surveillance and response journal, 2012, 3:33–8. doi:10.5365/wpsar.2012.3.3.009 pmid:23908937 health new south wales. percentage of children in nsw fully immunised by age group and local health district – march 2011 – march 2014. north sydney, new south wales health, 2014. available from: http://www.health.nsw.gov.au/ immunisation/documents/coverage-by-lhd.pdf [accessed 3 november 2014]. booy r et al. impact of meningococcal c conjugate vaccine use in australia. medical journal of australia, 2007, 186:108–109. pmid:17309394 rosewell a, spokes pj, gilmour re. new south wales annual vaccine-preventable disease report, 2012. western pacific surveillance and response journal, 2014, 5(2):15–22. doi:105365/wpsar.2014.5.2.004 pmid:25077033 gunaratnam p et al. invasive meningococcal disease in elderly people, new south wales, australia, 1993 to 2012. western pacific surveillance and response journal, 2013, 4(4):4–10. doi:10.5365/wpsar.2013.4.4.001 pmid:24478917 kaaijk p, van der ende a, luytjes w. routine vaccination against men b: considerations for implementation. human vaccines and immunotherapies, 2014, 10:310–6. doi:10.4161/hv.26816 pmid:24141209 surveillance for travel-related disease — geosentinel surveillance system. united states, 1997–2011. mmwr. surveillance summaries, 2013, 62:1–23. available from: http://www.cdc.gov/mmwr/preview/mmwrhtml/ss6203a1.htm [accessed 28 may 2014]. australian technical advisory group on immunization. the australian immunisation handbook 10th edition. canberra, australian government department of health, 2013. available from: http://www.immunise.health.gov.au/internet/immunise/ publishing.nsf/content/handbook10-home [accessed 16 may 2014]. public health act 2010 no 127. north sydney, new south wales consolidated acts, 2013. available from: http://www.legislation.nsw.gov.au/inforcepdf/2010-127.pdf?id=e20f1d11-6a0d-ec9a-fe79-d31ae57c52c3 [accessed 8 april 2015]. https://ojs.wpro.who.int/ 1wpsar vol 12, no 1, 2021 | doi: 10.5365/wpsar.2020.11.2.003 letter to the editor a san lazaro hospital, manila, philippines. b school of tropical medicine and global health, nagasaki university, nagasaki, japan. c institute of tropical medicine, nagasaki university, nagasaki, japan. d faculty of infectious and tropical diseases, london school of hygiene and tropical medicine. published: 8 january 2021 doi: 10.5365/wpsar.2020.11.2.003 w e note three successive waves of coronavirus disease 2019 (covid-19) cases in the national capital region (metropolitan manila), philippines: the first was from imported cases among chinese nationals; the second was from infections among filipinos residing in less densely populated areas; and the third was from infections among filipinos residing in high-density, poor areas. we support these observations with data from san lazaro hospital, the national infectious diseases hospital, which serves a low-income population in manila city, the most densely populated city within metropolitan manila (fig. 1). the first two confirmed cases of covid-19 in the philippines were among chinese nationals on vacation, both of whom were admitted to san lazaro hospital on 25 january 2020, with confirmation on 31 january and 1 february.1 a third imported case from china was confirmed on 3 february 2020.2 despite concerns that all three individuals had travelled widely within the philippines, no secondary infections arising from these cases were confirmed. the next person with confirmed covid-19 was admitted to san lazaro hospital more than one month later, on 8 march. during the following 10 days, a further 17 confirmed cases were reported at the hospital. in contrast to the first individuals with confirmed covid-19, these individuals were all filipinos, with seven reporting recent travel to areas affected by covid-19. none of these patients resided in the densely populated catchment area of the hospital. from 19 to 29 march, a further 16 cases were confirmed at the hospital. in contrast to the previous wave, all patients except for one resided in manila city, with only one reporting a significant history of international travel. the occurrence of confirmed covid-19 in manila city is concerning given that it has an estimated population density of 71 263 persons per square kilometre. in the philippines overall, there were 9223 confirmed cases as of 3 may.2 the true number of cases is likely to be much higher given that until late march testing was conducted by only one laboratory in the country. significant community transmission cannot be excluded due to the lack of laboratory surveillance data. the establishment of subnational laboratories across the philippines, including at san lazaro hospital, is timely and welcome. in manila city, increased community testing and monitoring of individuals presenting to hospitals with respiratory symptoms could detect increased covid-19 transmission. at-home isolation for 14 days is now recommended for people with mild covid-19;3 however, for people living in high-density or slum areas, it will be challenging to ensure that they are able to adequately isolate to avoid further transmission. the planned establishment of designated isolation facilities and expansion of testing should help reduce community transmission.4 a surge of severe or high-risk cases in manila city is likely to put enormous pressure on health-care facilities, which are already experiencing significant infections among health-care workers and shortages of personal protective equipment. bed shortages may become more acute if other infectious disease outbreaks occur, such as measles, dengue or leptospirosis. covid-19 is moving to high-density, poor residential areas in metropolitan manila, philippines eumelia p. salva villarama,a edmundo b. lopez,a ana ria sayo,a xerxes seposo,b koya ariyoshi,c and chris smithb,d correspondence to chris smith (email: christopher.smith@lshtm.ac.uk, christopher.smith@nagasaki.ac.jp) wpsar vol 12, no 1, 2021 | doi: 10.5365/wpsar.2020.11.2.003 https://ojs.wpro.who.int/2 smith et alcovid-19 in manila conflicts of interest the authors declare that they have no competing interests. funding nagasaki university provides salary support for x seposo, k anyoshi and c smith. no external funding was received for the data collection, data analysis, data interpretation or preparation of the manuscript. luzon island has been under community quarantine since 15 march 2020.5 people living in high-density areas, such as manila city, are likely to be more vulnerable to the negative consequences of community quarantine, such as economic difficulties, food insecurity and domestic violence. it is hoped that the quarantine measures will flatten the epidemic curve and result in fewer overall infections, but they may be difficult to sustain for a long period. fig. 1. timeline of cases with confirmed covid-19 admitted to san lazaro hospital, from 25 january to 29 march 2020. maps show the residence of patients in the national capital region (metropolitan manila) admitted during 8–18 march (left) and 19–29 march (right). confirmed cases of covid-19 san lazaro hospital < 14 000 14 001 to 28 000 28 001 to 42 000 42 001 to 57 000 > 57 000 population density (persons per square kilometre) n u m b e r o f c a s e s + 6 5 4 3 2 date 1 0 25 /0 1/ 20 20 27 /0 1/ 20 20 29 /0 1/ 20 20 31 /0 1/ 20 20 02 /0 2/ 20 20 04 /0 2/ 20 20 06 /0 2/ 20 20 08 /0 2/ 20 20 10 /0 2/ 20 20 12 /0 2/ 20 20 14 /0 2/ 20 20 16 /0 2/ 20 20 18 /0 2/ 20 20 20 /0 2/ 20 20 22 /0 2/ 20 20 24 /0 2/ 20 20 26 /0 2/ 20 20 28 /0 2/ 20 20 01 /0 3/ 20 20 03 /0 3/ 20 20 05 /0 3/ 20 20 07 /0 3/ 20 20 09 /0 3/ 20 20 11 /0 3/ 20 20 13 /0 3/ 20 20 15 /0 3/ 20 20 17 /0 3/ 20 20 19 /0 3/ 20 20 21 /0 3/ 20 20 23 /0 3/ 20 20 25 /0 3/ 20 20 27 /0 3/ 20 20 29 /0 3/ 20 20 wpsar vol 12, no 1, 2021 | doi: 10.5365/wpsar.2020.11.2.003https://ojs.wpro.who.int/ 3 covid-19 in manilasmith et al references 1. edrada m, lopez e, villarama j, villarama e, dagoc b, smith c, et al. first covid-19 infections in the philippines: a case report. trop med health. 2020;48(21):1–7. 2. covid-19 tracker. manila: department of health; 2020. available from: https://www.doh.gov.ph/covid19tracker, accessed 15 april 2020. 3. interim guidance on the clinical management of adult patients with suspected or confirmed covid-19 infection: version 2.1. quezon city: philippine society for microbiology and infectious diseases; 2020. available from: https://www.psmid.org/interimmanagement-guidelines-for-covid-19-version-3-1/, accessed 31 march 2020. 4. doh reports efforts to conduct more tests, prepare more quarantine facilities, and backs “science-based approach” to determine interventions. manila: department of health; 2020. available from: https://www.doh.gov.ph/doh-press-release/doh-reports-efforts-to-conduct-more-tests-prepare-more-quarantine-facilities-and-backs-science-based-approach, accessed 9 april 2020. 5. resolution no. 12: recommendations for the management of the coronavirus disease 2019 (covid-19) situation. manila: covid-19 inter-agency task force for the management of emerging infectious diseases, department of health; 2020. available from: https://www.doh.gov.ph/sites/default/files/health-update/iatfreso-12.pdf, accessed 15 march 2020. case-control study of risk factors for incident syphilis infection among men who have sex with men in tokyo, japan original research masahiro ishikane,a,b,c yuzo arima,d ichiro itoda,e takuya yamagishi,d takuri takahashi,d tamano matsui,d tomimasa sunagawa,d makoto ohnishif and kazunori oishid a field epidemiology training program, national institute of infectious diseases, tokyo, japan. b division of global infectious diseases, department of infection and epidemiology, graduate school of medicine, tohoku university, miyagi, japan. c department of disease control and prevention center, national center for global health and medicine, tokyo, japan. d infectious disease surveillance center, national institute of infectious diseases, tokyo, japan. e shirakaba clinic, tokyo, japan. f department of bacteriology i, national institute of infectious diseases, tokyo, japan. correspondence to yuzo arima (email: arima@niid.go.jp). to cite this article: ishikane m, arima y, itoda i, yamagishi t, takahashi t, matsui t, et al. case-control study of risk factors for incident syphilis infection among men who have sex with men in tokyo, japan. western pac surveill response j. 2019 dec;10(4). doi:10.5365/wpsar.2019.10.1.003 introduction: in japan, syphilis notifications have increased. men who have sex with men (msm) in tokyo have contributed substantially to the increase in syphilis notifications. we thus aimed to determine the correlates of incident syphilis among them. methods: msm who attended a tokyo clinic that serves sexual minorities were recruited in a case-control study in 2015. a case was seropositive for primary/secondary/asymptomatic syphilis at enrolment visit and seronegative at prior visit or had oral ulcers positive for treponema pallidum dna at enrolment. for each case, two controls seronegative at enrolment and prior visit were selected. using logistic regression, odds ratios (ors) and 95% confidence intervals (cis) were estimated to assess for correlates of case status. results: among 35 cases, the median age was 37 (range = 21–63) years and was similar to the 71 controls. among hiv-positive participants (26 cases and 67 controls), cases were independently associated with higher frequency of anal or oral sex (or = 3.4; 95% ci = 1.4–8.6; increase per category from < 1/month, ≥ 1/month but discussion: modifiable behaviours were associated with incident syphilis, and dissemination of prevention messages are needed. syphilis, a nationally notifiable infectious disease in japan, has seen a considerable rise in the number of notifications,1,2 similar to many other countries globally,3,4 including within the western pacific region.5–7 in japan, while more recent increases in syphilis have been among heterosexual men and women,8 during 2013–2014, this increase was predominantly associated with men who have sex with men (msm).1,2 the number of notifications among msm remained high through 2018. notably, both the absolute number of reported msm and heterosexual syphilis cases and the notification rate per population have been highest in tokyo (4 cases per 100 000 persons-years during 2012–2016), contributing one third of the national cases.8,9 recent studies among msm have reported that factors associated with syphilis were low educational attainment, sex with casual partners without a condom and coinfection with other sexually transmitted infections (stis).10–13 using mobile phone applications and the internet to seek partners has also been reported as a potential risk factor for stis, including syphilis, among msm.14–16 while these and other practices have been suggested as possible contributors to the recent rise of syphilis notifications in japan, very few studies have evaluated potential predictors for syphilis acquisition in japan. recently, there was a cohort study analysing the risk factors of incident syphilis infection among hiv-positive msm in japan,17 but behavioural factors were not assessed. to better understand the syphilis outbreak among msm in tokyo, we conducted a clinic-based case-control study based on a self-administered questionnaire to assess the potential risk factors, including modifiable behavioural factors, for incident syphilis. materials and methods study design and setting we conducted a case-control study at shirakaba clinic, a clinic that serves sexual minority populations. the clinic is located in the urban area of tokyo, and most of the patients are msm from tokyo and its neighbouring areas. annually, the clinic serves about 500 hiv-positive patients, and patients with hiv-infection are advised to visit the clinic for antiretroviral therapy treatment and checkup about every three months. other patients may make a visit if they have signs/symptoms or have concerns regarding sti acquisition. sampling and study population sampling persons who visited shirakaba clinic from 1 january to 31 november 2015 and received a syphilis test based on the clinician’s evaluation were recruited. eligible subjects were japanese males who self-reported as msm, aged ≥18 years and with sexual activity (anal and/or oral sex) with another male in the six months before study entry. based on the recent findings from champenois et al.,11 assuming 62% exposure in the controls (e.g. for unprotected sex), we estimated that a total sample size of 105 participants with a case-to-control ratio of one to two would be able to detect an odds ratio (or) of 4.8 with 80% power.11 case subjects a case was defined as an eligible subject with evidence of recent syphilis infection. for syphilis infection, one of the following conditions based on clinical examination and laboratory evaluation was required: (1) seropositivity by nonspecific (i.e. rapid plasma reagin [rpr]) and specific (i.e. treponema pallidum latex agglutination [tpla]) treponemal tests for primary, secondary or asymptomatic syphilis18,19 at a clinic visit at the time of study entry and seronegative based on a nonspecific treponemal test at prior visit; (2) a syphilitic lesion testing positive for t. pallidum dna (pola/tpn47 genes) by polymerase chain reaction (pcr)20,21 at the enrolment visit (pcr method available on a limited basis for research). we excluded late stage and neurosyphilis cases because they likely would not reflect recent infection, and sexual activity within the recent six months would not be causally related to such infections. control subjects a control was defined as an eligible subject without evidence of recent syphilis infection. control subjects were seronegative by nonspecific treponemal test for syphilis at both the most recent clinic visit (i.e. time of study entry) and prior visit. for each case, two controls who visited the clinic at the time closest to the time of case detection (within a month) were selected; this was done to recruit controls in a systematic manner and to ensure the same distribution of recruitment time as cases. data collection the following data were collected from the self-administered questionnaire: (1) socio-demographic characteristics, (2) health conditions including past sti history, and (3) sexual activities in the past six months. pre-exposure prophylaxis for hiv was not available in japan at the time and thus not included. the questionnaire was developed based on those from recent studies10,11 and adapted to the japanese context. before conducting the study, we performed a pilot study22 to pretest and improve the questionnaire tool. the questionnaire was completed by the respondent in a private location to reduce social desirability bias. in addition, the following data were collected from the patients’ medical charts: (1) clinical data including the stage of syphilis (primary, secondary or asymptomatic); (2) syphilis serology; and (3) hiv-related data. participants received an sti prevention packet as compensation. laboratory testing shirakaba clinic tested serum for syphilis by using the rpr test and tpla test. the diagnosis of seropositive syphilis was based on both serum rpr value and positive tpla result.23 for those highly suspected to be primary stage syphilis based on clinical diagnosis, the clinic sent samples of the syphilitic lesions from those patients to the national institute of infectious diseases (niid) in japan (1) where pcr was performed.20,21 patients were notified of the results in seven days, and they received empirical treatment for syphilis while waiting for the results. patients were notified of their test results in person or by phone and offered appropriate treatment and follow-up with post-test counselling. the clinic also tested subjects’ serum for hiv by using a fourth-generation combined enzyme immunoassay and antigen screening tests. statistical analysis descriptive analyses were conducted to assess the distribution of characteristics among cases and controls. to compare distributions, the student’s t-test or the mann–whitney u test was used for continuous variables and the χ2 test or fisher’s exact test for categorical variables. using univariate logistic regression with odds ratios and the associated 95% confidence intervals, we assessed the association between syphilis infection and sociodemographic characteristics, health conditions including past sti history and recent sexual activities. potential risk factors for incident syphilis hypothesized a priori based on a conceptual model (e.g. condom use, frequency of sex) were considered for inclusion in a multivariable model for risk factors adjusted for duration between entry visit and prior visit. variables with a notably large or small or in the univariate analysis were also considered in further exploratory analyses. statistical significance was defined as two-sided p-values ethics this study was approved by the ethics committee of the niid in japan (approval no: niid-564) and was implemented in accordance with the provisions of the declaration of helsinki.24 informed consent was obtained from all participants in the study. results description of syphilis cases and controls during the study period, a total of 123 participants (41 cases and 82 controls) agreed to participate and were enrolled in the study. twelve subjects agreed to participate but did not respond to the questionnaire; based on the questionnaire responses, five additional subjects were excluded because they provided discrepant answers from the recruitment screening (i.e. they denied having sex in the past six months in the questionnaire). the remaining 106 participants (35 cases and 71 controls) were enrolled for analysis (fig. 1). the sexual identity of all participants was confirmed to be msm based on self-reporting. one case was married to a woman, and one control was divorced. click to download figure 1. jpg, 395kb among cases, the median age at study entry was 37 (range: 21–63) years, and the median age for first sex with a male was 18 (range: 10 −25) years, both of which were similar to those of controls (table 1). for stage of syphilis, three (8.6%) were primary, 13 (37.1%) were secondary and 19 (54.3%) were asymptomatic. among the symptomatic primary/secondary cases, 12 (34.3%) presented with rash, three (8.6%) with chancre and one (2.9%) with oral ulcer. thirty-two (91.4%) cases, including all asymptomatic cases, were diagnosed by serology, while all three (8.6%) cases with primary syphilis were diagnosed by pcr. the median duration between study entry visit and prior visit was 3.7 (iqr: 2.5–6.1) months among cases compared to 2.6 (iqr: 2.0–3.0) months among controls (p click to download table 1. jpg, 348kb correlates of incident syphilis infection, univariate analysis compared to controls, cases were more likely to have resided in tokyo (or = 3.5; 95% ci = 1.1–11.1) and have a past history of syphilis (or = 2.7; 95% ci = 1.1–6.2) (table 1). cases were also more likely to have a past history of stis other than syphilis or hiv (or = 5.4; 95% ci = 1.7–16.8); specifically, cases had a higher odds of having a past history of gonorrhea infection and anogenital human papillomavirus (hpv) infection (table 1). in contrast, while most cases and controls were infected with hiv, a lower proportion of the cases were infected with hiv relative to controls (26 cases [74.3%] versus 67 controls [94.4%]; or = 0.2; 95% ci = 0.1–0.6) (table 1). among the hiv-positive participants, 24 cases (92.3%) and 64 controls (95.6%) were receiving antiretroviral therapy (art) at the time of study entry and hiv-rna was well suppressed in both cases and controls, with a median cd4 count (cell/μl) of 603 (iqr: 195–1206) in cases and 655 (iqr: 482–778) in controls. hiv-positive msm had a shorter interval period between study entry and prior visit (median: 2.8 months; iqr: 2.1–3.5) compared to hiv-negative msm (median: 4.9 months; iqr: 2.2–10.7). intervals were similar for hiv-positive (median: 2.7 months) and hiv-negative (median: 2.6 months) controls, but only four out of 13 hiv-negative msm were controls. while the majority of the hiv-positive cases were asymptomatic (18/26 cases), among the nine hiv-negative cases, six were secondary, two were primary, and one was asymptomatic for stages of syphilis. cases were significantly associated with both the number of sex partners and average frequency of sex (anal or oral) in the past six months compared to controls with a dose-response relationship of increased odds of case status with increase in either of these factors (table 2). cases were also associated with alcohol intake and sex toy use during sex (anal or oral). in addition, cases had a greater odds of no or inconsistent condom use during sex. while there was a greater magnitude of association for anal than oral sex, there was a dose-response trend for both; combined as a single variable (i.e. complete, occasional or no condom use based on either sex act), there was a more than 10-fold increase in odds for those that did not use condoms at all relative to those who used them every time for either sex act (table 2). although the difference was not statistically significant, cases had a four-fold higher odds of having sex with a casual partner compared to controls; all nine participants who reported a steady partner were hiv-positive, and eight of them were controls. there were no differences between cases and controls in the method of seeking partners (cruising spot, internet or mobile phone applications) (table 2). in addition to type of method, no differences were detected when comparing the number of methods used in seeking sex partners. although there were no differences between cases and controls in the method of seeking partners, all four hiv-negative controls used mobile phone applications compared to 67% (45/67) of the hiv-positive controls. click to download figure 2. jpg, 338kb identification of potential risk factors among hiv-positive cases and controls by multivariable analysis given that there were only 13 hiv-negative subjects (9/35 cases and 4/71 controls) and hiv-positive subjects differed in health-care access behaviour (e.g. shorter time between visits), the main analysis was restricted to hiv-positive cases (n = 26) and controls (n = 67). results from univariate analysis for this restricted population were similar, with case status remaining strongly associated with the following: tokyo residency (or = 3.5; 95% ci = 1.0–13.0); past history of syphilis (or = 4.9; 95% ci = 1.7–14.5); past history of stis other than syphilis or hiv (or = 5.5; 95% ci = 1.5–20.1); number of sex partners (relative to 1–5 partners, or = 2.1 [95% ci = 1.1–3.9] for 6–15 partners, and or = 4.2 [95 %ci = 1.2–14.8] for ≥ 16 partners); average frequency of sex (relative to < 1/month, or = 4.8 [95% ci = 1.0–23.0] for ≥ 1/month but no or inconsistent condom use during anal or oral sex (relative to using every time, or = 2.9 [95% ci = 0.8–11.1] for occasional use and or = 8.9 [95% ci = 1.3–61.1) for no use]). while not significant, case status also remained associated with alcohol intake (or = 2.0; 95% ci 0.8–5.1) and sex toy use (or = 2.8; 95% ci = 0.9–8.4). number of sex partners, past syphilis infection, past stis other than syphilis or hiv, alcohol intake and sex toy use did not remain significant, and the association with case status was reduced when adjusted for average frequency of sex (anal or oral), an a priori hypothesized strong risk factor for incident infection. in multivariable analysis, average frequency of sex (anal or oral) and no or inconsistent condom use during either anal or oral sex both independently remained significantly associated with incident syphilis, with both having a three-fold increase in odds for increase per category, adjusted for tokyo residency and duration between entry visit and prior visit (table 3). click to download figure 2. jpg, 213kb discussion our case-control study found that no or inconsistent condom use during anal or oral sex and higher frequency of sex were potential risk factors for incident syphilis infection among hiv-positive msm in tokyo with a dose–response trend. as most of the participants were hiv-positive msm (87.8% [93/106]), and as hiv-positive patients were believed to differ from hiv-negative patients as a population, the primary analysis was restricted to the former. as hiv patients are requested to visit this clinic on a regular basis (usually every three months, including for art and laboratory testing), we found that the interval between visits was short among hiv-positive participants, thus increasing the likelihood of categorizing them as a control due to more frequent outcome detection. furthermore, although the majority of the hiv-positive cases were detected as asymptomatic, the majority of hiv-negative cases were detected as having secondary syphilis; given the more routine visits among hiv-positive cases, hiv-negative cases appeared to be detected at a later, symptomatic stage of syphilis. this restriction was thus deemed important to reduce sparse data bias and detection-related bias. although past studies from other countries have reported similar findings,10–13 to our knowledge, this is the first study in japan to assess for modifiable behaviours for incident syphilis infection among hiv-positive msm. similar to a recent case-control study in france11 that found unprotected oral sex to be a potential risk factor for incident syphilis among msm, we also found unprotected sex to be associated with greater odds of incident syphilis; importantly, we found a strong dose–response relationship and the association to be strongest when there was no condom use for either oral or anal sex. although there were only 13 hiv-negative participants, none of the nine cases used condoms at every sexual encounter while two of the four controls used them consistently, indicating a similar direction of risk with unprotected sex. as the majority of hiv-negative participants were also detected at the secondary stage with longer duration between visits, encouraging more routine testing among this subpopulation would be important to consider. our study showed that tokyo residency was marginally associated with incident syphilis. tokyo has been the epicentre of the syphilis outbreak in japan with both the highest absolute number of cases and the highest notification rate in japan.2 as tokyo residency remained associated with case status adjusted for frequency of sex, we considered that one of the possible reasons might be due to the syphilis status of the partner he would have encountered in tokyo. as the syphilis notification rate has been highest in tokyo, the prevalence would also be expected to be high, and, all else being equal, the risk of syphilis infection might be higher when encountering a “new partner” in tokyo. new partner acquisition has been associated with incident sti such as anogential hpv.25 this study has several important limitations. first, this study was conducted at a single clinic in tokyo, and generalizability of findings may be limited. however, this clinic reported the largest number of syphilis cases in tokyo, representing 18% (76/417 cases) of cases notified from tokyo in 2013.26 the clinic-based controls also accounted for biases associated with health care–seeking behaviours and helped ensure that cases and controls arose from the same population. while restriction to hiv-positive patients was deemed important to prevent detection-related biases, our interpretations are limited to hiv-positive msm, and the small number of hiv-negative patients precluded reliable assessments for effect modification. second, this study may be affected by residual or unmeasured confounding, such as that due to sex with a new partner. third, we could not evaluate temporality of events given the interval-censored nature of the data collected; although we assessed sexual activity in the six months before incident infection detection, it is not possible to determine the specific timing of sexual activity that would have been causally related to the acquisition of syphilis. lastly, because cases and controls were aware of their syphilis infection status at the time of the survey, such knowledge could have affected the reporting behavior differently between cases and controls. this study was the first case-control study to evaluate potential behavioural risk factors for incident syphilis infection in japan. in addition to locations in the region reporting a high burden of syphilis.5 these findings may be of particular relevance for member states where a high syphilis burden has been found in hiv-positive msm.27 although previous studies have pointed out that consistent condom use may protect against syphilis infection,10–13 this study was the first from japan to evaluate such practices and found that consistent condom use was associated with lower odds of incident syphilis in the current outbreak. conversely, higher frequency of sex was associated with incident syphilis. these findings are important for making informed, evidence-based recommendations regarding syphilis prevention among msm in japan. feedback of the preliminary findings to stakeholders, including the msm community, has taken place, and reporting of hiv status became required for national syphilis surveillance in january 2019; however, concerns remain as syphilis notifications among msm remain high. to tackle the syphilis outbreak, targeted sti prevention education (including condom use), risk communication and outreach for testing and further investigations are needed among msm in tokyo, particularly among non-hiv-positive msm where information is limited. tokyo prefecture has enhanced sti education and awareness activities, and several local jurisdictions in japan have initiated active contact-tracing investigations and partner notifications. with the upcoming tokyo olympic/paralympic games in 2020, a major global event with a potentially unprecedented number of visitors to enter japan, continued syphilis prevention and control will be important. references national institute of infectious diseases. syphilis in japan 2008–2014. infectious agents surveillance report. 2014;35:79–80. available from: https://www.niid.go.jp/niid/en/index-e/865-iasr/5413-tpc420.html sugishita y, yamagishi t, arima y, hori n, seki n. increase in primary and secondary syphilis notifications in men in tokyo, 2007–2013. jpn j infect dis. 2016;69(2):154–7. doi: 10.7883/yoken.jjid.2015.312 pmid: 26370433/ patton me, su jr, nelson r, weinstock h; centers for disease control and prevention (cdc). primary and secondary syphilis–united states, 2005-2013. mmwr morb mortal wkly rep. 2014 may 9;63(18):402–6. pmid: 24807239/ european centre for disease prevention and control (ecdc). sexually transmitted infections in europe, 1990–2010. stockholm: ecdc; 2012, available from: https://ecdc.europa.eu/en/publications-data/sexually-transmitted-infections-europe-1990-2010 (2012, accessed 9 march 2017). baigalmaa j, erdenechimeg c, narantuya j, bulbul a, tugsjargal j, dolgion e, et al. increasing syphilis notifications in mongolia: results from national surveillance for 2001–2011. west pac surveill response. 2012 dec 21;3(4):86–93. doi: 10.5365/wpsar.2012.3.2.008 pmid: 23908947 yang s, wu j, ding c, cui y, zhou y, li y, et al. epidemiological features of and changes in incidence of infectious diseases in china in the first decade after the sars outbreak: an observational trend study. lancet infect dis. 2017 jul;17(7):716–25. doi: 10.1016/s1473-3099(17)30227-x pmid: 28412150 kang sh, lee jh, choi sh, lee j, yoon hs, cha sh, et al. recent change in congenital syphilis in korea: retrospective 10 year study. pediatr int. 2015 dec;57(6):1112–5. doi: 10.1111/ped.12663 pmid: 25916174 takahashi t, arima y, yamagishi t, nishiki s, kanai m, ishikane m, et al. rapid increase in reports of syphilis associated with men who have sex with women and women who have sex with men, japan, 2012 to 2016. sex transm dis. 2018 mar;45(3):139–43. doi: 10.1097/olq.0000000000000768 pmid: 29420439 national institute of infectious diseases in japan. infectious agents surveillance report. available from: https://www.niid.go.jp/niid/ja/syphilis-m-3/syphilis-iasrd/7143-445d02.html [in japanese]. cao z, xu j, zhang h, song d, she m, wang j, et al. risk factors for syphilis among married men who have sex with men in china. sex transm dis. 2014 feb;41(2):98–102. doi: 10.1097/olq.0000000000000074 pmid: 24413488 champenois k, cousien a, ndiaye b, soukouna y, baclet v, alcaraz i, et al. risk factors for syphilis infection in men who have sex with men: results of a case-control study in lle, france. sex transm infect. 2013 mar;89(2):128–32. doi: 10.1136/sextrans-2012-050523 pmid: 22679099 jansen k, schmidt aj, drewes j, bremer v, marcus u. increased incidence of syphilis in men who have sex with men and risk management strategies, germany, 2015. euro surveill. 2016 oct 27;21(43):30382. doi: 10.2807/1560-7917.es.2016.21.43.30382 pmid: 27813472 shilaih m, marzel a, braun dl, scherrer au, kovari h, young j, et al.; and the swiss hiv cohort study. factors associated with syphilis incidence in the hiv-infected in the era of highly active antiretrovirals. medicine (baltimore). 2017 jan;96(2):e5849. doi: 10.1097/md.0000000000005849 pmid: 28079818 phillips g 2nd, magnus m, kuo i, rawls a, peterson j, jia y, et al. use of geosocial networking (gsn) mobile phone applications to find men for sex by men who have sex with men (msm) in washington, dc. aids behav. 2014 sep;18(9):1630–7. doi: 10.1007/s10461-014-0760-9 pmid: 24682866 wei c, lim sh, guadamuz te, koe s. virtual versus physical spaces: which facilitates greater hiv risk taking among men who have sex with men in east and south-east asia? aids behav. 2014 aug;18(8):1428–35. doi: 10.1007/s10461-013-0628-4 pmid: 24077974 desilva m, hedberg k, robinson b, toevs k, neblett-fanfair r, petrosky e, et al. a case-control study evaluating the role of internet meet-up sites and mobile telephone applications in influencing a syphilis outbreak: multnomah county, oregon, usa 2014. sex transm infect. 2016 aug;92(5):353–8. doi: 10.1136/sextrans-2015-052509 pmid: 27188272 nishijima t, teruya k, shibata s, yanagawa y, kobayashi t, mizushima d, et al. incidence and risk factors for incident syphilis among hiv-1-infected men who have sex with men in a large urban hiv clinic in tokyo, 2008-2015. plos one. 2016 dec 16;11(12):e0168642. doi: 10.1371/journal.pone.0168642 pmid: 27992604 janier m, hegyi v, dupin n, unemo m, tiplica gs, potočnik m, et al. 2014 european guideline on the management of syphilis. j eur acad dermatol venereol. 2014 dec;28(12):1581–93. doi: 10.1111/jdv.12734 pmid: 25348878 workowski ka, bolan ga; centers for disease control and prevention. sexually transmitted diseases treatment guidelines, 2015. mmwr recomm rep. 2015 jun 5;64 rr-03:1–137. pmid: 26042815 orle ka, gates ca, martin dh, body ba, weiss jb. simultaneous pcr detection of haemophilus ducreyi, treponema pallidum, and herpes simplex virus types 1 and 2 from genital ulcers. j clin microbiol. 1996 jan;34(1):49–54. pmid: 8748271 liu h, rodes b, chen cy, steiner b. new tests for syphilis: rational design of a pcr method for detection of treponema pallidum in clinical specimens using unique regions of the dna polymerase i gene. j clin microbiol. 2001 may;39(5):1941–6. doi: 10.1128/jcm.39.5.1941-1946.2001 pmid: 11326018 ishikane m, arima y, itoda i, takahashi t, yamagishi t, matsui t, et al. responding to the syphilis outbreak in japan: piloting a questionnaire to evaluate potential risk factors for incident syphilis infection among men who have sex with men in tokyo, japan, 2015. west pac surveill response. 2016 jul 11;7(3):36–9. doi: 10.5365/wpsar.2016.7.2.001 pmid: 27757259 kenyon c, lynen l, florence e, caluwaerts s, vandenbruaene m, apers l, et al. syphilis reinfections pose problems for syphilis diagnosis in antwerp, belgium 1992 to 2012. euro surveill. 2014 nov 13;19(45):20958. doi: 10.2807/1560-7917.es2014.19.45.20958 pmid: 25411690 world medical association. world medical association declaration of helsinki ethical principles for medical research involving human subjects. jama. 2013 nov 27;310(20):2191-4. doi: 10.1001/jama.2013.281053 winer rl, lee sk, hughes jp, adam de, kiviat nb, koutsky la. genital human papillomavirus infection: incidence and risk factors in a cohort of female university students. am j epidemiol. 2003 feb 1;157(3):218–26. doi: 10.1093/aje/kwf180 pmid: 12543621 ichiro i. how much is the syphilis increasing (in japanese)? the 28th annual meeting of the japanese society for aids research; 2014 dec 3; osaka, japan. available from: http://www.secretariat.ne.jp/aids28/program/pdf/kouen1204.pdf ong jj, fu h, pan s, smith mk, wu d, wei c, et al. missed opportunities for human immunodeficiency virus and syphilis testing among men who have sex with men in china: a cross-sectional study. sex transm dis. 2018 06;45(6):382–6. doi: 10.1097/olq.0000000000000773 pmid: 29750773 digital dashboards as tools for regional influenza monitoring perspective sarah hamid,a leila bell,a erica l. duegera a division of health security and emergencies, who regional office for the western pacific. correspondence to sarah hamid (email:sarah.hamid@emory.edu). to cite this article: hamid s, bell l, dueger e. digital dashboards as tools for regional influenza monitoring. western pac surveill response j. 2017 august;8(3). doi:10.5365/wpsar.2017.8.2.003. yearly seasonal epidemics of influenza, an acute viral respiratory disease, pose a substantial health burden on all age groups worldwide.1 in addition, zoonotic influenza viruses circulating in animal populations cause occasional infections in humans. influenza is a priority disease for regional surveillance in the world health organization (who) western pacific region, where several zoonotic influenza viruses have infected humans in recent years.2 effective risk assessment for influenza is supported through the use of multiple sources of surveillance information. however, bringing together different streams of data and information for analysis can be challenging. online visualization and analytics tools help to synthesize and disseminate various data sources for risk assessment and public health action. herein we describe digital dashboards built by the who regional office for the western pacific to share regional influenza data. surveillance systems for influenza are well established in many high-income countries, allowing for continuous epidemiological and virological characterization of circulating viruses.3 data from these systems are routinely analysed to monitor trends, assess risk, plan interventions and allocate resources.4 in recent years, many lowerand middle-income countries have established syndromic surveillance systems for influenza that are also generating repositories of epidemiological and virological data.5 who's global influenza surveillance and response system (gisrs) collects and collates data on circulating strains of influenza viruses to inform vaccine composition recommendations, conduct risk assessments and monitor antiviral susceptibility.6 in the western pacific region, gisrs includes 21 national influenza centres (nics) in 15 countries and areas that receive respiratory specimens from a range of sources in their respective countries. nics upload virologic data to flunet, a publicly available web-based tool for influenza virological surveillance launched by who in 1997. recently, who established flumart, a global data-sharing platform that links national influenza epidemiological data with virological flunet data in a single global database. further efforts are needed to analyse and disseminate these routinely collected data to inform policy and stimulate public health action. interactive, web-based surveillance reporting platforms allow users to access timely disease information collected by national surveillance systems and view these data in a dynamic manner to meet their particular needs.7 several agencies, including various who offices and the united states centers for disease control and prevention, have developed platforms to disseminate influenza surveillance information.8-10 to enhance regional information-sharing and the use of multiple sources of information for risk assessment under the asia pacific strategy for emerging diseases and public health emergencies,11 and to further global collaboration under the pandemic influenza preparedness framework partnership contribution implementation plan, the who regional office for the western pacific has developed a set of online interactive influenza dashboards.12 the dashboards summarize overall influenza activity and surveillance capacity in the region by bringing together laboratory and epidemiological data; national surveillance system information; and data on human infections with avian influenza viruses a(h5n1), a(h5n6) and a(h7n9) notified under the international health regulations (ihr) (fig. 1). the site is publicly accessible, allowing communication with various audiences at the national, regional and global levels. disseminating these data supports risk assessments, thereby narrowing the gap between surveillance and public health action. to develop the dashboards, a proof of concept prototype using simulated data and designed with tableau 9.0 (tableau software, seattle, washington) was shared for feedback with potential stakeholders through an online questionnaire and discussions at a regional influenza forum in august 2015. revisions were made accordingly and a single data request was sent to countries to gather national surveillance system information and epidemiological data for inclusion in who databases. this collaborative effort resulted in a pilot site that was presented to key stakeholders in 2016, before launching publicly. the regional influenza dashboards include individual dashboards that display seasonal and avian influenza data through interactive maps, graphs and tables (fig. 1). surveillance system information is currently provided for 35 countries and areas, virological data for 15 countries and areas and epidemiological data for 28 countries and areas. basic epidemiological data on human infections with avian influenza a(h5n1), a(h5n6) and a(h7n9) viruses are also displayed. the platform facilitates creation of graphics that can be tailored to meet specific needs and downloaded directly. for example, users can compare measures of seasonal influenza activity, including counts of influenza-like illness or severe acute respiratory infection cases, number of deaths and number of positive virological specimens between different time periods within the same country or between different countries within the region. additionally, users can map human infections with avian influenza viruses at the provincial level for specified time periods to visualize the spread of infections over time. links directing users to national surveillance information and an archive of biweekly regional reports are also available. still in the early stages of production, the dashboards have some limitations. tableau software is compatible with newer versions of web browsers so computers running older versions, such as internet explorer 8, 9 and 10, may not display the dashboards. due to differences between countries in reporting frequency, surveillance methodology, case definitions and continuity of reporting by individual surveillance sites caution must be taken when comparing across years or between countries and areas. sustainability is also a concern in the adoption of new and innovative technologies. however, steps to address this concern have been taken and include the efficient leveraging of existing global and regional databases that link to the dashboards without duplicate data entry by who member states. the western pacific regional influenza dashboards will facilitate the use of a growing amount of virological and epidemiological surveillance data as a basis for public health action. not only do they present regional data, but they also support countries with limited capacity to maintain national reporting platforms. by linking different information sources, they support a regional system that can serve as an operational hub to inform risk assessment and decision-making. in the face of a pandemic, regional dashboards could provide both baseline and real-time surveillance information for risk assessment. moving forward, it will be useful to incorporate animal sector data and information from vaccination surveys such as the who-unicef joint reporting form to bring together disparate information sources in a single platform for better informed regional risk assessments. regional monitoring and assessment of other priority diseases could be enhanced by developing similar dashboards. in the future, linkages between focused disease-specific platforms could yield comprehensive overviews of national and regional public health. click to download figure 1. jpg, 736kb conflicts of interest none. funding this manuscript was developed as part of the routine work of who staff. acknowledgements we would like to acknowledge the information technology group at the who regional office for the western pacific and who headquarters, in particular, randy gongora, joven larin, and linette te for their ongoing support for this work. additionally, we would like to thank dr takuya yamagishi and other members of the who regional office for the western pacific emerging disease surveillance and response unit for their valuable input. special thanks are due to the national data contributors in the region for their ongoing contributions and support. references heymann d, editor. control of communicable diseases manual, 20th ed. washington, dc: american public health association; 2015. doi:10.2105/ccdm.2745 avian influenza weekly report. manila: who regional office for the western pacific; 2017 (http://www.wpro.who.int/emerging_diseases/avianinfluenza/en/). azziz baumgartner e, dao cn, nasreen s, bhuiyan mu, mah-e-muneer s, al mamun a, et al. seasonality, timing, and climate drivers of influenza activity worldwide. j infect dis. 2012 sep 15;206(6):838-46. pmid:22829641 german rr, lee lm, horan jm, milstein rl, pertowski ca, waller mn, et al. updated guidelines for evaluating public health surveillance systems: recommendations from the guidelines working group. mmwr recomm rep. 2001 jul 27;50(rr-13):1-35; quiz ce1-7. pmid:18634202 polansky ls, outin-blenman s, moen ac. improved global capacity for influenza surveillance. emerg infect dis. 2016 jun;22(6):993-1001. pmid:27192395 doi:10.3201/eid2206.151521 influenza surveillance and monitoring. geneva: world health organization; 2017 (http://www.who.int/influenza/surveillance_monitoring/en/). carroll ln, au ap, detwiler lt, fu tc, painter is, abernethy nf. visualization and analytics tools for infectious disease epidemiology: a systematic review. j biomed inform. 2014 oct;51:287-98. pmid:24747356 doi:10.1016/j.jbi.2014.04.006 flu news europe. copenhagen: who regional office for europe and solna: european centre for disease prevention and control; 2017 (https://flunewseurope.org/). fluview. atlanta: centers for disease control and prevention; 2017 (https://gis.cdc.gov/grasp/fluview/fluportaldashboard.html). paho fluid. washington, dc: who regional office for the americas; 2017 (http://ais.paho.org/phip/viz/flumart2015.asp). asia pacific strategy for emerging diseases and public health emergencies. manila: who regional office for the western pacific and new delhi: who regional office for south-east asia; 2017. influenza situation update [online database]. manila: who regional office for the western pacific; 2017 (http://extranet.wpro.who.int/influenzaupdate/). preparation for mass gathering events from the perspective of a non-host country: the experience of japan during the 2018 pyeongchang olympics and paralympic winter games brief report kazuaki jindai,a takuya yamagishi,a munehisa fukusumi,a shingo nishiki,b yusuke kobayashi,b yusuke matsui,b tamano matsuia and kazunori oishia a infectious disease surveillance center, national institute of infectious diseases, tokyo, japan. b field epidemiology training program, national institute of infectious diseases, tokyo, japan. correspondence to takuya yamagishi (email:tack-8@nih.go.jp). to cite this article: jindai k, yamagishi t, fukusumi m, nishiki s, kobayashi y, matsui y, et al. preparation for mass gathering events from the perspective of a non-host country: the experience of japan during the 2018 pyeongchang olympics and paralympic winter games. western pac surveill response j. 2019 jan;10(1). doi:10.5365/wpsar.2018.9.2.003 the world health organization recommends that countries or organizations that host mass gatherings plan ahead and prepare for possible public health events to ensure a safe environment for local residents, participants and travellers.1 public health events during mass gatherings can also affect non-host countries. there are numerous reports of the spread of infectious diseases by travellers returning from mass gatherings,2 which can potentially pose the risk of an outbreak of new infectious diseases to travellers’ home countries. with more frequent travel across borders, it is prudent that non-host countries prepare for mass gathering events. the 2018 pyeongchang olympic winter games was held in the republic of korea between 9 february and 25 february 2018, followed by the paralympic games between 9 march and 18 march 2018. in both games (hereinafter referred to as the games), nearly 3000 athletes from 92 countries competed in 13 sports. many travellers from japan were expected to visit the games. we conducted ad hoc event-based surveillance and risk assessments of games-related public health events, especially infectious diseases outbreaks, which could affect japanese athletes, travellers and residents in the republic of korea and which could have an influence on japan. we described our methods and the lessons learnt through this project in this report. one person was assigned to conduct event screening during weekdays using official and unofficial information sources (fig. 1). during the games, we identified priority infectious diseases to be monitored, such as diseases commonly seen in the republic of korea (e.g. mumps, hepatitis a and varicella);3 diseases commonly seen in the winter in asia (e.g. gastroenteritis and seasonal influenza); diseases that are prone to cause outbreaks during a mass gathering (e.g. meningococcal disease); and diseases with global public health significance (e.g. animal and human infection with avian influenza virus, measles, rubella and infection with multidrug-resistant bacteria). we screened reports from the media via internet searches using the following pre-specified search terms: infectious disease, food poisoning, infection, zika, ebola, severe fever with thrombocytopenia syndrome, chikungunya, dengue, pathogen, bacteria, virus, drug resistance, influenza, yellow fever, lassa, anthrax, mers, outbreak, hepatitis a, hepatitis, haemorrhagic fever with renal syndrome, mumps, measles, rubella, varicella, typhoid fever, malaria, syphilis, hiv, gonorrhea, meningococcal disease or norovirus infection. fig. 1. algorithm of event-based surveillance and risk assessment of games-related infectious disease events with potential impact on japanese travellers and residents in the republic of korea during the 2018 pyeongchang olympic and paralympic winter games click to download figure 1. jpg, 704kb we referred to the world animal health information system,4 promed,5 the center for infectious disease research and policy6 and weekly reports from the korea centers for disease control and prevention (kcdc)3 to monitor events at the games, using web-based automatic translation if written in the korean language. we also screened weekly reports from the national epidemiological surveillance of infectious disease (nesid) in japan7 to search for indicators of potential disease importation from the republic of korea or disease spread in japan. nesid includes more than 100 notifiable diseases and diseases on its sentinel surveillance system.8 if we discovered pertinent signals, we contacted kcdc for signal verification. after verification, infectious disease surveillance center, japan (idsc) staff and field epidemiology training program (fetp) trainees assessed the likelihood and consequence of further spread of the event that could potentially impact on japanese athletes, travellers, residents of the republic of korea and the public in japan. the staff and trainees also assessed risk perception among japanese nationals and among government officials of japan to the event in the context of the games. if the level of risk was high or very high, idsc communicated with the japanese ministry of health, labour and welfare (mhlw) for further action. the results were also shared with them at least weekly. we continued this activity for seven weeks: one week before, one week after and five weeks during the games. the mean number of signals identified per day was five. the average time required to triage all signals was 20 minutes per day. five public health events underwent further risk assessments. one was a norovirus outbreak reported on 5 march 2018.9 we determined that the risks of this event affecting japanese travellers and residents in the republic of korea as well as spreading to japan were low. there was a low probability that this event that would require an international response, given the low severity of the disease and quick response by the korean government. we also detected additional events of animal infection with avian influenza a(h5n6) virus; however, we considered the impact to be limited as transmission only occurred among poultry and wild birds. these events were shared with mhlw during the routine weekly meetings. we conducted event-based surveillance (ebs) during a mass gathering event from the perspective of a non-host country. the focus was an event or signal that could pose any health risk to japanese travellers and residents in the republic of korea during the games. we also took into consideration the potential risk of such an event being imported to and spread in japan. a wide variety of infectious diseases have been associated with mass gatherings.2 diseases prone to spreading during a mass gathering should be prioritized for monitoring. the severity of diseases, the availability of treatments and public health control measures also need to be considered. the possibility of disease exportation from a non-host country to other countries is less likely in the early stage of a mass gathering event; therefore, we did not assess such risk. instead, we highlighted attending athletes, travellers and residents in the republic of korea. this prioritization process required the knowledge of local context through consultation with kcdc through informal channels. routine kcdc official reports based on existing indicator-based surveillance also provided relevant information and were helpful in understanding the situation. however, some pertinent information for events (e.g. detailed epidemiologic information of affected population) was not readily available from the reports. during the norovirus outbreak, additional detailed reports by kcdc of the outbreak played an important supplementary role in assessing the risk at the local level. the primary concern when starting surveillance and risk assessment of the events associated with mass gathering was the burden on staff and other resources. language barriers can lead to a greater burden on staff resources; however, we were able to reasonably understand information described in korean through web-based automatic translation. one of our findings was that mass media in english language covered the events at the same time or quickly following reports published in the korean media. even if the lack of staff resources prevented close monitoring of korean media, we believed that signals from english language media allowed the timely detection and response to events occurring at the games. another plausible concern for public health sectors in non-host countries is that additional time and resources are needed to implement an ebs system in another country. in this project, however, the ad hoc ebs system was an extension of an existing ebs system and did not result in additional financial and opportunity costs.10 if the host country has an established, organized indicator-based surveillance system and is willing to share information in the system with non-host countries, the burden to the non-host country would be minimal. if an event becomes an extended and serious threat to public health, prompt upscaling of the response is warranted.11 as emphasized in the asia pacific strategy for emerging disease and public health emergencies,12 having surge capacity to expand routine ebs and risk assessment is imperative to respond to an outbreak during large mass gatherings. it seems feasible to apply similar methods during other mass gatherings, although limitations should be considered before planning a similar ebs and risk assessment system. first, successful ebs and risk assessment depend on the infrastructure of the host country and its information-sharing system. second, disease prioritization for ebs and risk assessment during mass gatherings needs the understanding of local disease epidemiology and the context of the host country. third, translations by web-based automatic translation systems can be inaccurate;13 although the information in the media reports in english aligned with the original republic of korea reports. we described our experience in ebs and risk assessment during a mass gathering from the perspective of a non-host country. building in-country ebs, a risk assessment system and establishing lines of communication with host countries before the event are of critical importance for successful preparation. regional networks can help to establish and maintain communication with host countries. our experience could be a meaningful model for non-host countries to prepare and enhance ebs for mass gatherings held in other countries. acknowledgements we thank dr bryan inho kim at kcdc for sharing useful websites for infectious diseases surveillance and reliable domestic media sources in the republic of korea. funding none. conflicts of interest none declared. references public health for mass gatherings: key considerations. geneva: world health organization; 2015 (http://apps.who.int/iris/bitstream/10665/162109/1/who_hse_gcr_2015.5_eng.pdf, accessed 15 march 2018). abubakar i, gautret p, brunette gw, blumberg l, johnson d, poumerol g, et al. global perspectives for prevention of infectious diseases associated with mass gatherings. lancet infect dis. 2012 jan;12(1):66–74. doi:10.1016/s1473-3099(11)70246-8 pmid:22192131 infectious disease statistics system [website]. osong: korea centers for disease control and prevention; 2018 (https://is.cdc.go.kr/dstat/index.jsp, accessed 10 february 2018). weekly disease information, wahis interface. paris: world organisation for animal health; 2018 (http://www.oie.int/wahis_2/public/wahid.php/diseaseinformation/wi, accessed 10 january 2019). promed [website]. brookline, ma: international society for infectious diseases; 2019 (https://www.promedmail.org/, accessed 10 january 2019). center for infectious disease research and policy [website]. minneapolis, mn: university of minnesota; 2019 (http://www.cidrap.umn.edu/, accessed 10 january 2019). infectious disease weekly reports. tokyo: national institute of infectious diseases; 2018 (https://www.niid.go.jp/niid/ja/idwr-dl/2018.html, accessed 12 december 2018). infectious disease surveillance system in japan, 2018. tokyo: national institute of infectious diseases; 2018 (https://www.niid.go.jp/niid/images/epi/nesid/nesid_en.pdf, accessed 12 december 2018). progress of the norovirus outbreak in the pyeongchang olympic site. osong: korea centers for disease control and prevention; 2018 (http://www.cdc.go.kr/cdc/eng/info/cdckpress.jsp?menuids=home002-mnu0576-mnu0586&fid=8652&q_type=&q_value=&cid=78462&pagenum=1, accessed 17 december 2018). thackway s, churches t, fizzell j, muscatello d, armstrong p. should cities hosting mass gatherings invest in public health surveillance and planning? reflections from a decade of mass gatherings in sydney, australia. bmc public health. 2009 sep 8;9(1):324. doi:10.1186/1471-2458-9-324 pmid:19735577 takla a, velasco e, benzler j. the fifa women’s world cup in germany 2011–a practical example for tailoring an event-specific enhanced infectious disease surveillance system. bmc public health. 2012 jul 31;12(1):576. doi:10.1186/1471-2458-12-576 pmid:22849632 asia pacific strategy for emerging diseases and public health emergencies (apsed iii). manila: who regional office for the western pacific; 2017 (http://iris.wpro.who.int/handle/10665.1/13654, accessed 31 march 2018). patil s, davies p. use of google translate in medical communication: evaluation of accuracy. bmj. 2014 dec 15;349:g7392 doi:10.1136/bmj.g7392 pmid:25512386 building the hospital event-based surveillance system in viet nam: a qualitative study to identify potential facilitators and barriers for event reporting original research hien do,a hien t ho,b phu d tran,c dang b nguyen,c satoko otsu,a cindy chiu de vázquez,a,d tan q dang,c quang d tran,c van anh pham,b nanako mikamid and masaya katoe a world health organization viet nam country office, viet nam. b ha noi university of public health, viet nam. c general department of preventive medicine, ministry of health, viet nam. d tohoku university graduate school of medicine, japan. e world health organization regional office for the western pacific, philippines. correspondence to hien do (email: doh@who.int). to cite this article: do h, ho ht, tran pd, nguyen db, otsu s, chiu de vázquez c, et al. building the hospital event-based surveillance system in viet nam: a qualitative study to identify potential facilitators and barriers for event reporting. western pac surveill response j. 2020 sep;11(3). doi:10.5365/wpsar.2019.10.1.009 introduction: hospitals are a key source of information for the early identification of emerging disease outbreaks and acute public health events for risk assessment, decision-making and public health response. the objective of this study was to identify potential facilitators and barriers for event reporting from the curative sector to the preventive medicine sector in viet nam. methods: in 2016, we conducted 18 semi-structured, in-depth interviews, as well as nine focus group discussions, with representatives from the curative and preventive medicine sectors in four provinces. we transcribed the interviews and focus group discussions and used thematic analysis to identify the factors that appeared to affect public health event reporting. results: we identified five major themes. first, the lack of a legal framework to guide reporting meant hospital staff relied on internal procedures that varied from hospital to hospital, which sometimes delayed reporting. second, participants stated the importance of an enabling environment, such as leadership support and having focal points for reporting, to facilitate reporting. third, participants described the potential benefits of reporting, such as support provided during outbreaks and information received about local outbreaks. fourth, some challenges prohibited timely reporting such as not perceiving reporting to be the task of the curative sector and hesitancy to report without laboratory confirmation. finally, limited resources and specialist capacities in remote areas hindered timely detection and reporting of unusual events. discussion: this study identified potential opportunities to promote the detection and reporting of unusual events from health-care workers to the public health sector, and thus to improve the overall health security system in viet nam. under the international health regulations, or ihr (2005), all member states must develop core capacities to detect, assess, report and respond to acute public health events and emergencies.1 for countries in the world health organization (who) south-east asia and western pacific regions, the asia pacific strategy for emerging diseases and public health emergencies (apsed iii) has served as the regional framework for action to guide member states to advance the implementation of the ihr (2005) for health security.2 apsed iii proposes incorporating health-care workers in the surveillance system as a priority for the early detection of public health threats. lessons learnt from previous public health emergencies have highlighted the potential benefits of engaging health-care workers in the event-based surveillance (ebs) system for the rapid and timely detection of emerging diseases and public health emergencies.3–6 apsed iii further emphasizes using multiple sources of information, including event reporting from health-care facilities and laboratories during risk assessment to better inform decision-making.2 in viet nam, the initial ebs system relied on media monitoring, and there was no systematic approach to promote timely reporting of public health events from health-care workers.7 in view of this, there have been plans to expand the ebs system in viet nam. viet nam has a well-established notifiable disease surveillance and reporting system that is known, accepted and implemented by all levels of the health-care system – national, regional, provincial, district and commune levels. the reporting role relies on the curative (medicine) sector, which includes hospitals and other health-care facilities (both public and private), to report directly through an electronic reporting system and in coordination with the preventive medicine sector in their respective level – general department of preventive medicine (gdpm) at the national level, pasteur institute or institute of hygiene and epidemiology at the regional level, provincial preventive medicine centre (ppmc) or provincial centre of disease control (pcdc) at the provincial level, district health/preventive medicine centre (dpmc) at the district level, and commune health station (chs) at the commune level. while the curative sector is in charge of reporting disease and events, the preventive medicine sector is responsible for verification, investigation and response in oordination with the curative sector and other relevant stakeholders. in this study, our overall goal was to gain insights into the current situation of event reporting from the curative sector and response from the preventive medicine sector, to inform broader system strengthening and to further engage health-care workers in the surveillance of public health threats. more specifically, we aimed to identify potential facilitators and barriers for signal detection, timely reporting and rapid response in the event of a public health emergency, which we hope to eventually use as the foundation to design a hospital ebs (hebs) system in viet nam. methods study design from july to december 2016, we conducted semistructured individual interviews and focus group discussions with representatives from the curative and preventive medicine sectors to explore and understand the reporting of “unusual events” from the curative to the preventive medicine sector. we also reviewed documents and archival records as supplemental data. we employed a purposeful sampling strategy for the effective use of resources to allow data extraction from “information-rich cases” to yield “insights and in-depth understanding rather than empirical generalizations” as described by patton in 2002.8 we carried out this study in four provinces: ha noi (capital of viet nam), bac giang (northern viet nam), cao bang ( mountainous, remote area) and binh duong (southern viet nam) (fig. 1). one district was purposively selected for each province to conduct the study based on convenience, their level of cooperation, having had a recent disease outbreak or has the potential to have disease outbreaks. fig 1. participating sites in the qualitative study to identify facilitators and barriers for event reporting from hospitals to the public health system, viet nam, 2016 click to download figure 1. jpg, 107kb participant characteristics we conducted a total of 18 semi-structured, in-depth individual interviews and nine focus group discussions (with a total of 58 participants) (fig. 1). participants recruited in this study included hospital ward and laboratory staff who may detect unusual events for reporting; hospital leadership team members and planning department staff who are also the key decision-makers for determining the reporting process; and leaders and staff receiving reports at the preventive medicine centres (pmcs). we recruited participants from the gdpm (central governmental body in ha noi that oversees all pmcs), one dpmc, three provincial hospitals, four district hospitals and two private hospitals. data collection and analysis informed consent was obtained before conducting the interviews and focus group discussions. three different semi-structured interview guides were developed and used to interview medical doctors, laboratory staff and hospital leadership teams. the focus group guide was developed and used to guide the discussion for provincial/district preventive medicine staff and hospital staff. topics covered included the current reporting practice of unusual events, awareness, attitudes, potential barriers and solutions, and lessons learnt. specific hypothetical scenarios were also used to identify possible actions that health-care workers may take upon detection of an unusual event. in addition, we also reviewed training records, logbooks and reporting forms to supplement interview data. interviews and focus groups were led by experienced qualitative researchers, conducted in vietnamese, and lasted approximately 60–90 minutes each; digital recordings of the sessions were transcribed verbatim for thematic analysis, which was performed in the nvivo 8.0 software (qsr international, melbourne, australia). we conducted the data analysis simultaneously with data collection and data interpretation, which was iterative throughout the research process. we first used open coding to inductively classify data into initial categories or themes, which was then followed by axial coding to examine the data for regularities and variations within and between themes.9 the research team also met several times to discuss the key themes for verification and deepening the analysis of the results. ethical approval for this study this study has been reviewed and approved by the institutional ethical review board of ha noi university of public health in 2016. results five main themes emerged during the focus group discussions and in-depth interviews (table 1). table 1. summary of key findings – the current situation for reporting “unusual events” from hospitals, viet nam, 2016 click to download table 1. jpg, 349kb theme 1 – legal framework and standard operating procedures may play an important role in guiding reporting and response. hospital staff reported the lack of a legal framework and standard operating procedures (sops) as challenges that hinder event reporting. at the time of the study, no legal framework or national guidelines on ebs in viet nam existed. although some institutions have their own internal reporting procedure, many do not. some participants expressed their desire to have a more formalized system in place, as one hospital staff stated: “at present, we haven’t got an official system to enable hospital departments to easily share information with provincial preventive medicine centres. so i think we should have a system in the future. i support this idea.” furthermore, no legal process is in place to mandate reporting. in non-residential industrial zones where there are only enterprises, manufacturers and companies producing industrial products and services, some companies reportedly tried to hide disease outbreaks among their employees due to the potential economic impact. respondents reported that companies do not see it as their responsibility to report to the health authority, as explained by one pmc staff: “the department of health at the provincial level needs to inform all companies to report infectious diseases to them. they need to inform our disease control department. they might hide an unusual outbreak [or] ignore it because they are afraid the media will announce the disease. we only [know] after they bring their family member to the hospital for treatment.” theme 2 – an enabling environment is necessary for timely reporting and response. hospital staff described several factors in their work environment that promote timely reporting. supportive leadership. in hospitals with supportive leadership who believed in the value of reporting, timely reporting was not an issue. however, in hospitals with strict hierarchal reporting structures, staff may be punished, as one doctor explained: "in case i report to the planning department without informing our head of department, the hospital director might ask, ‘oh, what happened, does the head of the department know?’, and if he didn’t know, i am in trouble.” availability of internal procedures to guide reporting. limited guidance regarding the reporting process can create confusion among hospital staff. in hospitals with internal procedures, reporting was better implemented, as one doctor described: “if i find an unusual case, first, we will discuss within our department. then, i will report to the head of our department to confirm the case is unusual and requires further reporting. if it is, we will report to the leader who is in charge of that shift, or report to the planning department so that they can inform systematically.” good personal relationships between hospitals and pmcs. in provinces where there were good personal relationships between hospitals and pmcs, we saw enhanced crosstalk and event reporting. as one pmc staff explained: “the hospital often calls me if there is something unusual, no matter if it’s during or after working hours. they call me often; it is not under any system yet. … if something happens, we have to get a sample, so we send a person there straight away to get a sample. then we will investigate the situation, perform tests quickly, and help them as soon as possible. after investigating at the hospital, we have to investigate the community as well.” assigned focal points at hospitals and pmcs to facilitate rapid information exchange. one key factor of success for prompt notification of unusual events has been assigning focal points at hospitals and pmcs. as one hospital staff mentioned: “one person at pmc is assigned to take care of each hospital or area. this is one favourable factor. they have an administrative landline and mobile to contact when they need. it’s important to have the responsible person to inform. we can report to the leader later. it’s quicker to inform the preventive medicine sector.” theme 3 – potential benefits exist for the curative sector to work with the preventive medicine sector. hospital staff reported several potential benefits or factors that could prompt them or encourage them to report unusual events and work with the preventive medicine sector. outbreak response and containment. one incentive to work with the preventive medicine sector is the support provided by pmcs during outbreaks. by informing pmcs of suspected outbreaks, hospitals are more likely to experience a timely response and outbreak containment, reducing the burden on hospitals. as one doctor explained: “it is necessary to have prompt and quick actions to facilitate timely medical consultation and exams for more effective treatments. this would help the occurrence of outbreaks that we could prevent. we can then have a prompt response when an outbreak occurs.” knowledge of the local outbreak situation can increase doctors’ awareness and improve diagnosis, treatment and care. knowing the epidemiological situation may help doctors in their clinical practice; however, reporting is often unidirectional, with no or limited feedback received after reporting. the same doctor summed up the reporting direction with pmc in one sentence: “we only report to them; we do not receive feedback from them.” laboratory confirmation by the preventive medicine network. some doctors noted that confirmatory laboratory results help with diagnosis and treatment, and provide external feedback to hone clinical skills. since hospital laboratory capacities are limited, clinicians benefit from pmc-facilitated laboratory testing through their laboratory network. one doctor explained: “we are clinical doctors; we want to have experience in diagnosis and treatment. we want to know how accurate our diagnoses are.” however, laboratory testing in the preventive medicine sector is mainly for surveillance purposes. for diagnostic testing, long delays in receiving results preclude their use in patient diagnosis or treatment. another doctor said: “the preventive medicine centre delays the release of test results. i don’t know the reasons why, but they provide results so late that the patients have already been discharged. as a treating doctor, it’s difficult to treat a patient without having a confirmatory diagnosis.” theme 4 – health-care providers face multiple challenges to timely reporting. hospital staff reported several challenges that prohibited timely event reporting from the curative sector. reporting is not perceived to be the responsibility of hospital staff. many doctors believe their focus should be on treatment and do not perceive reporting to be the task of the curative sector. some doctors also think they are too busy to do reporting and are not familiar with reporting tasks. one doctor summed it up: “it’s more appropriate to ask the preventive medicine sector to do reports.” hospital staff do not see the value of reporting. many doctors do not see the value or importance of reporting and how it can benefit them. therefore, they do not prioritize the task of reporting. one doctor explained: “we have to do all different things; we don’t report straight away if we have too many things.” no guidance or formal mechanisms in place. in the absence of national guidance and formal mechanisms, some hospitals have opted to have their own internal reporting procedure. this may require first getting approval by the department of planning before reporting to the preventive sector, which can delay timely reporting of an unusual event. as one hospital staff described: “we collect cases every day and report to the hospital leaders before 7 pm. at the department level, we need to make a weekly report to send to the planning department; the planning department is in charge of sending it to the provincial department of health and the preventive medicine centre. they also check if the report is correct.” hesitancy to report unless laboratory confirmation is available. many doctors have a fear of being wrong or judged if a reported case turned out to be “not unusual”. consequently, many doctors only want to report when laboratory confirmation is available. as one doctor explained: “if later, after we’ve reported, the department of health finds out that the disease is just a normal or a common case, we are afraid that they will turn around and ask us why we could not diagnose an easy case.” theme 5 – extra challenges exist for signal detection and reporting from remote areas and industrial zones. hospital and pmc staff reported additional difficulties in remote areas. limited resources and experience. in remote areas, some clinicians found it difficult to recognize uncommon diseases. there is also a lack of local laboratory facilities; thus, treatment decisions were based solely on clinical judgment. for example, a hospital staff described a case of a patient with coxsackie virus infection in a remote area who was neither referred to the infectious diseases department nor reported. “the patient was only 4 months old. the patient had respiratory distress, so it was very hard to categorize. the treatment department said that the patient should be in the neurology department; it doesn’t matter if he has an infectious disease or not. we still face difficulties in categorizing patients, so we did not report.” another hospital staff reported a cluster of children with pertussis that was misdiagnosed as leukaemia given their unfamiliarity with the condition. “there were several kids with the same cough and tests. at that time, i didn’t know what pertussis was like. … we didn’t think of pertussis because we haven’t seen [cases] for a very long time, so it’s very sudden. ... i didn’t know what to do. i explained to their families that it could be leukaemia, so we sent them to the provincial general hospital. the hospital did the same thing and sent them to the national hematology and blood transfusion hospital in ha noi. the doctors in the hospital witnessed the cough after two days; they thought it could be pertussis and treated the patient for pertussis. after that we had more and more similar patients coming.” differences in language and culture. other issues such as distance, language barriers and cultural barriers can also hinder early detection and timely reporting. one pmc staff mentioned the need to use law enforcement at times to “force” people who resisted medical care due to cultural reasons to go seek health care. “we have to use law enforcement and follow the law of infectious diseases. the community did special things for the people who died, so people cannot go inside the houses during the three days after death. no one was allowed to go in. they would say, ‘this is my child, not yours, [and] even if they die, i can just give birth again.’ it’s complicated. so for our people’s health, we have to be strong, determined and do law enforcement. sometimes we even had to ask [the] police to help in forcing them to go to the hospital for treatment.” discussion we found that hospital and laboratory staff were generally aware of what constituted an “unusual event”. our study further identified facilitators and barriers to timely reporting. close relationships between hospitals and pmcs facilitated timely reporting and rapid public health response. in addition, instituting focal points at the hospitals and pmcs further clarified roles and responsibilities and facilitated the reporting process. key issues that hindered early detection and timely reporting included clinicians not considering reporting as their role; uncertainty regarding the reporting process; a lengthy approval process for reporting in some hospitals; hesitancy to report before confirmatory diagnostic testing; and challenge in recognizing clusters within the hospital. the one-way reporting process with minimal feedback from the preventive medicine sector also discouraged reporting. fostering a “win-win” relationship between health-care and public health systems a common theme seen in this study and previous studies in other contexts was the need to strengthen the relationship between the curative and preventive medicine sectors to ensure two-way communication.3 although most studies investigating different ways to motivate reporting were for routine reporting through the indicator-based surveillance (ibs) system, we believe it is also applicable to reporting rare and unusual events through the ebs system. to facilitate reporting from health-care workers to the public health system, health-care workers also need tangible benefits of working with the public health system. in other words, it is important to foster a “win-win” relationship between health care and public health systems. some study participants believed that information on national and local outbreaks would help their ability to diagnose and treat their patients. previous studies have recommended generating a feedback report and ensuring they reach reporters, so they see the value in reporting.10–12 other studies have shown that tailoring feedback to focus on the current outbreaks and other information of interest to medical staff can also encourage reporting.13 we also believe this may be an important approach that promotes ownership. laboratory services at pmcs may also help physicians at health-care facilities with their clinical practice in the diagnosis of infectious diseases. we did note that depending on the province, some laboratory services in the preventive medicine sector were not able to fulfil the physicians’ expectations. we believe streamlining preventive medicine laboratory services could contribute to the strengthening of the working relationship of the health-care and public health systems, and thus, in turn, promote the early detection of outbreaks and public health events. raising awareness on the value of reporting many medical professionals in our study did not perceive that reporting events was their responsibility. in addition, they were not fully aware of what, how and when to report, as we have seen in other countries.3,10,11,14 passive attitudes, lack of knowledge regarding reporting requirements and misconceptions regarding the value of reporting seen in our study have been previously observed.3,10,11,14,15 certain beliefs, knowledge and attitudes held by physicians, such as the ones we saw in our study, are associated with underreporting.15 these findings point to the need to raise awareness of the value of reporting among medical staff. for some medical professionals, it may be difficult to recognize the importance of a rare event. one possible strategy is to present scenarios and lessons learnt from past outbreaks such as the 2015 middle east respiratory syndrome outbreak in the republic of korea, which dampened economic growth and impacted the reputation of some hospitals. describing the role of medical professionals in these past outbreaks may help providers embrace their unique position as the guardians at the first line of defence.16,17 a previous study has also suggested the use of financial incentives or a penalty system to encourage reporting.11 different approaches to motivate reporting among medical staff, specifically in viet nam, may need to be explored. with a longer vision in mind, a strong sense of ownership and expanded responsibility of their role as reporters may need to be cultivated during the training and sensitization process. creating an enabling environment for reporting although raising awareness among medical staff may increase their motivation to report, individual motivation depends on an enabling environment that facilitates reporting. in this study, participants expressed a lack of knowledge of the reporting process. study participants also revealed that the reporting process could be lengthy, given the layers of approval required at many hospitals. hospitals that empower their staff to report immediately to the pmc are the minority. we believe that creating an enabling environment is critical for the success of an ebs system. an enabling environment includes clear guidelines that signate a responsible focal person, describe the roles and responsibilities and lines of reporting, and establish goals and expectations. in addition, staff should be provided with the means needed to report and have leadership support to ensure that the responsible person has protected time allocated for reporting activities. finally, training of new staff and regular re-training of existing staff may be an important way to continually sensitize the medical staff.18 promoting a simple and flexible reporting process developing a process for event reporting that is appropriate for all 63 provinces in viet nam is challenging, given their differences in resources and workforce capacity. therefore, keeping the system flexible, and having the ability to tailor the system to the capability of each province, may be one of the key factors for success. previous studies have shown that the implicity of the reporting system is one of the most important factors to encourage reporting from clinicians.10,11,13,14 limitations the findings in this study represent only the views of the purposefully selected hospital and preventive medicine staff in four provinces in viet nam; therefore, the generalizability of the findings may be limited. in addition, this was an exploratory study carried out for public health practice, which we focused on obtaining in-depth insights and synthesizing the information from all sources into key themes that were actionable instead of a comparative analysis study. therefore, we did not present on the differences between the provinces, or the responses from key informants who were in different roles or at various levels of the organization. for the same reasons, a certain level of flexibility was required in sample selection; depending on facility size and availability of staff, in rare occasions, focus group discussions also had fewer than five participants. conclusions in this study, we showed that an enabling environment is critical for timely event reporting. this encompasses multiple components such as having leadership support, a good relationship between the two sectors, clear guidance on the process of reporting, and focal points to streamline reporting. however, we believe the fundamental key to success for both ibs and ebs is cultivating a “win-win” relationship between the curative and preventive medicine sectors, where both sides can see the value and benefits of this synergistic collaboration. moving forward, as outlined in table 2, we believe there are priority actions that can be taken to strengthen this important relationship further and ultimately to improve the overall health security system in viet nam. table 2. proposed key interventions to strengthen hospital event-based surveillance system in viet nam based on the key findings from the qualitative study conducted in 2016 click to download table 2. jpg, 264kb acknowledgements we would like to thank the staff from the participating preventive medicine centres and hospitals for their contribution to this study. we would also like to thank colleagues from respective regional institutes of pasteur/hygiene and epidemiology of the viet nam ministry of health and from the who viet nam country office for assisting with data collection. conflicts of interest the authors have no competing interests or financial conflicts. funding this study was funded by who and the united states agency for international development (usaid). references international health regulations (2005). 3rd ed. geneva: world health organization; 2016. asia pacific strategy for emerging diseases and public health emergencies (apsed iii). advancing implementation of the international health regulations (2005). manila: world health organization regional office for the western pacific; 2017. macdonald e, aavitsland p, bitar d, borgen k. detection of events of public health importance under the international health regulations: a toolkit to improve reporting of unusual events by frontline healthcare workers. bmc public health. 2011 sep 21;11(1):713. doi:10.1186/1471-2458-11-713 pmid:21936937 xu by, low sg, tan rt, vasanwala ff. a case series of atypical presentation of zika virus infection in singapore. bmc infect dis. 2016 17;16(1):681. doi:10.1186/s12879-016-2032-y pmid:27855636 singapore zika study group. outbreak of zika virus infection in singapore: an epidemiological, entomological, virological, and clinical analysis. lancet infect dis. 2017;17(8):813–21. doi:10.1016/s1473-3099(17)30249-9 ohara h. experience and review of sars control in vietnam and china. tropical medicine and health. 2017;32(3):235–40. available from: https://www.jstage.jst.go.jp/article/tmh/32/3/32_3_235/_pdf decision: approving “event-based surveillance (ebs) procedures.” no. 134/qd-dp. hanoi: general department of preventive medicine, viet nam ministry of health; 2014. patton mq. qualitative research and evaluation methods. 3rd ed. thousand oaks (ca): sage publications; 2002. ezzy d. qualitative analysis: practice and innovation. crows nest (nsw): allen and unwin; 2002. konowitz pm, petrossian ga, rose dn. the underreporting of disease and physicians’ knowledge of reporting requirements. public health rep. 1984 jan-feb;99(1):31–5. pmid:6422492 tan hf, yeh cy, chang hw, chang ck, tseng hf. private doctors’ practices, knowledge, and attitude to reporting of communicable diseases: a national survey in taiwan. bmc infect dis. 2009 jan 29;9(1):11. doi:10.1186/1471-2334-9-11 pmid:19178741 dagina r, murhekar m, rosewell a, pavlin bi. event-based surveillance in papua new guinea: strengthening an international health regulations (2005) core capacity. west pac surveill response. 2013 jul 30;4(3):19–25. doi:10.5365/wpsar.2013.4.2.001 pmid:24319609 krause g, ropers g, stark k. notifiable disease surveillance and practicing physicians. emerg infect dis. 2005 mar;11(3):442–5. doi:10.3201/eid1103.040361 pmid:15757561 friedman sm, sommersall la, gardam m, arenovich t. suboptimal reporting of notifiable diseases in canadian emergency departments: a survey of emergency physician knowledge, practices, and perceived barriers. can commun dis rep. 2006 sep 1;32(17):187–98. pmid:16989044 figueiras a, lado e, fernández s, hervada x. influence of physicians’ attitudes on under-notifying infectious diseases: a longitudinal study. public health. 2004 oct;118(7):521–6. doi:10.1016/j.puhe.2003.12.015 pmid:15351226 ki m. 2015 mers outbreak in korea: hospital-to-hospital transmission. epidemiol health. 2015 jul 21;37:e2015033. doi:10.4178/epih/e2015033 pmid:26212508 lee si. costly lessons from the 2015 middle east respiratory syndrome coronavirus outbreak in korea. j prev med public health. 2015 nov;48(6):274–6. doi:10.3961/jpmph.15.064 pmid:26639740 turnberg w, daniell w, duchin j. notifiable infectious disease reporting awareness among physicians and registered nurses in primary care and emergency department settings. am j infect control. 2010 jun;38(5):410–2. doi:10.1016/j.ajic.2009.07.013 pmid:20031271 zika preparedness and response in viet nam perspective dong t nguyen,a hung t do,a huy x le,a nghia t le,a mai q vien,a trieu b nguyen,a lan t phan,b thuong v nguyen,b quang c luong,b hung c phan,b hai t diep,b quang d pham,b thinh v nguyen,b loan kt huynh,b dung ct nguyen,b hang tt pham,b khanh kh ly,b huong nlt tran,b phu d tran,c tan q dang,c hung pham,c long n vu,c anthony mounts,d s arunmozhi balajee,d leisha d nolene a pasteur institute, nha trang, viet nam. b pasteur institute, ho chi minh city, viet nam. c general department of preventive medicine, hanoi, viet nam. d division of global health protection, centers for disease control and prevention, atlanta, ga. e arctic investigation program, division of preparedness and emerging infections, national center for emerging and zoonotic infectious diseases, centers for disease control and prevention, anchorage, ak. correspondence to leisha d nolen (email:xdf8@cdc.gov). to cite this article: nguyen dt, do ht, le hx, le nt, vien mq, nguyen tb, et al. zika preparedness and response in viet nam. western pac surveill response j. 2018 june;9(2). doi:10.5365/wpsar.2018.9.1.002 disclaimer: the findings and conclusions in this article are those of the authors and do not necessarily represent the official positions of the united states centers for disease control and prevention. this article describes viet nam ministry of health's (vmoh) activities to prepare for and respond to the threat zika virus (zikv), including the adaptation of existing surveillance systems to encompass zikv surveillance. on 1 february 2016, the world health organization (who) declared the zika epidemic a public health emergency of international concern (pheic).1 following this declaration, the vmoh developed a national zikv preparedness and response plan that encompassed coordination, prevention, surveillance, care and treatment, communication, logistics and international cooperation. the national emergency operations centre (eoc) at the general department of preventive medicine (gdpm), using global health security agenda (ghsa) resources, served as the nerve centre for these activities. the gdpm, the central public health agency within the vmoh, created the zikv response plan, including training health-care workers to recognize and report zikv infection, strengthening surveillance and building zikv diagnostic testing capacity. the plan was implemented by the four vietnamese regional public health institutes (rphi) that serve as the regional surveillance and laboratory lead for outbreak preparedness and response. a task force comprising epidemiologists, laboratorians, health communications specialists, local government leaders and clinicians was established in each region. teams made up of trainers from the gdpm, the medical services administration, the maternal and child health department, the health communication and education department and international experts from who and the united states centers for disease control and prevention (cdc) were deployed to each region to train clinicians to recognize and report zikv. training included a training-of-trainers component and was followed by a series of cascading workshops to lower administrative levels. three zikv informational trainings were conducted covering all 63 provinces within the country, educating a total of 637 local health-care providers and authorities. additionally, guidance for clinicians regarding early diagnosis, services, and care of pregnant women was developed and disseminated to health-care providers. an existing sentinel surveillance system for the dengue virus was expanded in eight southern provinces to include zikv, as the clinical presentations of the two diseases are very similar. in each province, one existing surveillance hospital site was selected and began screening individuals who met the dengue case definition for zikv, starting 15 february 2016. later, surveillance for zikv was extended to four hospitals in the northern regions, six hospitals in the central coast regions and four hospitals in the central highlands region. all participating sites collected blood and urine samples for zikv testing from inpatients and outpatients who met the dengue case definition. laboratory testing was performed on more than 2000 specimens from the south and central regions between may and august 2016. an additional 221 dengue-negative specimens that were collected by the dengue surveillance system in 2015 were tested for zikv to detect historical infections. two cases of zikv were identified in the contemporaneous blood samples, while none was identified in the historical samples. between may and august 2016, in addition to the two zikv cases identified by the sentinel surveillance system,2 four cases were identified by the who event management system (ems) in travellers who developed symptoms returning home from viet nam.3 in response to these cases, public health workers were deployed to the areas where the six case-patients either lived or travelled to search for other possible cases. intensive mosquito control efforts, including reduction of mosquito breeding grounds, were carried out in these areas. the government of viet nam was able to increase capacity for surveillance and response through its collaborations and partnerships with who, cdc and other organizations and its commitment to the ghsa. ghsa was launched in 2014 as a collaboration between multiple institutions and nations with the aim to improve countries' abilities to respond to public health emergencies.4,5 one of the early ghsa investments in viet nam was the creation of a national eoc in hanoi. the national eoc was able to receive, analyse, interpret and share information in real time with national, regional and international partners during the zikv response. partnerships between vietnamese public health responders and outside organizations, including who and cdc, provided training opportunities for laboratorians and epidemiologists. laboratorians from the four rphis attended a cdc zikv laboratory training workshop in taiwan, china, while on-the-ground epidemiology training was provided by international experts. in addition, resources such as primer/probe sequences and positive control rnas were shared from outside institutions. together, these collaborations and partnerships allowed viet nam to rapidly respond to the zikv threat. the zikv pheic allowed viet nam to test its newly enhanced response system and identify areas that needed to be modified or expanded. several lessons were learnt. first, while the gdpm led surveillance efforts at the national level, the mode of implementation was determined at the regional level. this practice led to variations in surveillance strategies in different regions, making it challenging to relate the data. in future responses, it would be useful to create a unified implementation plan for surveillance that could be consistently applied throughout the country. second, while co-opting an existing surveillance system meant a new surveillance system could be established rapidly, it resulted in the creation of an inadequate response. in this response, the dengue surveillance system was initially used as the base for zikv surveillance. the dengue system was focused on inpatient surveillance. this turned out to be a poor fit for zikv surveillance given that most zikv patients have a mild clinical course. finally, although a system for analysing and visualizing data was available at the national level, surveillance data were recorded and reported manually at the district and regional levels, resulting in a significant delay between data collection and data analysis and reporting. currently the vmoh is working to improve data accessibility by creating data warehouses to integrate data sources and building three additional regional eocs. all eocs will be networked and be able to collect, analyse, display and share data in real time. the networked data warehouses at the eocs will integrate data from notifiable diseases and sentinel surveillance systems, as well as from laboratory and immunization databases. these advances are being supported through the ghsa and by collaborating partners. it is expected that these continued improvements will greatly facilitate future responses to emerging threats in viet nam. references who director-general summarizes the outcome of the emergency committee on zika 2016. geneva: world health organization; 2016 (http://www.who.int/mediacentre/news/statements/2016/emergency-committee-zika-microcephaly/en/). zika virus infection – viet nam. geneva: world health organization; 2016 (http://www.who.int/csr/don/12-april-2016-zika-viet-nam/en/). meltzer e, lustig y, leshem e, levy r, gottesman g, weissmann r, et al. zika virus disease in traveler returning from vietnam to israel. emerg infect dis. 2016;22(8):1521–22. doi:10.3201/eid2208.160480 balajee sa, arthur r, mounts aw. global health security: building capacities for early event detection, epidemiologic workforce, and laboratory response. health secur. 2016 nov/dec;14(6):424–32. doi:10.1089/hs.2015.0062 pmid:27898218 katz r, sorrell em, kornblet sa, fischer je. global health security agenda and the international health regulations: moving forward. biosecur bioterror. 2014 sep-oct;12(5):231–8. doi:10.1089/bsp.2014.0038 pmid:25254911 https://ojs.wpro.who.int/ 1wpsar vol 11, no 3, 2020 | doi: 10.5365/wpsar.2019.10.4.003 lesson from the field a university of sydney, concord repatriation general hospital, department of gastroenterology and liver services, concord, new south wales 2139, australia. b victorian infectious diseases reference laboratory, royal melbourne hospital, the peter doherty institute for infection and immunity, victoria, australia. c ministry of health and medical services, bikenibeu, tarawa, kiribati. d university of new south wales, sydney, new south wales, australia. e hepatitis b free, sydney, new south wales, australia. f baylor college of medicine, departments of internal medicine, pediatrics, space medicine and global initiatives, houston, texas, united states of america published: 30 sep 2020 doi: 10.5365/wpsar.2019.10.4.003 problem: over 290 million people worldwide suffer from chronic hepatitis b (chb), with the highest prevalence in the pacific islands. mortality attributable to this disease exceeds that from hiv, tuberculosis and malaria combined in this region. context: chb is a major health problem in the pacific island nation of kiribati. medical care is complicated by vast expanses of ocean separating population centres in its constituent islands. birth-dose hepatitis b immunization rates need improvement. high rates of obesity, metabolic syndrome, and co-infection with hepatitis b and hepatitis d in kiribati make treatment less effective. staff allocation, training and retention are difficult. limited infrastructure creates challenges in training, communications, laboratory testing and record-keeping. action: we have established a chb treatment programme in kiribati based on world health organization (who) guidelines and local needs. it includes direct patient care; laboratory, radiology and pharmacy support; public education; training; and data management. thousands of individuals have been screened, and 845 hepatitis b-positive patients have had blood sent to australia for molecular testing. patient education pamphlets, medical training programmes and treatment protocols have been developed. seventy-nine patients have started treatment. regular onsite visits by technical experts are scheduled throughout the year. lessons learnt and discussion: this is the first national chb treatment programme established in the pacific islands region. unique challenges exist in kiribati, as they do in each nation affected by chb. close engagement with local partners, knowledge of the barriers involved, flexibility, advocacy, and support from who and volunteer technical experts are key attributes of a successful treatment programme. c hronic hepatitis b (chb) is one of the leading causes of morbidity and mortality in the world. an estimated 2 billion people globally have been infected with hepatitis b sometime during their lives, and almost 300 million people suffer from chb.1 nearly 900 000 chronically infected patients die each year, mainly due to liver failure, complications of cirrhosis such as variceal bleeding, and hepatocellular carcinoma.2 a strategy to eliminate viral hepatitis as a public health threat by 2030 was adopted by the world health assembly in 2016.3 lowand middle-income countries (lmics) face a particularly daunting task and are unlikely to reach this goal without significant effort, support and funding. highly effective antiviral treatment for chb has been available for over 20 years, but it remains inaccessible in most resource-poor areas. barriers include the high cost of drugs, the need for lifelong therapy in most patients (unlike hepatitis c therapy), the lack of infrastructure such as laboratory facilities, and a dearth of trained medical personnel. furthermore, hiv, malaria and tuberculosis (tb) programmes compete for available resources, both global and domestic. pacific island nations have among the highest prevalence of hepatitis b infection in the world, in some places in excess of 20%.4 the human suffering and economic costs associated with this disease are considerable and often underestimated. one of the first chb treatment programmes in the pacific islands was facilitated beginning in 2018 through a collaboration among the kiribati ministry of health and medical services (mhms), the world health organization (who), the victorian infectious disease reference laboratory (vidrl), and hepatitis b free (an australian nongovernmental organization, known a programme to treat chronic hepatitis b in kiribati: progress and challenges alice u. lee,a,e kathy jackson,b rosemary tekoaua,c caroline lee,d,e margaret sue huntley,e david c. hilmersf correspondence to david c. hilmers (email: dhilmers@bcm.edu) wpsar vol 11, no 3, 2020 | doi: 10.5365/wpsar.2019.10.4.003 https://ojs.wpro.who.int/2 lee et alkiribati hepatitis b treatment programme hepatitis b care through prevention, public education and advocacy initiatives; health-care worker training; and test-and-treat programmes in underserved communities. vidrl is a public health and reference laboratory in melbourne, australia, that provides molecular diagnostic testing and local laboratory systems support. it holds the designation of a who collaborating centre for viral hepatitis and is the regional reference laboratory for hepatitis b and d. a memorandum of understanding to begin a treatment programme was signed by mhms, tch and hbf in 2017. using experience gained from the development of chb programmes in other countries, hbf developed a treatment protocol, and donations to provide medications were secured. shortly thereafter, an import license was issued, and the antiviral medication tenofovir disoproxil fumarate (tdf) arrived in country. in january 2018, the first cohort of patients was examined and assessed for treatment eligibility, and staff were trained. in march 2018, the first patients began treatment. within one year, 79 patients in kiribati were receiving tdf, and hepatitis b and d viral load testing was performed on over 800 chb-positive individuals. treatment protocols in kiribati are based on who guidelines.9 a culturally appropriate booklet that outlines the causes, complications, transmission and treatment of hepatitis b was developed jointly with health-care workers and is given to patients. all patients identified as hbsag-positive are invited for further assessment at tch. a history and physical examination are followed by laboratory testing, ultrasound evaluation and transient elastography. the latter is facilitated through equipment hand-carried by hbf volunteers during regular visits. blood samples are batched for shipment to vidrl for molecular diagnostics. patients with cirrhosis are prioritized for treatment, following identification by laboratory testing, a history and a physical exam (jaundice, variceal bleeding, encephalopathy), and transient elastography >11.0 kpa, or ultrasound. other priority groups include older patients with elevated alanine aminotransferase (alt) and high viral load, patients with a strong family of liver cancer, and health-care workers. treatment candidates are counselled on their suitability for therapy versus monitoring. those qualifying as hbf) and its partners, with the support of australian aid. we describe the progress made and the barriers encountered and addressed, and conclude that successful chb treatment programmes in pacific island countries, such as kiribati, are challenging but achievable. local context kiribati is a pacific island nation of 116 000 people stretching across 3000 km of ocean approximately halfway between australia and hawaii. distances between its islands make accessibility to services challenging. half of the population lives on the island of south tarawa. the lack of both arable land and dietary diversity result in high rates of diabetes, hypertension and obesity.5 in kiribati, free health care is provided by mhms. however, there is a shortage of health-care professionals, with fewer than 0.4 physicians per 1000 population, most of whom practise in south tarawa.6 tungaru central hospital (tch) on south tarawa is the central referral facility. health centres in the outer islands, staffed by nurses who receive additional training, offer primary care, midwifery services and medications. these services are supplemented by outreach clinics from tch. traditional medicine is also used, with practitioners providing local remedies and midwifery.7 hospital laboratories performed over 10 000 hepatitis b surface antigen (hbsag) tests per year between 2012 and 2014, with a seropositivity rate of 14–15%.7 nearly half of hbsag-positive patients in kiribati also have detectable hepatitis d virus (hdv) co-infection, which is problematic as co-infected patients are at higher risk for rapid progression to liver failure and have a poor response to antiviral therapy.8 action in kiribati, alarmingly high rates of chb motivated the inclusion of antiviral treatment into a national hepatitis strategy. based on an assessment by the who regional office for the western pacific, mhms, with assistance from hbf and vidrl, began developing a treatment programme. hbf is composed of volunteer health professionals and non-medical personnel who have worked in the pacific and asia since 2013. it has addressed gaps in wpsar vol 11, no 3, 2020 | doi: 10.5365/wpsar.2019.10.4.003https://ojs.wpro.who.int/ 3 kiribati hepatitis b treatment programmelee et al for treatment are asked to sign an informed-consent document and an agreement that states their intention to comply with the programme requirements. generally, patients are given a 30-day supply of tdf at a time for the first several months of treatment. however, factors that affect adherence such as remote location, family hardship, age or physical disability may require dispensing several months’ worth of medication at once. followup visits with laboratory and radiographic monitoring are scheduled according to who guidelines.9 the baseline characteristics of patients on treatment in kiribati are shown in table 1. of note is male predominance (over two thirds), obesity (median body mass index of 31.2), elevated liver enzymes, high rates of co-infection with hdv (46.3%), and a preponderance of patients with cirrhosis, 56 (70.9%), by transient elastography. programme challenges initial successes have been tempered by several challenges, notably staff shortages. high health worker turnover disrupts programme continuity and necessitates frequent retraining. there is a paucity of medical staff, and most doctors are required to attend to multiple duties, which places them under great pressure at work. regular visits by hbf volunteers are required to support the programme, but entry is difficult due to infrequent and expensive air service. as local medical staff also work on remote islands, attendance during training visits is not always possible. limited internet bandwidth has impacted training via teleconference. although over 800 patients have had viral load testing, many have yet to be evaluated in a clinic. patient recall is difficult due to staff and clinic limitations, and many patients lack a mailing address. patients living on the outer islands must journey by boat to attend clinics at tch and may lack accommodations. radio and social media are often used to disseminate clinic schedules and appointments due to lack of other forms of communication, contributing to inconsistent attendance and difficulty maintaining confidentiality. patient non-adherence with clinic visits is common. local physicians note that patients will sometimes stop long-term medications due to family pressures, consultations with local traditional healers or lack of confidence in the local health system. high rates of obesity complicate patient treatment. fibrosis from metabolic syndrome and the hepatitis b virus (hbv) mono-infection or hbv/hdv co-infection constitute synergistic risks for the progression of liver disease. dietary change is difficult given a dearth of arable land, low per capita income10 and a lack of healthy food choices. recent availability of a hepatitis b cartridge for the genexpert (cepheid, sunnyvale, california, united states of america) machine has made routine access to viral load testing possible, but this has not been introduced in kiribati. tch has such technology for hiv and tb testing, but consumable costs, trained personnel, the need for safe disposal and allocated machine time to perform hepatitis b testing are problematic. medical documentation is challenging. records for patients on tdf must be compiled from several different sources, including paper-based clinic records, laboratory results from kiribati and vidrl, and pharmacies. overburdening of local staff and competing priorities delay data entry, making programme oversight challenging. lessons learnt and interventions sensitivity to the local context has resulted in changes in programme strategies. a volunteer gastroenterologist and project manager from hbf have been designated as coordinators to help provide continuity in the programme. they make regular visits (two to three times a year) that have been extended to a week or more to permit additional training time and visits to outlying islands. weekly or biweekly teleconferences are scheduled so that they do not disrupt local clinical requirements. a local programme coordinator has been hired to provide physician support and to ensure patients are scheduled at times convenient for them, with appropriate follow-up. nutritional interventions and educational pamphlets have been developed and distributed to address misconceptions about hepatitis and lessen the stigma associated with it. the provision of laboratory testing (hdv antibody and both hbv and hdv viral load) by vidrl is a temporary fix, so there is a focus on laboratory capacity-building, training and skills transfer. input from local medical personnel has guided the development of data management tools, such as clinical spreadsheets, that greatly improve the efficiency of patient encounters, are much simpler to learn, and minimize the time required to maintain and analyse data. wpsar vol 11, no 3, 2020 | doi: 10.5365/wpsar.2019.10.4.003 https://ojs.wpro.who.int/4 lee et alkiribati hepatitis b treatment programme above, each of which is being actively addressed. remaining cognizant of the local needs, we are optimistic for an acceleration in patient recruitment and treatment. kiribati has embraced the need to finally address chb. there is considerable appetite to establish similar programmes in other pacific island nations. working with vidrl and who, hbf is currently providing medications, laboratory support and training to jump-start pilot treatment programmes in other pacific island countries such as fiji, tonga and vanuatu. discussions are also under way to implement treatment programmes to interrupt maternal-to-child transmission in these countries. lack of infrastructure and training, co-infections, geographic considerations, limited public knowledge and social norms create problems that are likely shared in other lowand middle-income settings, particularly small islands. nevertheless, there is no one-size-fits-all solution for every country. treatment programme development has required patience, close engagement with local partners, cultural sensitivities, a significant time investment and attention to the needs of the population served. programme administrators need to “get their hands dirty” and observe first-hand the work being done on the front lines. with innovative strategies to deliver services, testing and effective treatment of chb can be provided to lmics such as kiribati. references 1. razavi-shearer d, gamkrelidze i, nguyen mh, chen d-s, van damme p, abbas z, et al.; polaris observatory collaborators. global prevalence, treatment, and prevention of hepatitis b virus infection in 2016: a modelling study. lancet gastroenterol hepatol. 2018 jun;3(6):383–403. doi:10.1016/s2468-1253(18)30056-6 pmid:29599078 2. global hepatitis report, 2017. geneva: world health organization; 2017. available from: https://www.who.int/hepatitis/publications/ global-hepatitis-report2017/en/, accessed 15 march 2019. 3. global health sector strategy on viral hepatitis 2016–2021. towards ending viral hepatitis. geneva: world health organization; 2016. available from: https://www.who.int/hepatitis/strategy2016-2021/ ghss-hep/en/, accessed 15 march 2019. 4. wilson n, ruff ta, rana bj, leydon j, locarnini s. the effectiveness of the infant hepatitis b immunisation program in fiji, kiribati, tonga and vanuatu. vaccine. 2000 jul 1;18(26):3059–66. doi:10.1016/s0264-410x(00)00080-3 pmid:10825610 5. mciver l, woodward a, davies s, tibwe t, iddings s. assessment of the health impacts of climate change in kiribati. int j environ res public health. 2014 may 14;11(5):5224–40. doi:10.3390/ ijerph110505224 pmid:24830452 6. unaids country data. 2017. available from: https://www.unaids. org/en/regionscountries/countries/papuanewguinea, accessed 15 march 2020. co-infection with hepatitis b and d remains a significant problem since there is not yet an effective treatment. currently, interferon is the only recommended therapy, but it is not practical to use in this setting. there are promising new drugs on the horizon, but they are still undergoing clinical trials.11 prevention is by far the best strategy to prevent the co-infection with hepatitis b and d. to this end, birth-dose hepatitis b immunization is being prioritized, and a new national plan to treat expectant mothers who have chb and high viral loads has been approved. the latter strategy has been found to be effective in the prevention of mother-to-child transmission of hepatitis b in other settings.12 given the resource limitations of the country, funding to support this programme to reduce the rate of vertical transmission was sought and has been secured. discussion hepatitis b causes considerable morbidity, mortality and economic loss in the pacific islands. although there is not a cure, its effects can be ameliorated by the implementation of proven prevention strategies and national treatment programmes using effective antiviral therapy for those already infected. in the short time since implementation of the treatment programme in kiribati, patients who remain adherent to therapy have reported an overall improvement in well-being. progress has been made but has been hampered by the problems described † apri (ast to platelet ratio index) score = [(ast/uln ast) × 100]/platlets (109/l)] ‡ fib4 (fibrosis-4) score = (age x ast)/(platelets (109/l) x (sqrt (alt)) table 1. characteristics of patients on hbv antiviral treatment in kiribati, 2018–2019 number of people on treatment 79 age in years, median (range) 36.2 (22–58) sex, number (%) 54 (68.3%) male 25 (31.7%) female bmi, mean (standard deviation) 31.2 (± 5.9) transient elastography (kpa), median (range) 15.2 (4.8–74.8) apri score,† median (range) 2.58 (0.18–33.1) fib4 score,‡ median (range) 3.22 (0.22–29.53) ast (u/l), median (range) 61.5 (3–1934) hbv viral load (iu/ml) in patients tested, median (range) 366 (15–3.25 × 10⁸) proportion hbsag-positive with detectable hdv rna (%) 46.3% wpsar vol 11, no 3, 2020 | doi: 10.5365/wpsar.2019.10.4.003https://ojs.wpro.who.int/ 5 kiribati hepatitis b treatment programmelee et al 10. world bank. gdp per capita kiribati (current us dollars). available from: https://data.worldbank.org/indicator/ny.gdp.pcap. cd?locations=ki, accessed 26 april 2020. 11. yurdaydin c. new treatment options for delta virus: is a cure in sight? j viral hepat. 2019 jun;26(6):618–26. epub ahead of print doi:10.1111/jvh.13081 pmid:30771261 12. lin y, liu y, ding g, touqui l, wang w, xu n, et al. efficacy of tenofovir in preventing perinatal transmission of hbv infection in pregnant women with high viral loads. sci rep. 2018 oct 19;8(1):15514. doi:10.1038/s41598-018-33833-w pmid:30341345 7. who viral hepatitis situation and response in kiribati. available from: apps.who.int/iris/rest/bitstreams/1147878/retrieve, accessed 18 march 2019. 8. krause a, haberkorn u, mier w. strategies for the treatment of hbv/ hdv. eur j pharmacol. 2018 aug 15;833:379–91. doi:10.1016/j. ejphar.2018.06.030 pmid:29935174 9. guidelines for the prevention, care and treatment of persons with chronic hepatitis b infection. geneva: world health organization; 2015 mar. pubmed pmid: 26225396 an outbreak investigation of paediatric severe acute respiratory infections requiring admission to intensive care units – fiji, may 2016 outbreak investigation report julie collins,abc viema biaukula,d daniel faktaufon,e james flint,ac sam fullman,e katri jalava,cf jimaima kailawadoko,e angela merianos,d eric nilles,d katrina roper,bc meru sheelbcg and mike kamae a hunter new england population health, wallsend, australia. b national centre for epidemiology and population health, australian national university, canberra, australia. c deployed by the global outbreak alert and response network (goarn), world health organization, geneva, switzerland. d division of pacific technical support, world health organization, suva, fiji. e fiji centre for communicable disease control, ministry of health and medical services, suva, fiji. f university of helsinki, helsinki, finland. g national centre for immunisation research and surveillance, westmead, australia. correspondence to julie collins (email: julie.collins@hnehealth.nsw.gov.au). to cite this article: collins j, biaukula v, faktaufon d, flint j, fullman s, jalava k, et al. an outbreak investigation of paediatric severe acute respiratory infections requiring admission to intensive care units – fiji, may 2016. western pac surveill response j. 2018 june;9(2). doi:10.5365/wpsar.2017.8.4.009 abstract introduction: influenza-associated severe acute respiratory infections (sari) are a major contributor to global morbidity and mortality. in response to a cluster of sari cases and deaths in pregnant women, with two deceased cases testing positive for influenza a(h1n1)pdm09, an investigation was initiated to determine whether there was an increase of paediatric sari cases admitted to divisional hospital intensive care units in fiji in may 2016 compared to may 2013–2015. methods: retrospective case finding was conducted at the paediatric intensive care units (picus) in fiji's three divisional hospitals. data were collected from 1 january 2013 to 26 may 2016. cases were identified using a list of clinical diagnoses compatible with sari. results: a total of 632 cases of paediatric sari with complete details were identified. the median age of cases was 6 months (interquartile range: 2–14 months). children aged less than 5 years had a higher rate of paediatric sari requiring admission to a divisional hospital picu in may 2016 compared to may 2013–2015 (incidence rate ratio: 1.7 [95% ci: 1.1–2.6]). this increase was not observed in children aged 5–14 years. the case-fatality ratio was not significantly different in 2016 compared to previous years. conclusion: the investigation enabled targeted public health response measures, including enhanced sari surveillance at divisional hospitals and an emergency influenza vaccination campaign in the northern division. introduction influenza-associated severe acute respiratory infections (sari) are a major contributor to global morbidity and mortality, particularly among high-risk groups such as pregnant women and children. in 2008, the world health organization (who) estimated that there were 90 million new cases of seasonal influenza globally and 20 million cases of influenza-associated acute lower respiratory infections in children less than 5 years.1 influenza outbreaks typically occur during winter months in countries with temperate climates. in pacific island countries, influenza outbreaks can occur throughout the year with less seasonal variation.2 influenza vaccination is an effective method for the prevention of influenza infection and subsequent complications.3 who recommends influenza vaccination for pregnant women and children aged 6 months to 5 years to prevent severe disease requiring hospitalization.1 fiji is a tropical archipelago in the south pacific ocean with an estimated population of 865 611.4 national surveillance systems in fiji capture information on influenza-like illness; however, surveillance for sari is limited.5 fiji does not currently have a seasonal influenza vaccination policy; however, vaccination is recommended for high-risk groups including health-care workers, pregnant women, elderly persons and those with chronic illnesses.3 influenza vaccination is not publicly funded under fiji's national immunization programme, yet vaccines may be purchased privately from health-care providers.6 uptake of the influenza vaccine in fiji has previously been reported as low.7 in may 2016, the ministry of health and medical services (mohms) in fiji identified an increase in adult hospital admissions due to severe respiratory infections. in addition, a small cluster of pregnant women developed sari, four of whom died. two of the four deceased cases tested positive for the influenza a(h1n1)pdm09 virus.8 in response to the increased sari activity in adults, an investigation was conducted to determine if there was an increase in paediatric sari cases requiring admission to divisional hospital paediatric intensive care units (picus) in fiji in may 2016 compared to may 2013–2015 and to implement appropriate control measures. the investigation was led by the fiji centre for communicable disease control (fccdc) with support by who. this paper reports the findings of the investigation. methods we conducted retrospective case finding on 26–27 may 2016 at the three divisional hospital picus in fiji: colonial war memorial hospital (covering central and eastern divisions), labasa divisional hospital (northern division) and lautoka divisional hospital (western division). patient registers were reviewed to identify cases clinically compatible with sari. data from january 2013 to may 2016 were collected to ensure sufficient historical data to calculate baseline rates of disease. a case-patient was defined as a child aged 0–14 years admitted to a divisional hospital picu from 1 january 2013 to 26 may 2016 with any of the following diagnoses: pneumonia, severe pneumonia, acute respiratory distress syndrome, influenza, lower respiratory tract infection, upper respiratory tract infection or severe acute respiratory infection. data were collected on patients' date of admission, age, diagnosis and outcome. population data were calculated by applying estimated growth rates to 2007 fiji census data.9 incidence rates were calculated for the month of may by division and paediatric age groups available from the census data (0–4 years, 5–9 years and 10–14 years). incidence rate ratios (irr) and fisher's exact 95% confidence intervals (ci) were calculated to compare incidence rates for may 2016 and may 2013–2015. the frequency and proportion of sari cases were tabulated with a further breakdown of age for children less than 5 years (0–5 months, 6–11 months, 12–23 months, 24–35 months, 36–47 months and 48–59 months) as well as the 5–9 year and 10–14 year age categories. case-fatality ratios (cfrs) were calculated for january–may 2016 and january–may 2013–2015. a fisher's exact two-sided p-value was calculated to compare the 2016 and baseline case-fatality ratios. the month of may 2016 in this paper refers to data collected up to 26 may 2016 (date of the investigation); data were collected and analysed for whole months in prior years. all analyses were conducted using stata 14.1 (statacorp lp, college station, usa) and microsoft excel 2016 (microsoft corporation, redmond, usa). results we identified 632 cases of paediatric sari with complete details requiring admission to divisional hospital picus between january 2013 and may 2016 (fig. 1). the median age of paediatric sari cases during the investigation period (january 2013–may 2016) was 6 months (interquartile range: [iqr] 2–14 months). ninety-three per cent (n = 586) of all cases identified during the investigation were in children aged less than 5 years. moreover, 85% (n = 540) were in children aged less than 2 years. fig. 1 shows the number of cases admitted by month and year of the investigation period. the rate of paediatric sari in children less than 5 years was higher during the month of may 2016 when compared to the same period in 2013–2015 (irr: 1.7 [95% ci: 1.1–2.6]) (table 1). the rate increase in children less than 5 years was not statistically significant when stratified by division (table 1). the cfrs were not significantly different for cases of paediatric sari requiring admission to divisional hospital picus in january–may 2016 (12.5%) compared to the same period in 2013–2015 (9.1%) (p = 0.343). fig. 1. cases of paediatric severe acute respiratory infection (sari) admitted to divisional hospital paediatric intensive care units (picus) by division and month of admission, fiji, january 2013 to may 2016 (n = 632) click to download figure 1. jpg, 687kb table 1. incidence rate per 10 000 population and incidence rate ratio of paediatric sari requiring admission to divisional hospital picus, fiji, may 2016 and may 2013–2015 click to download table 1. jpg, 362kb outbreak response the fccdc established enhanced sari surveillance at divisional hospital picus to ensure continued monitoring. in addition, the fccdc, with support from the who emerging diseases clinical assessment and response network, conducted critical care training with a particular focus on sari for picu staff in august 2016. paediatric sari activity in the central/eastern and western divisions had been increasing in the months before the investigation (fig. 1). however, the increase appeared to be delayed in the northern division, allowing an opportunity to implement preventive measures. in anticipation of an increase in paediatric sari cases in the northern division, the mohms and who division of pacific technical support facilitated a donation of 6000 doses of paediatric influenza vaccine. an emergency influenza vaccination campaign in the northern division was jointly coordinated by the northern division public health team, the fiji expanded programme on immunization (epi) and labasa divisional hospital from july to september 2016. the vaccination campaign targeted children aged 6–12 months and achieved 84% coverage (fiji epi, unpublished data, 2016). discussion we found that children aged less than 5 years experienced a higher rate of sari requiring admission to divisional hospital picus in the month of may 2016 compared to the same month in 2013–2015. the majority of sari cases in the investigation period occurred in children aged less than 2 years (85%), which confirms that this age group is at a high risk of severe influenza-associated respiratory infections.1,10 three months before the outbreak, fiji was struck by one of the strongest tropical cyclones recorded in the southern hemisphere. tropical cyclone winston resulted in 44 deaths and caused severe damage and displacement throughout fiji.11 populations in crisis have a higher risk of outbreaks of acute respiratory infections, and this may have influenced the increase in paediatric sari requiring picu admissions among children aged less than 5 years in may 2016.12 the increased incidence of paediatric sari in may 2016 may also have been influenced by circulating influenza a viruses. influenza a was predominant in fiji during april–may 2016, with a(h1n1)pdm09, a(h3) and some b viruses detected.13 the april–may period began with more notifications of a(h1n1)pdm09; however, a(h3) was predominant overall.13 globally, the 2015–2016 influenza season was also marked by an early predominance of the influenza a(h1n1)pdm09 virus with influenza a(h3n2) predominant later in the global season.14,15 several limitations were identified in the investigation. we only measured severe disease requiring admission to paediatric intensive care units; this paper does not provide a comprehensive estimate of paediatric sari incidence. the investigation case definition was based on clinical diagnoses, which may have resulted in some misclassification of sari cases. the etiology of sari was not systematically investigated as suspected cases of influenza are not routinely confirmed by microbiological testing in fiji; the assumption that the increase in paediatric sari was due to influenza cannot be confirmed. cfrs should be interpreted in the context of picu admissions rather than all paediatric sari hospitalizations. since the investigation was conducted in may 2016, cfrs were calculated for the period january–may for each year (2013–2016) and incidence rates for the month of may only (2013–2016). small case numbers in some divisions and age groups may have influenced the results. while recognizing there are competing priorities for health resources, the introduction of a seasonal influenza vaccination policy for high-risk groups, as per who recommendations, should be considered to address the ongoing burden of paediatric sari in fiji.1,3 conclusion this investigation provided valuable information on the burden of paediatric sari requiring admission to divisional hospital picus in fiji in may 2016. the data were used to implement targeted public health response measures and enhance surveillance for paediatric sari in divisional hospitals in fiji. references world health organization. vaccines against influenza. who position paper – november 2012. geneva: world health organization. wkly epidemiol rec. 2012 nov 23;87(47):461–76. pmid:23210147 western pacific region global influenza surveillance and response system. epidemiological and virological characteristics of influenza in the western pacific region of the world health organization, 2006-2010. plos one. 2012;7(5):e37568. doi:10.1371/journal.pone.0037568 pmid:22675427 dwyer d, barr i, hurt a, kelso a, reading p, sullivan s, et al. members of the western pacific region global influenza surveillance response system. seasonal influenza vaccine policies, recommendations and use in the world health organization's western pacific region. west pac surveill response. 2013 03 3;4(3):51–9. doi:10.5365/wpsar.2013.4.1.009 pmid:24319615 population and labour force estimates of 2014. statistical news 31 december 2015; press release no. 99. suva: fiji bureau of statistics, 2015 (http://www.statsfiji.gov.fj/component/advlisting/?view=download&format=raw&fileid=1382, accessed 5 december 2017). fiji centre for communicable disease control, who regional office for the western pacific. fiji national sari surveillance guideline. suva: fiji ministry of health and medical services; 2014. fiji national immunisation policy and procedure manual 2013–2016. suva: fiji ministry of health and medical services; 2016 (http://www.health.gov.fj/pdfs/policy/epi%20policy%202013-2016.pdf, accessed 5 december 2017). fiji ministry of health and medical services. fiji national influenza pandemic plan. suva: fiji ministry of health and medical services; 2006. fiji health and nutrition cluster. recovering from tc winston: bulletin 8. suva: fiji ministry of health and medical services; 2016 (http://www.health.gov.fj/wp-content/uploads/2016/03/20160613_hnc_bulletin8_final.pdf, accessed 18 march 2018). fiji bureau of statistics. 2007 fiji census of population and housing: analytical report. suva: government of fiji; 2012 (http://www.statsfiji.gov.fj/component/advlisting/?view=download&format=raw&fileid=2374, accessed 5 december 2017). nair h, brooks wa, katz m, roca a, berkley ja, madhi sa, et al. global burden of respiratory infections due to seasonal influenza in young children: a systematic review and meta-analysis. lancet. 2011 dec 3;378(9807):1917–30. doi:10.1016/s0140-6736(11)61051-9 pmid:22078723 government of fiji. fiji post-disaster needs assessment: tropical cyclone winston, february 20 2016. suva: government of fiji; may 2016 (https://www.gfdrr.org/sites/default/files/publication/post%20disaster%20needs%20assessments%20cyclone%20winston%20fiji%202016%20(online%20version).pdf, accessed 2 february 2017). bellos a, mulholland k, o'brien kl, qazi sa, gayer m, checchi f. the burden of acute respiratory infections in crisis-affected populations: a systematic review. confl health. 2010 02 11;4(1):3. doi:10.1186/1752-1505-4-3 pmid:20181220 flumart. global influenza surveillance and response system. geneva: world health organization; 2017 (http://apps.who.int/flumart/default?reportno=12, accessed 5 december 2017). world health organization. wkly epidemiol rec. 2016 december 16;91(52):601–24. risk assessment of the 2015–2016 influenza season in the who european region, week 40/2015 to week 04/2016. copenhagen: world health organization regional office for europe; 2016 (http://www.euro.who.int/__data/assets/pdf_file/0011/301115/risk-assessment-influenza-season-week40-15-to-week04-16.pdf, accessed 5 december 2017). external quality assessment for arbovirus diagnostics in the world health organization western pacific region, 2013–2016: improving laboratory quality over the years regional analysis mohammad yazid abdad,a raynal c squires,a sebastien cognat,b christopher john oxenford,b and frank koningsa a health emergencies programme, world health organization regional office for the western pacific, manila, philippines. b health emergencies programme, world health organization, lyon, france. correspondence to frank konings (email:koningsf@who.int). to cite this article: abdad my, squires rc, cognat s, oxenford cj, konings f. external quality assessment for arbovirus diagnostics in the world health organization western pacific region, 2013–2016: improving laboratory quality over the years. western pac surveill response j. 2017 oct;8(3). doi:10.5365/wpsar.2017.8.3.001 abstract arboviruses continue to pose serious public health threats in the world health organization (who) western pacific region. as such, laboratories need to be equipped for their accurate detection. in 2011, to ensure test proficiency, the who regional office for the western pacific piloted an external quality assessment (eqa) programme for arbovirus diagnostics. by 2016, it had grown into a global programme with participation of 96 laboratories worldwide, including 25 laboratories from 19 countries, territories and areas in the region. the test performance of the 25 laboratories in the region in 2016 was high with 23 (92%) reporting correct results in all specimens for dengue and chikungunya viruses. for zika virus, 18 (72%) of the 25 laboratories reported correct results in all specimens, while seven (28%) demonstrated at least one error. when comparing iterations of this eqa programme in the region between 2013 and 2016, the number of participating laboratories increased from 18 to 25. the first round only included dengue virus, while the latest round additionally included chikungunya, zika and yellow fever viruses. proficiency for molecular detection of dengue virus remained high (83–94%) over the four-year period. the observed proficiency for arbovirus diagnostics between 2013 and 2016 is an indicator of laboratory quality improvement in the region. arboviruses continue to pose a serious threat to human health worldwide as evidenced by the emergence and re-emergence of arboviral infections in the form of outbreaks globally in the last five years. during this time, the world witnessed the re-emergence of chikungunya virus (chikv) and zika virus (zikv) while dengue virus (denv) and yellow fever virus (yfv) continued to circulate widely. in february 2016, the director-general of the world health organization (who) declared a public health emergency of international concern (pheic) in response to zikv, microcephaly and other neurological disorders reported in brazil, following a similar cluster in french polynesia in 2014.1 this declaration ended in november 2016 in favour of a longer-term programmatic approach.2 the who western pacific region bears a large arboviral disease burden. for dengue alone, there were more than 860 000 cases and 1500 deaths reported between 2013 and 2016 (who regional office for the western pacific, unpublished data, 2017). chikv is endemic in the region and considered a threat to the pacific island countries and areas with recent outbreaks in new caledonia and papua new guinea.3 the first recorded outbreak of zikv disease in the region was in the federated states of micronesia in 2007.4 the virus has since been detected in the majority of the countries and occasionally causes outbreaks such as in singapore in 2016.5 preparedness in the face of such potential disease occurrences is paramount. therefore, public health laboratories and their equivalent in the research sector throughout the region have developed or adopted molecular methods for arbovirus detection. these new assays complement serological assays already in use and allow for diagnosis in the early stages of illness. to assess the competency of laboratories in the region, an external quality assessment (eqa) programme for arbovirus diagnostics was developed in 2011 with the goal of enabling the laboratories to gauge their proficiency and to identify areas for improvement. while test capacity is an indication of whether laboratories have the necessary elements, including required equipment, reagents and protocols in place to perform a test and to gauge the throughput, proficiency relates to how reliably and accurately a test is performed. the establishment of an eqa programme for dengue diagnostics was part of the asia pacific strategy for emerging diseases (2010), an action framework for building international health regulations core capacities.6 participation in eqa programmes is a requirement for achieving the international organization for standardization 15189 accreditation, which specifies the quality management system requirements particular to medical laboratories.7 the development of the eqa programme involved the main reference laboratories and collaborating centres in the region (fig. 1). a pilot to assess the feasibility, including panel preparation and logistics, of eqa for dengue diagnostics was first conducted by the national institute of infectious diseases, japan in 2011. this informed the development of the first round of eqa for dengue, which was introduced in 2013.8 eighteen laboratories participated in the programme, which was coordinated by the environmental health institute (ehi), singapore, a who collaborating centre for reference and research of arbovirus and their associated vectors. there was no round of eqa in 2014 due to logistic and technical review of the first round for improvement of subsequent iterations. in 2015, a second round of eqa, not only for dengue but also chikungunya diagnostics, was prepared by ehi9 and involved 24 laboratories, including 19 in the region and five in the who south-east asia region. in 2016, in succession to the two regional programmes, who organized the first global eqa programme for arbovirus diagnostics. the programme was developed and managed by the royal college of pathologists of australasia quality assurance programs. as of july 2017, global participation stands at 96 laboratories throughout all who regions. fig. 1: increase in the number of participating laboratories, geographic coverage and variety of pathogens of the who eqa programme for arbovirus diagnostics from pilot to global programme, 2011–2016 click to download figure 1. jpg, 202kb in 2016, 26 laboratories in the region were invited to participate in the eqa programme. this iteration of the eqa assessed participating laboratories' capacity and proficiency for denv, chikv, zikv and yfv (optional) diagnosis by polymerase chain reaction (pcr). panels containing blinded samples of various dilutions of the four arboviruses to be identified by participating laboratories were shipped between november and december 2016. of the 26 laboratories invited, 25 laboratories from 19 countries, territories and areas in the region returned results; one laboratory was unable to participate due to logistical issues preventing delivery of the panel. all 25 laboratories participated in pcr diagnosis of the three required viruses; additionally, 22 performed denv serotyping and 13 participated in the optional yfv component of the eqa. results from the 2016 eqa are presented in fig. 2. fig. 2: proficiency* of laboratories in the who western pacific region participating in the eqa programme for arbovirus diagnostics, 2013–2016 click to download figure 2. jpg, 145kb in 2016, test performance was high with 23 of 25 (92%) laboratories reporting correct results in all specimens in the panel for denv and chikv. for zikv, 18 (72%) laboratories reported correct results in all specimens, while seven (28%) demonstrated at least one error. twenty-one of 22 (95%) laboratories were able to correctly identify denv serotypes. all four laboratories that performed zikv lineage testing correctly determined whether the strain was of asian or african lineage. overall, errors appeared to be randomly distributed, and no patterns of inaccuracy could be observed for particular specimens or laboratories (data not shown). of the 13 laboratories that took part in the optional module for detection of yfv, nine (69%) successfully identified yfv in test specimens. while not endemic or reported in asia, demonstrating regional preparedness to detect and confirm yfv is vital in the event an outbreak were to occur. the importance of having diagnostic capacity for yfv was highlighted by the recent importations of laboratory-confirmed yfv cases from angola into china.10 a laboratory preparedness survey to determine test capacity for arboviruses in the region was conducted in february 2016, immediately after the declaration of a pheic related to zikv.11 it revealed that of the 19 national-level public health laboratories surveyed, 16 (84%) reported molecular testing capacity for zikv. the results of the 2016 eqa for arboviruses indicate that, in addition to test capacity, laboratories have a high level of test proficiency for zikv. additionally, three countries that indicated not having test capacity at the time of the survey had this capacity in place at the time of the 2016 eqa (data not shown). when comparing the results of the eqa programmes in the region between 2013 and 2016, eqa participation has consistently increased since 2013 (fig. 2). laboratories in the region demonstrated good proficiency at detecting denv in 2013 and both denv and chikv in 2015 with more than 83% of laboratories reporting correct results for all specimens in the panels. the region can now claim at least 23 national-level public health laboratories with consistently high accurate molecular detection capacity for denv and chikv compared to previous years. the observed increase in participation and improvements in eqa results suggest that laboratory managers are continuously improving their laboratory operations. their commitment is important in making sure that the region is prepared for health emergencies, supporting routine surveillance and providing accurate diagnoses. the eqa programme is an evolving tool that will continue to be reviewed and changed to monitor and inform improvement of laboratory diagnostic testing for arboviral diseases. it shows that small initiatives can grow into larger accomplishments in a stepwise manner when sufficient investments are made and when the impact on public health by better surveillance and response is recognized. the observation of an increasing number of participants and high proficiency between 2013 and 2016 is an indicator of improvement in laboratory capacity and performance in the region. conflicts of interest none declared. funding the regional and global programmes were supported by the united states agency for international development, the centers for disease control and prevention, and the global partnership program of global affairs canada. acknowledgements the authors are grateful to the laboratories that participated in the development of the eqa programme for arboviruses over the years since 2011. they would also like to thank all the national-level public health and research laboratories that participated in the eqa programme since its roll-out in 2013. references who director-general summarizes the outcome of the emergency committee meeting regarding clusters of microcephaly and guillain-barre syndrome. geneva: world health organization; 2016 (http://www.who.int/mediacentre/news/statements/2016/emergency-committee-zika-microcephaly/en/, accessed 24 may 2017). fifth meeting of the emergency committee under the international health regulations (2005) regarding microcephaly, other neurological disorders and zika virus. geneva: world health organization; 2016 (http://www.who.int/mediacentre/news/statements/2016/zika-fifth-ec/en/, accessed 24 may 2017). horwood p, bande g, dagina r, guillaumot l, aaskov j, pavlin b. the threat of chikungunya in oceania. west pac surveill response. 2013 06 04;4(2):8–10. pmid:24015365 doi:10.5365/wpsar.2013.4.2.003 duffy mr, chen th, hancock wt, powers am, kool jl, lanciotti rs, et al. zika virus outbreak on yap island, federated states of micronesia. n engl j med. 2009 jun 11;360(24):2536–43. pmid:19516034 doi:10.1056/nejmoa0805715 ho zjm, hapuarachchi hc, barkham t, chow a, ng lc, lee jmv, et al.; singapore zika study group. outbreak of zika virus infection in singapore: an epidemiological, entomological, virological, and clinical analysis. lancet infect dis. 2017 aug;17(8):813–21. pmid:28527892 doi:10.1016/s1473-3099(17)30249-9 asia pacific strategy for emerging diseases, 2010. manila: world health organization regional office for the western pacific; 2011 (http://www.wpro.who.int/emerging_diseases/documents/docs/asped_2010.pdf?ua=1, accessed 24 may 2017). iso 15189:2012. medical laboratories – requirements for quality and competence. geneva: international organization for standardization, 2012. pok ky, squires rc, tan lk, takasaki t, abubakar s, hasebe f, et al. first round of external quality assessment of dengue diagnostics in the who western pacific region, 2013. west pac surveill response. 2015 06 30;6(2):73–81. pmid:26306220 doi:10.5365/wpsar.2015.6.1.017 soh lt, squires rc, tan lk, pok ky, yang h, liew c, et al. external quality assessment of dengue and chikungunya diagnostics in the asia pacific region, 2015. west pac surveill response. 2016 04 22;7(2):26–34. pmid:27508088 doi:10.5365/wpsar.2016.7.1.002 yellow fever – china, disease outbreak news, 22 april 2016. geneva: world health organization; 2016 (http://www.who.int/csr/don/22-april-2016-yellow-fever-china/en/, accessed 24 may 2017). squires rc, konings f; world health organization regional office for the western pacific zika incident management team. preparedness for zika virus testing in the world health organization western pacific region. west pac surveill response. 2016 03 31;7(1):44–7. pmid:27757256 doi:10.5365/wpsar.2016.7.1.007 perceptions on the risk communication strategy during the 2013 avian influenza a/h7n9 outbreak in humans in china: a focus group study original research richun li,a ruiqian xie,b chong yangb and melinda frostc a united states centers for disease control and prevention, beijing, people’s republic of china. b chinese center for health education, beijing, people’s republic of china. c united states centers for disease control and prevention, beijing, people’s republic of china. correspondence to melinda frost (email: melinda.g.frost@gmail.com). to cite this article: li r et al. perceptions on the risk communication strategy during the 2013 avian influenza a/h7n9 outbreak in humans in china: a focus group study. western pacific surveillance and response journal, 2016, 7(2). doi:10.5365/wpsar.2016.7.1.005 abstract objective: to identify the general public’s perceptions of the overall risk communication strategy carried out by chinese public health agencies during the first wave of avian influenza a(h7n9) outbreak in humans in 2013. methods: participants were recruited from communities in beijing, lanzhou and hangzhou, china in may and june 2013 by convenience sampling. demographics and other relevant information were collected using a self-administered questionnaire. focus group interviews were conducted using a set of nine pre-developed questions and a tested moderator guide. the interviews were audio recorded and were transcribed verbatim. the constant comparative method was used to identify trends and themes. results: a total of nine focus group interviews, with 94 participants recruited from nine communities, were conducted. most participants received h7n9 information via television and the internet. a majority of the participants appreciated the transparency and timeliness of the information released by the government. they expressed a sense of trust in the recommended public health advice and followed most of them. the participants suggested that the government release more information about clinical treatment outcomes, have more specific health recommendations that are practical to their settings and expand the use of new media channels for risk communication. conclusion: the public perceived the overall risk communication strategy by the chinese public health agencies as effective, though the moderator had a governmental agency title that might have biased the results. there is a need to expand the use of social media for risk communication in the future. introduction effective risk communication is an essential element for outbreak management and health emergency response for pandemics.1,2 successful risk communication should (1) instruct, inform and motivate self-protective behaviour; (2) update risk information; (3) and build trust.3 based on previous experience in handling disease outbreaks with pandemic potential, risk communication strategies in china have evolved in the last decade. after the 2003 severe acute respiratory syndrome (sars) outbreak, the chinese government’s awareness of and capacity to respond to health emergencies substantially improved.4 china established a new mechanism for emerging infectious disease response with improvements in command and decision-making, organization and collaboration, monitoring and early warning and protection and communication. this new mechanism allowed china to successfully manage the avian influenza h5n1 and the pandemic influenza a/h1n1 outbreaks in 2005 and 2009, respectively.5 human infection with the avian influenza a(h7n9) virus were first identified in china in march 2013.6 h7n9 is a strain of influenza that causes mild disease in poultry but can be severe in humans. the world health organization reported 133 cases in the first wave of the h7n9 outbreak in china from february to may 2013; however, the number of cases decreased in the following summer.7 there is no vaccine to prevent human infection with h7n9 virus, and population immunity was low for this novel virus. human-to-human transmission of h7n9 was uncertain at the early stage of the outbreak, and there was much concern that human infection with h7n9 virus could rapidly spread the disease, resulting in a pandemic threat.8,9 given that concern, in this study we conducted focus group interviews in three cities in china to assess china’s risk communication responses to the 2013 h7n9 outbreak in humans from the general public’s perspective. methods study design focus group analysis was used to gain qualitative data on audience perceptions, feelings and opinions about health information provided during the outbreak.10,11 prior to the interviews, participants were also requested to complete a short self-administered questionnaire which collected demographic information, awareness of h7n9 and major channels through which the participants received or sought h7n9 information. study sites to achieve a reasonable representation of humans infected with h7n9 virus in china, we selected beijing, hangzhou (capital city of zhejiang province) and lanzhou (capital city of gansu province) for the study. these cities represent areas with low human h7n9 case numbers, high case numbers and no identified cases, respectively, as well as different geographic locations in china. as of 31 may 2013, the number of human h7n9 cases in shanghai city, zhejiang province and jiangsu province in east china accounted for 81.5% of the total number of cases.12 hangzhou reported 30 confirmed cases;13 two cases were identified in beijing4 but no cases were reported from gansu province. study participants according to the general focus group planning strategies,10 we decided the size of the focus group to be 8–13 individuals for ample discussion. we conducted three focus group interviews in each city to reach information saturation. subjects were recruited by convenience sampling. inclusion criteria were people who were aged 16 years or above, resided in the community and had normal oral conversation ability. eligible individuals were invited by community committee workers through telephone or face-to-face communications to participate in the study. subjects were then randomized into different focus groups according to the order of recruitment. specific occupational groups such as health-care workers or poultry workers did not have higher priority in the recruitment process. focus group interviews the interviews were conducted in may and june 2013 at local community facilities (e.g. community residents’ activity centres and community health centres) easily accessed by the participants. each participant received information about the objectives and procedures of the study and signed a consent form before participating. all interviews were run by one experienced moderator following a tested moderator guide with nine major questions (table 1). the moderator guided the discussion by asking pre-developed, open-ended questions and encouraged all the participants to contribute opinions by using probes. the questions were arranged in the order of introductory question (question 1), which normally is the easiest question for everyone to answer, transition question (question 2), key questions (questions 3–8) and ending question (question 9).15 the interviews lasted from 60 to 90 minutes and were audiotaped with the consent of all the participants. while the interviews were being audio recorded, the interviewees’ identities were ensured to be anonymous. the moderator had experience conducting many focus group interviews with the chinese public on various public health issues as well as having expert knowledge in risk communication. participants were allowed to quit the study at any time without giving any reasons. each participant received an incentive of 50 yuan (equivalent to approximately us$ 8) after the interview. table 1. open-ended focus group interview questions, h7n9 perception study, china, 2013 click to download table 1. jpg, 623kb data analysis the data from the self-administered questionnaire were analysed using sas (sas 9.3, cary, nc). use of social media/internet was defined as use of short message service (sms), web portals (e.g. baidu), microblogging (e.g. sina weibo) and wechat (a mobile instant text messaging communication application) for information on h7n9. the audio files were transcribed verbatim from the focus group interviews. the transcripts were reviewed and coded by the first author (who was also the assistant moderator and field note taker). the constant comparative method10 was used to identify trends and themes. the team had summary discussion after each interview to reach preliminary consensus of key findings. ethics the proposal of this study was submitted to the center for global health (cgh) of centers for disease control and prevention for project determination and approval. it was deemed as “not human subjects research” and “does not require human subject research review beyond cgh”. results in total, 145 eligible individuals were approached and 94 participants were recruited to this study. the response rate was about 65%. the majority were female (76.6%), aged 30 years or above (71.3%), and more than half of them (56.4%) had a high school education level or below. participants were evenly distributed across the three cities (table 2). awareness of the h7n9 outbreak was very high due to broad media coverage, and most participants reported that they received their first information about the h7n9 outbreak during late march to early april 2013 via tv (67.0%), internet/social media (48.8%) or newspaper (37.2%) (table 3). the information sought by participants most was prevention of h7n9 (78.2%), transmission routes (70.5%), safe consumption of eggs/chicken (42.3%) and overall situation of the outbreak (32.0%). table 2. demographics of the study participants, h7n9 perception study, china, 2013 (n = 94) click to download table 2. jpg, 389kb table 3. source of h7n9 information, h7n9 perception study, china, 2013* click to download table 3. jpg, 385kb * information was obtained in late march/early april in 2013, 2–3 months after the first reported human h7n9 case. multiple selection of information sources was allowed. sms, short message service. outbreak information dissemination the majority of participants thought h7n9 outbreak information was released in a transparent and timely manner. all participants in beijing and lanzhou and the majority of the hangzhou participants commented that the outbreak information was released quickly and updated frequently. for example, one participant said, “sometimes new patients were just found in the morning and the tv news reported it in the afternoon.” in addition, participants across groups praised h7n9 communication as transparent by comparing it with the communication response to sars. “this time is much better than sars, no information was hidden.” participants from the site with high prevalence of human infection with h7n9 virus had higher expectations of timely announcements of the emergence of the disease. two participants from hangzhou criticized the delay of the first announcement of the outbreak. one of them stated, “i do not think the government announced the disease in time. we first heard about the disease at the end of march, but the patients were hospitalized and even died almost one month earlier. it should have been announced earlier. this reminds me of sars, when intentional underreporting was not uncommon. who knows how many h7n9 patients have really been found …” outbreak information needs when asking what information released by health agencies was most helpful, almost all participants mentioned preventive methods. “the information telling us how to protect ourselves from getting infected is most helpful, such as washing hands more frequently, avoiding direct contact with birds and chickens, and things like that.” some participants also valued the information about the evolving outbreak trends which helped them assess the disease severity. “i paid very close attention to the overall outbreak situation, it helped me to judge if the disease was spreading very quickly just like sars did.” some participants expressed their appreciation for information about h7n9 transmission routes. one said, “when i heard that h7n9 does not transmit from person to person, i felt so relieved.” another explained, “when i heard that the majority of the patients had close contact with poultry, i just felt very relieved, i was sure i would not get the disease because i never directly touch chickens or ducks at all ...” some participants indicated their interest in knowing more about the clinical treatment status of the confirmed cases. “i want to know how many patients have died, how severe their symptoms are, and if there is effective medication that could cure this disease.” perception of information from government participants perceived government agency information sources to be trustworthy. the most trusted information channels reported by the participants included china central television, major web portals, national and local newspapers, local tv channels, community information boards (which are typically located in the centre of residential communities and regularly updated by the community committee) and health education materials (posters and pamphlets) disseminated by health authorities. participants had different comments on the credibility of social media; social media was more acceptable to young participants. some participants recalled that much of the h7n9 information received had been via microblogs and sms, and they described the information as “spurious and anecdotal”. some young participants suggested the government should use more social media to release health messages. one participant said, “i want to recommend sending disease information more frequently via microblogging and wechat. we young people almost always have the mobile phone in hand; it is very convenient for us [to get health messages].” acceptability of the health recommendations most of the participants reported that all of the public health recommendations they received were clear and easy to follow. the concern for being infected by the h7n9 virus resulted in some behaviour changes, either by forming new behaviours or improving current behaviours. for example, one participant said, “all recommendations such as [open the windows] to air your room, wash hands, etc., are very easy to do. actually i do these things almost every day, but since the start of this bird flu, i have been washing my hands more frequently and more carefully. i also remember to wash hands after touching raw eggs. i did not have this kind of habit before.” however, one hangzhou participant complained that the handwashing message was not practical, he said, “… to be honest, i cannot do that six-step-hand-washing process. i cannot memorize all those steps plus it wastes a lot of time. i do not think it will make a lot of difference from the way i wash my hands.” factors affecting participants’ anxiety level disease severity the severity and consequences of h7n9 infections were factors effecting people’s anxiety level. some of the participants indicated that they were scared because the majority of the reported h7n9 cases were either in critical condition or deceased. distance from the outbreak sources although many lanzhou participants reported that they never felt worried about the h7n9 outbreak since “it is very far [away from lanzhou]”, the majority of the participants in the other two cities felt worried during the first 2–3 weeks of the outbreak, but the anxiety eased afterwards. the rest of the participants from beijing and hangzhou reported that they “were not worried at all”. media coverage the high intensity of media coverage about h7n9 in the early stage of the outbreak made the public vigilant and concerned about the situation. one participant said, “at the very beginning when i heard there were h7n9 patients, i did not think too much about it, but later when there were more and more media started reporting about this issue, i started worrying. it reminded me of sars. it is scary if the situation cannot be controlled …” however, when the media coverage decreased, people interpreted it as a sign of that the outbreak was contained. “i was worried at the beginning; however, recently i noticed that less media report this event, so i think this is not a big deal anymore. it must already be controlled.” transmission route of h7n9 the chinese health authorities stated that there had been no proof of human-to-human transmission for h7n9, which successfully eased people’s anxiety. “right now, i do not worry at all, because we cannot get this bird flu from people, i do not touch any live birds, chickens or ducks.” trust in government’s competence the participants who “do not worry at all” indicated it was their trust in the government’s competency that made them worry-free: “we all know that china is more developed and stronger now. i am quite positive that our government absolutely has the capability to control this disease.” recommendations for communication practice one focus group in each city had full satisfaction with the h7n9 communication response by the chinese government. the other groups suggested that public health recommendations be more specific and practical. as one participant stated, “we were just told to wear masks when going to crowded places but we do not know what kind of mask works for this disease. do we need to wear n95 masks?” one participant expressed his strong desire for more information about clinical treatment status. “there is very limited information about treatment. i want to know if there are any serious consequences for the survivors.” some participants complained that there was a lack of credible inquiry channels to seek help. one hangzhou participant said, “my neighbour has some pigeons at his home, and they fly around. i wanted to know if these birds are dangerous, but i do not know where to go for this question.” discussion the goal of risk communication is to provide useful, relevant, accurate and needed information for a particular audience to make informed decisions about the risks they encounter.16,17 our results indicated that the majority of the participants felt their information needs were met concerning preventive measures, transmission routes and the evolving trends of the outbreak. trust is the cornerstone of effective risk communication. being open, transparent and timely in communication will help to earn the trust of the audience.18,19 many participants commented that the h7n9 outbreak information was released and updated in a transparent and timely manner. however, people in epidemic areas might have much higher expectations for the timely release of information. the one-month time window between hospitalization and announcement of the first human h7n9 case made people question the timeliness of the information release and the openness of the government. more information about why the first announcement was not made earlier would have been helpful to avoid suspicion. normally when there is a health emergency, the information people need most is about preventive measures;20 the same information need was reported by the participants. similar to a previous study,21 the participants had strong information needs about clinical treatment that was not sufficiently provided. participants also requested more specific and practical public health recommendations. this is similar to vaughan’s study that instructions for personal protective equipment usage should be clear and workable.3 to dispel ambiguity, fill information gaps and increase compliance to public health recommendations, more efforts should be taken to collect public feedback on the recommendations to make them specific, feasible and clear. in a 2014 study,22 the majority of the participants stated that they believed government agencies had the capability to control the h7n9 outbreak and regarded official information sources as the most credible ones. while successful risk communication should motivate appropriate self-protective behaviour,3 the general population’s acceptance of behavioural advice is strongly influenced by perceptions of integrity, credibility and competency of the authority.23 the majority of the participants reported that they followed the public health recommendations to wash hands, open the windows more frequently, thoroughly cook food and avoid direct contact with poultry and wild birds.24 our results suggest that the intensity of the media coverage is proportional to the public’s anxiety level about the reported health risk, similar to a study from the united states of america.25 at the beginning of the outbreak, high mass media coverage about h7n9 successfully gained public attention. mass media plays a large role in communicating health risks to the public,26 and the participants in this study indicated that mass media were the major channels to receive h7n9 information. mass media also could be used to disseminate public health recommendations to the population. internet-based channels, including web portals and social media, were reported as preferences among the young population. although the chinese online community’s reaction to h7n9 was profound,27 young participants still urged the government to communicate h7n9 information via social media. health agencies may consider having an official presence on social media and using it routinely for health information delivery other than in emergencies so as to effectively reach the younger population. some participants reported they had difficulties in finding information to address their concerns or questions. a stronger two-way communication strategy should be applied. this helps to provide channels for the public to obtain specific information that they are concerned about and avoid misconceptions and rumours. there were several limitations to our study. the results might not be representative as the participants were convenience sampled and were female dominant. the qualitative data analysis was done by only one researcher and later discussed with a team of researchers which might potentially limit the validity of the results. although the moderator of the focus group is skillful and experienced, his governmental agency title might have caused some participants to hesitate in criticizing the government’s communication. nevertheless, participants were open and felt comfortable enough to suggest how to improve the risk communication response. conclusion in conclusion, the majority of the focus group participants were satisfied with the chinese health agency risk communication response to the 2013 h7n9 outbreak. they appreciated the transparent and timely information release and felt that their information needs had been met. although some participants felt that the public health recommendations lacked feasibility and were not specific or clear enough, many participants reported behaviour change that conformed to public health recommendations. social media should be more broadly used during public health emergencies to better reach the young population. two-way inquiry channels, such as public health hotlines, should be more accessible to the public to help address questions, dispel rumours and clarify misunderstandings. conflicts of interest the findings and conclusions in this report are those of the authors and do not necessarily represent the official position of the united states centers for disease control and prevention. funding the study was supported by the china-u.s. collaborative program on emerging and re-emerging infectious diseases. acknowledgements we would like to express our gratitude towards the local partners in beijing, hangzhou and lanzhou including local cdcs and community committee staff. we also are very grateful to dr carol rao’s great support and constant encouragement. references reynolds b. crisis emergency risk communication pandemic influenza. washington, dc, united states department of health and human services, 2007. available from: http://emergency.cdc.gov/cerc/resources/pdf/cerc-pandemicflu-oct07.pdf [accessed 3 june 2016]. world health organization outbreak communication planning guide. geneva, world health organization, 2008. available from: http://www.who.int/ihr/elibrary/ whooutbreakcommsplanngguide.pdf [accessed 3 june 2016]. vaughan e, tinker t. effective health risk communication about pandemic influenza for vulnerable populations. american journal public health, 2009, 99(s2) suppl 2:s324–s332. doi:10.2105/ajph.2009.162537 pmid:19797744 wang y. the h7n9 influenza virus in china–changes since sars. the new england journal of medicine, 2013, 368(25):2348–2349. doi:10.1056/nejmp1305311 pmid:23782176 yao l et al. from sars to h7n9: the mechanism of responding to emerging communicable diseases has made great progress in china. bioscience trends, 2013, 7(6):290–293. yu h et al. human infection with avian influenza a h7n9 virus: an assessment of clinical severity. the lancet, 2013, 382(9887):138–145. doi:10.1016/s0140-6736(13)61207-6 pmid:23803487 background and summary of human infection with avian influenza a(h7n9) virus – as of 31 january 2014. geneva, world health organization, 2014. available from: http://www.who.int/influenza/human_animal_interface/20140131_background_and_ summary_h7n9_v1.pdf?ua=1 [accessed 3 june 2016]. from sars to h7n9: will history repeat itself? the lancet. 2013, 381(9875):1333. doi:10.1016/s0140-6736(13)60865-x pmid:23601933 xiang n et al. use of national pneumonia surveillance to describe influenza a(h7n9) virus epidemiology, china, 2004-2013. emerging infectious diseases, 2013, 19(11):1784–1790. doi:10.3201/eid1911.130865 pmid:24206646 krueger ra, casey ma. focus groups: a practical guide for applied research. 5th ed. london, sage publications, inc., 2015. barbour rs, kitzinger j. developing focus group research: politics, theory and practice. london, sage publications, inc., 1999. yan t et al. epidemiological characteristics of 130 human avian influenza a (h7n9) cases in mainland china [in chinese]. chinese journal of disease control & prevention, 2013,17(8). xie l et al. distributive characteristics and sources of exposure of human infections with avian influenza a (hn7n9) virus in hangzhou, zhejiang province [in chinese]. zhonghua liu xing bing xue za zhi. 2013, 34(9):944–945. pmid:24380097 the second h7n9 case identified in beijing was discharged from hospital after clinical treatment [in chinese]. beijing, beijing municipal commission of population and family planning, 2013. available from: http://www.bjhb.gov.cn/gzfwq/zkzt/ 2013qlg/yqdt/201305/t20130531_61321.htm [accessed 3 june 2016]. krueger ra. focus group kit 3: developing questions for focus groups. london, sage publications, inc., 1998. doi:10.4135/9781483328126 fitzpatrick-lewis d et al. communication about environmental health risks: a systematic review. environmental health, 2010, 9(1):67. doi:10.1186/1476-069x-9-67 pmid:21040529 covello vt et al. risk communication, the west nile virus epidemic, and bioterrorism: responding to the communication challenges posed by the intentional or unintentional release of a pathogen in an urban setting. journal of urban health, 2001, 78(2):382–391. doi:10.1093/jurban/78.2.382 pmid:11419589 tinker tl, zook e, chapel tj. key challenges and concepts in health risk communication: perspectives of agency practitioners. journal of public health management and practice, 2001, 7(1):67–75. doi:10.1097/00124784-200107010-00011 pmid:11141625 covello vt. best practices in public health risk and crisis communication. journal health communication, 2003, 8(suppl 1):5–8, discussion 148–151. doi:10.1080/713851971 pmid:14692565 wray rj et al. communicating with the public about emerging health threats: lessons from the pre-event message development project. american journal of public health, 2008, 98(12):2214–2222. doi:10.2105/ajph.2006.107102 pmid:18382011 glik d et al. public perceptions and risk communications for botulism. biosecurity and bioterrorism, 2004, 2(3):216–223. doi:10.1089/bsp.2004.2.216 pmid:15588060 goodwin r, sun s. early responses to h7n9 in southern mainland china. bmc infectious diseases, 2014, 14(1):8. doi:10.1186/1471-2334-14-8 pmid:24397830 cairns g, de andrade m, macdonald l. reputation, relationships, risk communication, and the role of trust in the prevention and control of communicable disease: a review. journal health communication, 2013,18(12):1550–1565. doi:10.1080/10810730.2013.840696 pmid:24298887 goodwin r, sun s. public perceptions and reactions to h7n9 in mainland china. journal of infection, 2013, 67(5):458–462. doi:10.1016/j.jinf.2013.06.014 pmid:23834972 elledge bl et al. implications of public understanding of avian influenza for fostering effective risk communication. health promotion practice. 2008, 9(4) suppl:54s–549s. doi:10.1177/1524839908319089 pmid:18936260 glik dc. risk communication for public health emergencies. annual review of public health, 2007, 28(1):33–54. doi:10.1146/annurev.publhealth.28.021406.144123 pmid:17222081 fung ic et al. chinese social media reaction to the mers-cov and avian influenza a(h7n9) outbreaks. infectious diseases of poverty, 2013, 2(1):31. doi:10.1186/2049-9957-2-31 pmid:24359669 ongoing rubella epidemic in osaka, japan, in 2018–2019 brief report daiki kanbayashi,a,§ takako kurata,a,§ hideyuki kubo,a atsushi kaida,a seiji p yamamoto,a kazutaka egawa,a yuki hirai,a kazuma okada,a ryo ikemori,a takahiro yumisashi,a akira yamamoto,b hideki yoshida,c takanori hirayama,d kazuyoshi ikuta,a kazushi motomura,a a osaka institute of public health, osaka, japan. b sakai city institute of public health, osaka, japan. c osaka city health center, osaka, japan. d osaka prefectural government, osaka, japan. § both authors contributed equally to this work. correspondence to daiki kanbayashi (email: kanbayashi@iph.osaka.jp). to cite this article: kanbayashi d, kurata t, kubo h, kaida a, yamamoto s, egawa k, et al. ongoing rubella epidemic in osaka, japan, in 2018–2019. western pac surveill response j. 2020 jun;11(2). doi:10.5365/wpsar.2019.10.3.001 rubella is a typically mild contagious disease caused by the rubella virus1 however, when a pregnant woman is infected with rubella virus, fetal death or congenital rubella syndrome (crs) can occur.1 the number of rubella and crs cases has been reduced in many countries as a result of rubella vaccinations.2 to prevent the occurrence of crs, the world health organization (who) global vaccine action plan 2011–2020 set the goal of achieving rubella elimination in at least five who regions by 2020.3 in japan, an estimated 100 000 cases of rubella occurred every year and outbreaks occurred approximately every 5 years until about 1990. with routine immunizations, the scale of the epidemics has been shrinking and the length of time between epidemics has been growing longer. the last outbreak occurred in 2012–2013, with more than 17 000 cases of rubella and 45 cases of crs.4 from 2013 to mid-2018, only sporadic or imported cases of rubella were reported in japan.4,5 however, an upsurge of rubella cases was observed between july and august 2018 in the south kanto region (chiba, kanagawa and tokyo prefectures), and epidemics were subsequently reported in regions of japan.6 in 2018, 2917 cases of rubella were reported, marking the second largest epidemic since 2008, when rubella was classified as a notifiable disease in japan.6 during the first half 2019, 1935 cases of rubella and three cases of crs were reported.7 the characteristics of rubella epidemics in osaka prefecture are described in this text. we also speculate about the cause of the nationwide epidemics. in total, 123 cases of rubella were reported in 2018 and 118 cases were reported in 2019 (weeks 1–27) (fig. 1a). the first rubella case in osaka prefecture was reported in week 17 of 2018 (fig. 1a). after the third case was reported in week 34 of 2018, cases of rubella were regularly reported until week 20 of 2019. among 241 cases reported in 2018–2019, 176 (73.0%) occurred in males. the median patient ages were 40 (range: 1–71) years for males and 32 (range: 0–65) years for females. vaccination history was unknown in most cases (163 cases, 67.6%), followed by no history of vaccination (57 cases, 23.7%), one dose (18 cases, 7.5%), and two-doses (three cases, 1.2%). fig. 1. weekly distribution of (a) the number of reported rubella cases and (b) the number of detected rubella viruses in 2018–2019 click to download figure 1. jpg, 541kb among the 241 cases reported in 2018-2019, genotypes could be determined in 119 cases. genotypes were classified as genotype 1e (118/119; 99.2%) and 2b (1/119; 0.8%) (fig. 1b). all genotype 1e strains belonged to genotype 1e lineage 2, and the genotype 2b strain belonged to genotype 2b lineage 1 (fig. 1b).8 all genotype 1e strains detected after week 34 of 2018 in osaka prefecture were closely related to each other with 99.2–100% nucleotide identity and the representative strains detected before and after week 34 in the kanto region (accession numbers: lc466969, lc422203, lc422829, lc422204 and lc422205) with 100% nucleotide identity. the rubella epidemic in osaka prefecture was part of a large ongoing epidemic of rubella across japan. most patients were adult males born on or before 1 april 1979, who had not been targeted for routine rubella immunization during childhood, and males and females born on or after 2 april 1979 with low vaccination coverage. after the 2012–2013 epidemic, the seropositive proportion (haemagglutination-inhibition antibody titre ≥1:8) of the total population remained steady at 91.0% (5148/5656). however, among males in their 30s to 50s the seropositive proportion was 84.2% (974/1157) in 2017, in line with that observed before the 2012–2013 epidemic in japan.9 therefore, insufficient vaccine coverage may have created a situation in which a new epidemic of rubella emerged in japan when rubella virus was imported. the 2012–2013 epidemic was caused by rubella virus strains with a variety of genetic backgrounds, suggesting that these strains were introduced from multiple sources.8 in contrast, the 2018–2019 epidemic was mainly caused by rubella virus strains with the same or very close genetic background. it is unclear whether the 2018–2019 rubella epidemic was caused by the expansion from a single source or several sources in kanto region. this is because the epidemiological link of most cases is unclear, which is a limitation of the current study. the number of rubella cases related to importation from south-eastern and east asia doubled in japan in 2018, compared with the number over the past four years.10 we believe that the epidemic may be in part attributable to immunization strategies that left a susceptible population in japan as well as potential introduction of rubella virus from other countries. although the who position paper on rubella vaccines, published in july 2011, stated that the effect of a selective immunization policy is limited,11 the current outbreak highlights that high vaccination coverage with two doses of a rubella-containing vaccine targeting children as well as adults who are hard-to-reach and vulnerable is needed to eliminate rubella. the ministry of health, labour and welfare of japan began subsidizing antibody testing and vaccination costs for 16.1 million adult males to raise the vaccine coverage, as indicated by rubella antibody seropositivity of the target generation to at least 90% by the end of 2021. the lessons learnt from this outbreak can be of value to achieve rubella elimination for other countries that have introduced or have planned selective immunization policies. acknowledgements we thank the staff of the osaka prefectural government, health centres in osaka, the osaka institute of public health, the sakai city institute of public health, the osaka infectious disease surveillance center and the clinicians who collected clinical specimens for supporting our work. in addition, we thank enago for the english language review. funding this study was partially supported by jsps kakenhi grant numbers 26860453 18k17367 and a grant-in-aid from the japan agency for medical research and development, amed (jp18fk0108013). conflicts of interest the authors declare that they have no conflicts of interest. references reef s, plotkin sa. rubella vaccine. in: plotkin sa, orenstein w, offit p, editors. vaccines. 6th ed. philadelphia, pa: saunders; 2013. pp. 688–717. doi:10.1016/b978-1-4557-0090-5.00038-0 plotkin sa. the history of rubella and rubella vaccination leading to elimination. clin infect dis. 2006 nov 1;43 suppl 3:s164–8. doi:10.1086/505950 pmid:16998777 global vaccine action plan 2011-2020: geneva: world health organization; 2013. available from: https://www.who.int/immunization/global_vaccine_action_plan/gvap_doc_2011_2020/en/ rubella and congenital rubella syndrome in japan as of january 2018. tokyo: national institute of infectious diseases; 2018. avalable from: https://www.niid.go.jp/niid/en/research-e/865-iasr/7944-457te.html?tmpl=component&print=1&layout=default, accessed 11 march 2020. kanbayashi d, kurata t, nishino y, orii f, takii y, kinoshita m, et al. rubella virus genotype 1e in travelers returning to japan from indonesia, 2017. emerg infect dis. 2018 sep;24(9):1763–5. doi:10.3201/eid2409.180621 pmid:30124420 cumulative rubella cases by week, 2012–2018 (week 1–52) (based on diagnosed week as of 7 january 2019). tokyo: national institute of infectious diseases; 2018 [cited 4 june 2019]. available from: https://www.niid.go.jp/niid//images/idsc/disease/rubella/2018pdf/rube18-52.pdf cumulative rubella cases by week, 2013–2019 (week 1–27). tokyo: national institute of infectious diseases; 2019 [cited 22 july 2019]. available from: https://www.niid.go.jp/niid//images/idsc/disease/rubella/2019pdf/rube19-27.pdf mori y, miyoshi m, kikuchi m, sekine m, umezawa m, saikusa m, et al. molecular epidemiology of rubella virus strains detected around the time of the 2012-2013 epidemic in japan. front microbiol. 2017 aug 9;8:1513. doi:10.3389/fmicb.2017.01513 pmid:28848523 national epidemiological surveillance of vaccine-preventable diseases: seroprevalance of vpds; 2011. tokyo: national institute of infectious diseases; 2017. available from: https://www.niid.go.jp/niid/ja/y-graphs/1600-yosoku-index-e.html trends in notifications of imported cases among select notifiable infectious diseases in japan. tokyo: national institute of infectious diseases; 2019. available from: https://www.niid.go.jp/niid/images/epi/imported/pdf/20190318_webupimportedidsrevised.pdf rubella vaccines: who position paper. weekly epidemiological record. 2011 jul 15;29(86):301-16. the pacific experience: supporting small island countries and territories to meet their 2012 international health regulations (2005) commitments lessons from the field adam craig,a jacob koolb and eric nillesb a public health consultant, sydney, australia. b emerging disease surveillance and response, division of pacific support, world health organization, suva, fiji. correspondence to adam craig (e-mail: adam@adamcraig.com.au). to cite this article: craig a et al. the pacific experience: supporting small island countries and territories to meet their 2012 international health regulations (2005) commitments. western pacific surveillance and response journal, 2013, 4(3):14–18. doi:10.5365/wpsar.2012.3.4.007 abstract issue: by 15 june 2012, states parties to the international health regulations (2005), or ihr (2005), were required to have established the core capacities required to implement annex 1 of ihr (2005). context: the pacific is home to 10 million people spread over 21 pacific island countries and territories. seven of those have populations of less than 25 000 people; 14 of the 21 pacific island countries and territories are states parties to the ihr (2005). action: the world health organization division of the south pacific embarked on an initiative to support pacific island states parties meet their 15 june 2012 ihr obligations. we adapted the 2012 ihr monitoring questionnaire (ihrmq) to assist pacific island countries and territories determine if they had met the capacities required to implement annex 1 of the ihr (2005). if a pacific island country or territory determined that it had not yet met the requirements, it could use the assessment outcome to develop a plan to address identified gaps. outcome: direct support was provided to 19 of 21 (91%) pacific island countries and territories including 13 of 14 (93%) states parties. twelve of 14 (86%) fulfilled their requirements by 15 june 2012; those that had not yet met the requirements requested extensions and submitted plans describing how the ihr core capacities would be met. discussion: adapting the 2012 ihrmq for this purpose provided an efficient tool for assessing national capacity to implement annex 1 of ihr (2005) and provided clear indication of what capacities required strengthening. issue on 15 june 2012, five years after the international health regulations (2005), or ihr (2005), entered into force, the states parties to ihr (2005)1 were required to have in place the core public health capacities required to implement annex 1 of the ihr (2005), and, if it was found that the capacities needed were not yet in place, to request a two-year extension to allow more time to meet the requirements.2 as coordinating body for ihr (2005), the world health organization (who) monitors states parties’ progress towards fulfilment of the core capacity requirements. central to this monitoring is the annual ihr monitoring questionnaire (ihrmq).3 the 2012 edition of ihrmq was made available to states parties in march 2012 to be completed and returned to who by 1 august 2012. this paper describes how the who division of the south pacific used the 2012 ihrmq to produce a tailored tool with which pacific island countries and territories could determine fulfilment of their capacity to implement annex 1 of ihr (2005) to meet their 15 june 2012 obligations. we discuss how we supported pacific island countries and territories to apply the adapted tool and reflect on lessons learnt in the process. we hope that our experience in the pacific will be informative for other similar contexts. context the pacific covers almost one third of the earth and is home to approximately 10 million people (excluding australia and new zealand which are developed countries that do not require technical assistance).4 of these, 6.5 million reside in papua new guinea. the other 3.5 million pacific islanders are dispersed over many hundreds of islands and atolls that make up the other 20 pacific island countries and territories (figure 1). seven pacific island countries and territories have populations of less than 25 000, and three have populations less than 10 000; tokelau has a population of just 1200 people. fourteen pacific island countries and territories are states parties to ihr (2005), and seven are territories or administrative areas for which ihr (2005) responsibilities are delegated to their metropolitan country. the majority of the pacific island countries and territories are considered to be of lower-middle income.5 figure 1. map of the pacific island countries and territories in the western pacific region click to download figure 1. jpg, 346kb small population size, geographic isolation and limited human and financial resources make independent achievement of many of the ihr (2005) core capacities extremely challenging for these island territories. some of these challenges have been addressed by drawing on regionally based public health resources such as the pacific public health surveillance network’s (pphsn) laboratory network6 and the who-led pacific syndromic surveillance system,7,8 in addition to bilateral agreements with pacific rim countries such as new zealand, australia or the united states. action assisting pacific island countries and territories to meet their ihr (2005) capacity obligations in response to pacific island countries and territories’ requests for assistance, the who division of pacific support (based in suva, fiji) embarked on a project to support states parties meet their ihr (2005) notification obligations by 15 june 2012. who had committed this assistance through the asia pacific strategy for emerging diseases (2010).9 even though islands that are territories of other nations are not states parties to ihr (2005), and therefore not required independently to report their progress directly to who (rather through their metropolitan country), we encouraged them to participate in the project for self-assessment purposes. six of seven territories were enthusiastic to participate. adapting the 2012 ihrmq for use as a tool to assess pacific island countries and territories ability to implement annex 1 of ihr (2005) the ihrmq is an annual questionnaire developed for global use and sent to all ihr (2005) states parties. it is an important source of information for countries to determine whether they have met the ihr (2005) core capacity requirements. it can be helpful to adapt this global tool for application to best meet the context of each region, country or territory. for this purpose, we analysed the questions in the 2012 ihrmq to identify those that were most directly related and fundamental to the content of annex 1 of ihr (2005) and were most pertinent to determining whether the core capacities had been established.1 to ensure consistency with the full 2012 ihrmq we did not modify the wording of any of the questions; however, to make it more user-friendly and pacific-oriented, we added explanatory/interpretive notes beside relevant questions. finally, we expanded the response options by adding: “yes, drawing on international resources”; “yes, drawing on national resources”; “no”; and “not relevant”. this allowed pacific island countries and territories to more accurately reflect the situation in their jurisdictions, including where a pacific island country or territory drew on regionally based networks or had bilateral agreements in place to achieve certain core capacities. this tool was distributed to pacific island countries and territories’ national ihr focal points or public health focal points (for those that are areas/territories) in the week of 14 may 2012, approximately one month before the 15 june 2012 date for extension requests. supporting pacific island countries and territories assess their capacity achievement after we distributed the tool, pacific island countries and territories were contacted and offered one-on-one telephone or e-mail assistance to explain and apply the tool. the form of assistance depended on the country or territory’s needs, national decision-making processes and logistical factors such as stability of telephone lines or availability of relevant personnel. usually, assistance was delivered as a series of telephone conferences focusing on specific aspects of ihrmq that were of particular concern to a pacific island country or territory. on 31 may 2012, senior public health staff from 12 of 14 (86%) states parties and five of seven territories (71%) met with who and secretariat of the pacific community (spc) staff as part of a pacific region meeting. important objectives of this meeting were to ensure the ihr (2005) assessment and reporting process was clear, to review the pacific-wide public health networks and their roles in core capacity development and to provide additional one-on-one assistance to any pacific island country or territory requesting further support. outcome direct support was provided to 19 of the 21 pacific island countries and territories (91%), including 13 of the 14 states parties and six of the seven territories. every effort was made to engage the two other pacific island countries and territories. twelve of 14 states parties completed their national assessments and determined their ability to implement annex 1 of ihr (2005) by 15 june 2012 and reported the conclusion of their national assessment to who by the notification date. six of the 14 determined that they had in place the capacities required to implement annex 1 of ihr (2005) and did not request an extension. the other eight determined that they had not yet met the requirements and requested a two-year extension. as required, all states parties requesting an extension submitted an implementation plan for how they would meet the ihr (2005) core capacity requirements within the extension period. discussion in the last two decades, who, spc and the pacific island countries and territories have worked closely to establish and sustain pphsn (a voluntary network of pacific island countries and territories’ public health authorities, who, spc and other regional public health entities) and pacific-wide networks and services that provide important capacity support such as early warning for outbreaks,6,8 laboratory testing or outbreak response. through the support of pphsn, many of ihr (2005) core capacities are available to pacific island countries and territories, some of which could never be achieved by smaller individual pacific island countries and territories. for example, for most pacific island countries and territories the catchment populations are too small to supply the necessary number of samples to warrant the investment in national confirmatory testing capacity, and therefore it is necessary to rely on the pphsn-coordinated laboratory network to facilitate overseas testing. feedback from pacific island countries and territories indicated that they appreciated the tailored tool and the one-to-one assistance provided to apply the tool. pacific island countries and territories expressed their desire for future ihr (and other) assessment tools to be shorter and simpler, noting that they would be better received, more useful to individual nations and more likely to be completed in time. the ihr (2005) assessment tools could be simplefied by excluding questions not directly related to the core capacities of the ihr (2005) or stratifying questions into core and supporting questions so countries can prioritize the essential (and legally binding) ihr (2005) core capacity requirements. although mentioned in the ihr (2005) documentation, several pacific island countries and territories’ officers responsible for completing ihrmq did not realize that they could report successful national fulfilment of core capacities if their nation drew on sources/services from neighbouring countries or from international preparedness, surveillance or response capacities for national purposes. to address this misunderstanding, and to address the issue of the ihrmq’s length and complexity, modification could be made to the response options or accompanying instruction documentation. a key finding from our evaluation of the assistance provided was that contextualization of global tools was well received. the importance of who’s regional and country offices for country liaison and provision of support to apply who-developed tools is of paramount importance. harmony between ihr (2005) and other global, regional, subregional and national health emergency capacity development frameworks is also critical. where possible, objectives of various frameworks should be closely aligned and complementary. similarly, where possible, assessment processes should be standardised to lessen the resource drain on already over-burdened ministries. conclusion the ihr (2005) and the 2012 ihrmq provide a valuable framework within which nations can assess current capacity and develop plans to address gaps. however, when considering very small population countries, the need for flexibility and adaptability should be considered. in our experience, who’s (or other development agencies’) assistance to interpret global monitoring tools is appreciated, aids understanding, and will likely facilitate higher quality, timely and complete reporting. there are calls from small nations to streamline planning and assessment processes to reduce the burden placed on limited national public health staff. this can, in part, be achieved by ensuring planning and assessment tools are clear, focused and succinct. conflicts of interest none declared. funding none. acknowledgements we acknowledge the work and support of our colleagues from spc (yvan souares, pascal frison and christelle lepers) and who (chin-kei lee, ailan li and boris pavlin). we also acknowledge our national counterparts for their active participation in this project. references: the international health regulations (2005). geneva, world health organization, 2007. available from: http://www.who.int/ihr/finalversion9nov07.pdf [accessed 20 september 2012]. information to states parties regarding determination of fulfilment of ihr core capacity requirements for 2012 and potential extensions. geneva, world health organization, 2012. available from: http://apps.who.int/iris/bitstream/10665/ 70820/1/who_hse_gcr_2012.1_eng.pdf [accessed 25 september 2012]. international health regulations monitoring questionnaire, 2012 edition. geneva, world health organization, 2012. pacific islands’ population tops 10 million. fiji, island business magazine, 2011. data – pacific island small states. washington, dc, world bank, 2012. available from: http://data.worldbank.org/region/pss [accessed 28 june 2012]. pacific public health surveillance network. new caledonia, secretariat of the pacific communities, 2012. available from: http://www.spc.int/phs/pphsn/ [accessed 28 june 2012]. kool jl et al. pacific-wide simplified syndromic surveillance for early warning of outbreaks. global public health, 2012, 7:670–681. doi:10.1080/17441692.2012.699536 pmid:22823595 paterson bj et al. sustaining surveillance: evaluating syndromic surveillance in the pacific. global public health, 2012, 7:682–694. doi:10.1080/17441692.2012.699713 pmid:22817479 asia pacific strategy for emerging diseases (2010). manila, world health organization regional offices for the western pacific, 2011. avaialble from: http://www.wpro.who.int/emerging_diseases/documents/asped_2010/en/ index.html [accessed 28 june 2012]. https://ojs.wpro.who.int/ 1wpsar vol 11, no 4, 2020 | doi: 10.5365/wpsar.2020.11.2.013 perspective a australian red cross, melbourne, australia b mongolian red cross society, ulaanbaatar, mongolia published: 13 november 2020 doi: 10.5365/wpsar.2020.11.2.013 g lobally, seasonal influenza contributes to approximately 291 000 to 645 000 deaths each year.1 the burden of annual influenza epidemics can be particularly high in lowand middle-income countries1 such as mongolia,2 which experienced a nationwide epidemic of influenza a(h1n1) 2009 in the winter of 2018–2019. the national health system was quickly overwhelmed, prompting the state emergency commission to involve key partners – including the mongolia red cross society (mrcs) and its network of more than 6000 volunteers – to augment the government’s response capacity. this paper describes how the experience of mrcs and subsequent planning for the 2019–2020 influenza season were effectively leveraged during the response to coronavirus disease 2019 (covid-19). over the last decade, mrcs has been engaged by the government to support the prevention and control of several communicable disease outbreaks; however, mrcs had had little involvement in influenza-related activities since the 2009 h1n1 pandemic. recognizing the value of preparedness after the winter of 2018–2019, mrcs developed an influenza preparedness plan in advance of the 2019–2020 influenza season. planning comprised a review of seasonal influenza risk, including risk factors and vulnerability; mapping key stakeholders and relevant policies, plans and capacities; and a literature review to determine the evidence base for community-focused, influenza-related interventions. aligned with recommendations of the who global influenza strategy 2019–20303 and structured around the “epidemic response cycle” (preparedness, alert, response and evaluation),4 the preparedness plan set out actions for mrcs to contribute to mitigating the threat of seasonal influenza, including annual training of volunteers, pre-positioning of health communication materials and hand sanitizer, and strengthening planning and collaboration with local authorities and stakeholders. volunteer training and activities focused on non-pharmacological interventions – strategies individuals or communities could adopt when well (to reduce exposure to the virus and avoid infection) or unwell (to avoid spreading the infection to others).5 prevention messages focused on hand hygiene, cleaning of high-touch surfaces, respiratory etiquette, self-quarantine when feeling unwell and promoting annual influenza vaccination, especially for children aged 2–5 years. tailored education messages for children were delivered through games, songs and fun activities rather than didactic approaches. the preparedness plan aimed to strengthen community-centred preparedness for seasonal influenza, as well as to provide the foundation for mrcs to contribute to broader epidemic preparedness. the benefits of this were almost immediate, with mrcs leveraging the plan in the preparedness phase of the national covid-19 response in january 2020. many of mrcs’s routine influenza prevention messages similarly apply to covid-19, and they were quickly rebranded for this purpose and incorporated into volunteer training and public communication materials. relationships established with national and local authorities to address seasonal influenza were swiftly capitalized upon to enable joint planning and information sharing for covid-19. and continuous reflection and evaluation processes are providing lessons learnt to inform ongoing covid-19 interventions, as well as preparedness actions for the 2020–2021 influenza season. for example, a public survey to determine communicamongolia red cross society, influenza preparedness planning and the response to covid-19: the case for investing in epidemic preparedness lisa natoli,a narangoo gaysuren,b densmaa odkhuu,b and veronica bella correspondence to lisa natoli (email: lnatoli@redcross.org.au) wpsar vol 11, no 4, 2020 | doi: 10.5365/wpsar.2020.11.2.013 https://ojs.wpro.who.int/2 natoli et alinfluenza preparedness planning and the response to covid-19 preparedness.10 well-prepared communities, empowered to take action when a threat is detected, are critical to determining if health risks escalate from a local containable outbreak to national and regional threats. the return on investment is incontestable.11 references 1. iuliano ad, roguski km, chang hh, muscatello dj, palekar r, tempia s, et al.; global seasonal influenza-associated mortality collaborator network. estimates of global seasonal influenza-associated respiratory mortality: a modelling study. lancet. 2018 mar 31;391(10127):1285–300. doi:10.1016/s0140-6736(17)332932 pmid:29248255 2. burmaa a, kamigaki t, darmaa b, nymadawa p, oshitani h. epidemiology and impact of influenza in mongolia, 2007-2012. influenza other respir viruses. 2014 sep;8(5):530–7. doi:10.1111/ irv.12268 pmid:25043147 3. global influenza strategy 2019–2030. geneva: world health organization; 2019. 4. epidemic control for volunteers: a training manual. geneva: international federation of red cross and red crescent societies; 2008. available from: https://www.ifrc.org/global/publications/health/ epidemic-control-en.pdf 5. teasdale e, santer m, geraghty aw, little p, yardley l. public perceptions of non-pharmaceutical interventions for reducing transmission of respiratory infection: systematic review and synthesis of qualitative studies. bmc public health. 2014 jun 11;14(1):589. doi:10.1186/1471-2458-14-589 pmid:24920395 6. erkhembayar r, dickinson e, badarch d, narula i, warburton d, thomas gn, et al. early policy actions and emergency response to the covid-19 pandemic in mongolia: experiences and challenges [published online ahead of print, 2020 jul 23]. lancet glob health. 2020;8(9):e1234–41. doi:10.1016/s2214109x(20)30295-3 7. coronavirus disease (covid-19) weekly epidemiological update. geneva: world health organization; 30 august 2020. available from: https://www.who.int/docs/default-source/coronaviruse/situation-reports/20200831-weekly-epi-update-3.pdf, accessed 7 september 2020. 8. burki t. ebola in the democratic republic of the congo: 1 year on. lancet infect dis. 2019 aug;19(8):813–4. doi:10.1016/s14733099(19)30360-3 pmid:31345457 9. from words to action: towards a community-centred approach to preparedness and response in health emergencies. geneva: international federation of red cross and red crescent societies; 2019. available from: https://apps.who.int/gpmb/assets/thematic_papers/ tr-5.pdf 10. jacobsen kh. will covid-19 generate global preparedness? lancet. 2020 mar 28;395(10229):1013–4. doi:10.1016/s01406736(20)30559-6 pmid:32199074 11. international working group on financing preparedness. from panic and neglect to investing in health security. financing pandemic preparedness at a national level. washington, dc: world bank group; 2017. available from: https://documents.worldbank.org/ curated/en/979591495652724770/pdf/115271-revised-finaliwg-report-3-5-18.pdf tion preferences highlighted gaps in the mrcs approach, and it has resulted in greater use of television and radio to better reach herder communities. the covid-19 pandemic underscores the importance and value of investing in epidemic preparedness planning well in advance of disease outbreaks. thus far, mongolia has effectively contained covid-19 through a proactive and comprehensive public health response that acknowledges and values the role of the community and community-based organizations in health promotion and disease prevention.6 as of 30 august 2020, mongolia had reported 301 cases of covid-19 and no community transmission.7 as we have seen with other epidemics,8 community volunteers working to advance health literacy can play a vital role in epidemic disease prevention, detection and response. however, it takes time and resourcing to train and equip them with the necessary skills and communication materials, and for them to gain the trust and respect of their community peers and build necessary credibility to be listened to when outbreaks occur.9 similarly, strong organizational partnerships do not develop overnight, but once in place they can be effectively leveraged when emergencies occur. the partnership between mrcs and the ministry of health established through the influenza experience resulted in greater recognition of the organization’s epidemic preparedness and response “value add” through its vast volunteer network – and ultimately in mrcs being assigned responsibility for community-level health communication and psychosocial support in the covid-19 response. to date more than 2000 volunteers have shared prevention messages and provided reassurance and support to more than 290 000 people, and assisted more than 7000 repatriated nationals in home quarantine (which occurs for several weeks following centralized quarantine in government facilities); support to those in home quarantine includes two social welfare checks per week providing social connection and reassurance, practical help (for example, grocery shopping), reinforcement of prevention messages and referral to formal mental health services if needed. the covid-19 pandemic is a reminder of the need to intensify and sustain the commitment to public health https://doi.org/10.1016/s0140-6736(17)33293-2 https://doi.org/10.1016/s0140-6736(17)33293-2 https://www.ncbi.nlm.nih.gov/entrez/query.fcgi?cmd=retrieve&db=pubmed&list_uids=29248255&dopt=abstract https://doi.org/10.1111/irv.12268 https://doi.org/10.1111/irv.12268 https://www.ncbi.nlm.nih.gov/entrez/query.fcgi?cmd=retrieve&db=pubmed&list_uids=25043147&dopt=abstract https://www.ifrc.org/global/publications/health/epidemic-control-en.pdf https://www.ifrc.org/global/publications/health/epidemic-control-en.pdf https://doi.org/10.1186/1471-2458-14-589 https://www.ncbi.nlm.nih.gov/entrez/query.fcgi?cmd=retrieve&db=pubmed&list_uids=24920395&dopt=abstract https://www.who.int/docs/default-source/coronaviruse/situation-reports/20200831-weekly-epi-update-3.pdf?sfvrsn=d7032a2a_4 https://www.who.int/docs/default-source/coronaviruse/situation-reports/20200831-weekly-epi-update-3.pdf?sfvrsn=d7032a2a_4 https://doi.org/10.1016/s1473-3099(19)30360-3 https://doi.org/10.1016/s1473-3099(19)30360-3 https://www.ncbi.nlm.nih.gov/entrez/query.fcgi?cmd=retrieve&db=pubmed&list_uids=31345457&dopt=abstract https://apps.who.int/gpmb/assets/thematic_papers/tr-5.pdf https://apps.who.int/gpmb/assets/thematic_papers/tr-5.pdf https://doi.org/10.1016/s0140-6736(20)30559-6 https://doi.org/10.1016/s0140-6736(20)30559-6 https://www.ncbi.nlm.nih.gov/entrez/query.fcgi?cmd=retrieve&db=pubmed&list_uids=32199074&dopt=abstract https://documents.worldbank.org/curated/en/979591495652724770/pdf/115271-revised-final-iwg-report-3-5-18.pdf https://documents.worldbank.org/curated/en/979591495652724770/pdf/115271-revised-final-iwg-report-3-5-18.pdf https://documents.worldbank.org/curated/en/979591495652724770/pdf/115271-revised-final-iwg-report-3-5-18.pdf tuberculosis case-finding in cambodia: analysis of case notification data, 2000 to 2013 surveillance report fukushi morishita,a valérie burrus furphy,b miwako kobayashi,b nobuyuki nishikiori,a mao tan eangc and rajendra-prasad yadavb a world health organization regional office for the western pacific, manila, philippines. b office of the who representative in cambodia, phnom penh, cambodia. c national center for tuberculosis and leprosy control, ministry of health, phnom penh, cambodia. correspondence to fukushi morishita (e-mail: morishita.fukushi@gmail.com). to cite this article: morishita f et al. tuberculosis case-finding in cambodia: analysis of case notification data, 2000 to 2013. western pacific surveillance and response journal, 2015, 6(1):15–24. doi:10.5365/wpsar.2014.5.4.005 abstract the routine tuberculosis (tb) surveillance system in cambodia has been strengthened under the national tb programme (ntp). this paper provides an overview of the tb surveillance data for cambodia at the national level for the period 2000 to 2013 and at the subnational level for 2013. the proportion of the total population that were screened for tb rose from 0.4% in 2001 to 1.1% in 2013, while the smear-positivity rate decreased from 28.9% to 8.1% in the same period. the total number of notified tb cases increased steadily from 2000; this has stabilized in recent years with 39 055 cases notified in 2013. the proportion of all tb cases that were smear-positive decreased from 78% in 2000 to 36% in 2013. case notification rates (cnrs) for all forms of tb and new smear-positive tb in 2013 were 261 and 94 per 100 000 population, respectively. higher cnrs were found in the north-west and south-east parts of the country and were higher for males especially in older age groups. the increase in tb screening, decline in the smear-positive rate and decline in notified smear-positive tb cases likely reflect a long-term positive impact of the ntp. a negative correlation between the proportion of the population screened and the smear-positivity rate at the subnational level helped identify where to find undiagnosed cases. subnational differences in case notification of the elderly and in children provide more specific targets for case-finding and further encourage strategic resource allocation. introduction surveillance was one of the five core components in the original world health organization (who) framework for effective tuberculosis control (the dots strategy).1 routine surveillance data can be used to assess disease burden and epidemiological trends as well as to identify underserved populations and potential outbreaks.2 its effective use is essential for informed programmatic decision-making.3 tuberculosis (tb) programmes establish and maintain a recording and reporting (r&r) system with regular communication between the central and peripheral levels of the health system as its surveillance system.1,2,4 since the relaunch of the national tb programme (ntp) in 1994, cambodia has strengthened its routine tb surveillance system.5,6 as in many other countries, cambodia’s ntp has adopted a case-based registry and cohort monitoring of treatment outcomes using standardized tools in line with the who-recommended r&r framework.4 recognizing the importance of evidence-based policy and practice in public health, cambodia’s ntp has invested substantial efforts and resources in quarterly data collection and the periodic analysis of routine surveillance data and its documentation at the national level while intensifying subnational data analysis.5 this paper provides an overview of tb case-finding in cambodia at the national level for 2000 to 2013 and the subnational level for 2013. methods we performed a retrospective descriptive analysis of tb case-finding in cambodia using routine tb surveillance data sourced from the national tb database. the data were analysed by disease category, demographic variables and geographical areas. in the cambodian health system, the basic organizational and reporting unit is an operational district (od), which also serves as a basic management unit of the tb programme. each od provides services through health centres and district referral hospitals to an average population of 180 000.7 the standardized data collection of the tb surveillance system operates in a stepwise approach in accordance with the who-recommended r&r framework.4,8 a tb case register comprising a line listing of individual patient records is kept at the health centre level. this is regularly consolidated into an od tb register that references all notified cases within the od. although provinces play a certain role within the reporting line, the od tb register is the basis of a quarterly tb report from which data are entered into several national databases including case notification data by age/sex and patient/disease category, treatment outcomes and laboratory data. the disaggregated national databases, which are maintained in excel, were consolidated for analysis and producing tables and figures. qgis 2.2 software (gnu general public license, 2013) was used to produce maps depicting geographical distribution of case notification rates (cnrs). we defined a population-screening rate as the number of suspected tb cases examined by smear microscopy divided by the total population in each year. the population-screening rate is used as a proxy to assess case-finding efforts. the smear-positivity rate was defined as the number of positive slides divided by the total number of slides examined for tb diagnosis. the smear-positivity rate is also a useful indicator to assess the impact of the programme in reducing tb prevalence.9 national population data were sourced from the who global tb database; subnational population data were sourced from the cambodian health management information system. age-specific and province-specific population data were sourced from the projected population in the census. pearson’s correlation coefficient was used to determine any correlation between smear-positivity rate and population-screening rate, adult and childhood tb notifications and elderly and non-elderly tb notifications. ethics clearance was not required as this report used routinely available data and no personal identifying information was collected. results tb screening and smear-positivity rate the population-screening rate for tb at the national level rose from 0.4% in 2001 to 1.1% in 2013, while the smear-positivity rate decreased from 28.9% to 8.1% over the same period (figure 1). by province, the population-screening rate ranged from 0.3% in kep to 2.5% in prey veng, whereas the smear-positivity rate ranged from 2.7% in prey veng to 17.5% in kep. there was a negative correlation between these two indicators (pearson’s correlation coefficient –0.71, p figure 2). figure 1. population-screening rate and smear-positivity rate for tb, cambodia, 2001–2013 click to download figure 1. jpg, 261kb note: population-screening rate: the number of suspected tb cases examined by smear microscopy divided by the total population in each year. smear-positivity rate: the number of positive slides divided by the total number of slides examined for tb diagnosis. figure 2. scatterplot of population-screening rate and smear-positivity rate by province, cambodia, 2013* click to download figure 2. jpg, 380kb * population-screening rate = the number of suspected tb cases examined by smear microscopy divided by the total population in each year. smear-positivity rate = the number of positive slides divided by the total number of slides examined for tb diagnosis. national tb case notification the total number of notified cases increased steadily from 19 007 to 41 628 between 2000 and 2010 (figure 3a) and stabilized in recent years with 39 055 cases notified in 2013. notifications of extrapulmonary and smear-negative cases have increased consistently; since 2005, notifications of smear-positive cases have decreased (figures 3a and 3b). the proportion of new smear-positive cases of all tb notifications decreased from 78% in 2000 to 36% in 2013 (figure 3b). in 2013, the national cnr for all forms of tb and smear-positive tb were 261 and 94 per 100 000 population, respectively (figure 3c). figure 3a. number of tb notifications by category, cambodia, 2000–2013 click to download figure 3a. jpg, 364kb figure 3b. proportion of tb notifications by category, cambodia, 2000–2013 click to download figure 3b. jpg, 274kb figure 3c. case notification rates for all forms of tb and smear-positive tb, cambodia, 2000–2013 click to download figure 3c. jpg, 191kb in every year from 2011 to 2013, the highest number of notifications of new smear-positive tb was reported in the 45–54 year age group (figure 4). males had higher sex-specific cnrs compared with females, especially in the older age groups; males had nearly twice the cnr rate as females in the same age group (figure 4). the highest rate was found in males aged over 65 years in 2013 at 618 per 100 000 population, more than six times higher than the total cnr for 2013 at 94 per 100 000 population. figure 4. number and case notification rate of new smear-positive tb cases by age and sex, cambodia, 2011–2013 click to download figure 4. jpg, 365kb subnational tb case notification there are considerable differences between provinces in cnr (figure 5). for all forms of tb, mondolkiri had the lowest cnr at 62 per 100 000 population; svay rieng’s cnr was more than seven times higher at 477 per 100 000 population. the percentage of smear-positive cases among new pulmonary cases ranged from 42.2% to 90.0% by province compared with the national figure of 60.8% (table 1). figure 5. case notification rates for all forms of tb and new smear-positive tb by province, cambodia, 2013 click to download figure 5. jpg, 384kb note: the gray bars indicate those that are below national average while the blue bars indicate those that are above national average. table 1. number of notified tb cases by category and province, cambodia, 2013 click to download table 1. jpg, 464kb ods with high cnrs were found in the north-west and south-east parts of the country (figure 6); these are areas with major population concentration and movement within the country and high cross-border migration from and into thailand and viet nam. figure 6. case notification rates for all forms of tb and new smear-positive tb by operational district, cambodia, 2013 click to download figure 6. jpg, 861kb tb notifications in the elderly in 2013, elderly people (aged 55 or over) accounted for 37% of new smear-positive tb notifications; cnrs of smear-positive tb in the elderly and non-elderly (people aged 54 or less) were 347 and 66 per 100 000 population, respectively. by province, there was a positive correlation between elderly and non-elderly cnrs (pearson’s correlation coefficient 0.79, p figure 7). there were some provinces that had very different cnrs in these two groups, including rattanakiri (109 per 100 000 for the elderly and 37 per 100 000 for the non-elderly) and odor meanchey (533 per 100 000 for the elderly and 83 per 100 000 for the non-elderly). figure 7. scatterplot of elderly and non-elderly case notification rates for new smear-positive tb by province, cambodia, 2013 click to download figure 7. jpg, 403kb note: age-specific, province-specific population data were sourced from the projected population for 2013 in the 2008 census and used for the cnr calculation. tb notifications in children the ntp has expanded childhood tb services in recent years; in 2013, 13 of the 24 provinces routinely provide childhood tb services including case-finding, case management, contact tracing and provision of isoniazid preventive therapy. in 2013, the total number of tb notifications in children was 6916 (17.7% of all notified tb cases), of which 87.0% and 12.1% were extrapulmonary and smear-negative, respectively. the proportion of tb in children among total notifications ranged from 1.3% to 39.4% across provinces (table 2). pailin city had the highest proportion (39.4%) followed by banteay meanchey (36.3%) and battambang (33.5%). table 2. number of notified tb cases in children by province, cambodia, 2013 click to download table 2. jpg, 508kb cnrs of adults and children by province were weakly correlated (pearson’s correlation coefficient 0.34, p figure 8), suggesting the scale of case-finding and registration activities for childhood tb relative to those for adult tb varies across provinces. although provinces such as siem reap and svay rieng had high cnrs in adults, they had relatively low cnrs in children (figure 8). figure 8. scatterplot of tb case notification rate in adults and children by province, cambodia, 2013 click to download figure 8. jpg, 375kb red dots represent provinces with routine childhood tb services available in 2013 while, blue dots represent provinces with routine childhood tb services unavailable in 2013. discussion this analysis of routine tb surveillance data revealed several key findings that demonstrated improved programmatic indicators at the national level while highlighting some subnational gaps. a decrease in new smear-positive cases provides some indication of the long-term impact of cambodian’s ntp. case notifications can be driven by various determinants such as changes in case-finding efforts, laboratory quality and capacity, r&r systems, case notification system as well as underlying tb incidence.10 while recognizing multiple contributors, the decrease of new smear-positive tb in cambodia is likely due to the continued efforts of the ntp to detect and treat the most infectious cases through nationwide dots expansion. the national prevalence survey 2011 reported a 38% reduction of smear-positive tb prevalence from 2002 to 2011.11 the decrease in the smear-positivity in spite of rise in population-screening rate could be another indication of the reduced prevalence of smear-positive cases. the increase in smear-negative and extrapulmonary tb notifications could be explained by multiple epidemiological and operational factors including the expansion of childhood tb services, nationwide implementation of targeted active case-finding using mobile x-ray equipment and improved accessibility to x-ray and biopsy services through the decentralization of tb services. increases in smear-negative notifications could also indicate a reduction in the most infectious cases in the community. despite the significant reduction in the prevalence of smear-positive tb, the 2011 national prevalence survey found a twofold higher prevalence of smear-negative, culture-positive (sncp) cases.11 however, the notifications of smear-negative tb in 2013 was less than that of smear-positive tb (9069 vs 14 082), suggesting that many sncp cases are still undiagnosed within the current routine diagnostic algorithm. to detect these undiagnosed sncp cases, the existing diagnostic tool should be strengthened, for example, by promoting widespread use of x-ray and xpert mtb/rif assay, ensuring cost–effectiveness. subnational analysis can help identify areas with possible undiagnosed cases. wong et al. found a negative association between household poverty rates and smear-positive cnr in cambodia and highlighted the potential to geo-target areas with high poverty rates for case-finding.7 our subnational analysis, comparing population-screening rates and smear-positivity rates, provided additional criteria for geo-targeted case-finding. provinces with a low population-screening rate yet a high smear-positivity rate can still strengthen case-finding to help reduce the smear-positivity rate. prioritizing these areas may ensure more effective case-finding. elderly tb cases accounted for 37% of the total notifications in 2013. this was lower than the 55% of smear-positive cases reported for the elderly during the 2011 national prevalence survey,11 suggesting that many elderly cases may still be undiagnosed. we reported on provinces with lower elderly cnrs relative to non-elderly cnrs that may have many undiagnosed elderly tb cases. these provinces may therefore benefit from interventions that systematically screen the elderly for tb. internationally, the proportion of tb in children among total notifications varies from 3% to more than 25%.12 through rapidly expanding childhood tb services in cambodia’s ntp, the proportion of tb notifications in children in 2013 reached 17.7% of all notifications; however, subnational differences exist. differences at the subnational level in the proportion of childhood tb, as well as cnrs in children relative to cnrs in adults, may help identify areas with possible over-diagnosis or underreporting. for instance, provinces with high cnr in adults but low cnr in children may have many undiagnosed or unreported childhood tb cases. in cambodia, where the role of the private sector in public health programmes has been rapidly expanding, engagement of the private sector in national tb surveillance system needs strengthening. given the complexity in diagnosing childhood tb that requires thorough assessment of all evidence,13 possible over-diagnosis of tb in children should be investigated in provinces with high cnrs in children but relatively low cnrs in adults. there are some inherent limitations in using surveillance data. although the ntp has a strengthened r&r system, including training and supervision, the reliability of the data is heavily dependent on local facility and staff capacity. operational challenges in nationwide data collection using paper-based forms and manual data entry might have led to inconsistencies in some of the data reported. while public-private mix initiatives to control tb have recently expanded, tb patients diagnosed in the private sector may not be notified to the ntp, limiting the capture of all tb cases. tb notification may not be a direct measure or close proxy of tb incidence, particularly when the level of case detection is insufficient.3,7 in many developing countries, tb surveillance data is often underutilized despite substantial resources invested in the data collection and its availability. for effective use of surveillance data, subnational analysis should be strengthened as it can provide robust evidence to set criteria for geo-targeted case-finding. if combined with a demographic-targeted approach, the subnational analysis enables the progamme to target a more specific segment of the population, which further encourages strategic resource allocation. however, strengthening data quality and management is of particular importance at every level to ensure reliability and validity of the analysis. increasing efforts should be encouraged to create and maintain a well designed database enabling systematic data entry and analysis. similarly, existing data verification tools and methods to ensure internal/external consistency of surveillance data should be actively employed.14 development of innovative tools to reproduce graphics and tables could further facilitate the periodic data analysis and dissemination at different operational levels, which helps motivate programme staff in their routine activities. finally, the ultimate goal of such analyses is to explore reasons behind the findings and inform corrective actions, always involving diverse voices from the field. conflicts of interest none declared. funding none. acknowledgements the authors wish to thank all health-care workers at the front lines of service delivery of tb diagnosis and treatment in cambodia. the authors extend our thanks to all staff members of the national and subnational tuberculosis programmes of cambodia for their tremendous efforts in data collection and reporting. references: the stop tb strategy. building on and enhancing dots to meet the tb-related millennium development goals. geneva, world health organization, 2006. available from: http://www.who.int/tb/publications/2006/stop_tb_strategy.pdf [accessed 28 january 2015]. nishikiori n, morishita f. using tuberculosis surveillance data for informed programmatic decision-making. western pacific surveillance and response journal, 2013, 4:1–3. doi:10.5365/wpsar.2013.4.1.007 pmid:23908948 castro kg. tuberculosis surveillance: data for decision-making. clinical infectious diseases, 2007, 44:1268–1270. doi:10.1086/514351 pmid:17443461 revised tb recording and reporting forms and registers – version 2006. geneva, world health organization, 2006. available from: http://www.who.int/tb/ err/rr_final_forms_en.pdf [accessed 28 january 2015]. tuberculosis report 2013 – kingdom of cambodia. phnom penh, national center for tuberculosis and leprosy control, ministry of health, 2014. hill ps, tan eang m. resistance and renewal: health sector reform and cambodia’s national tuberculosis programme. bulletin of the world health organization, 2007, 85:631–636. doi:10.2471/blt.06.036822 pmid:17768522 wong mk et al. the association between household poverty rates and tuberculosis case notification rates in cambodia, 2010. western pacific surveillance and response journal, 2013, 4:25–33. doi:10.5365/wpsar.2013.4.1.002 pmid:23908952 revised definitions and reporting framework for tuberculosis. geneva, world health organization, 2013. available from: http://apps.who.int/iris/bitstream/10665/ 79199/1/9789241505345_eng.pdf [accessed 28 january 2015]. frieden t, editor. toman’s tuberculosis case detection, treatment and monitoring: questions and answers, second edition. geneva, world health organization, 2004. available from: http://whqlibdoc.who.int/publications/2004/9241546034.pdf [accessed 28 january 2015]. tuberculosis in the region of the americas – regional report 2011 epidemiology, control and financing. washington, dc, pan american health organization, regional office for the americas of the world health organization, 2012. available from: http://www.paho.org/hq/index.php?option=com_docman &task=doc_view&gid=22953&itemid= [accessed 28 january 2015]. report: second national tuberculosis prevalence survey cambodia, 2011. phnom penh, national center for tuberculosis and leprosy control, ministry of health, 2012. guidance for national tuberculosis programmes on the management of tuberculosis in children. geneva, world health organization, 2006. available from: http://whqlibdoc.who.int/hq/2006/who_htm_tb_2006.371_eng.pdf [accessed 28 january 2015]. guidance for national tuberculosis programmes on the management of tuberculosis in children, second edition. geneva, world health organization, 2014. available from: http://apps.who.int/medicinedocs/documents/s21535en/s21535en.pdf [accessed 28 january 2015]. standards and benchmarks for tuberculosis surveillance and vital registration systems: checklist and user guide. geneva, world health organization, 2014. available from: http://apps.who.int/iris/bitstream/10665/112673/1/ 9789241506724_eng.pdf [accessed 28 january 2015]. wpsar vol 12, no 4, 2021 | doi: 10.5365/wpsar.2021.12.4.835https://ojs.wpro.who.int/ 1 capacity of sari management in viet namdat et al appendix fig. 1. flow chart of study population patients admitted to participating ccus during the 14-day study periods n = 1759 patients presenting to 32 district ccus n = 929 (53.9%) patients with sari included in analysis n = 395 assessment at 7 days after admission missing information* n = 37 (2.1%) sari cases n = 247 (26.6%) other diagnoses n = 682 (73.4%) other diagnoses n = 645 (81.3%) sari cases n = 148 (18.7%) transferred n = 36 (9.1%) death n = 26 (6.6%) discharged n = 140 (35.4%) ccu stay > 7 days n = 193 (48.9%) patients presenting to 16 provincial ccus n = 793 (46.1%) * missing information on diagnosis and/or time of symptom onset. quality microbiological diagnostics and antimicrobial susceptibility testing, an essential component of antimicrobial resistance surveillance and control efforts in pacific island nations lessons from the field john kenneth ferguson,a jacklyn joseph,b samson kangapu, b hilda zolevekec nicola townell,d trevor duke,e,f laurens manning,g evelyn lavuh a school of biomedical sciences and pharmacy, university of newcastle, callaghan, australia. b port moresby general hospital, port moresby, papua new guinea. c national referral hospital, honiara, solomon islands d infectious disease department, sunshine coast university hospital, queensland, australia. e centre for international child health, department of paediatrics, university of melbourne, australia. f school of medicine, university of papua new guinea, port moresby, papua new guinea. g school of medicine, university of western australia, harry perkins research institute, fiona stanley hospital, western australia, australia. h central public health laboratory and university of papua new guinea, port moresby, papua new guinea. correspondence to john ferguson (email: john.ferguson@health.nsw.gov.au). to cite this article: ferguson jk, joseph j, kangapu s, zoleveke h, townell n, duke t, et al. quality microbiological diagnostics and antimicrobial susceptibility testing, an essential component of antimicrobial resistance surveillance and control efforts in pacific island nations. western pac surveill response j. 2020 feb;11(1). doi:10.5365/wpsar.2018.9.3.004 problem: emerging bacterial antimicrobial (antibiotic) resistance (amr) is a global threat to human health. however, a majority of lower income countries do not have microbiological diagnostic testing for prompt, reliable confirmation of bloodstream infection and identification of amr. context: clinicians in pacific island nations are increasingly challenged by patients who have infection due to antimicrobial-resistant bacteria. treatment of infection remains empirical because of a lack of diagnostic testing capacity and may follow guidelines that were formulated without reference to local measures of amr prevalence. there is limited understanding among clinicians of microbiology testing and test interpretation. action: examine the lessons learnt from pilot laboratory development programmes in two pacific island nations that focused on establishing standard procedures for micrological diagnostics and antimicrobial susceptibility testing (ast) and on improving the training of clinicians to increase their use of laboratory services. outcome: the pilot programmes addressed a range of logistical difficulties and evaluated two blood culture systems. they also examined and improved internal qc implementation and evaluated the prevalence of amr. discussion: continued development of microbiological diagnostic capability in the pacific region is paramount. pacific island nations need to develop the capability of at least one central laboratory to culture amr pathogens and subject them to quality-controlled ast or arrange for suitable referral to a nearby country. problem antimicrobial resistance (amr) is a major threat to human health.1,2 patients with sepsis who are treated with an antimicrobial for which the causative pathogen is non-susceptible have an increased risk of mortality.2 the world health organization (who) global antimicrobial surveillance system prioritizes the following bacterial pathogens, commonly associated with resistance, for surveillance: mycobacterium tuberculosis, escherichia coli, klebsiella pneumoniae, shigella, salmonella, neisseria gonorrhoeae, acinetobacter baumannii, pseudomonas aeruginosa, staphylococcus aureus and streptococcus pneumoniae.3 resistance to these pathogens is associated with poor response to treatment, prolonged hospitalization and excess mortality.4 knowledge of bacterial antimicrobial susceptibility testing (ast) patterns is the cornerstone of an effective clinical and public health response to amr. reliable ast results are decision-making support tools that enable clinicians to prescribe appropriate antibiotics for patients. as a public health tool, ast data that describe the prevalence, geographic distribution and temporal trends of resistant pathogens should inform standard treatment guidelines that are developed in the pacific region. a lack of laboratory infrastructure and microbiological expertise in many pacific island nations has made amr surveillance unreliable. most published data are based on studies from major hospitals without details of quality control (qc),5,6 or the testing standard used.7 in addition, external to the laboratory, pre-analytical factors such as proper specimen selection and collection are often deficient. reliably sensitive blood culture systems are generally unavailable, preventing effective diagnosis of severe bacterial infection and greatly impeding amr surveillance.8 this manuscript aims to examine the importance of quality bacterial culture and antimicrobial susceptibility for clinician guidance and for effective amr surveillance. it highlights important ast concepts that are perhaps poorly understood by laboratory and clinical staff in many pacific island nations. it examines lessons learnt from pilot laboratory development programmes based in solomon islands and papua new guinea (png) and discusses recent amr surveillance data from port moresby general hospital in png. context citizens of pacific island nations are particularly vulnerable to the consequences of amr. the burden of infection, in both the community and the hospital, is high, and appropriate treatment of antimicrobial-resistant infections often require prolonged treatment with expensive antibiotics that may not be available. infection with resistant organisms results in longer hospital stays that increase the risk of further complications such as nosocomial infection (e.g. health care–associated pneumonia). many hospitals in this region have limited infection prevention and control systems, and multiresistant organisms are frequently spread by health-care staff with unclean hands and fomites (e.g. contaminated, reused equipment, stethoscopes, clothing) and through contact with contaminated environments. in many pacific island nations, antibiotic use during health-care attendances is high, and common antibiotics may be purchased without prescription at markets. unregulated antibiotic use in the agricultural sector occurs. contamination of stream and tank water with enteric bacteria, including salmonella typhi, is documented within the region.9 increasing international travel provides another risk factor for amr acquisition and spread. taken together, these factors promote the emergence, acquisition and transmission of antimicrobial-resistant pathogens. who has facilitated the development of national amr plans that emphasize the importance of regional laboratories (serving human and animal health sectors) that are able to reliably perform bacterial culture and ast supported by an amr reference laboratory that orchestrates qc measures and operates an external quality assurance (eqa) programme.3 how does quality microbiological culture and ast enable better patient care? where health literacy is low and infection rates are high, patients often present with severe infection due to delayed presentation and neglected co-morbidities. effective diagnostic testing is an essential addition to the clinical assessment. culture and ast of the infecting pathogen allow the clinician to modify treatment to adequately target a pathogen and ensure effective, definitive antimicrobial therapy. this improves patient outcomes and reduces mortality.10 therapeutic changes may involve moving to a narrow spectrum antimicrobial (e.g. benzylpenicillin or flucloxacillin) for susceptible isolates or using a broader spectrum agent when culture and ast demonstrate a resistant organism (e.g. extended-spectrum β-lactamase [esbl; ceftriaxone resistant] producing klebsiella or related species or methicillin [flucloxacillin-resistant staphylococcus aureus [mrsa]). what are the meanings of minimum inhibitory concentration and clinical breakpoint? due to the lack of medical microbiologists and limited scientific awareness of microbiology in most pacific island nations, there is value in explaining these concepts. the minimum inhibitory concentration (mic) indicates the particular antimicrobial concentration (mg/l) that is required to inhibit growth of the infecting organism in the laboratory. the mic test is performed by exposing a bacterial isolate inoculated into broth to decreasing dilutions of the antimicrobial. after incubation, the broth well with the lowest antimicrobial concentration without bacterial growth (i.e. clear) becomes the mic value. there are two standards organizations, the clinical and laboratory standards institute (clsi)11 and the european committee of antimicrobial susceptibility testing (eucast),12 that specify use of the same international mic testing reference standard (international standards organization 20776–1).13 by considering a wide range of laboratory and clinical evidence for each bacterial species and antibiotic, each organization defines an mic value that represents the clinical breakpoint that divides isolates into susceptible and non-susceptible (resistant) categories. if an isolate tests as non-susceptible to an antimicrobial, then treatment of a clinical infection with that drug is likely to fail. the clinical breakpoints determined by the two organizations may differ for the same antibiotic and organism combination because of differing processes of deliberation. it is important to specify the standard in use and reference the updates to clinical breakpoint tables that are published by eucast and clsi every january. clinical breakpoints are also set for other ast methods such as disc susceptibility testing derived by comparison with the iso standard mic test. how is ast usually performed? disc susceptibility is the most commonly used method in the pacific region (fig. 1). a disc containing a quantity of antimicrobial is placed onto an agar plate that has been seeded with the organism in question. after 18 hours of incubation, the antibiotic will inhibit growth of the organism resulting in a zone of absent growth. if the measured zone of inhibition is larger than the prespecified clinical breakpoint zone size, this indicates that the organism can be reported as susceptible to that drug. click to download figure 1. jpg, 314kb what challenges occur with ast? there are many variables that affect the ast result, potentially causing error (e.g. a resistant isolate being reported as susceptible). the agar growth medium requires preparation with consistent quality of ingredients and thickness, and each batch requires qc for sterility and its ability to support growth of control organisms. blood-containing media are required for some species (e.g. streptococcus pneumoniae and haemophilus influenzae), which remains problematic where required sheep or horse blood is unavailable. expired human blood is therefore used widely in the pacific region; however, this is not an appropriate substitute. the incubation temperature and duration must be correct. antimicrobial discs must be in-date, of the right strength and stored correctly to avoid degradation. discs from certain manufacturers have variable quality, highlighting the need to obtain them from reliable sources.14 the technician reading the ast must ensure that the disc inhibition zone is measured and interpreted correctly. action laboratory capacity development in png (at port moresby general hospital [pmgh]) and in honiara, solomon islands by the pacific region infectious diseases association has focused on improving the training of scientists and establishing standard procedures for the microbiology service. commercial blood culture systems have been introduced to increase positive culture detection and reduce the turnaround time (reduced from 5 days to 2 days). clinician education concerning the effective use of blood cultures, amr and its detection has been conducted as a prelude to the introduction of hospital antimicrobial stewardship. internal qc systems have been introduced to provide assurance that ast results are correct. all antimicrobial discs are tested against qc bacterial strains weekly. if the tested zone size is within a specified range, then the process is controlled and the laboratory can issue a valid result. both laboratories participate in eqa to regularly test unknown isolates from a reference organization. outcome logistics a range of issues have had to be addressed, including ordering and supply of consumables and availability of serviced incubators and fridges. the electricity supply has not been a limiting factor in these sites to date. regular visits and teleconference support to train and mentor technical and scientific staff and assist with supervision by the in-charge pathologist have been useful. development of standard operating procedures, in collaboration with scientific staff, and more general quality management systems have also been important. the who approach to stepwise implementation of laboratory quality management systems has been useful. sheep or horse blood for production of blood-containing agar media is generally unavailable. most laboratories are substituting expired, donated human blood. however, such media usually fail to grow important organisms such as streptococcus pneumoniae and neisseria gonorrhoeae. commercial blood culture systems evaluation of the automated blood culture system bactec (becton dickinson company, franklin lakes, nj, usa) at pmgh from 2016 to 2017 revealed blood culture detection rates for significant pathogens of 8.4% in adults and 6.0% in children. these rates were significantly higher than those obtained with in-house media and pathogens were isolated more rapidly. the 2018 data from solomon islands using the bact/alert® (biomerieux company, norwest nsw, australia) system found a detection rate of 5.8%. contamination rates were too high (adults, 7%; children, 15%) at pmgh and 8.8% in honiara, solomon islands, highlighting the need for further effort and training to improve specimen collection practices. internal qc implementation challenges included identification and maintenance of a −80 °c freezer for qc bacterial strain storage and implementation of correct handling procedures for master and working cultures of qc strains. maintaining scientific supervision of qc testing to ensure it is properly performed regularly and that results are formally reviewed and acted on. qc troubleshooting: an important example was that of gentamicin susceptibility at pmgh, where the zone size was persistently below the expected range. a new batch of gentamicin discs showed a correct zone size, indicating that the existing discs, although in-date, had lost potency and needed replacement. prevalence of amr the 2018 pmgh cumulative antibiogram showed rates of methicillin-resistant staphylococcus aureus (mrsa) of 39% to 60% across all groups (adult and paediatric, community and hospital locations). mrsa susceptibility for doxycycline and co-trimoxazole remained high. samoa and east timor have also recorded high rates of mrsa.7,15 the 2017 data from honiara, solomon islands indicated low rates of mrsa (2% of 53 isolates). at pmgh, 63% and 25% of gram-negative (e. coli, klebsiella and related species) isolates showed non-susceptibility to ceftriaxone in inpatients and outpatients, respectively, indicating high levels of esbl. ceftriaxone non-susceptible isolates were usually also non-susceptible to ciprofloxacin and gentamicin, and a minority were susceptible to chloramphenicol. esbl isolates are also prevalent in new caledonia, fiji and east timor.7,15,16 the 2017 data from honiara found non-susceptibility to ceftriaxone to be 15% (200 tested isolates). discussion continued development of microbiological diagnostic capability and reliability is paramount for clinicians and amr surveillance. owing to the unavailability of appropriate media, culture and ast of n. gonorrhoeae and s. pneumoniae are rarely performed. each pacific island nation needs to develop the capability for at least one central laboratory to culture these pathogens and subject them to quality-controlled ast or arrange for suitable referral to a nearby country. mrsa is common in pacific island nations, resulting in bone, joint, lung or blood-stream infections.6,15 while inclusion of vancomycin on essential medication lists has cost and logistical implications, it needs to be considered for management of proven mrsa bacteraemia and empirical management of severe sepsis. standard treatment guidelines will require revision, and clinicians will require education concerning the use and monitoring of vancomycin. rates of esbl across south-east asia and the pacific region nations have been high for more than 10 years and have been associated with sustained hospital, neonatal and intensive care outbreaks with high mortality.4 community carriage is common and is exacerbated by overuse of antibiotics and a lack of infection control resulting in hospital patient-to-patient transmission and subsequent nosocomial infection. where local data indicate high rates of ceftriaxone resistance, this agent cannot be relied upon for empirical use in situations where gram-negative pathogens predominate (e.g. urinary, intra-abdominal, biliary sepsis, nosocomial infection). meropenem, a carbapenem class of β-lactam antibiotic, that is not widely available in pacific island nations, is the recommended first-line option for treatment of esbl bloodstream infections.17 in line with recent who recommendations, meropenem should be incorporated into national essential drug lists. when meropenem becomes available, clinician education and restrictive measures will be required to ensure appropriate prescribing. overuse of meropenem leads to the emergence of meropenem-resistant, gram-negative species (carbapenemase-producing enterobacterales [cpe]). cpes have very limited treatment options due to multiresistance and are now prevalent in many world locations, especially in asia. pacific island nations will need to prepare for cpe emergence, including the ability to reliably detect cpe in laboratories. references fact sheet on antimicrobial resistance. geneva: world health organization; 2018 [cited 2019 sep 1]. available from: https://www.who.int/mediacentre/factsheets/fs194/en/ o’neill j. tackling drug-resistant infections globally: final report and recommendations; 2016 [cited 2019 sep 1]. available from: https://amr-review.org/ global antimicrobial resistance surveillance system. geneva: world health organization; 2016 [cited 2019 sep 1]. available from: https://www.who.int/antimicrobial-resistance/publications/surveillance-system-manual/en/ lithgow ae, kilalang c. outbreak of nosocomial sepsis in the special care nursery at port moresby general hospital due to multiresistant klebsiella pneumoniae: high impact on mortality. p n g med j. 2009 mar-jun;52(1-2):28–34. pmid:21125988 asa h, laman m, greenhill ar, siba pm, davis tm, maihua j, et al. bloodstream infections caused by resistant bacteria in surgical patients admitted to modilon hospital, madang. p n g med j. 2012 mar-dec;55(1-4):5–11. pmid:25338469 aglua ijj, drekore j, urakoko b, poka h, michael a, et al. methicillin-resistant staphylococcus aureus in melanesian children with haematogenous osteomyelitis from the central highlands of papua new guinea. int j pediatr. 2018;6(10):8361–70. available from: http://ijp.mums.ac.ir/article_10980_da0c6c035f708e78c19216cb10475413.pdf foxlee nd, townell n, mciver l, lau cl. antibiotic resistance in pacific island countries and territories: a systematic scoping review. antibiotics (basel). 2019 03 19;8(1):1–16. doi:10.3390/antibiotics8010029 pmid:30893880 ombelet s, ronat jb, walsh t, yansouni cp, cox j, vlieghe e, et al.; bacteriology in low resource settings working group. clinical bacteriology in low-resource settings: today’s solutions. lancet infect dis. 2018 aug;18(8):e248–58. doi:10.1016/s1473-3099(18)30093-8 pmid:29519767 horak hm, chynoweth js, myers wp, davis j, fendorf s, boehm ab. microbial and metal water quality in rain catchments compared with traditional drinking water sources in the east sepik province, papua new guinea. j water health. 2010 mar;8(1):126–38. doi:10.2166/wh.2009.233 pmid:20009255 huang ch, chiu ch, chen iw, hung sy, lin cw, hsu br, et al. antimicrobial resistance and outcomes of community-onset bacterial bloodstream infections in patients with type 2 diabetes. j glob antimicrob resist. 2018 dec;15:271–6. doi:10.1016/j.jgar.2018.08.008 pmid:30121344 clsi. clinical & laboratory standards institute [cited 2019 sep 1]. available from: https://clsi.org/ eucast. european committee on antimicrobial susceptibility testing [cited 2019 sep 1]. available from: http://www.eucast.org/ international standards organization 20776–1 susceptibility testing of infectious agents and evaluation of performance of antimicrobial susceptibility test devices; iso [cited 2019 sep 1]. available from: https://www.iso.org/standard/70464.html ahman j, matuschek e and kahlmeter g. the quality of antimicrobial discs from nine manufacturers-eucast evaluations in 2014 and 2017. clin microbiol infect. 2019 mar;25(3):346-52. doi:10.1016/j.cmi.2018.05.021 pmid:29886174 marr i, sarmento n, o’brien m, et al. antimicrobial resistance in urineand skin isolates in timor-leste. j glob antimicrob resist. 2017 dec 27. doi:10.1016/j.jgar.2017.12.010 pmid:29277727 naidu k, nabose i, ram s, et al. a descriptive study of nosocomial infections in an adult intensive care unit in fiji: 2011–12. j trop med. 2014:545160. doi:10.1155/2014/545160 pmid:25309601 rodriguez-bano j, gutierrez-gutierrez b, machuca i, et al. treatment of infections caused by extended-spectrum-beta-lactamase-, ampc-, and carbapenemase-producing enterobacteriaceae. clin microbiol rev. 2018 feb 14;31(2). doi:10.1128/cmr.00079-17 pmid:29444952 ongoing local transmission of dengue in japan, august to september 2014 brief report yuzo arima,a tamano matsui,a tomoe shimada,a masahiro ishikane,a kunio kawabata,a tomimasa sunagawa,a hitomi kinoshita,a tomohiko takasaki,b yoshio tsuda,c kyoko sawabec and kazunori oishia a infectious disease surveillance center, national institute of infectious diseases, tokyo, japan. b department of virology, national institute of infectious diseases, tokyo, japan. c department of medical entomology, national institute of infectious diseases, tokyo, japan. correspondence to yuzo arima (e-mail: arima@niid.go.jp). to cite this article: arima y et al. ongoing local transmission of dengue in japan, august to september 2014. western pacific surveillance and response journal, 2014, 5(4):27–29. doi:10.5365/wpsar.2014.5.3.007 in late august 2014, three autochthonous dengue cases were reported in japan. since then, as of 17 september 2014, a total of 131 autochthonous cases have been confirmed. while cases were reported from throughout japan, the majority were linked to visiting a large park or its vicinity in tokyo, and the serotype detected has been serotype 1. we report preliminary findings, along with the public health response activities, of the first documented autochthonous dengue outbreak in japan in nearly 70 years. dengue is an acute, mosquito-borne febrile illness caused by a flavivirus found widely in the asia-pacific region, particularly in south-east asia. while the most competent mosquito species for dengue virus transmission is believed to be aedes aegypti, aedes albopictus is also a competent vector present in much of japan during the warmer months. infection with dengue virus may cause fever, headache, muscle pain and/or rash but may also be mild or asymptomatic. while there is no specific treatment, with early and appropriate medical care, the likelihood of infections resulting in severe forms or death is rare. in japan, dengue has been a notifiable disease since april 1999. physicians are required to report demographic, clinical and exposure history information of laboratory-confirmed cases to the local public health centre that are then reported to the ministry of health, labour and welfare (mhlw) and the national institute of infectious diseases (niid).1 in recent years, approximately 200 imported cases of dengue (those that had onset after returning to japan following overseas travel) have been notified through national surveillance, the majority from south-east asia.2,3 while the last reported local transmission of dengue was during the 1940s,4 given the growing number of imported cases and the recent emergence of dengue in areas such as the united states of america,5 france6 and portugal,7 the re-emergence of dengue in japan had been a concern in recent years. a travel-associated german case was suspected to have been infected with dengue serotype 2 while in japan in summer 2013,8 and japan’s mhlw and niid have since been preparing guidelines to manage response activities in case of local transmission. on 27 and 28 august 2014, three autochthonous dengue cases, with no overseas travel, were reported from tokyo and saitama prefectures. all three reported that they had visited yoyogi park, a large (54 hectare) forested park in the centre of metropolitan tokyo and were bitten by mosquitoes there; illness onset was on 18, 20 and 24 august. mhlw alerted local public health authorities of the autochthonous cases and called for vigilance and timely reporting by clinicians; awareness also increased among the general public via both official mhlw and unofficial media channels. as of 17 september 2014, a total of 131 autochthonous cases have been reported; including cases that occurred before the initial three cases were detected (figure 1). while cases were reported from 17/47 japanese prefectures, the majority of cases (112/131 [85%]) were linked to yoyogi park or its vicinity. of the 131 cases, 74 (56%) were male and 57 (44%) female. the median age was 26 years (range 4–77). among both males and females, a large proportion were adolescents or young adults, with 42 (32%) in their 20s and 28 (21%) aged 10–19 years. among children and the elderly, the distribution was skewed towards males: 4/5 children under 10 years of age were boys and 10/11 persons aged 60 years and over were men. at the time of reporting, the majority had mild symptoms such as fever, myalgia and arthralgia. no fatalities have been reported. sequence analysis of viral genomes presented high similarity with dengue serotype 1 viruses circulating in south-eastern asia.9 figure 1. reported number of locally acquired laboratory-confirmed dengue cases in japan by date of onset and suspected location of transmission, 1 august to 17 september 2014 (n = 128*) click to download figure 1. jpg, 411kb * yoyogi park visits, n = 112; non-yoyogi parks visits, n = 16. dengue virus has also been detected from mosquitoes collected in yoyogi park. after enhancing vector surveillance following the reporting of the initial cases, dengue virus was detected from mosquitoes captured on 3 september 2014 from 4/10 collection sites in the park.10 this finding was a first since the tokyo metropolitan government began testing mosquitoes captured from 16 collection sites in the tokyo metropolitan area in 2004. subsequently, dengue virus was also detected from a mosquito captured in shinjuku gyoen, a large park 2 km from yoyogi park, on 19 september; however, this park was already closed on 7 september.11 local and national public health authorities have been responding to the ongoing domestic transmission. risk communication messages have been disseminated via the internet and traditional means (e.g. public notices at the affected sites, newspapers, television), focusing on personal protection (reducing exposed areas of skin when outdoors and applying insect repellent) and on elimination of mosquito breeding sites. mhlw is actively providing such information12 and coordinating with local government counterparts in timely information collection. updated guidelines for clinical management of dengue have also been disseminated. niid, in coordination with partners, is providing technical support regarding virus testing and vector control, conducting risk assessments, epidemiological investigations and enhancing dissemination of information based on surveillance data. in addition, the tokyo metropolitan government enhanced vector surveillance, increasing collection sites in yoyogi park,10 and also temporarily closed the park on 4 september. vector control by adulticide application was carried out at yoyogi and several other parks in tokyo; investigations indicated mosquito populations in most parks were lower after vector control activities (unpublished data). there are important limitations, and it is unknown to what degree the magnitude of the current outbreak is due to enhanced awareness, surveillance, testing and/or reporting. it is also unknown when dengue emerged locally. while enhanced surveillance activities detected cases that occurred before the initial three cases, all cases detected so far have had onset since mid-august 2014, indicating that virus introduction may have taken place fairly recently. regardless, the confirmation of more than 100 domestically acquired dengue cases linked with a single urban park in japan, within a period of a month, is remarkable. another important potential limitation is ascertainment bias, such that clinically suspect cases who visited yoyogi park may have been more likely to be tested, as the initially reported cases were all linked to the park. later, cases with no link began to be detected (figure 1), indicating perhaps wider geographic circulation of the virus. while the situation is still evolving, the detection of dengue virus-positive mosquitoes from yoyogi park has major public health, social and economic implications. already, an australian traveller who had visited yoyogi park has been reportedly confirmed with dengue infection in september 2014, following his return from japan.13 the unexpected magnitude and future concerns require ongoing monitoring, risk assessment and epidemiologic and entomologic studies. as aedes albopictus is active only until november in most of japan, notifications of autochthonous cases should soon start to decline. however, re-entry of the virus in the following year is possible via a dengue virus-infected mosquito(es) or person(s) who are viremic upon entry into the country. as the 2020 summer olympics are to be held in tokyo, there are also significant international public health implications requiring effective surveillance and clear and routine communications of findings to regional and global partners and stakeholders. conflicts of interest none declared. funding none. acknowledgements we thank the staff at local public health centres and prefectural and municipal public health institutes, notifying physicians and other public health and medical staff who have been responding to the ongoing situation. we appreciate the rapid laboratory diagnosis and reporting by the prefectural and municipal institutes of public health that have allowed for rapid assessments and response. lastly, we would like to thank the ministry of health, labour and welfare and the tokyo metropolitan government for their active response activities and timely information-sharing. references: infectious disease surveillance center, national institute of infectious diseases. local transmission of dengue, japan. infectious diseases weekly report, 2014. available from: http://www.nih.go.jp/niid/en/survei/2292-idwr/idwr-article-en/4973-idwrc-1434-en.html [accessed 9 october 2014]. nakamura n et al. incidence of dengue virus infection among japanese travellers, 2006 to 2010. western pacific surveillance and response journal, 2012, 3:39–45. doi:10.5365/wpsar.2011.2.3.002 pmid:23908911 takasaki t. imported dengue fever/dengue hemorrhagic fever cases in japan. tropical medicine and health, 2011, 39 suppl:13–15. doi:10.2149/tmh.2011-s07 pmid:22500132 hotta s. dengue vector mosquitoes in japan: the role of aedes albopictus and aedes aegypti in the 1942–1944 dengue epidemics of japanese main islands [in japanese]. medical entomology and zoology, 1998, 49:267–274. centers for disease control and prevention (cdc). locally acquired dengue–key west, florida, 2009–2010. morbidity and mortality weekly report, 2010, 59:577–581. pmid:20489680 marchand e et al. autochthonous case of dengue in france, october 2013. eurosurveillance: european communicable disease bulletin, 2013, 18(50):pii=20661. pmid:24342514 sousa ca et al. ongoing outbreak of dengue type 1 in the autonomous region of madeira, portugal: preliminary report. eurosurveillance: european communicable disease bulletin, 2012, 17(49):pii=20333. pmid:23231893 schmidt-chanasit j et al. autochthonous dengue virus infection in japan imported into germany, september 2013. eurosurveillance: european communicable disease bulletin, 2014, 19(3):pii=2068. pmid:24480059 takasaki t et al. dengue virus 1 e gene for polyprotein, envelope region, partial cds, strain: d1/hu/saitama/niid100/2014. nucleotide, genback: lc002828.1, 2014. available from: http://www.ncbi.nlm.nih.gov/nuccore/lc002828 [accessed 24 october 2014]. dengue [in japanese]. tokyo, bureau of social welfare and public health, tokyo metropolitan government, 2014. available from: http://www.fukushihoken.metro. tokyo.jp/iryo/kansen/dengue.html [accessed 9 october 2014]. national gardens & national cemetery. tokyo, ministry of the environment, 2014. available from: http://www.env.go.jp/garden/shinjukugyoen/news/ [accessed 9 october 2014]. dengue fever [in japanese]. tokyo, ministry of health, labour and welfare, 2014. available from: http://www.mhlw.go.jp/bunya/kenkou/kekkaku-kansenshou19/ dengue_fever.html [accessed 9 october 2014]. promed mail. dengue australia (02): (melbourne) ex japan (tokyo). massachusetts, international society of infectious diseases, 13 september 2014, 13:57:22. available from: http://www.promedmail.org/direct.php?id=2771520 [accessed 9 october 2014]. prevalence of syphilis, gonorrhoea and chlamydia in women in fiji, the federated states of micronesia, papua new guinea and samoa, 1995–2017: spectrum-sti model estimates original research takeshi nishijima,a devina nand,b nefertti david,c mathias bauri,d robert carney,e khin cho win htin,f ye yu shwe,f anup gurung,g guy mahiane,h naoko ishikawa,a melanie m taylor,i,j eline l korenromph a who regional office for the western pacific, manila, philippines. b ministry of health and medical services, fiji. c department of health and social affairs, the federated states of micronesia. d national department of health, papua new guinea. e ministry of health, samoa. f unaids, regional support team, asia and the pacific, bangkok, thailand. g who country office, papua new guinea. h avenir health, geneva, switzerland (elk), and glastonbury, usa (gm). i united states centers for disease control and prevention, atlanta, usa. j department of reproductive health and research, who, geneva, switzerland. correspondence to takeshi nishijima (email: knishijimatkb@gmail.com). to cite this article: nishijima t, nand d, david n, bauri m, carney r, htin kch, et al. prevalence of syphilis, gonorrhoea and chlamydia in women in fiji, the federated states of micronesia, papua new guinea and samoa, 1995–2017: spectrum-sti model estimates. western pac surveill response j. 2020 mar;11(1). doi:10.5365/wpsar.2019.10.2.003 objectives: to estimate prevalence levels of and time trends for active syphilis, gonorrhoea and chlamydia in women aged 15–49 years in four countries in the pacific (fiji, the federated states of micronesia [fsm], papua new guinea [png] and samoa) to inform surveillance and control strategies for sexually transmitted infections (stis). methods: the spectrum-sti model was fitted to data from prevalence surveys and screenings of adult female populations collected during 1995−2017 and adjusted for diagnostic test performance and to account for undersampled high-risk populations. for chlamydia and gonorrhoea, data were further adjusted for age and differences between urban and rural areas. results: prevalence levels were estimated as a percentage (95% confidence interval). in 2017, active syphilis prevalence was estimated in fiji at 3.89% (2.82 to 5.06), in fsm at 1.48% (0.93 to 2.16), in png at 3.91% (1.67 to 7.24) and in samoa at 0.16% (0.07 to 0.37). for gonorrhoea, the prevalence in fiji was 1.63% (0.50 to 3.87); in fsm it was 1.59% (0.49 to 3.58); in png it was 11.0% (7.25 to 16.1); and in samoa it was 1.61% (1.17 to 2.19). the prevalence of chlamydia in fiji was 24.1% (16.5 to 32.7); in fsm it was 23.9% (18.5 to 30.6); in png it was 14.8% (7.39 to 24.7); and in samoa it was 30.6% (26.8 to 35.0). for each specific disease within each country, the 95% confidence intervals overlapped for 2000 and 2017, although in png the 2017 estimates for all three stis were below the 2000 estimates. these patterns were robust in the sensitivity analyses. discussion: this study demonstrated a persistently high prevalence of three major bacterial stis across four countries in who’s western pacific region during nearly two decades. further strengthening of strategies to control and prevent stis is warranted. pacific island countries suffer a high burden of sexually transmitted infections (stis), but the prevalence and incidence of stis in individual countries over time are not well known.1 two programmatic priorities of the world health organization (who) regional office for the western pacific call for expanded sti surveillance. first, in 2017, member states in the region endorsed a strategy for the triple elimination of mother-to-child transmission of hiv, hepatitis b and syphilis.2 mother-to-child transmission of syphilis can cause congenital syphilis, with serious outcomes including miscarriage, stillbirth, neonatal death and congenital abnormalities.3,4 second, the emergence and transmission of antimicrobial resistance in strains of neisseria gonorrhoeae, with documented transmission of multidrug-resistant strains within the region, highlight the need to enhance monitoring of gonorrhoea and antimicrobial resistance.5 untreated gonorrhoea and chlamydia can cause pelvic inflammatory disease, infertility and ectopic pregnancy.1,6 the who regional office for the western pacific supports member states to strengthen national-level sti surveillance and their estimation of the burden of stis using the spectrum-sti tool. spectrum-sti is a module of the spectrum suite of health policy planning tools, generating country-level estimates of adult prevalence levels of and trends in active syphilis, gonorrhoea and chlamydia infections. the tool, developed by avenir health (geneva, switzerland, and glastonbury, ct, usa) at the request of who, is available online (https://www.avenirhealth.org) and at no cost. since 2016, it has been implemented by 10 countries to generate national estimates of sti burden and inform sti surveillance, policies and programmes.7–12 this paper presents spectrum-sti estimates for fiji, the federated states of micronesia (fsm), papua new guinea (png) and samoa, developed during and after a spectrum-sti training workshop held in april 2018 for national health and surveillance officials. these countries were selected because their burden of stis was suspected to be high, and their programmes are interested in obtaining estimates. this paper documents the process for obtaining, the data compilation for and results of the four countries’ estimates, which produced the first-ever national sti estimates for these countries using a standardized, who-recommended methodology. results are discussed with a view to improving national sti surveillance, developing control strategies, and evaluating progress, priorities and challenges. methods prevalence trends for adult active syphilis, gonorrhoea, and chlamydia infections were estimated using data from routine national sti surveillance and population-based surveys. no data or records from individual patients were used. we used only published, population-aggregated data sets identified through literature review and official data reported by governments, all of which were fully anonymized (supplementary information file). data from samples of fewer than 50 people were excluded. for estimates of all three stis, uncertainty bounds were calculated by bootstrapping (10 000 replications).12 syphilis: prevalence data prevalence data were identified from studies conducted between 1995 and 2017 in general populations aged 15–49 years. searches were conducted on pubmed; government co-authors also searched national (internal) health science databases. eligible populations included pregnant women receiving antenatal care (anc; routine screening or sentinel surveys), women attending family planning clinics, and individuals sampled during household surveys or other community-based studies. data were adjusted for diagnostic test performance (sensitivity and specificity of the test) and for the contribution of higher-risk populations not represented or underrepresented in population surveys.13–15 no adjustments were made for age or location. each adjusted data point was assigned a weight reflecting its national coverage and representativeness. nationally representative data were weighted 100%, while data from smaller areas or from subsets of surveillance sites were weighted proportionally less (si file).15 for example, data from routine anc screening that covered 60% of pregnant women were weighted 60%; an anc-based survey that cluster sampled 4 of 10 country provinces was weighted 40%. prevalence estimation: syphilis spectrum-sti version 5.72 beta 3 (released 20 august 2018) was used. spectrum-sti has two options for estimating syphilis prevalence trends: segmented polynomial regression and logistic regression. we used logistic regression for fiji, fsm and samoa, where the limited data required taking a conservative approach, and polynomial regression for png, where the availability of more data over multiple years allowed for more in-depth analysis.11,15 for years occurring before the first data point, spectrum-sti extrapolated the estimated time trend back 1 year, then kept the estimate constant at that prevalence level. results are shown for all countries during 2000–2017. however, country data also included the years 1995 through 1999 to best inform estimates for the year 2000.15 estimations pooled all women’s prevalence data, from anc and non-anc (pregnant and non-pregnant) women, lacking evidence of systematic prevalence differences between these populations.12,13,16,17 for png, the syphilis estimation considered the high local prevalence of yaws across all 22 provinces, which yields false-positive results on both treponemal and non-treponemal tests.18 to correct for false positives, prevalence estimates were multiplied by a correction coefficient of 0.90, which was based on consultation with experts on png and published studies on the prevalence of active yaws in the population.19,20 gonorrhoea and chlamydia: prevalence data prevalence data were identified from studies conducted between 1995 and 2017 in representative populations aged 15–49 years (si file). eligible populations included pregnant women attending for anc, women and men attending family planning clinics or undergoing screening at military recruitment, and women and men tested during household or community surveys. diagnostic tests eligible for inclusion were nucleic acid amplification tests and culture performed on urine or genital fluid or swabs. the prevalence from each study was adjusted for the sensitivity and specificity of the diagnostic test, as was done for who’s 2012 and 2016 global sti estimates and earlier spectrum-sti estimates for countries.10,13 for studies of exclusively rural or urban sites, the test-adjusted prevalence was converted to national prevalence assuming a rural-to-urban ratio of 0.9013 and country year-specific proportions of the urban population.21 for chlamydia, prevalence data were additionally adjusted for prevalence decline with age.10 to obtain the prevalence for those aged 15–49 years, prevalences from studies that sampled only younger populations (aged 15–24 years) were multiplied by 0.60, and data points from exclusively older populations (aged ≥25 years) were multiplied by 1.39. no age adjustments were made for gonorrhoea, as there is a lack of empirical evidence for this. similar to syphilis, prevalence data for gonorrhoea and chlamydia were increased by 10% to account for higher-risk populations not represented or underrepresented in general population surveys.13 each data point was assigned a weight to reflect its representativeness. specifically, studies that were representative of the national population were weighted 100%, and other studies were weighted less, reflecting uncertainties in age adjustment and representativeness (si file). prevalence estimations: gonorrhoea and chlamydia spectrum-sti fitted a simple moving average through adjusted weighted prevalence data,10,12 since prevalence data were insufficient for logistic or polynomial regression.13,22 moving averages used an annual dilution factor (20%), weighting down the contribution of each data point to the estimation for other years by a fixed proportion for each additional year away from the data collection year.12 sensitivity analyses univariate sensitivity analyses examined how varying the data inclusion criteria or weights changed the estimated prevalence in 2000 and 2017 (si file). data added during the sensitivity analyses were weighted 10%. more general methodological assumptions have been addressed in sensitivity analyses of earlier spectrum-sti applications.7,12,15 ethics statement no ethical review was needed because only publicly available information was used. results data availability all data points are from the years 1995−2017. for syphilis, 8 data points in fiji, 6 in fsm, 13 in png, and 7 in samoa were identified, all from pregnant women attending anc clinics (si file). for gonorrhoea, 1 prevalence point for women in fiji, 9 in fsm, 6 in png and 5 in samoa were identified. for chlamydia, 1 prevalence point for women in fiji, 10 in fsm, 6 in png and 9 in samoa were identified. we did not identify any data on male syphilis, so estimates could not be generated; for gonorrhoea and chlamydia, male prevalence data were insufficient to generate estimates for males in any country (si file); hence, estimates were limited to women. estimated prevalences are presented as a percentage (95% confidence interval), unless otherwise noted. fiji the estimated prevalence of syphilis in 2000 was 3.72% (2.28 to 5.86) and in 2017 was 3.89% (2.82 to 5.06) (table 1; fig. 1). for gonorrhoea, only one prevalence survey was available. we supplemented this with the nine data points from fsm, the country judged most similar in terms of sti epidemiology, underlying drivers and sti-related care. fiji’s single data point was assigned a weight of 100%, and fsm’s data points were each weighted 10% (si file). the resulting estimates were 1.55% (0.52 to 3.57) in 2000 and 1.63% (0.50 to 3.87) in 2017 (table 1; fig. 2). for chlamydia, the estimation used fiji’s single data point (weighted 100%), which was supplemented with 10 data points from fsm (each weighted 10%). this gave estimates for 2000 of 33.1% (27.8 to 38.7) and for 2017 of 24.1% (16.5 to 32.7) (table 1, fig. 3). click to download table 1. jpg, 315kb click to download figure 1. jpg, 314kb click to download figure 2. jpg, 353kb click to download figure 3. jpg, 385kb federated states of micronesia the estimated prevalences of syphilis in 2000 and 2017 were 2.73% (1.76 to 3.91) and 1.48% (0.93 to 2.16), respectively (table 1; fig 1). for gonorrhoea, the estimated prevalences in 2000 and 2017 were 1.65% (0.51 to 3.75) and 1.59% (0.49 to 3.58), respectively (fig. 2). for chlamydia, the estimated prevalences in 2000 and 2017 were 22.8% (18.7 to 28.2) and 23.9% (18.5 to 30.6), respectively (fig. 3). papua new guinea the estimated syphilis prevalences in 2000 and 2017 were 10.1% (5.25 to 14.5) and 3.91% (1.67 to 7.24), respectively (table 1; fig. 1). for gonorrhoea, the estimated prevalences in 2000 and 2017 were 16.7% (13.3 to 20.6) and 11.0% (7.25 to 16.1), respectively (fig. 2). for chlamydia, the estimated prevalences in 2000 and 2017 were 24.8% (20.0 to 30.6) and 14.8% (7.39 to 24.7), respectively (fig. 3). samoa for syphilis, the estimated prevalences among women in 2000 and 2017 were 0.14% (table 1; fig. 1). for gonorrhoea, the estimated prevalences in 2000 and 2017 were 2.20% (1.12 to 3.77) and 1.61% (1.17 to 2.19) (fig. 2), respectively, and for chlamydia, the prevalences were 33.8% (29.7 to 38.5) and 30.6% (26.8 to 35.0), respectively (fig. 3). differences across countries and sexually transmitted infections trend estimates for all three infections in all countries were either stable or suggestive of declines in prevalence, except for syphilis in png, which showed a slight increase between 2014 and 2017 after a drastic decline that began in 2007. however, differences between 2000 and 2017 were modest or small for any infection and country, as reflected by overlapping 95% confidence intervals for each specific disease within each country. syphilis prevalence in 2017 was higher in png and fiji than in samoa, but other differences between countries were relatively small, and 95% confidence intervals overlapped between countries. for gonorrhoea, png’s prevalence estimate was above that of the other three countries. for chlamydia, the estimated 2017 prevalence did not differ widely between countries. in all four countries, in 2017, chlamydia was more prevalent than gonorrhoea and active syphilis. sensitivity analyses for fiji, alternative estimates for syphilis that increased weights for data from sentinel surveys in 2004 and 2011 (to 100%) produced similar prevalences; only the 2017 point estimate was below the estimate for 2000 in the alternative scenarios, whereas in the default estimate, the prevalence in 2017 was marginally above that for 2000 (table 2). alternative estimates excluding the data borrowed from fsm yielded estimates similar to those of the default (which included the data from fsm) in terms of levels and trends for both gonorrhoea and chlamydia (table 2). clearly, time trends in the default estimates were driven by the data from fsm, whereas the single data point from fiji by definition gave a time-constant estimate. click to download table 2. jpg, 573kb for fsm, adding three gonorrhoea data points with sample sizes of fewer than 50 people into the analysis, increased the estimated prevalence of gonorrhoea in both 2000 and 2017. for chlamydia, adding two data points from samples with fewer than 50 people had little effect on prevalence estimates for 2000 and 2017, but it did cause the 2017 estimate to be lower than that for 2000. however, for both gonorrhoea and chlamydia, the 95% confidence intervals for each sti overlapped between 2000 and 2017. for png, adding data from the country survey from sti clinic patients, female sex workers (fsws) (si file) and blood donors (only for syphilis) slightly increased the estimated syphilis prevalence for 2017. estimates of gonorrhoea and chlamydia remained similar to their default estimates (table 2). for syphilis, substituting polynomial regression for logistic regression did not materially change the estimate for 2000, but it did change the trend: rather than being a u-curve, the prevalence fell so that the 2017 estimate was lower than the 2017 default (table 2). for samoa, adding data from blood donors and immigration screening slightly increased the estimated syphilis prevalence. alternative estimates using weights increased to 100% for sentinel surveys (2000 and 2004−2005) showed prevalences similar to the default − that is, 0.17 (table 2). for gonorrhoea, excluding data from routine anc screening from 2017 (which had an outlying high prevalence of 5.63%) slightly reduced the estimated prevalence for 2017. for chlamydia, an estimate that added a 2015 survey on sexually active females (which was excluded from the default because it included only women who did not use condoms for a year, and they were thus considered to be at higher risk) led to a prevalence similar to the default.23 discussion these first-ever national estimates of prevalence trends among women in four pacific island countries found persistently high prevalences of syphilis, gonorrhoea and chlamydia. all countries had data from periodic syphilis prevalence screenings collected during routine anc visits, and in earlier years, there was anc-based sentinel surveillance. as in past regional and global estimates,13,17 the prevalence was highest for chlamydia, which in three countries was followed by gonorrhoea, while active syphilis was less prevalent. an exception was fiji, where active syphilis was estimated to be more prevalent than gonorrhoea. for png, the country with the most data across the stis investigated, estimates suggested a recent decline in syphilis, although the 95% confidence intervals for the estimates overlapped for 2000 and 2017. for gonorrhoea and chlamydia, the best estimates suggested a decline in both; however, the 95% confidence intervals overlapped for each disease in 2000 and 2017. the consistency in trends across the stis adds credibility to these estimates. the apparent decline in syphilis among women may reflect png’s 2006 roll-out of syphilis screening for pregnant women as a one-stop anc-based service using a rapid treponemal test, with those who have positive results being treated with intramuscular benzathine penicillin g on the same day.24 furthermore, a decline is consistent with png’s trend in syphilis prevalence among fsws identified in integrated biobehavioural surveys from 1995 to 2017.25−28 nevertheless, this estimated decline in syphilis comes with uncertainty. first, diagnostic algorithms used in anc testing varied, from rapid plasma reagin (rpr) with treponema pallidum hemagglutination assay (tpha) confirmation used in surveys during 2008–2014 to routine data from tpha-based rapid tests used during 2016–2017. having additional years of routine data should improve certainty regarding a decline in syphilis prevalence. for gonorrhoea and chlamydia, there is less evidence for declines in prevalence, and they are less plausible. png treats gonorrhoea with amoxicillin-based regimens, for which resistance was already detected before 2010 (unpublished data). in response to the high prevalence of gonorrhoea and amoxicillin resistance in antimicrobial susceptibility testing, png has revised its recommended first-line treatment for gonorrhoea to combination therapy with cefixime, a broad-spectrum cephalosporin, plus azithromycin, and it started national roll-out of this treatment in 2019.29 a similar treatment guideline revision, recommended by who to prevent and control gonococcal resistance, may be indicated for fiji. fiji still recommends oral penicillin for treating ulcerative and genital discharge syndromes, which is unlikely to be effective for all gonococcus strains, according to unpublished data on antimicrobial susceptibility from one of its four divisional hospitals (fiji, ministry of health and medical services, unpublished data, 2014−2017). in samoa, presumptive chlamydia treatment with azithromycin for women attending for anc and their partners has been in place since june 2015. however, its implementation is hampered by low awareness among providers and target populations, and the lack of an operational strategy for partner tracing.30 this may explain why chlamydia prevalence has not fallen since 2000. notably, for png, the estimated prevalence levels and trends did not materially change for any sti when data were added from high-risk women attending sti clinics and from fsws (table 2).25,31 apparently, women in the general population (sampled in anc and community surveys) are at similarly high risk of stis as those attending sti clinics and as fsws. this suggests it would be beneficial to intensify sti prevention and screening services, expanding them beyond syphilis screening during anc and services targeting fsws and men who have sex with men (msm). for example, adding gonorrhoea and chlamydia to anc screening, as is done in some countries,7 should reduce women’s infection rates and prevent perinatal complications. limitations the key limitation in these estimates lies in the availability and representativeness of the data, which precluded making firm estimates of trends. fiji had one single data point each for gonorrhoea and chlamydia; fiji’s relatively high syphilis estimate (compared with gonorrhoea in fiji and compared with syphilis in other countries) may be an artefact of limited data. for syphilis, two countries had no data outside that collected during anc; within the anc data, two of four countries had at least one change in the diagnostics used during the time for which data were collected, which added possible bias and uncertainty about trends, although we adjusted for test performance. we identified few prevalence data for men (four surveys on gonorrhoea and chlamydia in general populations in fsm, one survey on syphilis among msm in png, and nothing in the other two countries; si file), and therefore could not make estimates for stis among men, as were included in earlier spectrum-sti country-level applications.10 other estimations have inferred male prevalence from estimates among females, applying a time-constant male-to-female prevalence ratio, for example, for syphilis of 1.0, indicating an equal prevalence among women and men.13,17 for png, extending the estimated 3.91% prevalence among low-risk women in 2017 to men would appear to be consistent with the 4–8% range observed in a two-site 2017 survey of msm,25 although the confidence bounds on such a low-risk estimate among males would be wider than the 1.67−7.24% range we estimated for women (table 1). a special concern for syphilis surveillance in png is the endemicity of yaws, which causes positivity on tpha and rpr tests and false-positive results for syphilis on any diagnostic algorithm. our estimation adjusted for yaws-attributable false-positive syphilis, but the validity of the adjustment and its constancy over the time horizon that was evaluated (which implies that the prevalence of yaws shares a time trend with syphilis, an assumption we did not explicitly assess) remain uncertain. earlier spectrum-sti estimations triangulated prevalence with national case reports of new incident stis, to give an indication of the plausibility of estimates, or with clinical treatment coverage and reporting completeness.7,9,10 we did not pursue such triangulation, as routine clinical sti case reports were not available for fsm and samoa, and in fiji and png, they were available for only a few years. implications for surveillance and programming the estimated high prevalence of stis suggests several areas to be considered to improve sti surveillance and programming. controlling gonorrhoea and chlamydia in high-prevalence populations requires offering services beyond clinical treatment and passive clinic-based surveillance, including active outreach, screening of all members of higher-risk populations, strengthening partner testing, and, as shown for png, extending these activities beyond known key groups. in women, most gonorrhoea and chlamydia infections are asymptomatic; therefore, etiologic screening, for example, during anc, may identify many women who would not present to a clinic. etiologic screening is promoted by who, for both control and surveillance purposes.32 clearly, all countries studied here would benefit from implementing periodic prevalence assessments during anc and assessments of men and women in the general population. given these countries’ high sti prevalences, such assessments could be small-scale and yet, with careful site sampling, yield valuable representative data indicative of national time trends. assessments may benefit from increasing countries’ laboratory capacity, including using new dna-based platforms, such as the genexpert system (cepheid, sunnyvale, ca, usa), initially introduced for tuberculosis screening, which are available in png, fsm and samoa for diagnosing gonorrhoea and chlamydia, although capacity is limited as is the geographical reach. clinical services should improve their partner notification strategies and links to care, in both primary health-care and specialized sti settings. although results from programmatic partner notification are not routinely collected, png implements partner notification at all health-care settings that provide sti care. who recommends syphilis screening for all pregnant women, preferably during the first trimester. for settings with a syphilis prevalence higher than 5%, who recommends one-stop screening during anc using treponemal-based rapid tests, followed by on-site treatment with benzathine penicillin g to maximize treatment coverage and minimize the loss to follow-up seen during referral for confirmatory testing and treatment by sti specialists.33–35 png implements this approach. png may want to extend one-stop rapid-test-based syphilis screening and treatment to services for fsws and msm which would reserve its limited laboratory capacity for performing confirmatory rpr tests. the other three countries still use laboratory non-treponemal and treponemal two-test algorithms even during anc, so switching to rapid testing would seem beneficial there as well. this four-country study illustrates the value of using a standardized approach to estimate sti trends. the spectrum-sti approach provides several advantages over earlier approaches. it provides an intuitive, free, online tool that national programme managers and surveillance officers can learn to use within a few days during a workshop. it provides a framework for collating national data with key information elements, notably, diagnostic tests, sample sizes, data coverage, representativeness and quality. it uses internationally agreed, expertand evidence-based assumptions about key parameters, such as the duration of infection and sensitivity and specificity of a diagnostic test, to frame and guide estimation, such that estimates are comparable among countries and within countries over time. spectrum-sti’s statistical methods have been documented in international, peer-reviewed scientific literature12,15,36 and accepted for estimating sti trends.36 for png and other countries that also take periodic sti prevalence measurements among fsws and msm (si file, for png), estimations could be refined to consider these two or other key groups, or some combination of these, independently alongside low-risk women and men. since late 2018, a new version of spectrum-sti that allows this type of refinement has been rolled out.11,37 conclusions these first, national-level prevalence estimations for fiji, fsm, png and samoa confirm persistently high prevalences of the three stis studied. the data that were available precluded making precise estimates or drawing firm conclusions regarding time trends; however, they underscore a clear need and opportunities for improving sti surveillance, prevention and treatment in these pacific island countries. acknowledgements the authors thank torika tamani and aalisha sahu khan, ministry of health and medical services, fiji; mayleen ekiek, paula mitmow and jayleen ringlen, department of health and social affairs, federated states of micronesia; nick mawe dala, national department of health, papua new guinea; aaone tanumafili taveuveu, judith simoata’a gafa and athena matalavea, ministry of health, samoa; the regional support team for asia and the pacific, unaids; linh-vi le and anne brink, who regional office for the western pacific; madeline marucha irene solitario salva, who representative office in fiji; namarola lote, who country office in papua new guinea; jane rowley, consultant to who. funding this project was supported by japanese voluntary contribution funds, japan; the department for international development, united kingdom; and the world health organization’s department of reproductive health and research, sti programme. the analysis was further supported by a who cooperative agreement with the united states centers for disease control and prevention in support of global sti surveillance. conflicts of interest none declared. references rowley j, vander hoorn s, korenromp e, low n, unemo m, abu-raddad lj, et al. chlamydia, gonorrhoea, trichomoniasis and syphilis: global prevalence and incidence estimates, 2016. bull world health organ. 2019;97(8):548–562p. doi:10.2471/blt.18.228486 pmid:31384073 regional framework for the triple elimination of mother-to-child transmission of hiv, hepatitis b and syphilis in asia and the pacific 2018–2030. manila: who regional office for the western pacific; 2017. available from: https://apps.who.int/iris/handle/10665/274111, accessed 9 december 2018. gomez gb, kamb ml, newman lm, mark j, broutet n, hawkes sj. untreated maternal syphilis and adverse outcomes of pregnancy: a systematic review and meta-analysis. bull world health organ. 2013;91(3):217–26. doi:10.2471/blt.12.107623 pmid:23476094 korenromp el, rowley j, alonso m, mello mb, wijesooriya ns, mahiané sg, et al. global burden of maternal and congenital syphilis and associated adverse birth outcomes-estimates for 2016 and progress since 2012. plos one. 2019;14(2):e0211720. doi:10.1371/journal.pone.0211720 pmid:30811406 wi t, lahra mm, ndowa f, bala m, dillon jr, ramon-pardo p, et al. antimicrobial resistance in neisseria gonorrhoeae: global surveillance and a call for international collaborative action. plos med. 2017;14(7):e1002344. doi:10.1371/journal.pmed.1002344 pmid:28686231 price mj, ades ae, de angelis d, welton nj, macleod j, soldan k, et al. risk of pelvic inflammatory disease following chlamydia trachomatis infection: analysis of prospective studies with a multistate model. am j epidemiol. 2013;178(3):484–92. doi:10.1093/aje/kws583 pmid:23813703 badrakh j, zayasaikhan s, jagdagsuren d, enkhbat e, jadambaa n, munkhbaatar s, et al. trends in adult chlamydia and gonorrhoea prevalence, incidence and urethral discharge case reporting in mongolia from 1995 to 2016 estimates using the spectrum-sti model. west pac surveill response. 2017;8(4):20–9. doi:10.5365/wpsar.2017.8.2.007 pmid:29487760 bennani a, el-kettani a, hançali a, el-rhilani h, alami k, youbi m, et al. the prevalence and incidence of active syphilis in women in morocco, 1995-2016: model-based estimation and implications for sti surveillance. plos one. 2017;12(8):e0181498. doi:10.1371/journal.pone.0181498 pmid:28837558 el-kettani a, mahiané g, bennani a, abu-raddad l, smolak a, rowley j, et al. trends in adult chlamydia and gonorrhea prevalence, incidence and urethral discharge case reporting in morocco over 1995−2015 − estimates using the spectrum-sexually transmitted infection model. sex transm dis. 2017;44(9):557–64. doi:10.1097/olq.0000000000000647 pmid:28806354 kularatne rs, niit r, rowley j, kufa-chakezha t, peters rph, taylor mm, et al. adult gonorrhea, chlamydia and syphilis prevalence, incidence, treatment and syndromic case reporting in south africa: estimates using the spectrum-sti model, 1990-2017. plos one. 2018;13(10):e0205863. doi:10.1371/journal.pone.0205863 pmid:30321236 rowley j, korenromp el, mahiané g. user guide to the spectrum-sti module: estimating national sti burdens and trends for high-risk and low-risk population groups. geneva: world health organization, avenir health, human reproduction programme; 2019. available from: https://spectrummodel.zendesk.com/hc/en-us/articles/115001964191-spectrum-sti-module-overview-manual, accessed 9 december 2018. korenromp el, mahiané g, rowley j, nagelkerke n, abu-raddad l, ndowa f, et al. estimating prevalence trends in adult gonorrhoea and syphilis in lowand middle-income countries with the spectrum-sti model: results for zimbabwe and morocco from 1995 to 2016. sex transm infect. 2017;93(8):599–606. doi:10.1136/sextrans-2016-052953 pmid:28325771 newman l, rowley j, vander hoorn s, wijesooriya ns, unemo m, low n, et al. global estimates of the prevalence and incidence of four curable sexually transmitted infections in 2012 based on systematic review and global reporting. plos one. 2015;10(12):e0143304. doi:10.1371/journal.pone.0143304 pmid:26646541 ham dc, lin c, newman l, wijesooriya ns, kamb m. improving global estimates of syphilis in pregnancy by diagnostic test type: a systematic review and meta-analysis. int j gynaecol obstet. 2015;130(suppl. 1):s10–4. doi:10.1016/j.ijgo.2015.04.012 pmid:25963909l korenromp el, mahiané sg, nagelkerke n, taylor mm, williams r, chico rm, et al. syphilis prevalence trends in adult women in 132 countries − estimations using the spectrum sexually transmitted infections model. sci rep. 2018;8(1):11503. doi:10.1038/s41598-018-29805-9 pmid:30065272 smolak a, rowley j, nagelkerke n, kassebaum nj, chico rm, korenromp el, et al. trends and predictors of syphilis prevalence in the general population: global pooled analyses of 1103 prevalence measures including 136 million syphilis tests. clin infect dis. 2018;66(8):1184–91. doi:10.1093/cid/cix975 pmid:29136161 rowley, et al. global estimates of the prevalence and incidence of four curable sexually transmitted infections in. 2016. forthcoming mitjà o, marks m, konan dj, ayelo g, gonzalez-beiras c, boua b, et al. global epidemiology of yaws: a systematic review. lancet glob health. 2015;3(6):e324–31. doi:10.1016/s2214-109x(15)00011-x pmid:26001576 manning la, ogle gd. yaws in the periurban settlements of port moresby, papua new guinea. p n g med j. 2002;45(3-4):206–12. pmid:12968791 backhouse jl, hudson bj, hamilton pa, nesteroff si. failure of penicillin treatment of yaws on karkar island, papua new guinea. am j trop med hyg. 1998;59(3):388–92. doi:10.4269/ajtmh.1998.59.388 pmid:9749630 united nations, department of economic and social affairs, population division. world population prospects: the 2015 revision. key findings and advance tables. 2015. available from: esa/p/wp.241; https://population.un.org/wpp/publications/files/key_findings_wpp_2015.pdf, accessed 9 december 2018. korenromp el, rios cy, sabogal apolinar al, caicedo s, cuellar d, cardenas cañon im, et al. adult syphilis, chlamydia and gonorrhea prevalence and incidence, and congenital syphilis incidence in colombia, 1995–2016 – estimates using the spectrum-sti model. pan am j public health. 2018;42:e118. doi:10.26633/rpsp.2018.118 pmid:31093146 walsh ms, hope e, isaia l, righarts a, niupulusu t, temese sv, et al. prevalence of chlamydia trachomatis infection in samoan women aged 18 to 29 and assessment of possible risk factors: a community-based study. trans r soc trop med hyg. 2015;109(4):245–51. doi:10.1093/trstmh/trv014 pmid:25732755 standard management of sexually transmitted infections and genital conditions in papua new guinea: a manual for health workers in png. port moresby, papua new guinea: national department of health; 2016. kelly-hanku a, willie b, weikum da, boli neo r, kupul m, et al. kauntim mi tu: multi-site summary report 2018. key findings from the key population integrated bio-behavioural survey, papua new guinea. sydney: papua new guinea institute of medical research and kirby institute, unsw sydney; 2018. available from: https://www.aidsdatahub.org/sites/default/files/publication/png_kauntim_mi_tu_multi-site_summary_report_from_the_key_population_ibbs_2018.pdf, accessed 9 december 2018. bruce e, bauai l, masta a, rooney pj, paniu m, sapuri m, et al. a cross-sectional study of reported symptoms for sexually transmissible infections among female sex workers in papua new guinea. sex health. 2010;7(1):71–6. doi:10.1071/sh09093 pmid:20152100 gare j, lupiwa t, suarkia dl, paniu mm, wahasoka a, nivia h, et al. high prevalence of sexually transmitted infections among female sex workers in the eastern highlands province of papua new guinea: correlates and recommendations. sex transm dis. 2005;32(8):466–73. doi:10.1097/01.olq.0000161177.21639.96 pmid:16041247 mgone cs, passey me, anang j, peter w, lupiwa t, russell dm, et al. human immunodeficiency virus and other sexually transmitted infections among female sex workers in two major cities in papua new guinea. sex transm dis. 2002;29(5):265–70. doi:10.1097/00007435-200205000-00003 pmid:11984442 standard management of sexually transmitted infections and genital conditions, second edition. port moresby, papua new guinea: national department of health and png sexual health society; 2018. presumptive treatment for chlamydia protocol evaluation: report for 2017. apia, samoa: ministry of health, national programme for hiv, aids, stis and tb; 2015–2017. vallely lm, toliman p, ryan c, rai g, wapling j, gabuzzi j, et al. performance of syndromic management for the detection and treatment of genital chlamydia trachomatis, neisseria gonorrhoeae and trichomonas vaginalis among women attending antenatal, well woman and sexual health clinics in papua new guinea: a cross-sectional study. bmj open. 2017;7(12):e018630. doi:10.1136/bmjopen-2017-018630 pmid:29288183 standard protocol to assess prevalence of gonorrhoea and chlamydia among pregnant women in antenatal care clinics. geneva: world health organization; 2018. available from: https://apps.who.int/iris/handle/10665/275846, accessed 9 december 2018. who guideline on syphilis screening and treatment for pregnant women. geneva: world health organization; 2017. available from: https://apps.who.int/iris/handle/10665/259003, accessed 9 december 2018. enkhbat e, korenromp el, badrakh j, zayasaikhan s, baya p, orgiokhuu e, et al. adult female syphilis prevalence, congenital syphilis case incidence and adverse birth outcomes, mongolia 2000-2016: estimates using the spectrum sti tool. infect dis model. 2018;3:13–22. doi:10.1016/j.idm.2018.03.003 pmid:30839908 rowley j, aslanikashvili a, tsereteli m, shakhnazarova m, giguashvili, merabishvili t, et al. a pilot application of the spectrum-sti model in a low-prevalence setting: estimation of sti prevalence and incidence trends in georgia. technical report, 2017. available from: https://spectrummodel.zendesk.com/hc/en-us/articles/115003492452-georgia-spectrum-sti-estimation-2017-final-report mahiané sg, pretorius c, korenromp e. second order segmented polynomials for syphilis and gonorrhea prevalence and incidence trends estimation: application to spectrum’s guinea-bissau and south africa data. int j biostat. 2019;15(2). doi:10.1515/ijb-2017-0073 pmid:31194678 korenromp el, zhang w, zhang x, ma y, jia m, luo h, et al.. the spectrum-sti groups model: syphilis prevalence trends across high-risk and low-risk populations in yunnan, china. conditionally accepted by scientific reports oct 2019. https://ojs.wpro.who.int/ 1wpsar vol 12, no 2, 2021 | doi: 10.5365/wpsar.2020.11.3.008 covid-19: outbreak investigation report s evere acute respiratory syndrome coronavirus 2 (sars-cov-2) was first identified in malaysia on 25 january 2020; three cases were notified, all of which were imported from wuhan, china. on 30 january 2020, who declared coronavirus disease 2019 (covid-19) a public health emergency of international concern. on 6 february, the first local transmission was reported in malaysia in a close contact of a confirmed covid-19 case who had returned from singapore. the first case in malaysia with neither a history of contact with a confirmed case nor travel to an affected area was reported on 12 march 2020. by 28 april 2020, malaysia had reported 5851 confirmed cases and 100 fatalities. selangor is the most densely populated state in malaysia, with a population of 5.8 million and a population density of 780.3 people/km2. it is situated in peninsular malaysia, bordering the capital, kuala lumpur, and the federal government administrative centre, putrajaya. by mid-march 2020, there were more than 200 covid-19 cases in selangor, and the number increased to more than 1300 by mid-april 2020, largely due to two main clusters. the malaysian government instituted movement restrictions through a mandatory movement control order (mco) under the prevention and control of infectious diseases act 1988 and the police act 1967 to limit human movement from 18 march in an effort to prevent further covid-19 cases. a variety of containment strategies, used either in isolation or in combination, have been used for covid-19, which can be broadly categorized as physical distancing measures, movement restrictions, public health measures and socioeconomic measures.1 this paper describes the epidemiology and control measures used to control the outbreak of covid-19 in selangor, malaysia, up to april 2020. a ministry of health malaysia. b selangor state health department, malaysia. c institute for medical research, malaysia. d petaling district health office, malaysia. published: 22 june 2021 doi: 10.5365/wpsar.2020.11.3.008 objective: various public health and social measures have been used during the covid-19 outbreak, including lockdowns, contact-tracing, isolation and quarantine. the objective of this manuscript is to describe outbreaks of covid-19 in selangor, malaysia, the public health strategies used and the observed impact of the measures on the epidemic curve. methods: information on all confirmed covid-19 cases in selangor between 25 january and 28 april 2020 was obtained. clusters were identified, and cases were disaggregated into linked, unlinked and imported cases. epidemic curves were constructed, and the timing of movement control orders was compared with the numbers of cases reported. results: during the study period, 1395 confirmed covid-19 cases were reported to the selangor health department, of which 15.8% were imported, 79.5% were linked and 4.7% were unlinked cases. for two main clusters, the number of cases decreased after control measures were instituted, by contact-tracing followed by isolation and home quarantine for the first cluster (n = 126), and with the addition of the movement control order for the second, much larger cluster (n = 559). discussion: the findings suggest that appropriate, timely public health interventions and movement control measures have a synergistic effect on controlling covid-19 outbreaks. use of movement restrictions during an outbreak of covid-19 in selangor, malaysia anita suleiman,a shaari ngadiman,b mazliza ramly,a ahmad faudzi yusoffc and mohamed paid yusofd correspondence to mazliza ramly (drmazliza@moh.gov.my). wpsar vol 12, no 2, 2021 | doi: 10.5365/wpsar.2020.11.3.008 https://ojs.wpro.who.int/2 suleiman et alstrategies in stemming covid-19 in selangor, malaysia 1 month to 92 years (median, 35 years); 10.4% were aged <19 years, 46.5% 19–39 years, 27.2% 40–59 years and 14.5% ≥60 years. of the 1395 cases, 15.8% were imported, 79.5% were linked cases and 4.7% were unlinked cases. the epidemic curve (fig. 1) shows an exponential increase in the number of cases in selangor from early march 2020, which peaked on 19 march, followed by a steady decline by 28 april. initial case detection and control measures included contact-tracing, isolation of cases and home quarantining of contacts of cases. travellers and returning malaysians with either symptoms or fever detected with thermal scanners at points of entry were tested for sars-cov-2. those found to be positive were isolated in a designated covid-19 hospital, while those found to be negative and/ or asymptomatic were quarantined in designated hotels for 14 days from the date of arrival. the increase in the number of linked cases after 22 february was due to a workplace cluster. extensive case investigations revealed 126 confirmed cases among 1715 contacts, for an attack rate of 7.3%. this attack rate was higher among work-related contacts (18.7%, 56 of 300) than among family and social contacts (4.9%). the case with the earliest onset of illness, on 18 february, was identified as the primary case for this cluster and was imported from a neighbouring country. the largest potential exposure event was on 27 february, at a meeting with approximately 300 people. the number of cases in this cluster peaked on 29 february and then declined, in line with public health measures initiated on 29 february (fig. 2a). at the time of the workplace cluster, mass gatherings were not banned. a second cluster was subsequently detected after a religious mass gathering in kuala lumpur of more than 10 000 people between 28 february and 2 march 2020, resulting in 559 covid-19 cases in selangor among attendees, their families and social contacts (fig. 2b). further links were made to a wedding on 6 march and the transfer of students from a school near the mass gathering location to another school in selangor on 12 march. the earliest onset of disease after the latter event was on 26 february in a cook at the school in selangor, who also attended the mass gathering. methods this observational study included all covid-19 cases reported in selangor between 25 january and 28 april 2020. by that time, selangor had reported 25% of all covid-19 cases in malaysia. a confirmed case was defined as an individual with a positive test for sars-cov-2 by reverse transcriptasepolymerase chain reaction from nasopharyngeal swabs. we obtained demographic, clinical and exposure information from an online data collection form used by district health authorities in case investigation. clusters were identified from detailed movement histories of confirmed cases and their contacts. an epidemic curve was plotted, with the date of onset of illness used for symptomatic cases and the date of last exposure plus 5 days as the estimated “onset date” for asymptomatic cases. we defined cases as “imported” if they had travelled overseas in the 14 days before onset, as “linked” if the disease was acquired locally after a history of contact with a covid-19 case and as “unlinked” for those with no history of contact with a confirmed covid-19 case. data were analysed in microsoft excel with spss version 26. the control measures used during the period of measuring the epidemic curve are described. ethics approval the study protocol was reviewed and approved by the medical research and ethics committee, ministry of health malaysia (nmrr-20–1043–54912 [iir]). results as of 28 april 2020, 1395 confirmed covid-19 cases had been reported to selangor health department. most (80%) were detected by contact-tracing, 13% were imported, 5% were detected by sampling of people with influenza-like illness or severe acute respiratory illness at sentinel surveillance sites, and 2% were found during routine passive case detection. most of the covid-19 cases were in malaysian citizens (85%) and males (59%). the age range was wpsar vol 12, no 2, 2021 | doi: 10.5365/wpsar.2020.11.3.008https://ojs.wpro.who.int/ 3 strategies in stemming covid-19 in selangor, malaysiasuleiman et al during the first 14 days of the first mco, the number of covid-19 cases decreased by 12.8%, with a further decline of 71% after the second and 72% after the third mco. the number of imported cases fell after implementation of international travel restrictions during the first mco and had almost disappeared by the third. most unlinked cases were reported before and throughout the first mco and had also fallen to almost 0 during the third. discussion lack of pharmacological treatment and vaccines against covid-19 meant that public health and social measures were the mainstay of the initial covid-19 response. selangor initially adopted contact-tracing, isolation of cases and quarantine of contacts to manage the outbreak but added mcos with closure of schools, universities and non-essential businesses and services. the mcos appear to have flattened the epidemic curve. a modelling study conducted in the united kingdom that included on 18 march, the first 14-day mco was initiated, which prohibited public movement, including interstate and international travel and mass gatherings for religious, sports, social and cultural activities throughout the country. businesses and services deemed non-essential, schools, universities and government offices were closed, and people were urged to work from home. only essential services such as food and health care could operate, with strict operating procedures that ensured physical distancing and screening for fever. a second mco was implemented from 1 april to 14 april. in addition, an enhanced mco was enforced in certain locations with established large clusters, where all movement was restricted. comprehensive testing of all residents for sars-cov-2 was conducted; residents and visitors in the area were forbidden to leave their homes, and all roads into the enhanced mco area were blocked. residents were provided with adequate food and medical supplies by authorities, with special arrangements to address any additional needs. fig. 1. epidemic curve of covid-19 cases by importation and linkage between 5 january and 28 april 2020, selangor, malaysia (n = 1395) mco 1 mco 2 mco 3 0 10 20 30 40 50 60 70 1/5/20 1/19/20 2/2/20 2/16/20 3/1/20 3/15/20 3/29/20 4/12/20 4/26/20 n um be r of c as es date of onset unlinked linked imported wpsar vol 12, no 2, 2021 | doi: 10.5365/wpsar.2020.11.3.008 https://ojs.wpro.who.int/4 suleiman et alstrategies in stemming covid-19 in selangor, malaysia fig. 2a. distribution of cases by date of illness onset and date of exposure in a workplace cluster, selangor, malaysia (n = 126) 0 5 10 15 20 25 2/ 3/ 20 2/1 0/ 20 2/1 7/2 0 2/ 24 /2 0 3/ 2/ 20 3/ 9/ 20 3/1 6/ 20 3/ 23 /2 0 3/ 30 /2 0 4/ 6/ 20 4/1 3/ 20 4/ 20 /2 0 4/ 27 /2 0 5/4 /2 0 mco date of onset date of exposure fig. 2b. distribution of cases by date of illness onset and date of exposure in a cluster in selangor after attendance at a mass religious gathering in kuala lumpur (n = 559) 0 10 20 30 40 50 60 70 80 90 2/1 1/2 02 0 2/1 8/2 02 0 2/2 5/2 02 0 3/3 /20 20 3/1 0/2 02 0 3/1 7/2 02 0 3/2 4/2 02 0 3/3 1/2 02 0 4/7 /20 20 4/1 4/2 02 0 4/2 1/2 02 0 4/2 8/2 02 0 date of onset date of exposure mco 1 mco 2 mco 3 n u m b er o f ca se s n u m b er o f ca se s wpsar vol 12, no 2, 2021 | doi: 10.5365/wpsar.2020.11.3.008https://ojs.wpro.who.int/ 5 strategies in stemming covid-19 in selangor, malaysiasuleiman et al the objective of the mco was to reduce contact of potential cases with others, thereby averting widespread community transmission and preventing the health care system from being overwhelmed by an influx of new patients. extension of the mco was made possible by government support through an economic stimulus package to ease the burden on businesses and individuals of the economic downturn.8 although costly, mcos were seen to slow the epidemic. an interrupted time-series study in hubei and guangdong provinces in china before and after lockdown showed a significant reduction in the incidence of cases, indicating the effectiveness of lockdown in containing the outbreak.9 a local modelling study with various contact rates during the phases of mco found that mco implementation flattened the epidemic curve,10 and the effectiveness of lockdown in reducing transmission rates has been shown by modelling elsewhere.2 it should be noted, however, that the decrease in the number of covid-19 cases in selangor might have also been the effect of the combined prevention strategies, such as isolation, quarantine, travel bans and closure of schools and universities, and not the mco alone. the study has several limitations. as selangor implemented several public health measures concurrently, the relative impact of each intervention could not be evaluated. nevertheless, our data show a temporal association between trends in the epidemic curve and mco implementation. additionally, we did not directly assess changes in human contact behaviour before and during the mco. our study results support the conclusion that mcos, in conjunction with other public health and social measures, played a key role in controlling the spread of sars-cov-2 in malaysia. acknowledgements we thank the director-general of health malaysia for his permission to publish this article. we also extend our gratitude to all personnel at the selangor state health department, district health offices and sungai buloh hospital and the kuala lumpur international airport health officer for their cooperation and work in collecting the data for this study. various transmission routes and mitigation measures suggested that lockdowns alone, particularly if short, will not eliminate transmission and that a combination of stricter measures is required.2 one of the main public health measures used to reduce importation of cases of covid-19 was thermal body scanning and health declarations at points of entry. however, asymptomatic and presymptomatic cases can effectively shed the virus3 and are unlikely to be detected by screening at points of entry. one study showed that half of infected travellers are not detected during airport screening.4 in the initial workplace cluster in selangor, the index case was an imported case that had not been detected at the point of entry. with a substantial proportion of asymptomatic cases (30%), additional control methods are required. the initial workplace cluster in selangor was successfully interrupted through the public health measures of contact-tracing, isolation of all confirmed cases and home quarantine of all contacts. contact-tracing has been a key public health response during previous pandemics of influenza and other communicable disease outbreaks, as it identifies potentially infected individuals before symptoms emerge.5 if conducted promptly, contact-tracing can prevent onward transmission from secondary cases.6 although contact-tracing can be highly effective for the control of covid-19, it places substantial demands on the public health authorities, as reported in other studies.7 the second cluster, arising from the mass gathering in kuala lumpur, involved cases all around the country as attendees dispersed to their respective states. in selangor, contacting and then testing the large number of potential contacts from this event stretched the state’s capacity, and the response to the first cluster of 126 cases could not be replicated for the second cluster of 559 cases. therefore, the first mco was enforced, resulting in a reduction in the number of new cases, which continued during the second and third mcos. had mass gatherings been prohibited during the earlier phase of covid-19, this outbreak could have been prevented. however, as a result of this cluster, mcos were identified as a useful, practicable control measure, which can be implemented intermittently as required. wpsar vol 12, no 2, 2021 | doi: 10.5365/wpsar.2020.11.3.008 https://ojs.wpro.who.int/6 suleiman et alstrategies in stemming covid-19 in selangor, malaysia 5. peak cm, childs lm, grad yh, buckee co. comparing nonpharmaceutical interventions for containing emerging epidemics. proc natl acad sci usa. 2017;114(15):4023–8. doi:10.1073/ pnas.1616438114 6. keeling mj, hollingsworth td, read jm. efficacy of contact tracing for the containment of the 2019 novel coronavirus (covid-19). j epidemiol community health. 2020;74(10):861–6. doi:10.1136/jech-2020-214051 7. girum t, lentiro k, geremew m, migora b, shewamare s. global strategies and effectiveness for covid-19 prevention through contact tracing, screening, quarantine, and isolation: a systematic review. trop med health. 2020;48(1):91. doi:10.1186/ s41182-020-00285-w 8. flanders s, nungsari m, chuah hy. the covid-19 hardship survey: an evaluation of the prihatin rakyat economic stimulus package 2020. kuala lumpur: asia school of business; 2020. available from: https://asb.edu.my/research-papers/the-covid19-hardship-survey. 9. figueiredo a, codina a, marculino de figueiredo dc, saez m, león a. impact of lockdown on covid-19 incidence and mortality in china: an interrupted time series study. bull world health organ. 2020. available from: https://www.who.int/bulletin/online_first/20-256701.pdf. 10. salim n, chan wh, mansor s, bazin nen, amaran s, mohd faudzi aa et al. covid-19 epidemic in malaysia: impact of lock-down on infection dynamics. medrxiv 2020.04.08.20057463. conflicts of interest we know of no conflict of interest associated with this publication, and there has been no significant financial support for this work that could have influenced its outcome. references 1. covid-19: governments measures. geneva: acaps; 2020. available from: https://www.acaps.org/special-report/covid-19-government-measures, accessed 3 june 2020. 2. roy s. covid-19 pandemic: impact of lockdown, contact and non-contact transmissions on infection dynamics. medrxiv 2020.04.04.20050328. doi:10.1101/2020.04.04.20050328 3. furukawa nw, brooks jt, sobel j. evidence supporting transmission of severe acute respiratory syndrome coronavirus 2 while presymptomatic or asymptomatic. emerg infect dis. 2020;26(7). doi:10.3201/eid2607.201595 4. quilty bj, clifford s, flasche s, eggo rm. effectiveness of airport screening at detecting travellers infected with novel coronavirus (2019-ncov). eurosurveillance. 2020;25(5):2000080. doi:10.2807/1560-7917.es.2020.25.5.2000080 https://asb.edu.my/research-papers/the-covid-19-hardship-survey https://asb.edu.my/research-papers/the-covid-19-hardship-survey https://www.who.int/bulletin/online_first/20-256701.pdf https://www.who.int/bulletin/online_first/20-256701.pdf https://www.acaps.org/special-report/covid-19-government-measures https://www.acaps.org/special-report/covid-19-government-measures https://doi.org/10.1101/2020.04.04.20050328 epidemiological and virological characteristics of seasonal influenza in the western pacific region of the world health organization, 2011-2015 regional analysis members of the who western pacific region global influenza surveillance and response systema a members of the who western pacific region global influenza surveillance and response system are provided in the acknowledgements. correspondence to erica dueger (email:duegere@who.int). to cite this article: members of the who western pacific region global influenza surveillance and response system. epidemiological and virological characteristics of seasonal influenza in the western pacific region of the world health organization, 2011-2015. western pac surveill response j. 2017 mar;8(1). doi:10.5365/wpsar.2017.8.1.004. seasonal influenza is an acute viral infection that causes annual epidemics. the world health organization (who) estimates that the global disease burden of seasonal influenza is approximately one billion cases annually resulting in up to 500 000 deaths.1 epidemics are well defined as seasonal in northern and southern temperate climates with annual epidemics occurring in late winter or early spring.2 in contrast, seasonal patterns in tropical and subtropical regions are less clear and tend to show more consistent levels of transmission year-round.3,4 the western pacific region (wpr) of who comprises 37 diverse countries and areas with temperate and tropical climates inhabited by approximately 1.8 billion people in 2016.5 therefore, influenza is consistently circulating in variable locations in the region. collection and analysis of influenza surveillance data in wpr is particularly important due to evidence that novel influenza may emerge from persistent influenza reservoirs in the tropics and then spread to temperate regions.4 a more comprehensive understanding of virological characteristics of influenza in this region will contribute to improved predictions of emerging global influenza trends. for example, there is evidence that between 2002 and 2007 influenza viruses originating in several tropical wpr nations seeded seasonal a(h3n2) epidemics in temperate zones.6 the global influenza surveillance and response system (gisrs) is a who network that monitors global impact of influenza and evaluates potential pandemic risk of emerging strains.7 gisrs also provides recommendations regarding viral strains in seasonal influenza vaccines, laboratory diagnostics and antiviral susceptibility. gisrs comprises 143 national influenza centres (nics), six who collaborating centres (ccs), four essential regulatory laboratories and other ad hoc laboratories. the who wpr has 21 nics, three who ccs and two essential regulatory laboratories. the nics process thousands of specimens yearly of which a subset is sent to who ccs.8 flunet is a global platform that allows nics and other gisrs-affiliated laboratories to upload virological information regarding number of specimens tested and resulting type, subtype and lineage.9 it has been used in wpr since 1996. fluid, currently in a pilot phase, is a platform for sharing country epidemiological data that includes influenza-like illness (ili) consultations by age group, total number of outpatients and total number of surveillance sites.10 embedding influenza surveillance strategies within the asia pacific strategy for emerging diseases (apsed) framework has supported significant advances in wpr influenza capacity.11 advances include improved surveillance systems, increased laboratory capacity and greater rates of reporting to flunet.12 an evaluation of the region between 2006 and 2010 indicated increased sample submission and reporting through regional systems, particularly in response to the 2009 a(h1n1)pandemic.12 in light of continued efforts to enhance influenza surveillance in the region, this review provides an updated description of regional influenza surveillance systems focused on the epidemiological and virological characteristics of seasonal influenza. this review updates the results from the previous 2012 review,12 considers how recommendations regarding surveillance strategy improvements have been implemented in the region and discusses suggested future steps. methods data collection influenza surveillance data for 2011 to 2015 were collected from the 15 countries and areas with nics in the wpr: australia, cambodia, china (including hong kong sar), fiji, japan, the lao people' s democratic republic, malaysia, mongolia, new caledonia (france), new zealand, papua new guinea, the philippines, the republic of korea, singapore and viet nam. virological surveillance data included number of specimens collected, tested and influenza positive subtypes and lineages. these data were extracted from flunet and confirmed by nic focal points. descriptive and epidemiological data were collected from nics via questionnaires developed in microsoft excel®. questionnaires of descriptive surveillance system data and epidemiological data were collected from december 2015 through august 2016. the data collected included descriptive surveillance system information such as ili case definitions and the numbers and descriptions of active surveillance sites as of 31 december 2015. epidemiological data, including number of ili cases by age group and geographic location of surveillance sites, were collected. data analysis country-specific information on ili surveillance systems, site numbers and case definitions were extracted from submitted questionnaires and compiled. virological and epidemiological data reported by epidemiologic week were combined into data per month. data were graphed and grouped into four regions according to location and similarities in influenza patterns and to allow comparison with previously reported trends.12 the groups were: (a) northern temperate (mongolia and the republic of korea); (b) china (including hong kong sar); (c) tropical (cambodia, the lao people' s democratic republic, malaysia, the philippines, singapore and viet nam); and (d) southern (australia, fiji, new caledonia (france), new zealand and papua new guinea). when data were available, per cent ili consultations were determined by taking monthly ili consultations divided by total monthly consultations. proportions for each group were calculated by adding ili consultations or positive cases and dividing by total consultations or total specimens tested, respectively. per cent positive data and total positive samples were also analysed by subtype and lineage, that is, a(h1), a(h3), a(other) and influenza b by year. positive specimens from japan were included in regional number of influenza positive cases. results surveillance systems all 15 countries and areas reported data to flunet during the reporting period. all countries and areas had ili surveillance systems with variations in ili case definition, type of surveillance systems and number of reporting sites (table 1). at the time of reporting, mongolia used the 2014 who case definition of acute respiratory infection with measured fever of ≥38 °c and cough with onset within the last 10 days.13 hong kong sar, malaysia, papua new guinea, the philippines and viet nam used the previous who ili case definition of sudden onset of fever of >38 °c and cough or sore throat in the absence of other diagnosis.13 the others reported case definitions that required additional respiratory symptoms or a modified time frame of symptom onset. minor case definition differences were reported among various ili surveillance sites within australia, cambodia, hong kong sar and new zealand. click to download table 1. jpg, 846kb for ili patients that met the country case definition, the method for selecting cases for specimen collection varied among countries. most commonly a set number of cases per week were selected for testing. all countries and areas also used various laboratory testing methodologies for influenza and subtype confirmation, including rapid test, reverse transcription polymerase chain reaction (rt-pcr), serology and virus culture. virological and epidemiological characteristics the number of reported specimens tested for influenza between 2011 and 2015 tripled (table 2), with over two million specimens reported to flunet from wpr. of positive specimens reported to flunet from wpr, over 70% of the specimens were from china followed by japan (11%) and australia (5%). during this time period, 13% (n = 293 501) of processed specimens from countries and areas that submitted data on number of specimens tested were positive for influenza virus, with a yearly variation from 9% to 17% positive. click to download table 2. jpg, 520kb epidemiologic data were provided by 12 countries and areas. fiji, new caledonia, new zealand and papua new guinea provided total number of weekly ili consultations. hong kong sar provided weekly ili consultation rates per 1000 consultations by type of surveillance system (for example, general practitioners or traditional chinese medicine practitioners). australia, cambodia, china, the lao people' s democratic republic, malaysia, mongolia, singapore and viet nam provided data on number of ili cases and total consultations. between 2011 and 2015, peaks in per cent ili were generally consistent with per cent positive trends, particularly in the northern temperate and southern zones (fig. 1). in mongolia and the republic of korea, per cent ili and per cent positive followed a northern temperate trend with yearly seasonal peaks occurring in the winter between january and march (panel a, fig. 1). japan also exhibited the temperate northern hemisphere seasonality with distinct peaks in number of positive specimens seen at the beginning of each year (january or february). china (including hong kong sar) demonstrated a bimodal influenza season with peak influenza activity between january and march consistent with the northern temperate season and secondary peaks occurring in june or july in some years (panel b, fig. 1). seasonal trends were less evident for countries in the tropical region with occasional peaks several times a year. in 2014-2015, a peak around july appears to correspond with the secondary peak seen in china (including hong kong sar) (panels b and c, fig. 1). the southern zone showed evidence of seasonal influenza transmission with highest levels of positive specimens and per cent ili consultations reported between july and september each year (panel d, fig. 1). influenza a was the predominant influenza type reported across all five years, for the entire wpr and by zone (table 2 and fig. 2). in 2011, influenza virus a(h1) predominantly circulated during the first half of the year followed by b (lineage not determined) later in the year (table 2 and fig. 2). in 2012, influenza b continued to circulate into the beginning of 2012 until influenza a(h3) began to predominate for the remainder of the year. from 2012 to 2015, the subtype a(h3) accounted for the largest proportion of the total influenza samples ranging from 40% to 62%. from 2012 to 2015, a(h3) was the most frequently reported influenza subtype while secondary influenza subtypes and lineages varied during this time. click to download figure 1. jpg, 869kb click to download figure 2. jpg, 815kb discussion all countries and areas with nics in wpr exhibited expected seasonal influenza prevalence and trends from 2011 to 2015. advances in surveillance systems and laboratory capacity have been well documented over the past 10 years. there was a 10-fold increase in the number of ili specimens tested between 2006 and 2015, driven predominately by increases in data submissions from china (including hong kong sar).12 this increase was likely due in part to increased awareness of the importance of specimen collection and submission following the a(h1n1) 2009 pandemic.12 these data improve regional understanding of circulating viral subtype seasonal trends despite variations in laboratory and surveillance systems, case definitions and number of surveillance sites. all 15 countries and areas surveyed have sentinel influenza surveillance systems in place. since the last regional overview, ili case definitions and number of surveillance sites have changed within many countries included in this review (see table 3). the previous regional overview (2006-2010) reported that eight countries and areas used the who case definition.12 in 2014, the official who case definition for ili changed from sudden onset of fever of >38 °c and cough or sore throat to a new case definition that removed sore throat from the definition and required symptom onset within 10 days of presentation.13 in 2015, one country used the 2014 who case definition, five countries and areas reported the use of the previous who case definition, and the other countries reported use of alternatives (see table 1). as changes in case definition have been shown to impact the sensitivity and positive predictive value of ili sentinel surveillance, this should be taken into consideration when interpreting these results.13 click to download table 3. jpg, 1025kb the proportion of outpatient visits for ili followed expected trends in the northern temperate zone, china (including hong kong sar) and the southern zone, with peak consultations occurring during the same months as peak per cent positive specimens (fig. 1). per cent ili in the tropical zone was low and consistent throughout the year. seasonal trends in circulating virus identified predictable temperate zone peaks and consistent tropical circulation similar to the previous regional overview.12 however, in 2014 and 2015, both china (including hong kong sar) and the tropics appear to exhibit more distinct seasonal patterns with a bimodal distribution in china (including hong kong sar) and occasional sharp peaks in the tropics (panels b and c, fig. 2). improvements in tropical indicator-based surveillance for ili over recent years indicate that more definitive determination of tropical seasonality may be possible in the near future. for example, in the american tropics a recent study has shown that 13 out of 16 countries in that region experience peak influenza transmission between april and september with smaller secondary epidemics.14 the observed peaks were not as distinct as those found in temperate regions; however, initial patterns of predictable seasonality emerged. this evidence of influenza seasonality illustrates the importance of strong outpatient indicator-based surveillance systems and reporting for determining seasonality which may impact vaccine policy. the 2012 report recommended advancement of the following three areas of influenza surveillance: (a) improving virological testing capacity, (b) improving communication through regional and global networks, and (c) defining regional burden of disease.12 advances were documented in all three areas. virological testing capacity continues to be strengthened. the number of reported virological tests conducted on influenza specimens has steadily increased from 65 103 specimens in 2006 to 307 584 in 201012 and 652 124 in 2015; some countries showed slight decreases in the amount of data submitted as they continue to optimize their surveillance systems. although the increase in number of samples over time does not necessarily constitute system improvement, consistent specimen submission does indicate both improved capacity and continued viability of the system itself. evidence from the who external quality assessment programme shows an increase in the number of laboratories in the region participating in the programme and consistently good results from participating laboratories (personal communication). continued efforts placed on quality laboratory testing will ensure an accurate understanding of influenza in the region. communication in the region and globally continues to improve with increased reporting by nics to flunet. other platforms such as the biweekly influenza situation updates published by the who western pacific regional office and periodic journal articles illustrate how communication and collaboration within the region is prioritized. using data visualization technologies, an online regional influenza dashboard is under way to integrate laboratory and epidemiological data in near real-time and provide a more complete picture of regional influenza activity. finally, significant progress in regional risk communication capacity in response to recent emerging events (for example influenza a(h7n9) in china, 2013 and zika, 2016) also benefits influenza surveillance and response efforts.15 influenza surveillance in the region continues to advance, and efforts to determine burden of disease are ongoing. who guidelines recommend assessing burden from acute lower respiratory infection and/or severe acute respiratory infection surveillance.16 several wpr countries, including cambodia, the lao people' s democratic republic, mongolia and viet nam, have begun burden of disease estimates including sentinel site catchment population determination. these estimates will contribute to national, regional and global burden estimates and may support consideration of vaccination in high-risk populations. conclusions and way forward successful collaborative efforts between 2011 and 2015 continue to outline influenza epidemiological and virological characteristics in wpr and improve data to support ongoing public health action. a geographically wide range of influenza circulation patterns, covered by an extensive outpatient surveillance network, indicated temperate and tropical trends similar to those reported previously. moving forward, wpr countries and areas are encouraged to focus on continued virus sharing through global networks while strengthening event-based surveillance, risk assessment and decision-making capacities. in addition, prioritization of high-quality, representative surveillance data of both outpatient and hospitalized respiratory disease will allow, respectively, improved appreciation of seasonality and economic burden of disease estimates. finally, such estimates will support national influenza vaccination policies in high-risk groups. advances in these areas will allow the region to remain vigilant in the face of the continued, unpredictable influenza threat and further support the critical use of influenza vaccines in vulnerable populations. conflicts of interest none. funding part of routine work, no additional funding sources. acknowledgement we would like to thank many contributors for their continued support collecting, reporting and analysing influenza data in the region. these people include: ian barr and sheena sullivan (who collaborating centre for reference and research on influenza, victorian infectious diseases reference laboratory, australia); christina bareja (department of health, australia); seng heng, chin savuth and ly sovann (department of health, cambodia); philippe buchy, philippe dussart and paul horwood (pasteur institute cambodia); sarr borann (centers for disease control and prevention, united states of america in cambodia); yuelong shu, chen tao and dayan wang (chinese center for disease control, china); albert au, shuk-kwan chuang, janice lo and wilina lim (department of health, hong kong sar; centre for communicable disease control, fiji; takato odagiri and shinji watanabe (national institute of infectious diseases, japan); ministry of health, lao people' s democratic republic; selvanesan sengol (ministry of health, malaysia); zainah saat, ravindran thayan and mohd apandi yusof (institute of medical research, malaysia); ardalinah hassan, faizatul lela jafar, siti sarah nor' e and jamal i-ching sam (university of malaya, kuala lumpur, malaysia); alexanderyn burmaa, badarchiin darmaa, darmaagiin oyungerel and nyamdorj tsogbadrakh (ministry of health, mongolia); ministry of health, new caledonia; q sue huang (institute of environmental science and research, new zealand); m croxson (auckland hospital, new zealand); mohammad yazid abdad and paul horwood (institute of medical research, papua new guinea); department of health, philippines; vina lea arguelles (research institute for tropical medicine, philippines); hyekyung in and donghan lee (korea centers for disease control and prevention, republic of korea); hyuk chu, chun kang, kisoon kim, joo-yeon lee (national institute of health, republic of korea); yijun lin (ministry of health, singapore); andrew corwin, jeffrey mcfarland, ann moen, vashonia smith, jeffrey partridge and xiyan xu (centers for disease control and prevention, united states of america); le thi quynh mai (national institute of hygiene and epidemiology, viet nam); nguyen thanh long (institute pasteur, ho chi minh, viet nam); li ailan, leila bell, viema biaukula, lucy breakwell, maria josefina cruz-fuellas, erica dueger, sam fullman, sarah hamid, vanra ieng, masaya kato, frank konings, chin-kei lee, dapeng luo, gerardo medina, may nacion, ariuntuya ochirpurev, babatunde olowokure, boris pavlin, nguyen thi phuc, chun paul soo and reiko tsuyuoka (world health organization). references immunization, vaccines and biologicals influenza. geneva: world health organization; 2008 (http://www.who.int/immunization/topics/influenza/en/). finkelman bs, viboud c, koelle k, ferrari mj, bharti n, grenfell bt. global patterns in seasonal activity of influenza a/h3n2, a/h1n1, and b from 1997 to 2005: viral coexistence and latitudinal gradients. plos one. 2007 12 12;2(12):e1296. doi:10.1371/journal.pone.0001296 pmid:18074020 viboud c, alonso wj, simonsen l. influenza in tropical regions. plos med. 2006 apr;3(4):e89. doi:10.1371/journal.pmed.0030089 pmid:16509764 rambaut a, pybus og, nelson mi, viboud c, taubenberger jk, holmes ec. the genomic and epidemiological dynamics of human influenza a virus. nature. 2008 may 29;453(7195):615-9. doi:10.1038/nature06945 pmid:18418375 countries and areas. geneva: world health organization; 2016 (http://www.wpro.who.int/countries/en/). russell ca, jones tc, barr ig, cox nj, garten rj, gregory v, et al. the global circulation of seasonal influenza a(h3n2) viruses. science. 2008 apr 18;320(5874):340-6. doi:10.1126/science.1154137 pmid:18420927 influenza gisrs and laboratory. geneva: world health organization; 2016 (http://www.who.int/influenza/gisrs_laboratory/en/). barr ig, mccauley j, cox n, daniels r, engelhardt og, fukuda k, et al.; writing committee of the world health organization consultation on northern hemisphere influenza vaccine composition for 2009-2010. epidemiological, antigenic and genetic characteristics of seasonal influenza a(h1n1), a(h3n2) and b influenza viruses: basis for the who recommendation on the composition of influenza vaccines for use in the 2009-2010 northern hemisphere season. vaccine. 2010 feb 03;28(5):1156-67. doi:10.1016/j.vaccine.2009.11.043 pmid:20004635 flunet. geneva: world health organization; 2016 (http://www.who.int/influenza/gisrs_laboratory/flunet/en). fluid a global influenza epidemiological data sharing platform. geneva: world health organization; 2016 (http://www.who.int/influenza/surveillance_monitoring/fluid/en/). asia pacific strategy for emerging diseases 2010. new delhi: world health organization regional office for south-east asia; 2011 (http://apps.searo.who.int/pds_docs/b4694.pdf). western pacific region global influenza surveillance and response system. epidemiological and virological characteristics of influenza in the western pacific region of the world health organization, 2006-2010. plos one. 2012;7(5):e37568. doi:10.1371/journal.pone.0037568 pmid:22675427 jiang l, lee vj, lim wy, chen mi, chen y, tan l, et al. performance of case definitions for influenza surveillance. euro surveill. 2015 06 04;20(22):21145. doi:10.2807/1560-7917.es2015.20.22.21145 pmid:26062645 durand lo, cheng py, palekar r, clara w, jara j, cerpa m, et al. timing of influenza epidemics and vaccines in the american tropics, 2002-2008, 2011-2014. influenza other respir viruses. 2016 may;10(3):170-5. doi:10.1111/irv.12371 pmid:26701079 zhen x, pavlin b, squires rc, chinnayah t, konings f, lee c-k, et al. world health organization regional office for the western pacific ebola emergency support team. ebola preparedness in the western pacific region, 2014. west pac surveill response. 2015 01 26;6(1):66-72. doi:10.5365/wpsar.2014.5.4.004 pmid:25960926 global influenza programme who. a manual for estimating disease burden associated with seasonal influenza. geneva: world health organization; 2015 (http://www.who.int/influenza/resources/publications/manual_burden_of_disease/en/). an outbreak of foodborne norovirus gastroenteritis linked to a restaurant in melbourne, australia, 2014 outbreak investigation report shaun p. coutts,a kaye sturge,a karin lalor,a john a. marshall,b leesa d. bruggink,b nela subasinghec and marion eastona a victorian department of health and human services, melbourne, australia. b victorian infectious diseases reference laboratory, melbourne, australia. c microbiological diagnostic unit public health laboratory, melbourne, australia. correspondence to shaun coutts (email:shaun.coutts@dhhs.vic.gov.au). to cite this article: coutts sp, sturge k, lalor k, marshall ja, bruggink l, subasinghe n, et al. an outbreak of foodborne norovirus gastroenteritis linked to a restaurant in melbourne, australia, 2014. western pac surveill response j. 2017 may;8(2). doi:10.5365/wpsar.2017.8.1.008. abstract introduction: in may 2014 an outbreak of norovirus occurred among patrons of a restaurant in melbourne, australia. investigations were conducted to identify the infectious agent, mode of transmission and source of illness, and to implement controls to prevent further transmission. methods: a retrospective case-control study was conducted to test the hypothesis that food served at the restaurant between 9 and 15 may 2014 was the vehicle for infection. a structured questionnaire was used to collect demographic, illness and food exposure data from study participants. to ascertain whether any food handlers had experienced gastroenteritis symptoms and were a possible source of infection, investigators contacted and interviewed staff who had worked at the restaurant between 9 and 16 may 2014. results: forty-six cases (including 16 laboratory-confirmed cases of norovirus) and 49 controls were interviewed and enrolled in the study. results of the analysis revealed a statistically significant association with illness and consumption of grain salad (or: 21.6, 95% ci: 1.8-252.7, p = 0.015) and beetroot dip (or: 22.4, 95% ci: 1.9-267.0, p = 0.014). an interviewed staff member who reported an onset of acute gastrointestinal illness on 12 may 2014 had prepared salads on the day of onset and the previous two days. discussion: the outbreak was likely caused by person-to-food-to-person transmission. the outbreak emphasizes the importance of the exclusion of symptomatic food handlers and strict hand hygiene practices in the food service industry to prevent contamination of ready-to-eat foods and the kitchen environment. introduction noroviruses are non-enveloped, single-stranded rna viruses, recognized as a leading cause of acute gastroenteritis worldwide.1 there are currently six recognized norovirus genogroups, three of which (gi, gii and giv) cause human illness.2 norovirus is transmitted via the faecal-oral route primarily through close contact with an infected person, contact with contaminated fomites or consumption of contaminated food or water.3 the average incubation period is between 24 and 48 hours, with symptoms including acute-onset vomiting, diarrhoea, nausea, myalgia and low-grade fever.4 infected individuals shed the virus while symptomatic; however, shedding has been documented before the onset of symptoms, after symptoms have resolved and by asymptomatic infected individuals.5-7 contamination of food by both symptomatic and asymptomatic infected food handlers has been well documented.8-14 commencing 13 may 2014, the victorian department of health and human services, communicable disease prevention and control unit received reports of gastrointestinal illness in patrons following a banquet lunch at a mediterranean-style restaurant on 11 may 2014. in response, an outbreak investigation was initiated with the local council health department to identify the infectious agent, the mode of transmission, the source of illness and to implement controls to prevent further transmission. methods epidemiological investigation a retrospective case-control study was conducted to test the hypothesis that food served at the restaurant was the vehicle for infection. study participants were recruited from the restaurant’s booking list and contacted for phone interviews. a structured questionnaire was used to collect demographic, illness and food exposure data from study participants. a probable case was defined as a person who ate food at the restaurant between 9 and 15 may 2014 and had onset of vomiting and/or diarrhoea or two or more symptoms of fever, nausea, abdominal pain and headache between 24 and 48 hours after consumption. a confirmed case met the probable case definition and also had norovirus detected by polymerase chain reaction (pcr) in a faecal specimen. controls were patrons identified during the interview process who did not meet the definition of a probable or confirmed case but had eaten at the restaurant between 9 and 15 may 2014. to ascertain whether any food handlers had experienced gastroenteritis symptoms and were a possible source of infection, investigators contacted and interviewed staff who worked at the restaurant between 9 and 16 may 2014. data analysis was conducted using stata 13 (statacorp, college station, tx). univariate analysis was used to calculate p-values (2-sided fisher exact), odds ratios (or) and 95% confidence intervals (ci) for food exposure variables. variables with a p-value <0.05 in univariate analysis were included in a multivariable logistic regression model. backward elimination was used to refine the model with the variable with the highest p-value >0.05 removed at each elimination step. variables found to be statistically significant on univariate and multivariable analyses were reported. environmental and laboratory investigation environmental health officers from the council health department conducted an environmental investigation at the restaurant. food samples were obtained and tested for salmonella spp., coagulase-positive staphylococci, bacillus cereus and clostridium perfringens at the microbiological diagnostic unit public health laboratory (mdu phl). food samples were not tested for norovirus as the molecular detection of norovirus in food remains prohibitively expensive, time consuming and often unsuccessful because of the heterogeneous distribution of low numbers of virus particles in foods.13 stool specimens were obtained from cases where possible and tested for bacterial enteric pathogens at mdu phl. the specimens were tested for norovirus by reverse transcription polymerase chain reaction (rt-pcr) at the victorian infectious diseases reference laboratory and nucleotide sequencing of norovirus rna was conducted where appropriate, as previously reported.14 ethics and permissions ethics approval was not sought as the investigation was undertaken as part of a public health response to an outbreak. results epidemiological investigation forty-six cases (including 16 confirmed cases) and 49 controls were identified and interviewed. the majority of cases dined at the restaurant on 11 may 2014 with most experiencing an onset of symptoms during the afternoon of 12 may 2014 or the morning of 13 may 2014. the last recorded case ate at the restaurant on 15 may 2014 and had an onset of symptoms on 17 may 2014. an incubation period was recorded for 29 cases, and a median of 28 hours (range 7 to 57 hours) was observed. symptom duration was recorded for 27 cases, and a median duration of two days (range 0.5 to 5 days) was reported. symptom characteristics of the cases are described in table 1. twelve staff members who worked between 9 and 16 may were interviewed during the investigation. only one staff member reported experiencing acute gastroenteritis during this period with an onset of illness on 12 may 2014. the staff member had prepared salads on the day of onset and the previous two days. the staff member was unwilling to provide a faecal specimen for laboratory testing. in univariate analysis, foods significantly associated with illness were the beetroot dip, grain salad (a cold salad containing freekeh wheat, lentils, parsley and nuts), coleslaw, calamari and lamb cutlets (table 2). in the final multivariable logistic regression model, two foods remained significantly associated with illness: the grain salad (or: 21.6, 95% ci: 1.8-252.7, p = 0.015) and the beetroot dip (or: 22.4, 95% ci: 1.9-267.0, p = 0.014). a review of food frequency data revealed 45 cases (98%) recalled eating the grain salad, and one case did not consume any other food from the restaurant except the grain salad. by comparison, only 11 of the 46 cases (24%) reported consumption of the beetroot dip. click to download table 1. jpg, 192kb click to download table 2. jpg, 211kb environmental and laboratory investigation sixteen of the 23 stool specimens were positive for gii norovirus. additional studies indicated this was the epidemic strain gii.pe/gii.4_sydney_2012. all food and stool samples tested were negative for bacterial pathogens. a senior staff member at the restaurant reported the grain salad was generally prepared in batches of approximately 12 kilograms to be used over a period of three to four days. it was mixed in large containers by hand; gloves were not always worn during the mixing process. an unusually large 19 kilogram batch of grain salad was made in preparation for the 11 may 2014 lunch. the salad did not undergo any processing steps (such as cooking) that would have inactivated norovirus potentially introduced by an infected food handler during preparation. the environmental investigation revealed some of the handwashing facilities in food preparation areas were obstructed and not supplied with soap. discussion this point source outbreak of norovirus among restaurant patrons is likely to have been caused by person-to-food-to-person transmission. the results of the case-control study analysis, the higher frequency of consumption of the grain salad among cases, the likelihood an infectious food handler prepared this menu item and the ready-to-eat nature of the product all support the grain salad as the most likely vehicle of infection, though it is possible that the beetroot dip may have also been contaminated. the large batch size of the grain salad and the extended time over which it was served likely contributed to the protracted onsets of illness among patrons. although norovirus infection was not confirmed in any food handlers at the restaurant, it is suspected that ready-to-eat food was contaminated by a food handler during the pre-symptomatic or the early-symptomatic stage of illness. the lack of adequate handwashing facilities in food preparation areas further supports this hypothesis, as does anecdotal evidence that salads were often mixed with bare hands. national food standards in australia require food handlers to take all practical measures to prevent unnecessary contact with ready-to-eat food and detail requirements for the availability and use of handwashing facilities by food handlers.15 national food standards in australia also require a food business to exclude employees having a foodborne disease from handling food until a medical practitioner advises the employee no longer has or is carrying the disease.15 while this requirement aims to minimize the risk of food contamination by ill food handlers, it may also discourage reporting of gastroenteritis among food handlers, many of whom are employed on a casual basis and receive no entitlements when absent from work for medical reasons. several limitations were identified in this study. the retrospective nature of the case-control study makes it impossible to rule out recall bias, which may have been exacerbated by the large number of food choices available on the banquet menu. the lack of a practical method for the molecular detection of norovirus in food samples meant that it was not possible to confirm the presence of norovirus in the implicated foods. food handlers, including asymptomatic individuals, were not tested for norovirus infection during the investigation, so the presence of an infected food handler at the premises could not be laboratory-confirmed. this outbreak emphasizes the importance of the exclusion of symptomatic food handlers and strict hand hygiene practices in the food service industry to prevent contamination of ready-to-eat foods and the kitchen environment. it is essential that food regulators continue to promote and enforce these requirements on food business operators to prevent future outbreaks of norovirus caused by infectious food handlers. conflicts of interest none. funding none. acknowledgements we would like to acknowledge the invaluable assistance provided during this investigation by staff in the department of health and human services communicable disease prevention and control, communicable disease epidemiology and surveillance and east division teams, boroondara city council health services, the microbiological diagnostic unit public health laboratory and the victorian infectious diseases reference laboratory. special thanks to joy gregory and james fielding for their guidance on the preparation of the manuscript. references ahmed sm, hall aj, robinson ae, verhoef l, premkumar p, parashar ud, et al. global prevalence of norovirus in cases of gastroenteritis: a systematic review and meta-analysis. lancet infect dis. 2014 aug;14(8):725-30. doi:10.1016/s1473-3099(14)70767-4 pmid:24981041 robilotti e, deresinski s, pinsky ba. norovirus. clin microbiol rev. 2015 jan;28(1):134-64. doi:10.1128/cmr.00075-14 pmid:25567225 patel mm, hall aj, vinjé j, parashar ud. noroviruses: a comprehensive review. j clin virol. 2009 jan;44(1):1-8. doi:10.1016/j.jcv.2008.10.009 pmid:19084472 matthews je, dickey bw, miller rd, felzer jr, dawson bp, lee as, et al. the epidemiology of published norovirus outbreaks: a review of risk factors associated with attack rate and genogroup. epidemiol infect. 2012 jul;140(07):1161-72. doi:10.1017/s0950268812000234 pmid:22444943 atmar rl, opekun ar, gilger ma, estes mk, crawford se, neill fh, et al. norwalk virus shedding after experimental human infection. emerg infect dis. 2008 oct;14(10):1553-7. doi:10.3201/eid1410.080117 pmid:18826818 rockx b, de wit m, vennema h, vinjé j, de bruin e, van duynhoven y, et al. natural history of human calicivirus infection: a prospective cohort study. clin infect dis. 2002 aug 01;35(3):246-53. doi:10.1086/341408 pmid:12115089 teunis pfm, sukhrie fha, vennema h, bogerman j, beersma mfc, koopmans mpg. shedding of norovirus in symptomatic and asymptomatic infections. epidemiol infect. 2015 jun;143(08):1710-7. doi:10.1017/s095026881400274x pmid:25336060 ozawa k, oka t, takeda n, hansman gs. norovirus infections in symptomatic and asymptomatic food handlers in japan. j clin microbiol. 2007 dec;45(12):3996-4005. doi:10.1128/jcm.01516-07 pmid:17928420 maritschnik s, kanitz ee, simons e, höhne m, neumann h, allerberger f, et al. a food handler-associated, foodborne norovirus gii.4 sydney 2012-outbreak following a wedding dinner, austria, october 2012. food environ virol. 2013 sep 12;5(220). pmid:24026524 friedman ds, heisey-grove d, argyros f, berl e, nsubuga j, stiles t, et al. an outbreak of norovirus gastroenteritis associated with wedding cakes. epidemiol infect. 2005 dec;133(06):1057-63. doi:10.1017/s0950268805004760 pmid:16274502 mayet a, andreo v, bedubourg g, victorion s, plantec j, soullie b, et al. food-borne outbreak of norovirus infection in a french military parachuting unit, april 2011. euro surveill. 2011 july 28;16(30):19930. pmid:21813082 chen m-y, chen w-c, chen p-c, hsu s-w, lo y-c. an outbreak of norovirus gastroenteritis associated with asymptomatic food handlers in kinmen, taiwan. bmc public health. 2016 may 04;16(1):372. doi:10.1186/s12889-016-3046-5 pmid:27143036 stals a, baert l, de keuckelaere a, van coillie e, uyttendaele m. evaluation of a norovirus detection methodology for ready-to-eat foods. int j food microbiol. 2011 feb 28;145(2-3):420-5. doi:10.1016/j.ijfoodmicro.2011.01.013 pmid:21333370 bruggink ld, dunbar nl, catton mg, marshall ja. norovirus genotype diversity associated with gastroenteritis outbreaks in victoria in 2013. commun dis intell q rep. 2015 march 31;39(1):e34-41. pmid:26063096 australia new zealand food standards code. canberra, a.c.t: food standards australia new zealand; 2016 (www.foodstandards.gov.au/code, accessed 28 april 2017). https://ojs.wpro.who.int/ 1wpsar vol 12, no 2, 2021 | doi: 10.5365/wpsar.2020.11.2.012 surveillance system implementation / evaluation p acific island countries and territories (picts) are marked by expansive geography, relatively small populations and diverse cultures. they are also vulnerable to emerging infectious diseases, including epidemics and pandemics, and to natural disasters, including cyclones, earthquakes and tsunamis. for these reasons, the world health organization’s asia pacific strategy for emerging diseases and public health emergencies (apsed iii) guides member states to adopt an all-hazards approach, encompassing both disease outbreaks and natural disasters, to strengthen their capacity to detect, prepare for and respond to outbreaks of infectious diseases and public health emergencies.1 on 30 january 2020, the who director-general declared that the outbreak of novel coronavirus disease 2019 (covid-19) constituted a public health emergency of international concern. as of 30 april 2020, six picts had confirmed cases of covid-19.2 in vanuatu, a country of approximately 290 000 people and composed of 83 islands, the response to covid-19 is guided by the vangov plan (covid-19 health sector preparedness and response plan) developed in january 2020 and revised as the situation evolves.3 priority actions are categorized according to three scenarios: 1 (no cases), 2 (one or more cases or clusters) and 3 (community transmission). a strategic objective of the plan is to ensure that the surveillance system is active and functional. since january 2020, the government of vanuatu has implemented several measures to prevent the importation of covid-19 and contain and mitigate community transmission, including suspending the use of international ports of entry into vanuatu on 23 march 2020 and declaring a state of emergency on 26 march 2020. a department of public health, vanuatu ministry of health, port vila, vanuatu. b vanuatu health program, port vila, vanuatu. c melbourne school of population and global health, the university of melbourne, parkville, victoria, australia. d burnet institute, melbourne, victoria, australia. e vila central hospital, port vila, vanuatu. f country liaison office, world health organization, port vila, vanuatu. g private physician, port vila, vanuatu. h members of the vanuatu ministry of health’s national health emergency operations centre are provided in the acknowledgements. * these authors contributed equally. published: 5 april 2021 doi: 10.5365/wpsar.2020.11.2.012 the pacific island nation of vanuatu is vulnerable to emerging infectious diseases, including epidemics and pandemics; chronic food and water insecurity; and natural hazards, including cyclones, earthquakes, tsunamis, landslides and flooding. in march 2020, the world health organization characterized the outbreak of novel coronavirus disease 2019 (covid-19) as a global pandemic. by the end of april 2020, vanuatu had reported no confirmed cases of covid-19. data from several sources are collected in vanuatu’s covid-19 surveillance system to provide an overview of the situation, including data from case investigations and management, syndromic surveillance for influenza-like illness, hospital surveillance and laboratory surveillance. review of data collected from january to the end of april 2020 suggests that there was no sustained increase in influenza-like illness in the community and no confirmed cases were identified. lessons learnt from the early implementation of surveillance activities, the changing landscape of laboratory testing and pharmaceutical interventions, as well as the global experience, particularly in other pacific island countries, will inform the refinement of covid-19 surveillance activities in vanuatu. challenges to implementation and strengthening of initial covid-19 surveillance in vanuatu: january–april 2020 wendy williams,a,* caroline van gemert,b,c,d,* joanne mariasua,a edna iavro,a debbie fred,a,b johnny nausien,a obed manwo,a vincent atua,a,e george junior pakoa,a,e annie taissets,a tessa b knox,f michael buttsworth,f geoff clark,b matthew cornish,g posikai samuel tapo,a len tarivonda,a and philippe guyant,f on behalf of the vanuatu ministry of health’s national health emergency operations centreh correspondence to caroline van gemert (email: caroline.vangemert@unimelb.edu.au or caroline.vangemert@vhp.com.vu). wpsar vol 12, no 2, 2021 | doi: 10.5365/wpsar.2020.11.2.012 https://ojs.wpro.who.int/2 williams et alcovid-19 surveillance in vanuatu, january–april 2020 enhancement of systems for covid-19 surveillance a sentinel surveillance system for private clinics in port vila was established in march 2020 among general practitioners. the objective was to rapidly identify imported cases and monitor community-level transmission of covid-19 among expatriates, who predominantly use private clinics. clinics were requested to submit daily reports via a web form of the number of consultations and the number of people presenting with ili (table 2). active hospital-based surveillance activities were established in april 2020 to monitor and rapidly identify any cases of severe acute respiratory infection (sari) or pneumonia-related presentations to emergency departments, and hospitalizations and deaths. data were collected daily from the main referral hospital in port vila and five provincial hospitals (table 2). in addition, data on the number of tablets of paracetamol dispensed through the emergency department were collected weekly. a surveillance officer contacted all hospitals daily to verbally collect information on new admissions for sari or pneumonia, and weekly for paracetamol dispensing. case investigation and management protocols were developed to investigate all suspected cases: a public health officer interviews all suspected cases to determine whether the person meets the case definition and the possible source of transmission, to identify close contacts and to implement steps to minimize ongoing transmission. the initial protocol implemented in january 2020 was for suspected cases to be immediately isolated at home to prevent onward transmission; it has since been temporarily revised to implement hospital-based isolation of suspected cases in a specific ward. hospitalization of suspected cases became necessary due to the length of time required to receive laboratory results (average: 4.1 days) and the need to control the risk of potential transmission during this time. we describe the implementation of the initial covid-19 surveillance system established in vanuatu between january and april 2020, focusing on its design, challenges and the modifications required. ethics statement the vanuatu health research ethics committee advised that ethics approval was not required because data were being collected as part of the pandemic response and in line with the vanuatu public health act no. 22 of 1994. the surveillance system, modifications and interventions the objective of the covid-19 surveillance system in vanuatu is to rapidly identify and contain any imported or community-acquired cases of covid-19 (table 1). the framework for surveillance systems suggested by heymann4 was used to describe the system, which collates data from several sources. existing data collection systems the vanuatu public health sentinel surveillance network is part of the regional pacific public health surveillance network.5 eleven sites in vanuatu report weekly on five core syndromes: (i) acute fever and rash, (ii) prolonged fever, (iii) influenza-like illness (ili), (iv) watery diarrhoea, and (v) illnesses that are like dengue, zika or chikungunya.5 these syndromes are monitored as part of the all-hazards approach to tracking infectious diseases related to both outbreaks and natural disasters. data are compiled weekly and sent to the national surveillance unit via e-mail, phone or short message service (that is, sms or text), and they are manually entered into a custom excel database. ili data are monitored because the symptoms of covid-19 are clinically similar to influenza (table 2). a pre-established threshold was set (n = 426 per week) to generate an alert and prompt action if the number of reported cases is greater than expected for seasonal influenza. standard reporting is by epidemiological week (epi week), with week 1 ending 5 january 2020. wpsar vol 12, no 2, 2021 | doi: 10.5365/wpsar.2020.11.2.012https://ojs.wpro.who.int/ 3 covid-19 surveillance in vanuatu, january–april 2020williams et al table 1. main objectives and interventions of the surveillance response to the covid-19 pandemic, as per the vangov plan (covid-19 health sector preparedness and response plan), vanuatu, january–april 2020 covid-19: coronavirus disease 2019; ili: influenza-like illness; sari: severe acute respiratory infection. objectives scenario and interventions 1 (no cases) 2 (≥ 1 case, imported or locally detected [sporadic], or clusters of cases) 3 (community transmission) early detection and isolation of suspected covid-19 cases by an active and functional surveillance system use who definition to test suspected cases. train workers at sentinel sites, health-care workers and private practitioners about case definition and notification and reporting channels. use who definition to test suspected cases. provide refresher training to workers at sentinel sites, health-care workers and private practitioners about case definition and notification and reporting channels. enhance syndromic surveillance system, focusing on influenza-like illness and covid-19 in public health facilities, and enhance eventbased surveillance system in private health facilities. test if patient has symptoms, and implement contact tracing and monitoring. enhance syndromic surveillance system, focusing on influenza-like illness and covid-19 in public health facilities, and enhance event-based surveillance system in private health facilities. implement sampling strategy for testing, depending on number of suspected cases. table 2. summary of sentinel and hospital surveillance activities related to the covid-19 pandemic, vanuatu, january–april 2020 network or site number of sites coverage area site type (number) start date type of data used for covid-19 surveillance vanuatu public health sentinel surveillance network 11 national hospital (n = 6) health centre (n = 5) predated covid-19 ili general practitioner sentinel sites 7 port vila only private clinic (n = 5) 23 march 2020 ili hospital-based surveillance 6 national hospital (n = 6) 20 march 2020 ili (captured through the vanuatu public health sentinel surveillance network), sari, pneumonia, deaths, number of paracetamol tablets dispensed covid-19: coronavirus disease 2019; who: world health organization. wpsar vol 12, no 2, 2021 | doi: 10.5365/wpsar.2020.11.2.012 https://ojs.wpro.who.int/4 williams et alcovid-19 surveillance in vanuatu, january–april 2020 implementation of the new system january–april 2020 existing systems the number of ili cases reported through the vanuatu public health sentinel surveillance network fluctuated between epi week 1 (ew1) and ew18 (range: 156–489; table 3). in ew18, there were 212 reports of ili, a decrease of 25 from the previous week (n = 237). the number of ili reports did not reach the threshold during the period (table 3). enhancement for covid-19 surveillance among reports submitted from seven private clinics in the general practitioners’ sentinel surveillance system between ew14 and ew18, there were also fluctuations in the number of consultations for ili (range: 6–45), and a sustained increase was not observed (table 3). only pneumonia-related hospitalization data were available for the period; sari data were not available. pneumonia hospitalization data were received from five of six hospitals in vanuatu beginning in ew14. the number of new admissions for pneumonia decreased from four to one between ew14 and ew18 (table 3). the number of paracetamol tablets dispensed through the emergency department was greatest in ew17 (n = 1340, table 3). enhancing case investigation and management between january and april 2020, two people met the who case definition of a suspected case. both patients had symptoms of ili and had recently travelled overseas. both of these patients isolated at home until the results of their covid-19 tests were known. these patients were reported as suspected cases on 19 march and 30 march 2020. laboratory testing of specimens between january and april 2020, covid-19 testing was not available in vanuatu, and all specimens were sent to new caledonia for molecular testing. as of 30 april 2020, 24 specimens from 19 people had been sent to new caledonia; of these, specimens were from eight people identified in private clinics (42%), two people from government-run health clinics (11%) and the remainder laboratory testing vanuatu’s strategy for covid-19 laboratory testing during the period of interest was to collect and refer for testing specimens from individuals who met who’s definition of a suspected case.6 in limited circumstances and in consideration of the global shortage of molecular testing reagents for covid-19,7 precautionary testing was undertaken for selected additional individuals. isolation and treatment of cases since february 2020, the vanuatu health ministry has undertaken significant measures to strengthen the country’s medical capacity to manage patients with severe covid-19, including establishing a dedicated intensive care unit for patients needing critical care and a ward for patients with mild disease who cannot isolate at home. contact management, identification, case finding and quarantine protocols using who’s definition of a close contact6 were established for contact tracing to rapidly identify contacts of confirmed cases to determine possible sources of infection and to prevent onward transmission. the protocol specified that asymptomatic close contacts of confirmed cases were to be quarantined in a designated facility or at home for 14 days from their last date of exposure, as per section 12 of the vanuatu public health act no. 22 of 1994, which allows for the isolation and detainment of a person recently exposed to infection or who may be in the incubation stage of any notifiable disease.8 if close contacts developed symptoms, as per the who case definition,6 they were to be referred to hospital for isolation and testing. management of international arrivals quarantine in a government-designated facility for a period of 14 days is required for all people arriving in vanuatu from 20 march 2020 onwards. protocols were developed to monitor people in quarantine: provincial public health teams conducted daily visits to screen for symptoms of respiratory illness and fever. all people working in the quarantine facilities, including transport providers, hotel front desk clerks, cleaners, kitchen workers and security officers received training from the vanuatu ministry of health. wpsar vol 12, no 2, 2021 | doi: 10.5365/wpsar.2020.11.2.012https://ojs.wpro.who.int/ 5 covid-19 surveillance in vanuatu, january–april 2020williams et al contact management and quarantine as there were no confirmed cases during the study period, contact tracing was not initiated. managing international arrivals as of 30 april 2020, a total of 98 people arriving from overseas had completed quarantine. the majority (n = 61; 62%) were passengers on the two last flights arriving into vanuatu on 21 march 2020 before the border was closed. discussion the aims of a national surveillance system depend on a country’s pandemic response strategy as well as the local (n = 9; 47%) were identified through the vila central hospital emergency department or outpatient clinic. due to border control measures, each dispatch of samples required government approval and significant logistical coordination. the average number of days from specimen collection to test result was 4.1, with a range of 1–12 days. the samples from the two patients who met the who definition of a suspected case had test results in 2 and 5 days and both were identified by private clinics. the remainder of cases did not meet the who case definition and so had precautionary tests. none of the samples tested during this period was positive. isolation and treatment as there were no confirmed cases during the study period, the isolation and treatment of cases was not required. nc: data not collected prior to march 2020 when additional surveillance activities were implemented. table 3. data collected through various surveillance activities for covid-19, by epidemiological week (epi week), vanuatu, january–april 2020 week indicator (system) start date end date epi week influenzalike illness (vanuatu public health sentinel surveillance network) influenzalike illness (private clinic syndromic surveillance) pneumonia (hospital surveillance) number of tablets of paracetamol dispensed through emergency department 30/12/2019 5/01/2020 1 489 nc nc nc 6/01/2020 12/01/2020 2 250 nc nc nc 13/01/2020 19/01/2020 3 205 nc nc nc 20/01/2020 26/01/2020 4 341 nc nc nc 27/01/2020 2/02/2020 5 191 nc nc nc 3/02/2020 9/02/2020 6 238 nc nc nc 10/02/2020 16/02/2020 7 205 nc nc nc 17/02/2020 23/02/2020 8 171 nc nc nc 24/02/2020 1/03/2020 9 319 nc nc nc 2/03/2020 8/03/2020 10 198 nc nc nc 9/03/2020 15/03/2020 11 292 nc nc nc 16/03/2020 22/03/2020 12 273 nc nc nc 23/03/2020 29/03/2020 13 268 18 nc nc 30/03/2020 5/04/2020 14 224 45 4 50 6/04/2020 12/04/2020 15 156 40 4 170 13/04/2020 19/04/2020 16 209 14 2 915 20/04/2020 26/04/2020 17 237 6 1 1340 27/04/2020 3/05/2020 18 212 13 1 790 wpsar vol 12, no 2, 2021 | doi: 10.5365/wpsar.2020.11.2.012 https://ojs.wpro.who.int/6 williams et alcovid-19 surveillance in vanuatu, january–april 2020 in the context of having no confirmed cases and in the absence of widespread availability of pharmaceutical interventions, such as treatment or vaccination, reopening the border may result in the importation of covid-19 to vanuatu. the various surveillance components described here are critical to rapidly detecting and containing any imported cases. mathematical modelling data are not available to enable vanuatu to predict the impact of imported cases using current population data and covid-19 parameters, but they would be useful to guide the evolving response. several picts were also affected by tropical cyclone harold in april 2020.12 harold impacted vanuatu on 6–7 april 2020 as a category 5 cyclone. more than 160 000 people, approximately 55% of the population, reside in areas that were affected by the cyclone.13 harold occurred during a period of rapid scale-up and strengthening of covid-19 surveillance activities. the implementation and strengthening of ili surveillance in provinces affected by the cyclone were complicated by the emergence of several post-disaster outbreak-prone diseases that also have symptoms of ili, such as dengue and leptospirosis. where possible, the vanuatu health ministry sought to harmonize surveillance activities, as demonstrated through the collection of data about ili and injuries through pre-existing and new surveillance activities. strategies to conduct disease surveillance for two events simultaneously at such a large scale is unprecedented in vanuatu and elsewhere, and guideline developers should consider providing information about how to respond to a similar situation in the future. several additional limitations should be considered when assessing the implementation of vanuatu’s covid-19 surveillance; these include pre-existing shortages of clinical and public health workers, limited pre-existing epidemiological capacity within vanuatu’s health ministry, the country’s geographical isolation and small population, and its limited laboratory capacity. nonetheless, the vanuatu health ministry and its partners have rapidly scaled up surveillance activities in a complex, challenging and rapidly changing epidemiological landscape. the covid-19 response is continuing in vanuatu and will adapt as the epidemiological context changes. lessons from the early implementation of surveillance epidemiological context and laboratory and health facility capacities. the objectives may be to identify severe cases, asymptomatic cases, clusters of cases or a combination of these. because no cases have been detected in vanuatu as of 30 april 2020, the aims of surveillance for covid-19 are to rapidly detect and contain any imported cases. achieving these aims relies on timely and accurate laboratory testing. the absence of in-country testing between january and april 2020 significantly limited vanuatu’s initial capacity to respond effectively to the covid-19 threat. for most picts, including vanuatu, in-country laboratory testing was not available until may 2020. if a case had been detected before may, the capacity of the country to implement timely containment and mitigation measures would have been reduced due to the lag between specimen collection and receiving results. in march 2020, a rapid molecular test using the genexpert platform (cepheid, sunnyvale, ca, usa), which provides fully automated, easy-to-use point-ofcare molecular testing,9 was approved for covid-19 testing by the us food and drug administration. the joint incident management team (coordinated by the who representative office in the south pacific) procured genexpert cartridges and machines from the manufacturer for distribution across picts.10 as a result, in-country laboratory testing in vanuatu became available in may 2020, and this has strengthened vanuatu’s capacity to respond to covid-19. a testing strategy has been developed that considers both the epidemiological situation in vanuatu and the anticipated limited availability of cartridges due to staggered distribution and the global shortage of consumables, including swabs. the absence of confirmed cases in vanuatu and elsewhere cannot be interpreted as an absence of circulating virus, especially in countries where there is limited testing capacity. currently, there is no international guidance about how to verify the absence of circulating virus. data collected by the various syndromic surveillance systems in vanuatu will continue to be used to monitor and verify the absence of confirmed cases. internationally, severe and critical cases comprise around 20% of diagnosed cases of covid-1911 and, therefore, we assume that any undetected circulating virus would result in an increase in ili in primary health care facilities and pneumonia in hospitals. wpsar vol 12, no 2, 2021 | doi: 10.5365/wpsar.2020.11.2.012https://ojs.wpro.who.int/ 7 covid-19 surveillance in vanuatu, january–april 2020williams et al conflicts of interest all authors declare they have no conflicts of interest. funding statement the vanuatu ministry of health has received funding to support its response to covid-19 from several partners, including the asian development bank, the australian department of foreign affairs and trade, the new zealand ministry of foreign affairs and trade, the united nations children’s fund, the united nations population fund, the united states agency for international development and the world health organization. references 1. asia pacific strategy for emerging diseases and public health emergencies (apsed iii): advancing implementation of the international health regulations (2005). manila: world health organization regional office for the western pacific; 2017. available from: https://iris.wpro.who.int/handle/10665.1/13654, accessed 28 may 2020. 2. coronavirus disease 2019 (covid-19): situation report –101, 30 april 2020. geneva: world health organization; 2020. available from: https://www.who.int/emergencies/diseases/novel-coronavirus-2019/situation-reports, accessed 28 may 2020. 3. vangov plan: covid-19 health sector preparedness and response plan, 8 april 2020. port vila: vanuatu ministry of health; 2020. available from: https://covid19.gov.vu/index.php/know-do/ vangov-plan, accessed 28 may 2020. 4. heymann dl. control of communicable diseases manual, 20th edition. washington (dc): american public health association; 2015. 5. kool jl, paterson b, pavlin bi, durrheim d, musto j, kolbe a. pacific-wide simplified syndromic surveillance for early warning of outbreaks. glob public health. 2012;7(7):670–81. doi:10.1080/ 17441692.2012.699536 pmid:22823595 6. global surveillance for human infection with novel coronavirus (2019-ncov):interim guidance, 31 january 2020. geneva: world health organization; 2020. available from: https://apps.who.int/ iris/handle/10665/330857, accessed 28 may 2020. 7. laboratory testing strategy recommendations for covid-19: interim guidance, 21 march 2020. geneva: world health organization; 2020. available from: https://apps.who.int/iris/handle/10665/331509, accessed 28 may 2020. 8. public health act no. 22 of 1994. port vila, vanuatu: republic of vanuatu; 1994. available from: http://www.paclii.org/vu/legis/ num_act/pha1994126.pdf, accessed 28 may 2020. 9. xpert® xpress sars-cov-2: instructions for use. for use under an emergency use authorization (eua) only. silver spring (md): us food and drug administration; 2021. available from: https:// www.fda.gov/media/136314/download, accessed 27 january 2021. activities during scenario 1 (no cases), the changing landscape of laboratory testing and pharmaceutical interventions, as well as the global experience, particularly in other picts, will inform the refinement of covid-19 surveillance activities in vanuatu. acknowledgements the vanuatu ministry of health’s national health emergency operations centre comprises the following organizations (and individuals): vanuatu ministry of health (agnes matthias, cassidy vusi, edmond tavala, george pakoa, henry lakeleo, jean jacques rory, jimmy obed, julian lasekula, karel haal, kenslyne lele, len tarivonda, leonard tabilip, mahlon tari, melissa binihi, menie nakomaha, meriam ben, nellie ham, nerida hinge, rebecca iaken, renata amos, charlie robinson, roderick mera, russel tamata, sam posikai, sam mahit, sandy moses sawan, sero kalkie, vincent atua, viran tovu, wendy williams, wesley donald, wilson lilip, yvette nale), australian volunteers program (danielle clark, melanie wratten), israaid (kristina mitchell), redr (rowan lulu), the pacific community (mia ramon), united nations population fund (emily deed), united nations children’s fund (lawrence nimoho, rebecca olul, suren vanchinkhuu), vanuatu health program (caroline van gemert, geoff clark, jack obed, nish vivekananthan, shirley tokon, tim egerton), world health organization (fasihah taleo, griffith harrison, michael buttsworth, myriam abel, philippe guyant, tessa knox, tsogy bayandorj). the authors thank the clinics in the general practitioner sentinel surveillance system, including novo medical, the medical centre, family care centre, neil thomas ministries mini hospital, medical options and the vanuatu private hospital. the authors also thank all the health facilities participating in the pacific public health surveillance network and hospital surveillance systems. caroline van gemert holds an early career research fellowship, funded by the australian national health and medical research council. the vanuatu health program is funded by the australian department of foreign affairs and trade’s australian aid program. https://iris.wpro.who.int/handle/10665.1/13654 https://www.who.int/emergencies/diseases/novel-coronavirus-2019/situation-reports https://www.who.int/emergencies/diseases/novel-coronavirus-2019/situation-reports https://covid19.gov.vu/index.php/know-do/vangov-plan https://covid19.gov.vu/index.php/know-do/vangov-plan https://doi.org/10.1080/17441692.2012.699536 https://doi.org/10.1080/17441692.2012.699536 https://www.ncbi.nlm.nih.gov/entrez/query.fcgi?cmd=retrieve&db=pubmed&list_uids=22823595&dopt=abstract https://apps.who.int/iris/handle/10665/330857 https://apps.who.int/iris/handle/10665/330857 https://apps.who.int/iris/handle/10665/331509 https://apps.who.int/iris/handle/10665/331509 http://www.paclii.org/vu/legis/num_act/pha1994126.pdf http://www.paclii.org/vu/legis/num_act/pha1994126.pdf https://www.fda.gov/media/136314/download https://www.fda.gov/media/136314/download wpsar vol 12, no 2, 2021 | doi: 10.5365/wpsar.2020.11.2.012 https://ojs.wpro.who.int/8 williams et alcovid-19 surveillance in vanuatu, january–april 2020 12. tropical cyclone harold challenges disaster and public health management. geneva: world meteorological organization; 2020. available from: https://public.wmo.int/en/media/news/tropical-cyclone-harold-challenges-disaster-and-public-health-management, accessed 28 may 2020. 13. situation update 02: tropical cyclone harold: potentially affected population and sectoral needs. port vila: vanuatu national disaster management office; 2020. available from: https://ndmo. gov.vu/resources/downloads/categor y/99-situation-updateinfograph?download=334:02-situation-update-affected-population-per-aerial-assessment-report-08-april-2020, accessed 8 may 2020. 10. novel coronavirus (covid-19) pacific preparedness & response: joint external situation report #10, 2 april 2020. suva: world health organization representative office in the south pacific; 2020. available from: https://www.who.int/docs/default-source/ wpro---documents/dps/outbreaks-and-emergencies/covid-19/ covid-19-pacific-situation-report-10.pdf?sfvrsn=b1c45d82_6, accessed 28 may 2020. 11. wu z, mcgoogan jm. characteristics of and important lessons from the coronavirus disease 2019 (covid-19) outbreak in china: summary of a report of 72 314 cases from the chinese center for disease control and prevention. jama. 2020;323(13):1239–42. doi:10.1001/jama.2020.2648 pmid:32091533 https://public.wmo.int/en/media/news/tropical-cyclone-harold-challenges-disaster-and-public-health-management https://public.wmo.int/en/media/news/tropical-cyclone-harold-challenges-disaster-and-public-health-management https://ndmo.gov.vu/resources/downloads/category/99-situation-update-infograph?download=334:02-situation-update-affected-population-per-aerial-assessment-report-08-april-2020,accessed https://ndmo.gov.vu/resources/downloads/category/99-situation-update-infograph?download=334:02-situation-update-affected-population-per-aerial-assessment-report-08-april-2020,accessed https://ndmo.gov.vu/resources/downloads/category/99-situation-update-infograph?download=334:02-situation-update-affected-population-per-aerial-assessment-report-08-april-2020,accessed https://ndmo.gov.vu/resources/downloads/category/99-situation-update-infograph?download=334:02-situation-update-affected-population-per-aerial-assessment-report-08-april-2020,accessed https://www.who.int/docs/default-source/wpro---documents/dps/outbreaks-and-emergencies/covid-19/covid-19-pacific-situation-report-10.pdf?sfvrsn=b1c45d82_6 https://www.who.int/docs/default-source/wpro---documents/dps/outbreaks-and-emergencies/covid-19/covid-19-pacific-situation-report-10.pdf?sfvrsn=b1c45d82_6 https://www.who.int/docs/default-source/wpro---documents/dps/outbreaks-and-emergencies/covid-19/covid-19-pacific-situation-report-10.pdf?sfvrsn=b1c45d82_6 https://doi.org/10.1001/jama.2020.2648 https://www.ncbi.nlm.nih.gov/entrez/query.fcgi?cmd=retrieve&db=pubmed&list_uids=32091533&dopt=abstract https://ojs.wpro.who.int/ 1wpsar vol 12, no 1, 2021 | doi: 10.5365/wpsar.2020.11.2.006 outbreak investigation report c oronavirus disease 2019 (covid-19) was first detected in wuhan, china, on 31 december 2019.1 the first confirmed case of covid-19 imported from wuhan to hong kong sar (china) was recorded on 23 january 2020,2 and on 30 january 2020 the world health organization (who) declared the covid-19 outbreak a public health emergency of international concern.3 between january and may 2020, 1084 confirmed cases of covid-19 were reported in hong kong sar (china). the local epidemic progressed through four phases: (1) preparedness and imported infection from mainland china, (2) local transmission, (3) imported infection from overseas countries associated with local transmission, and (4) controlled imported infection with limited local transmission.4 during the second phase – local transmission (4 february to 3 march) – we reported a local family cluster of six confirmed covid-19 cases among 29 people who attended a chinese new year family dinner gathering in a restaurant on 26 january 2020 (the second day of chinese new year). methods we conducted an epidemiological investigation of a confirmed case of covid-19. on 10 february 2020, we received notification of a confirmed case of covid-19 involving a 37-year-old female (patient 1) who had developed fever, cough and sore throat from 2 february 2020. she was admitted to a public hospital on 10 february 2020 and her nasopharyngeal aspirate tested positive for severe acute respiratory syndrome coronavirus 2 (sars-cov-2) ribonucleic acid (rna) using real-time reverse transcription polymerase chain reaction. symptomatic contacts were isolated in public hospitals for sars-cov-2 testing and management. asymptomatic close contacts were quarantined in quarantine centres, while other contacts who were asymptomatic were put under medical surveillance. results patient 1 was home based, had no recent travel history outside hong kong sar (china) and denied having any contact with confirmed covid-19 cases. contact tracing revealed that her husband (patient 2), who resided with her, developed fever and cough on 30 january 2020. in addition, her father (patient 3), who did not reside with her, developed fever and cough from 3 february 2020. patients 2 and 3 were admitted for isolation on 10 february 2020 and tested positive for sars-cov-2. patients 1–3 shared a chinese new year dinner with 26 other relatives on 26 january 2020. between 31 january and 8 february 2020, three more relatives were found to be symptomatic and tested positive for sars-cov-2 (patients 4–6). the 29 attendees at the dinner lived in various separate residences, and the family dinner was the only common exposure among all six confirmed cases during the incubation period. the dinner, which was held in a restaurant, lasted for about 7 hours and included mahjong playing. three of the six confirmed cases had played mahjong. the 29 diners were seated at two tables in the same room, in a partitioned area within the restaurant. none of the attendees were symptomatic during the gathering. the restaurant where the outbreak occurred was closed permanently because of business considerations before the notification of a covid-19 case a communicable disease branch, centre for health protection, department of health, hong kong sar (china). published: 16 february 2021 doi: 10.5365/wpsar.2020.11.3.006 coronavirus disease 2019 (covid-19) outbreak during a chinese new year dinner in a restaurant, hong kong sar (china), 2020 tsz-sum lam,a chi-hong wong,a wing-hang lam,a ho-yeung lam,a yonnie chau-kuen lam,a emily chi-mei leunga and shuk-kwan chuanga correspondence to tsz-sum lam (smo_epi1@dh.gov.hk) wpsar vol 12, no 1, 2021 | doi: 10.5365/wpsar.2020.11.2.006 https://ojs.wpro.who.int/2 lam et alcovid-19 outbreak during a chinese new year dinner in a restaurant, hong kong sar (china) covid-19.5 mahjong is generally played by four people sitting around a square table in close proximity for hours, with the distance between players usually being less than 1 m (a distance at which transmission of respiratory droplets is possible). a chinese dinner is commonly shared by 12 diners sitting close together at a round table, but in this particular instance, 29 diners were seated at two tables that usually accommodated 24 people, further reducing the distance between people. this investigation had limitations. information on viral load might have indicated who was more likely to be the heavier spreader, but no laboratory investigation of viral load was conducted. also, it was not possible to undertake contact tracing of the wait staff or conduct environmental investigations. it appears that some people can be positive for covid-19 for 1 to 3 days before they develop symptoms.6 although the source of the family cluster could not be identified, our findings support pre-symptomatic transmission and effective human-to-human transmission of covid-19 through social activities. non-pharmaceutical interventions (e.g. social distancing) have been associated with reduced transmission of covid-19 in on 10 february 2020. hence, it was not possible to undertake contact tracing of the wait staff or environmental investigations. contact tracing identified one domestic helper (patient 7) who did not join the family dinner but shared a bedroom with patient 4 (symptom onset on 31 january); patient 7 developed a fever and cough from 2 february and tested positive for sars-cov-2 (fig. 1) (four other members of that household were sent to a quarantine centre and were not infected). in summary, the cluster was six (from the family cluster) plus one (the domestic helper) confirmed cases, comprising three males and four females aged between 32 and 75 years (median: 37 years). none of the seven patients had a travel history outside hong kong sar (china) and they all denied having any contact with confirmed covid-19 cases during the incubation period; all seven were discharged home uneventfully. discussion who advises maintaining social distancing of at least 1 m (3 feet) as a basic protective measure against 5 4 3 2 1 16 ja n 2 02 0 5 f eb 20 20 6 f eb 20 20 7 f eb 20 20 8 f eb 20 20 9 f eb 20 20 10 f eb 20 20 11 f eb 20 20 22 f eb 20 20 25 ja n 2 02 0 26 ja n 2 02 0 27 ja n 2 02 0 28 ja n 2 02 0 29 ja n 2 02 0 30 ja n 2 02 0 31 ja n 2 02 0 1 f eb 20 20 2 f eb 20 20 3 f eb 20 20 4 f eb 20 20 family dinner n um be r of c as es date of symptom onset primary case secondary case fig. 1. epidemic curve of chinese new year restaurant dinner covid-19 outbreak wpsar vol 12, no 1, 2021 | doi: 10.5365/wpsar.2020.11.2.006https://ojs.wpro.who.int/ 3 covid-19 outbreak during a chinese new year dinner in a restaurant, hong kong sar (china)lam et al 2. latest situation of cases of covid-19 in hong kong. hong kong sar (china): centre for health protection, department of health; 2020. available from: https://www.chp.gov.hk/files/pdf/local_situation_covid19_en.pdf, accessed 22 october 2020. 3. who statement on the second meeting of the international health regulations (2005) emergency committee regarding the outbreak of novel coronavirus (2019-ncov). geneva: world health organization; 30 january 2020. available from: https://www.who.int/ news-room/detail/30-01-2020-statement-on-the-second-meetingof-the-international-health-regulations-(2005)-emergency-committee-regarding-the-outbreak-of-novel-coronavirus-(2019-ncov), accessed 22 october 2020. 4. lam hy, lam ts, wong ch, lam wh, leung cme, au kwa, et al. the epidemiology of covid-19 cases and the successful containment strategy in hong kong-january to may 2020. int j infect dis. 2020 sep;98:51–8. doi:j.ijid.2020.06.057 pmid:32579906 5. who coronavirus disease (covid-19) advice for the public. geneva: world health organization; 2020. available from: https://www. who.int/emergencies/diseases/novel-coronavirus-2019/advice-forpublic, 22 october 2020. 6. who coronavirus disease 2019 (covid-19) situation report 73. geneva: world health organization; 2 april 2020. available from: https://www.who.int/docs/default-source/coronaviruse/situationreports/20200402-sitrep-73-covid-19.pdf?sfvrsn=5ae25bc7_2, accessed 22 october 2020. 7. cowling bj, ali st, ng twy, tsang tk, li jcm, fong mw, et al. impact assessment of non-pharmaceutical interventions against coronavirus disease 2019 and influenza in hong kong: an observational study. lancet public health. 2020 may;5(5):e279–88. doi:s2468-2667(20)30090-6 pmid:32311320 hong kong sar (china).7 the centre for health protection appeals to the public to properly maintain social distancing at all times during the covid-19 pandemic. acknowledgements the authors would like to thank the staff of the communicable disease branch and public health laboratory services branch of the centre for health protection, hong kong sar (china) for their contributions to the outbreak investigation. funding none. conflicts of interest no potential conflicts of interest were reported by the authors. references 1. novel coronavirus (2019-ncov) situation report 1. geneva: world health organization; 21 january 2020. available from: https://www.who.int/docs/default-source/coronaviruse/situationreports/20200121-sitrep-1-2019-ncov.pdf?sfvrsn=20a99c10_4, accessed 22 october 2020. https://www.chp.gov.hk/files/pdf/local_situation_covid19_en.pdf https://www.chp.gov.hk/files/pdf/local_situation_covid19_en.pdf https://www.who.int/news-room/detail/30-01-2020-statement-on-the-second-meeting-of-the-international-health-regulations-(2005)-emergency-committee-regarding-the-outbreak-of-novel-coronavirus-(2019-ncov) https://www.who.int/news-room/detail/30-01-2020-statement-on-the-second-meeting-of-the-international-health-regulations-(2005)-emergency-committee-regarding-the-outbreak-of-novel-coronavirus-(2019-ncov) https://www.who.int/news-room/detail/30-01-2020-statement-on-the-second-meeting-of-the-international-health-regulations-(2005)-emergency-committee-regarding-the-outbreak-of-novel-coronavirus-(2019-ncov) https://www.who.int/news-room/detail/30-01-2020-statement-on-the-second-meeting-of-the-international-health-regulations-(2005)-emergency-committee-regarding-the-outbreak-of-novel-coronavirus-(2019-ncov) https://doi.org/10.1016/j.ijid.2020.06.057 https://www.ncbi.nlm.nih.gov/entrez/query.fcgi?cmd=retrieve&db=pubmed&list_uids=32579906&dopt=abstract https://www.who.int/emergencies/diseases/novel-coronavirus-2019/advice-for-public https://www.who.int/emergencies/diseases/novel-coronavirus-2019/advice-for-public https://www.who.int/emergencies/diseases/novel-coronavirus-2019/advice-for-public https://www.who.int/docs/default-source/coronaviruse/situation-reports/20200402-sitrep-73-covid-19.pdf?sfvrsn=5ae25bc7_2 https://www.who.int/docs/default-source/coronaviruse/situation-reports/20200402-sitrep-73-covid-19.pdf?sfvrsn=5ae25bc7_2 https://doi.org/10.1016/s2468-2667(20)30090-6 https://www.ncbi.nlm.nih.gov/entrez/query.fcgi?cmd=retrieve&db=pubmed&list_uids=32311320&dopt=abstract https://www.who.int/docs/default-source/coronaviruse/situation-reports/20200121-sitrep-1-2019-ncov.pdf?sfvrsn=20a99c10_4 https://www.who.int/docs/default-source/coronaviruse/situation-reports/20200121-sitrep-1-2019-ncov.pdf?sfvrsn=20a99c10_4 community-associated methicillin-resistant staphylococcus aureus infections in aboriginal children attending hospital emergency departments in a regional area of new south wales, australia: a seven-year descriptive study surveillance report susan thomas,a kristy crooks,b fakhrul islamb and peter d masseyb,c a university of newcastle, newcastle, nsw, australia. b hunter new england local health district, population health, wallsend, nsw, australia. c college of medicine and dentistry, james cook university, cairns, queensland, australia. correspondence to susan thomas (email:susan.thomas@newcastle.edu.au). to cite this article: thomas s, crooks k, islam f, massey pd. community-associated methicillin-resistant staphylococcus aureus infections in aboriginal children attending hospital emergency departments in a regional area of new south wales, australia: a seven-year descriptive study. western pac surveill response j. 2017 december;8(4). doi:10.5365/wpsar.2017.8.1.014 abstract objective: community-associated methicillin-resistant staphylococcus aureus (ca-mrsa) can cause bacterial skin infections that are common problems for aboriginal children in new south wales (nsw). mrsa is not notifiable in nsw and surveillance data describing incidence and prevalence are not routinely collected. the study aims to describe the epidemiology of ca-mrsa in aboriginal children in the hunter new england local health district (hnelhd). methods: we linked data from pathology north laboratory management system (auslab) and the hnelhd patient administration system from 33 hospital emergency departments. data from 2008–2014 for ca-mrsa isolates were extracted. demographic characteristics included age, gender, aboriginality, rurality and seasonality. results: of the 1222 individuals in this study, 408 (33.4%) were aboriginal people. aboriginal people were younger with 45.8% aged less than 10 years compared to 25.9% of non-aboriginal people. most isolates came from aboriginal people who attended the regional tamworth hospital (193/511 isolates from 149 people). a larger proportion of aboriginal people, compared to non-aboriginal people, resided in outer regional (64.9% vs 37.2%) or remote/very remote areas (2.5% vs 0.5%). most infections occurred in summer and early autumn. for aboriginal patients, there was a downward trend through autumn, continuing through winter and spring. discussion: aboriginal people at hnelhd emergency departments appear to represent a greater proportion of people with skin infections with ca-mrsa than non-aboriginal people. ca-mrsa is not notifiable in nsw; however, pathology and hospital data are available and can provide valuable indicative data to health districts for planning and policy development. introduction community-associated methicillin-resistant staphylococcus aureus (ca-mrsa) can cause bacterial skin infections that are common health problems for many australian aboriginal and torres strait islander (hereafter aboriginal) children and families in rural areas in new south wales (nsw).1 the term ca-mrsa distinguishes the infection from mrsa acquired through health-care settings including hospitals. typical infections caused by ca-mrsa include skin and soft tissue infections, boils, impetigo, cellulitis and larger abscesses. ca-mrsa is contagious, transmitted by skin-to-skin contact from infected lesions, contact with contaminated objects or close contact with asymptomatic carriers.2 groups at higher risk of infection include children and young adults, aboriginal people and people of lower socioeconomic status.2 indigenous populations in canada, the united states of america and in pacific island nations have also been associated with a high risk of infection with ca-mrsa attributed possibly to social and financial disadvantage.3 associated risk factors include crowded living conditions with poor housing infrastructure and lack of access to facilities for adequate personal cleansing, pre-existing skin conditions and previous antimicrobial drug treatment.4 mrsa is not notifiable in nsw and hence, surveillance data describing its incidence and prevalence are not routinely collected. such data would be invaluable in the planning, implementation and evaluation of public health programmes designed to prevent and control ca-mrsa. early diagnosis and treatment for ca-mrsa is recommended as delays may lead to serious complications including septicaemia.4 recommended treatment includes incision and drainage of wounds, cautious use of antibiotics (when indicated by pathology and/or when lesions are larger than 5 cm, with systemic sepsis or patients who are immunocompromised), personal cleansing measures (covering draining wounds, regular showering and handwashing and not sharing personal items such as linen, towels, razors), consideration of staphylococcal skin load reduction with bleach baths or formal decolonization for those with recurrent boils and/or household involvement and maintaining close follow-up by primary health care (phc) services.5 these guidelines may not adequately take into account important sociocultural factors or ways of living in aboriginal communities where ca-mrsa infections can impact health, quality of life and contribute to poor school attendance.1 we used routinely collected pathology data from wound and/or skin swabs collected in emergency departments of hospitals in the hunter new england local health district (hnelhd) to describe the epidemiology of ca-mrsa in aboriginal children and young people. for the purpose of this study, we defined ca-mrsa as not 'hospital onset' or 'health-care-associated community origin'. this definition was taken from the study from where our data was collected.6 it reflects both the centers for disease control and prevention (cdc) classification7 and accommodates australian practices and limitations of the data set (table 1). results will inform the development of health policy and community-based programmes to reduce the incidence and prevalence of the infection. table 1. comparison of study definitions of hospital origin (ho) and health-care-associated community onset (haco) methicillin-resistant staphylococcal aureus (mrsa) with the centers for disease control and prevention (cdc) definitions click to download table 1. jpg, 426kb methods the study setting was hnelhd, which covers a large regional area of northern nsw. the region is largely rural with one metropolitan centre in newcastle (fig. 1).8 in 2011, the total population of hnelhd was 875 546 including 46 955 aboriginal people (5.4%). of the total aboriginal population, almost half were aged under 20 years (23 207 or 49.4%) compared to just a quarter of the non-aboriginal population (203 575 or 24.6%).9 fig. 1. map of hunter new england local health district and hospitals, nsw, 2017 click to download figure 1. jpg, 240kb we used routinely collected administrative data linked by laboratory number from a previous study examining the changing epidemiology of staphylococcus aureus in hnelhd. this data set included pathology data from the pathology north laboratory management system (auslab) and patient characteristics and hospitalization data from the hnelhd patient administration system. the study period was 1 january 2008 to 31 december 2014. five of the district's 38 hospitals were excluded as they did not use auslab or data were not available for comparison. from the complete data set of 81 133 positive s. aureus isolates, all those classified as ca-mrsa (n = 7789) were identified. isolates from residents of residential aged-care facilities (n = 398), those not from skin or wound swabs (n = 768), those for which aboriginal and/or torres strait islander status was not recorded (n = 79) and those aged 20 years or older (n = 4335) were removed. swabs collected within two days of an emergency department presentation were included. those taken outside of the two-day period were considered to be from presentations to general practitioners (gp) and were excluded (n = 658). this left 1551 isolates for ca-mrsa from 1222 individuals. the number of isolates by hospital emergency department was used as a measure of burden of disease. from the 1222 individuals with a first isolate of ca-mrsa (as opposed to isolates of repeated testing), demographic characteristics including age, gender and aboriginality were described. street addresses were used to assign a statistical area level 2 (sa2) location to each individual and to classify rurality. seasonality of infection was described using date of first isolate. proportions and counts were analysed using stata 14® and excel 2010®. the australian statistical geography standard (asgc) remoteness structure 2011 was used to classify metropolitan, regional and remote/very remote settings. the asgc: volume 1, 2011 population counts were used to calculate rates within sa2 areas.10 geocoding was conducted using the geocoder optimised for population health epidemiology and research from nsw ministry of health. results of the 1222 individuals in this study, 408 (33.4%) were aboriginal people and 814 (66.6%) were non-aboriginal people (table 2). overall, aboriginal people were younger with 45.8% aged less than 10 years compared to 25.9% of non-aboriginal people. there was a higher proportion of males than females (ratio 1.3/1.0). table 2. number and proportion of individuals aged under 20 years with hospital emergency department wound/skin swabs with ca-mrsa, by age and aboriginality, hunter new england local health district, 2008–2014 click to download table 2. jpg, 217kb of the 1551 isolates, 511 (32.9%) were from aboriginal people. the highest number of isolates from aboriginal people came from those who attended the regional hospital in tamworth (193/511 isolates from 149 people) and john hunter hospital in newcastle (69/511 isolates from 55 people). for non-aboriginal people, most isolates came from people who attended john hunter hospital (256/1040 isolates from 196 people) and maitland hospital (176/1040 isolates from 139 people), which lies within close proximity to newcastle (data not shown). the proportion of aboriginal people residing in outer regional and remote areas (64.9% and 2.5%, respectively) was higher compared to that of non-aboriginal people (37.2% and 0.5%, respectively) (table 3). table 3. number and proportion of individuals aged under 20 years with hospital emergency department wound/skin swabs with ca-mrsa by region, hunter new england local health district, 2008–2014 click to download table 3. jpg, 255kb aboriginal people resided largely in the sa2 locations of the regional centre of tamworth (n = 146, 36.0%) and in armidale (n = 34, 8.4%) (table 4). table 4. number and proportion of individuals aged under 20 years with hospital emergency department wound/skin swabs with ca-mrsa by top 12 geographic locations, hunter new england local health district, 2008–2014 click to download table 4. jpg, 307kb seasonal analysis of ca-mrsa isolates in the study period showed most cases occurred in summer and early autumn. for aboriginal patients, there was a downward trend through autumn, continuing through winter and spring. apart from a peak in early autumn for non-aboriginal patients, the trend was similar for both groups (fig. 2). fig. 2. individuals aged under 20 years with hospital emergency department wound/skin swabs with ca-mrsa, by season, hunter new england local health district, 2008–2014 click to download figure 2. jpg, 345kb ethics ethics approval was obtained for this study by hnelhd human research ethics committee (12/12/12/5.08). discussion overall, aboriginal people accounted for 33.4% of ca-mrsa first isolates in the study period while accounting for just 10.2% of the total population aged under 20 years in the wider hnelhd population.9 aboriginal people in this study tended to live in outer regional, rural or remote areas, especially in the north-west of the state of nsw including tamworth, armidale and inverell. the emergency department at the regional centre of tamworth had the highest number of ca-mrsa isolates identified in aboriginal people. an important and less described finding was that most isolates were from summer months and early autumn when it is warmer, more humid and when children are more likely to be playing outdoors. a similar trend was reported for paediatric patients in rhode island, usa, where approximately 1.85 times as many ca-mrsa infections per emergency department visit occurred in summer and autumn.11 published data describing the local epidemiology of ca-mrsa are limited, impeding informed policy development and health service planning that can address the burden of skin infection experienced by aboriginal families. this study provides new information that can be used to direct health resources to areas within hnelhd where needs are higher and when the number of ca-mrsa infections are high, such as summer and early autumn. there are advantages in using readily available administrative data as a source of surveillance information to inform practice. data are readily available for timely analysis, collected routinely and are easily linked for analysis of trends and patient characteristics. these methods can be reproduced by other local health districts that have access to linked pathology and hospital data. in this way, more information about ca-mrsa infections in nsw can be uncovered. it is known that aboriginal people are more likely to attend hospital emergency departments if access to community-based, culturally safe and appropriate phc is limited. this may occur more often in rural and remote areas.12 it is important to ensure that staff working in emergency departments provide a culturally safe place for aboriginal people to seek care about skin infections. currently the nsw treatment guidelines for skin infections may not incorporate the consideration of important, associated and interwoven contributors such as social, economic, housing and environmental factors in the management of infections.1 tailoring treatment guidelines to respond to these social determinants of health for aboriginal people in rural areas, who access phc in acute settings, may be an effective step to reducing recurrence of disease.1 the emergency department could be an important setting for improving skin health through sharing of health information, initiating referrals and arranging for follow-up of children with skin diseases. ca-mrsa surveillance models, coordinating both hospital and community activities at the local and state level have been proposed as a way of providing a more comprehensive epidemiological assessment.13 local hospitals, general practitioners and other health facilities would be required to collect data from patients and contacts while state authorities would aggregate and disseminate surveillance reports. the resources required to implement such a system would be significant (personnel, materials, time, storage and transportation) and underreporting may be another limitation.13 a five-year incidence study of ca-mrsa in remote communities in canada found high rates of infection with 25% of infections being re-infection. the study concluded that surveillance was important in understanding antibiotic resistance and the changing profile of ca-mrsa.14 while this debate continues, the surveillance of ca-mrsa in nsw could be improved by adopting a uniform surveillance definition for community association. surveillance alone will not solve the problem of bacterial skin infections caused by ca-mrsa. health and other services need to address the contextual factors which cause persistent infection, especially the social determinants,15 normalization of the problem of bacterial skin infections, transgenerational trauma and access to culturally safe and appropriate phc.1 this study has some limitations. using passive surveillance through administrative hospital data has not captured all cases. many people with ca-mrsa use phc, including aboriginal community controlled health services, community health centres and gps, from which data were not available for inclusion. data from some hospitals were not included as they did not use auslab or data were not available due to changes in information systems. these limitations imply that the number of people experiencing ca-mrsa is higher than reported here. as our numerators were uncertain, we were unable to either calculate population rates or use statistical methods to compare results between groups or locations that would have provided additional useful data. ca-mrsa is not notifiable in nsw; however, pathology and hospital administration data can be linked to assist in the estimation of the magnitude and scope of the problem. implementing routine surveillance requires further consideration in light of the costs and limitations of notification of ca-mrsa. timely dissemination of these data can assist in service planning, policy development and evaluation. targeted prevention activities can be designed in collaboration with aboriginal health services for rural hospital emergency departments before and during peak seasons. this would be particularly valuable in rural and remote areas where, in the absence of adequate, culturally safe phc, many aboriginal people utilize hospital emergency departments for management of bacterial skin infections caused by ca-mrsa. further research using administrative pathology data can be undertaken to better understand the phenotypes and antibiotic sensitivity of ca-mrsa affecting aboriginal children in nsw. due to changing patterns of antibiotic resistance, genotyping of regular samples from hospital and community settings would be valuable. conflicts of interest none declared. acknowledgements the authors would like to thank dr jason agostino of the australian national university and associate professor john ferguson, infectious disease physician, hnelhd, for making the data available and for their valuable comments on the manuscript. we also thank professor david durrheim, director of health protection, hnelhd, for his contributions to the manuscript. references thomas s, crooks k, taylor k, massey pd, williams r, pearce g. reducing recurrence of bacterial skin infections in aboriginal children in rural communities: new ways of thinking, new ways of working. aust j prim health. 2017 jul;23(3):229–35. pmid:28068507 doi:10.1071/py16135 gosbell ib. epidemiology, clinical features and management of infections due to community methicillin-resistant staphylococcus aureus (cmrsa). intern med j. 2005 dec;35(s2) suppl 2:s120–35. pmid:16271056 doi:10.1111/j.1444-0903.2005.00985.x david mz, daum rs. community-associated methicillin-resistant staphylococcus aureus: epidemiology and clinical consequences of an emerging epidemic. clin microbiol rev. 2010 jul;23(3):616–87. pmid:20610826 doi:10.1128/cmr.00081-09 hedrick j. acute bacterial skin infections in pediatric medicine: current issues in presentation and treatment. paediatr drugs. 2003;5 suppl 1:35–46. pmid:14632104 hunter and new england health pathways. management of individuals with skin and soft tissue infections. sydney: nsw health; 2016 (http://www.health.nsw.gov.au/infectious/factsheets/documents/mrsa_manag_flowchart_clinicians.pdf). agostino jw, ferguson jk, eastwood k, kirk md. the increasing importance of community-acquired methicillin-resistant staphylococcus aureus infections. med j aust. 2017 nov 06;207(9):388–93. pmid:29092696 doi:10.5694/mja17.00089 active bacterial core surveillance. atlanta: centres for disease control and prevention; 2016 (https://www.cdc.gov/abcs/reports-findings/survreports/mrsa11.html). local health districts and specialty networks. sydney: nsw health; 2016 (http://www.health.nsw.gov.au/lhd/pages/default.aspx). population by aboriginality. sydney: healthstats nsw; 2016 (http://www.healthstats.nsw.gov.au/indicator/dem_pop_atsi/dem_pop_atsi_lhn_snap, accessed 20 july 2016). australian statistical geography standard (asgc): volume 1 main structure and greater capital city statistical areas, july 2011. act: australian bureau of statistics; 2011 (http://www.abs.gov.au/ausstats/abs@.nsf/latestproducts/88f6a0edeb8879c0ca257801000c64d9). mermel la, machan jt, parenteau s. seasonality of mrsa infections. plos one. 2011 03 23;6(3):e17925. pmid:21468350 doi:10.1371/journal.pone.0017925 thomas dp, anderson ip. use of emergency departments by aboriginal and torres strait islander people. emerg med australas. 2006 feb;18(1):68–76. pmid:16454778 doi:10.1111/j.1742-6723.2006.00804.x simons h, alcabes p. a model for surveillance of methicillin-resistant staphylococcus aureus. public health rep. 2008 jan-feb;123(1):21–9. pmid:18348476 doi:10.1177/003335490812300104 muileboom j, hamilton m, parent k, makahnouk d, kirlew m, saginur r, et al. community-associated methicillin-resistant staphylococcus aureus in northwest ontario: a five-year report of incidence and antibiotic resistance. can j infect dis med microbiol. 2013 summer;24(2):e42–4. pmid:24421817 doi:10.1155/2013/169409 bailie rs, stevens m, mcdonald el. the impact of housing improvement and socio-environmental factors on common childhood illnesses: a cohort study in indigenous australian communities. j epidemiol community health. 2012 sep;66(9):821–31. pmid:21693472 doi:10.1136/jech.2011.134874 dengue-like illness surveillance: a two-year longitudinal survey in suburban and rural communities in the lao people’s democratic republic and in thailand original research nanthasane vannavong,a,b razak seidu,c thor axel stenström,d nsa dadaa and hans jørgen overgaarda a faculty of science and technology, norwegian university of life sciences, ås, norway. b champasak provincial health office, pakse, lao people’s democratic republic. c water and environmental engineering group, institute for marine operations and civil engineering, norwegian university of science and technology, ålesund, norway. d sarchl chair, institute for water and waste water technology, durban university of technology, durban, south africa. correspondence to nanthasane vannavong (email:anandafet@gmail.com). to cite this article: vannavong n, seidu r, stenström ta, dada n, overgaard hj. dengue-like illness surveillance: a two-year longitudinal survey in suburban and rural communities in the lao people’s democratic republic and in thailand. 2019 feb;10(1). doi:10.5365/wpsar.2017.8.4.001 abstract objective: this study aimed to determine the incidences of dengue-like illness (dli), dengue virus (denv) infection, and serotypes and to identify socio-demographical and entomological risk factors of dli in selected suburban and rural communities in the lao people’s democratic republic and in thailand. methods: a two-year longitudinal study was conducted in four villages during the inter-epidemic period between 2011 and 2013. entomological surveys, semi-structured interviews of household heads and observations were conducted. occurrences of dli were recorded weekly using the world health organization’s dengue definition along with blood samples; results were compared with national surveillance dengue data. risk factors of dli were assessed using logistic regression. results: among the 2007 people in the study, 83 dli cases were reported: 69 in suburban lao people’s democratic republic, 11 in rural thailand, three in rural lao people’s democratic republic and none in suburban thailand. four were confirmed denv: two from suburban lao people’s democratic republic (both denv-1) and two from rural thailand (both denv-2). although the number of detected dlis during the study period was low, dli incidence was higher in the study compared to the dengue surveillance data in both countries. dli in suburban lao people’s democratic republic was associated with age and occupation, but not with the number of pupae per person. discussion: this study highlights the importance of continuous clinical and vector surveillance for dengue to improve early detection of dengue and other mosquito-borne diseases in the region. introduction dengue is a mosquito-borne viral infection prevalent throughout the tropics and subtropics. in south-east asia, one of the largest outbreaks ever recorded occurred in 2010,1–3 during which 22 929 cases and 46 deaths were recorded in the lao people’s democratic republic,2 and 116 947 cases and 139 deaths in thailand.4 the incidence in the lao people’s democratic republic was 367 cases per 100 000 persons,1 and in thailand, 177 cases per 100 000 persons—higher than recorded in neighbouring viet nam (150 cases per 100 000 persons) or cambodia (93 cases per 100 000 persons).2 the most recent outbreak in thailand occurred in 2015 with 144 952 cases and 148 deaths;5 it was the most prevalent circulating strains of dengue virus (denv) were denv-4 (33.1%) and denv-3 (32.6%).6 in the lao people’s democratic republic, the most recent large outbreak occurred 2013, with 15 out of 17 provinces reporting dengue at epidemic levels, causing 95 deaths from a total of 44 171 cases;7 denv-3 and denv-2 were the most common serotypes.8 in the lao people’s democratic republic and in thailand, the number of cases peak during the rainy season, generally between may and october.1,4 dengue vector control in affected settings mainly relies on integrated vector management as recommended by the world health organization (who).9 a widely occurring challenge for effective mosquito control using the larvicide temephos is the widespread belief that it is harmful due to its smell.10 another challenge is insecticide resistance in aedes aegypti, the main dengue vector,11 which has been identified in thailand11 and the lao people’s democratic republic.12 a review of space spraying for the control of adult mosquitoes revealed that this intervention was unsustainable and did not lead to a reduction in dengue incidence.13 a dengue vaccine is approved for public use in thailand; however, those without a history of denv infection before vaccination have been found to have a risk of developing severe disease.14 patients with dengue-like illnesses (dli) have acute febrile illnesses (afi) with similar clinical manifestations to dengue3 but without laboratory confirmation of dengue infection. dli can be defined even in settings without laboratory facilities or rapid diagnosis test kits for confirming dengue infection.9,15 an etiological study done in the southern lao people’s democratic republic in 2003–2004 found that 30% (69/229) of patients presenting with non-malarial febrile illnesses during inter-epidemic periods of dengue had dengue infections confirmed by enzyme-linked immunosorbent assay (elisa).16 in thailand, dengue was the third leading cause of afi in rural areas.17 active surveillance of dengue and denv serotypes in non-outbreak settings is rarely conducted in the lao people’s democratic republic or in thailand. identifying denv infection is necessary to reduce the dengue burden by improving the early response and implementing control measures. the aims of this study were to assess the incidence and risk factors of dli and to identify dengue infections in relation to socio-demographic characteristics and mosquito pupal indices in selected study sites of both countries during an inter-epidemic period. methods study areas and design a two-year longitudinal study with active case detection was conducted in salavan province, southern lao people’s democratic republic and in khon kaen province, northeastern thailand. one suburban and one rural village were selected in each country (fig. 1). the two villages in the lao people’s democratic republic and the two villages in thailand are located six and nine kilometres apart, respectively. these villages were selected based on previously described criteria.18 the study was conducted in both dry and wet seasons within the time period of march 2011 to april 2013 with slight deviations of the start and end dates between the sites. fig. 1. number of participants and households included in the cross-sectional survey carried out during two years of follow-up from 2011 to 2012 in four villages in the lao people’s democratic republic and in thailand click to download figure 1. jpg, 379kb participants the total number of households in each village was 215 in suburban and 130 in rural lao people’s democratic republic, and 272 in suburban and 139 in rural thailand. rural lao people’s democratic republic had the lowest number of households (130), and we chose this number as the sample size across all selected villages. for each of the other three villages with more than 130 households, we systematically sampled households by first identifying a random house and then selecting additional houses based on a fixed interval derived by dividing the total number of households by 130. all individuals residing in the selected households were included. fig. 1 shows the total number of households and people included. during the course of the study, individuals were lost to follow-up because they went to study elsewhere, moved out after marriage or died; households were lost to follow-up due to families moving and settling in other villages or choosing to leave the study. migrants and newborn children were included as newly enrolled participants. the final number of individuals included in the analysis was 2007. identification of dengue-like illnesses each of the selected households was visited weekly by trained village health volunteers. dli was defined using the who dengue definition, i.e. presence of afi for 2–7 days with two or more nonspecific symptoms such as headache, retro-orbital pain, myalgia, arthralgia, rash, and haemorrhagic manifestations.19 we used an individual questionnaire to obtain case information (table 1) from patients or guardians of patients less than 15 years old. table 1. general information of individuals, households, mosquito infestation and disease information (dengue-like illness (dli) and dengue) in suburban and rural villages in the lao people’s democratic republic and in thailand (percentages in parentheses) click to download table 1. jpg, 1mb confirmation of dengue cases from each identified dli case, we took a blood sample by finger prick and blotting onto two pieces of filter paper (blood sampling paper, nobuto, chemoscience (thailand) co., ltd), according to the manufacturer’s instructions. after the blood was absorbed, the paper was dried at room temperature for 1–2 hours and thereafter sealed in sterile bags (whirl-pak bags, chemoscience (thailand) co., ltd). the samples were stored at -20 °c until transport. all samples were periodically brought to thailand where they were analysed by real-time polymerase chain reaction (pcr) for denv rna detection and serotyping using previously described techniques.20 we obtained secondary data reported during 2010–2013 from the national surveillance system in both countries to compare with data from our study. socio-demographic characteristics and entomological survey household information was obtained from household heads using a semi-structured household questionnaire. data collected are displayed in table 1. the entomological survey was conducted once per household in 2011 from the beginning of march to the beginning of june. in suburban and rural thailand, the survey was conducted in march–april 2011, while for the lao people’s democratic republic villages, the survey was done in may–june 2011. all household water storage containers were examined for ae. aegypti pupae, and the number of pupae present were counted and recorded. pupae were identified to species using a dissecting microscope and illustrated keys as described elsewhere.18 data analysis descriptive analysis of socio-demographic characteristics and entomological data was conducted for each study village. room occupancy rate was estimated using the united nation’s definition.21 the socioeconomic status (ses) of each household was estimated and ranked into rich, intermediate and poor using principal components analysis.22 variables used in the ses ranking have been described elsewhere.23 two entomological indices derived from the entomological survey, pupae per household and pupae per person (number of pupae divided by number of persons in each house) were used as potential risk factors for dli.24 national surveillance system data on dengue incidences in both countries were compared with the dli data obtained in this study. comparisons within and between countries were conducted using descriptive analysis. univariable and multivariable logistic regression models were used to find significant relationships between the presence of dli and various risk factors in each village. variables with a significance level of p ≤ 0.25 derived from the univariable analysis were included in the multivariable model. a backward stepwise selection procedure was used to obtain significant risk factors (p ethics all participants and guardians of children signed informed consent forms to participate in the study. the study was approved by the national ethics committee for health research, ministry of health, vientiane, lao people’s democratic republic (no. 03) and by the ethical committee of phramongkutklao college of medicine, bangkok, thailand (s033h/53). results socio-demographic characteristics information on the study villages is shown in table 1. the mean ages of people from suburban and rural lao people’s democratic republic were 26 and 28 years, while the thai villagers were older, mean 40 and 42 years, respectively. the main occupation reported was agriculture, especially in the rural villages of both countries, where 65% of individuals were farmers. the population densities in the lao people’s democratic republic villages based on the room occupancy were more than 2.5 persons per habitable room, which was higher than the thai sites. generally, thai villages had higher sess than those in the lao people’s democratic republic. entomological survey water containers were infested with ae. aegypti pupae in all study villages (table 1). aedes aegypti pupal indices were higher in thailand than in the lao people’s democratic republic; suburban thailand had the highest numbers of pupae per household (8.7) and pupae per person (2.5). similar figures were recorded in rural thailand. with 5.0 pupae per household and 0.9 pupae per person, rural lao people’s democratic republic had the lowest ae. aegypti pupal indices recorded in this study. dengue-like illnesses and confirmed dengue cases a total of 83 dli cases were reported during the study period with 69 (mean age: 25 years) in suburban lao people’s democratic republic, three in rural lao people’s democratic republic (mean age: 49 years) and 11 in rural thailand (mean age: 42 years). there were no cases recorded in suburban thailand (table 1). of the 83 cases, four were confirmed denv positive (4.8%): two from suburban lao people’s democratic republic (both denv-1) and two from rural thailand (both denv-2). each of these four denv-positive cases was reported as a dli case just one time during the study period, and all had sought care at local hospitals. the time from reported date of illness onset to specimen collection was 5 and 9 days, respectively, for the two cases in suburban lao people’s democratic republic and 2 and 7, respectively, days for the cases in thailand. in suburban lao people’s democratic republic, dli cases were recorded during the entire study period in both 2011 (34 cases) and 2012 (34 cases). the majority of the cases in rural thailand (10 cases) were recorded in 2011 (fig. 2a). most of the cases were found during the end of the rainy seasons (august to october in 2011 and october to november in 2012). the confirmed dengue cases were identified around these time periods. in rural thailand, the confirmed dengue cases were found in november and december 2011. fig. 2a. temporal distribution of dengue-like illness (dli) and confirmed dengue cases in suburban and rural villages in lakhonpeng district, lao people’s democratic republic (dli = 72) and manchakhiri district, thailand (dli = 11). click to download figure 2a. jpg, 337kb secondary dengue data collected from the thai national surveillance system provided by the manchakhiri district hospital surveillance unit showed only five and two confirmed dengue cases in 2011 from the suburban and rural village, respectively. of these seven cases, only one from the rural village was enrolled in our study and was also confirmed as positive for denv infection. the other six cases were not in the selected households. in the lao people’s democratic republic, no dengue surveillance data at the village level were available. district-level secondary dengue data obtained from both national surveillance systems showed at least a three-fold higher dengue incidence in the lakhonpheng district (lao people’s democratic republic) than in the manchakhiri district (thailand) (fig. 2b). in the lakhonpheng district, the incidence of dengue in 2010 was more than three times higher than in 2011 or 2012 and slightly higher than in 2013. in the manchakhiri district, dengue incidence was low (<240 cases/100 000 population) during 2010–2013. fig. 2b. dengue incidence in lakhonpheng district, lao people’s democratic republic and in manchakhiri district, thailand, 2010–2013. click to download figure 2b. jpg, 229kb risk factors and dengue-like illnesses the results from the univariable (table 2) and multivariable (table 3) analyses were similar, and no correlation was found with ae. aegypti pupal indices (table 3). the univariable analysis showed that risk factors associated with dli in suburban lao people’s democratic republic were age, education and occupation. only age and occupation remained significantly significant in the multivariable analysis. in the 15–20 years age group, the odds of having dli symptoms were almost five times higher than the odds of those under 5 years of age. the odds of dli in service and “other” (retired and children) occupations were about three times higher than the odds for farmers. in rural thailand, the multivariable analysis showed no significant associations between dli and any risk factor (table 3). table 2. univariable analyses of risk factors associated with dengue-like illnesses (dli) in suburban lao people’s democratic republic and in rural thailand (odds ratio (or) ([95% confidence intervals, ci] p-value). numbers in bold indicate significant associations (p click to download table 2. jpg, 663kb table 3. multivariable analyses of risk factors associated with dengue-like illnesses (dli) in suburban lao people’s democratic republic and rural thailand (odds ratio (or) ([95% confidence intervals, ci] p-value). numbers in bold indicate significant associations (p click to download table 3. jpg, 363kb several methods for dengue protection were used by dli cases (table 1): indoor aerosol insecticide spray, mosquito coils, repellents, etc.; however, they were rarely recorded. mosquito nets were thought to be protective, and they were used by 100% of cases in suburban and rural lao people’s democratic republic and by 73% of cases in rural thailand. discussion dengue and dengue-like illnesses eighty-three dli cases were recorded among 2007 inhabitants during the two-year study period (table 1). only one case, recorded in suburban lao people’s democratic republic, was from a participant newly enrolled during the study period. most of the cases were recorded during the rainy season, consistent with previous findings.1,4 the incidence of dli in the lao people’s democratic republic was two times higher than in thailand, which corresponds with the district-level dengue surveillance data reported from the same study periods in both countries (fig. 2b). we also found that dengue incidence in lakhonpheng district (lao people’s democratic republic) was three to four times higher than in manchakhiri district (thailand). no dli was reported in suburban thailand, although the national surveillance system reported five dengue cases from this village. the affected households were not included in our study. fewer dlis were recorded in rural lao people’s democratic republic (three in total). one factor that could contribute is that the study village has no health facility; therefore, people may not seek health care. only four of the 83 dli cases (4.8%) were confirmed as dengue in this study. non-confirmed dlis could have resulted from false negative dengue or from other diseases that present with similar clinical manifestations.9 a study of a cohort of 1500 healthy children aged 2–14 years in indonesia, malaysia, the philippines, thailand, and viet nam found that the most common causes of afi (≥38°c for ≥2 days) were chikungunya, scrub typhus, and dengue.25 co-circulating arboviruses, such as zika and chikungunya, pose challenges for disease diagnosis and early response to outbreaks26 since they are often indistinguishable clinically.27,28 in south-east asia, zika virus was first reported in malaysia in 1966, and subsequent cases were also reported in many countries including in thailand (2014).29 recently, a previous zika outbreak in the region was recorded in singapore (2016).28 in the lao people’s democratic republic and in thailand, the first chikungunya outbreaks were reported in 195830 and 2012,31 respectively. other infections that cause dlis in the study region include scrub typhus, influenza, japanese encephalitis and leptospirosis.16,32 the unexpectedly low number of confirmed dengue infections could be due to sample degradation from inadequate temperature control from intermittent power supplies or the use of only one laboratory method to detect infections. although real-time pcr testing has a reported sensitivity of 93%,20 some samples could have been false negatives. using both viral detection and serological tests, such as igm elisa, would improve diagnostic accuracy. this study revealed circulation of denv-1 in the lao people’s democratic republic and denv-2 in thailand, a finding corroborated by national surveillance data. denv-1 was detected in the lao people’s democratic republic during 2007–2011 and accounted for the highest proportion of dengue serotypes (38%) during the 2010 outbreak, followed by denv-2 (30%).1 in thailand, 54.6% of the denv serotypes isolated in 2010 were denv-2, followed by denv-1 (25.5%).4 risk factors of dengue-like illnesses significant risk factors for dli were found only in the suburban village of the lao people’s democratic republic, where dli was associated with age and occupation. individuals aged 15–20 years old were more likely to have dli than those 0–5 years old, which is in line with a previous study conducted in brazil.33 in the 2010 dengue outbreak in the lao people’s democratic republic, the most affected age group was 10–19 years,1 similar to the findings of this study. in thailand, the highest incidence rates of dengue reported between 2000 and 2011 were in 10–14 year olds.4 similar findings occurred during a 2009 chikungunya outbreak in thailand where the most affected age group was 10–14 years.34 employment in a service occupation was associated with dli (table 3), and 80% of these employees had an educational level higher than high school. a previous study found that attainment of secondary or higher educational degrees was significantly associated with dengue infection.35 this may relate to travel or work patterns away from home, thus increasing their chances of contracting dengue infections compared with those who travel less. human movement as a result of socieconomic development favours the spread of dengue and other vector-borne diseases.36,37 clustering of dli cases could be influenced by household risk within the same household; however, a household-level spatial analysis of dli cases was not conducted in this study. furthermore, dengue transmission is not limited to within households. schools, workplaces, markets, hospitals, parks, and other public places may play a role in dengue transmission. dengue control interventions that focus on households may be insufficient for community-wide disease control. although pupal indices are accepted as better indicators of dengue transmission than the traditional stegomyia indices (i.e. house, container, and breteau indices),38–40 a high density (>1.5 pupae per person) of ae. aegypti was not associated with dli in the household (table 2), even though the pupal densities found in three of the four study villages (table 1) were above proposed transmission thresholds of 0.5–1.5 pupae per person.24 similarly, a study conducted in the republic of palau found that dli infections were not associated with the pupal index; however, households reporting dlis were significantly more likely to harbour potential mosquito breeding sites than those without.15 a systematic review of the correlation between vector indices and dengue transmission also found no robust relationships to predict dengue outbreaks.40 more reliable mosquito indices are needed. adult mosquito collections may provide more useful information of disease risk, since infectious adult mosquitoes are more epidemiologically relevant than larvae or pupae.9 although our study focused only on dengue, other febrile illnesses, such as chikungunya and zika, are also endemic in these locations. our findings corroborate those from the national dengue surveillance programmes, highlighting the importance of continued clinical and vector surveillance and indicating the need to expand surveillance to include other mosquito-borne diseases associated with afi. this would have significant impact on accurate and timely detection and reporting afi-related outbreaks. acknowledgements we would like to thank the research council of norway and the norwegian university of life sciences, ås, norway for financial support. the water and environmental engineering group at the norwegian university of science and technology is also acknowledged for the office space and logistical support in writing this paper. thanks to all of the following organizations and individuals for the great support of this work: dr sibounhom archkhawongs from the ministry of health in the lao people’s democratic republic, professor theeraphap chareonviriyaphap from the department of entomology, kasetsart university, bangkok, thailand and dr ram rangsin from the phramongkutklao college of medicine, bangkok, thailand. finally, sincere thanks to local authorities, fieldworkers and volunteers in both countries for all their help and assistance. funding the project was funded by the research council of norway (project no. 191652) and through a phd grant to nanthasane vannavong from the faculty of science and technology, norwegian university of life sciences. conflicts of interest the authors declare that they have no competing interests. references khampapongpane b, lewis hc, ketmayoon p, phonekeo d, somoulay v, khamsing a, et al. national dengue surveillance in the lao people’s democratic republic, 2006-2012: epidemiological and laboratory findings. western pac surveill response j. 31 mar 2014;5(1):7–13. pmid:24734212 arima y, chiew m, matsui t; emerging disease surveillance and response team, division of health security and emergencies, world health organization regional office for the western pacific. epidemiological update on the dengue situation in the western pacific region, 2012. west pac surveill response. 20 apr 2015;6(2):82–9. doi:10.5365/wpsar.2014.5.4.002 pmid:26306221 dengue virus infections. atlanta, ga: centers for disease control and prevention; 2015 (https://wwwn.cdc.gov/nndss/conditions/dengue-virus-infections/case-definition/2015/, accessed 19 july 2017). limkittikul k, brett j, l’azou m. epidemiological trends of dengue disease in thailand (2000-2011): a systematic literature review. plos negl trop dis. 6 nov 2014;8(11):e3241. doi:10.1371/journal.pntd.0003241 pmid:25375766 dengue haemorrhagic fever. mueang nonthaburi: bureau of epidemiology, thailand; 2017 (http://www.boe.moph.go.th/boedb/surdata/disease.php?dcontent=old&ds=262766, accessed 3 june 2017). dengue diseases. annual epidemiology surveillance report 2015. mueang nonthaburi: bureau of epidemiology, thailand; 2015 (http://www.boe.moph.go.th/annual/aesr2015/sum_aesr.php, accessed 18 september 2017). dengue. vientiane: who lao people’s democratic republic; 2017 (http://www.wpro.who.int/laos/topics/dengue/en/, accessed 31 march 2017). phommanivong v, kanda s, shimono t, lamaningao p, darcy aw, mishima n, et al. co-circulation of the dengue with chikungunya virus during the 2013 outbreak in the southern part of lao pdr. trop med health. 4 aug 2016;44(1):24. doi:10.1186/s41182-016-0020-y pmid:27524929 dengue guidelines for diagnosis, treatment, prevention and control. geneva: world health organization; 2009 (http://www.who.int/tdr/publications/documents/dengue-diagnosis.pdf, accessed 8 july 2018). phuanukoonnon s, bough m, bryan jh. household practices of temephos use for dengue larval control, khon kaen province, north-east thailand. dengue bull. 2006;30:251–9. ponlawat a, scott jg, harrington lc. insecticide susceptibility of aedes aegypti and aedes albopictus across thailand. j med entomol. sep 2005;42(5):821–5. doi:10.1093/jmedent/42.5.821 pmid:16363166 sebastien m, ian s, paul b. vector mapping, characterization of insecticide resistance of aedes populations, and entomology capacity development in lao pdr, 2014 (http://www.pasteur.la/?s=vector+mapping%2c+characterization+of+insecticide+re, accessed 4 june 2017). esu e, lenhart a, smith l, horstick o. effectiveness of peridomestic space spraying with insecticide on dengue transmission; systematic review. trop med int health. may 2010;15(5):619–31. pmid:20214764 aguiar m, halstead sb, stollenwerk n. consider stopping dengvaxia administration without immunological screening. expert rev vaccines. apr 2017;16(4):301–2. doi:10.1080/14760584.2017.1276831 pmid:28010152 aumezaki m, sengebau-kinzio mj, nakamura k, ridep e, watanabe m, takano t. household risk factors associated with dengue-like illness, republic of palau, 2000-2001. biosci trends. aug 2007;1(1):33–7. pmid:20103864 amayxay m, sengvilaipaseuth o, chanthongthip a, dubot-pérès a, rolain jm, parola p, et al. causes of fever in rural southern laos. am j trop med hyg. sep 2015;93(3):517–20. doi:10.4269/ajtmh.14-0772 pmid:26149859 suttinont c, losuwanaluk k, niwatayakul k, hoontrakul s, intaranongpai w, silpasakorn s, et al. causes of acute, undifferentiated, febrile illness in rural thailand: results of a prospective observational study. ann trop med parasitol. jun 2006;100(4):363–70. doi:10.1179/136485906x112158 pmid:16762116 dada n, vannavong n, seidu r, lenhart a, stenström ta, chareonviriyaphap t, et al. relationship between aedes aegypti production and occurrence of escherichia coli in domestic water storage containers in rural and sub-urban villages in thailand and laos. acta trop. jun 2013;126(3):177–85. doi:10.1016/j.actatropica.2013.02.023 pmid:23499713 dengue haemorrhagic fever: diagnosis, treatment, prevention and control. 2nd edition. geneva: world health organization; 1997 (http://www.who.int/csr/resources/publications/dengue/denguepublication/en/, accessed 31 march 2017). prado i, rosario d, bernardo l, álvarez m, rodríguez r, vázquez s, et al. pcr detection of dengue virus using dried whole blood spotted on filter paper. j virol methods. apr 2005;125(1):75–81. doi:10.1016/j.jviromet.2005.01.001 pmid:15737419 demographic and social statistics. new york, ny: statistics division, united nations; 2016 (hhttp://unstats.un.org/unsd/demographic/sconcerns/housing/housingmethods.htm#ea, accessed 6 january 2017). vyas s, kumaranayake l. constructing socio-economic status indices: how to use principal components analysis. health policy plan. nov 2006;21(6):459–68. doi:10.1093/heapol/czl029 pmid:17030551 vannavong n, seidu r, stenström ta, dada n, overgaard hj. effects of socio-demographic characteristics and household water management on aedes aegypti production in suburban and rural villages in laos and thailand. parasit vectors. 4 apr 2017;10(1):170. doi:10.1186/s13071-017-2107-7 pmid:28376893 focks da, brenner rj, hayes j, daniels e. transmission thresholds for dengue in terms of aedes aegypti pupae per person with discussion of their utility in source reduction efforts. am j trop med hyg. jan 2000;62(1):11–8. doi:10.4269/ajtmh.2000.62.11 pmid:10761719 capeding mr, chua mn, hadinegoro sr, hussain ii, nallusamy r, pitisuttithum p, et al. dengue and other common causes of acute febrile illness in asia: an active surveillance study in children. plos negl trop dis. 25 jul 2013;7(7):e2331. doi:110.1371/journal.pntd.0002331 pmid:23936565 velasco jm, valderama mt, lopez mn, chua d jr, latog r 2nd, roque v jr, et al. chikungunya virus infections among patients with dengue-like illness at a tertiary care hospital in the philippines, 2012-2013. am j trop med hyg. dec 2015;93(6):1318–24. doi:10.4269/ajtmh.15-0332 pmid:26416109 pessôa r, patriota jv, lourdes de souza m, felix ac, mamede n, sanabani ss. investigation into an outbreak of dengue-like illness in pernambuco, brazil, revealed a cocirculation of zika, chikungunya, and dengue virus type 1. medicine (baltimore). mar 2016;95(12):e3201. doi:10.1097/md.0000000000003201 pmid:27015222 ho zjm, hapuarachchi hc, barkham t, chow a, ng lc, lee jmv, et al. outbreak of zika virus infection in singapore: an epidemiological, entomological, virological, and clinical analysis. lancet infect dis. aug 2017;17(8):813-821. doi:10.1016/s1473-3099(17)30249-9 wiwanitkit v. the current status of zika virus in southeast asia. epidemiol health. jun 2016;38:e2016026. doi:10.4178/epih.e2016026 pmid:27336445 soulaphy c, souliphone p, phanthavong k, phonekeo d, phimmasine s, khamphaphongphane b, et al. emergence of chikungunya in moonlapamok and khong districts, champassak province, the lao people’s democratic republic, may to september 2012. west pac surveill response. 18 mar 2013;4(1):46–50. doi:10.5365/wpsar.2012.3.4.017 pmid:23908956 hammon wm, rudnick a, sather ge. viruses associated with epidemic hemorrhagic fevers of the philippines and thailand. science. 15 apr 1960;131(3407):1102–3. doi:10.1126/science.131.3407.1102 pmid:14399343 mayxay m, castonguay-vanier j, chansamouth v, dubot-pérès a, paris dh, phetsouvanh r, et al. causes of non-malarial fever in laos: a prospective study. lancet glob health. jul 2013;1(1):e46–54. doi:10.1016/s2214-109x(13)70008-1 pmid:24748368 braga c, luna cf, martelli cm, de souza wv, cordeiro mt, alexander n, et al. seroprevalence and risk factors for dengue infection in socio-economically distinct areas of recife, brazil. acta trop. mar 2010;113(3):234–40. doi:10.1016/j.actatropica.2009.10.021 pmid:19896921 chikungunya fever. annual epidemiological surveillance report 2009. mueang nonthaburi: bureau of epidemiology, thailand; 2009 (http://www.boe.moph.go.th/annual/annual%202552/aesr52_part1/annual_menupart1_52_cd.html, accessed 18 september 2017). koyadun s, butraporn p, kittayapong p. ecologic and sociodemographic risk determinants for dengue transmission in urban areas in thailand. interdiscip perspect infect dis. 2012;2012:907494. doi:10.1155/2012/907494 pmid:23056042 maidana na, yang hm. describing the geographic spread of dengue disease by traveling waves. math biosci. sep 2008;215(1):64–77. doi:10.1016/j.mbs.2008.05.008 pmid:18590749 stoddard st, morrison ac, vazquez-prokopec gm, paz soldan v, kochel tj, kitron u, et al. the role of human movement in the transmission of vector-borne pathogens. plos negl trop dis. 21 jul 2009;3(7):e481. doi:10.1371/journal.pntd.0000481 pmid:19621090 focks da, chadee dd. pupal survey: an epidemiologically significant surveillance method for aedes aegypti: an example using data from trinidad. am j trop med hyg. feb 1997;56(2):159–67. doi:10.4269/ajtmh.1997.56.159 pmid:9080874 strengthening implementation of the global strategy for dengue fever/dengue haemorrhagic fever prevention and control. report of the informal consultation 18–20 october 1999, geneva who/cds/(den)/ic/ 2000.1. geneva: world health organization; 2000 (http://www.who.int/csr/resources/publications/dengue/whocdsdenic20001.pdf, accessed 31 march 2017). bowman lr, runge-ranzinger s, mccall pj. assessing the relationship between vector indices and dengue transmission: a systematic review of the evidence. plos negl trop dis. 8 may 2014;8(5):e2848. doi:10.1371/journal.pntd.0002848 pmid:24810901 staphylococcal poisoning during a village festival, medina, misamis oriental, philippines in 2014 outbreak investigation report john bobbie roca,a ruth alma ramos,a herdie hizon,a vikki carr de los reyes,a ma. nemia l. sucalditoa and enrique tayaga a department of health, manila, philippines. correspondence to bobbie roca (email: bobbie.roca@gmail.com). to cite this article: roca jb, ramos ra, hizon h, de los reyes vc, sucaldito mn, tayag e. staphylococcal poisoning during a village festival, medina, misamis oriental, philippines in 2014. western pac surveill response j. 2019 may;10(2). doi:10.5365/wpsar.2017.8.2.005 abstract introduction: on 18 august 2014, cases of food poisoning in san vicente village were reported to the event-based surveillance & response unit of the philippine department of health. an investigation was conducted to identify the implicated source, describe the outbreak and evaluate the risk factors. methods: a case-control study was conducted. a suspected case was a previously well individual of medina who attended the village festival and developed abdominal pain and vomiting with or without nausea, diarrhoea and fever from 18 to 19 august. a confirmed case was a suspected case with a rectal swab positive for bacterial culture. rectal swabs, water and food samples were sent to the national reference laboratories. food source and consumption interviews and environmental inspections were conducted. results: sixty-four cases and 123 unmatched controls were identified. the median incubation period was 1 hour 15 minutes. five cases (8%) were positive for staphylococcus aureus, one (2%) for aeromonas hydrophilia and one (2%) for shigella boydii. one (14%) water sample was positive for aeromonas spp. of the collected food samples, beef steak was positive for staphylococcus aureus. risk factors were consumption of filipino-style beef stew (odds ratio [or]: 6.62; 95% confidence interval [ci]: 2.90–15.12) and stir-fried noodles (or: 3.15; 95% ci: 1.52–6.50). prolonged serving time and improper food storage were noted. discussion: in this foodborne outbreak, staphylococcus aureus was the likely causative agent. meals were contaminated due to improper food handling practices. we recommend that a policy be created to mandate that village-appointed food handlers undergo food safety training. introduction staphylococcus aureus is a gram-positive bacterium that is predominantly associated with food poisoning1 and causes one of the most common foodborne illnesses worldwide.2 about 25% of healthy people are carriers of staphylococcus aureus. the bacterium is associated with skin, eye, nose or throat infections.3 the most common way for food to be contaminated by the bacteria is through contact with infected food handlers. other food contamination sources are the equipment or surfaces on which food is prepared3 and infected house flies.4 when food is contaminated, bacteria quickly multiply at room temperature and produce a fast acting enterotoxin5 that can cause nausea, abdominal pain, vomiting and diarrhoea.1 on 18 august 2014, the event-based surveillance & response unit of the philippine department of health received a report of food poisoning among villagers of san vicente village, a rural village in medina, misamis oriental on the island of mindanao. the village is subdivided into seven areas and has a total population of 978.6 every 18 august, the village celebrates its founding with a festival with free meals for all community members. a team from the philippines field epidemiology training program was deployed to conduct an epidemiologic investigation to identify the implicated source, describe the outbreak and evaluate the risk factors. methods epidemiologic investigation a descriptive study was conducted by reviewing medical records of outpatients and inpatients at the local hospitals. a suspected case was defined as a previously well individual of medina, misamis occidental who attended the village festival and developed abdominal pain and vomiting with or without nausea, diarrhoea and fever from 18 to 19 august 2014. a confirmed case was a suspected case with a positive rectal swab in bacterial culture. an unmatched case-control study was conducted. controls were individuals of medina who attended the village festival and did not develop any symptoms and were negative on bacterial stool cultures. subjective sampling from suspected and confirmed patient lists was used to identify cases for the study. controls were identified from the same household and/or nearby households of the cases. cases and controls were interviewed using a standard questionnaire that included demographics, symptoms (except for controls), history of food consumption within the past 24 hours, source of drinking-water, hygiene practices and other environmental factors. statistical analysis, including calculation of odds ratios (or) and 95% confidence intervals (ci), was done using epiinfo version 3.5.4 software. significant bivariate analysis results were then tested by multivariable analysis. laboratory examinations rectal swabs were collected for culture and sensitivity testing from cases and controls including food handlers. water samples from the water reservoir and communal faucets were collected for bacteriologic analysis. both were sent to the national reference laboratories. food samples were sent to the food and drug administration satellite laboratory for mindanao for bacteriologic analysis. environmental investigation we visited the food handling and preparation area and water sources. we interviewed food handlers on the food production chain, food consumption history and presence of signs and symptoms. ethical approval ethics clearance was not required according to local regulations as this investigation was part of an emergency response to an outbreak. however, a signed consent was obtained before interviews and specimen collection. results case-control study all 64 cases (57 suspected and seven confirmed) and 123 controls were included in the study. all cases and 121 controls ate food served at the festival. six out nine food handlers were included in the case-control study. one food handler did not meet the definition of case or control, and two others could not be located for the study. all of the interviewed food handlers fit the control definition. all of the individuals approached agreed to be involved in the study. the first case manifested signs and symptoms in less than 15 minutes after ingestion of food. the number of subsequent cases peaked by 14:00. the median incubation period was 1 hour 15 minutes (range: 10 minutes to 16.98 hours). no deaths were reported (fig. 1). all cases had abdominal pain and vomiting. other symptoms reported were nausea (88%), diarrhoea (52%) and fever (16%). there were 40 (63%) female cases; ages ranged from 1 to 75 years (median: 22 years, interquartile range: 7 to 38 years). the most affected age group was 21–35 years (25%). fig. 1. distribution of foodborne illness cases by onset of illness (n = 64), san vicente village, medina, misamis oriental, philippines, 18–19 august 2014 click to download figure 1. jpg, 432kb bivariate analysis revealed that consumption of filipino-style beef stew (or: 8.16, 95% ci: 3.77–17.66) and stir-fried noodles (or: 2.38; 95% ci: 1.28–4.40) were risk factors for food poisoning (table 1). after adjusting for demographics and exposure variables, consumption of filipino-style beef stew (or: 6.62; 95% ci: 2.90–15.12) and stir-fried noodles (or: 3.15; 95% ci: 1.52–6.50) remained statistically significant risk factors for food poisoning. on the contrary, consumption of pork humba (or: 0.42; 95% ci: 0.20–0.89) and filipino-style pork stew (or: 0.22; 95% ci: 0.06–0.83) were inversely associated with being a case. table 1. factors associated with staphylococcal foodborne illness cases, san vicente village, medina, misamis oriental, philippines, 18-19 august 2014 click to download table 1. jpg, 462kb laboratory examinations a rectal swab was collected from each of the 64 cases and 123 controls. of the samples from cases, five (8%) were positive for staphylococcus aureus, one for (2%) for aeromonas hydrophilia and one (2%) for shigella boydii. however, 45 (70%) of the cases were given antibiotics before specimen collection. all controls showed no growth in the bacterial culture test. one out of the seven (14%) rectal swab cultures from food handlers was positive for aeromonas sobria. one out of the eight (13%) water samples collected was found to be positive for aeromonas species. beef steak and rice were the only leftover food samples collected. bacterial culture revealed that the beef steak was positive for staphylococcus aureus; the culture from the rice yielded no bacterial growth. environmental investigation seven out of the nine village-appointed food handlers were interviewed. all were asymptomatic. food source investigation revealed that a cow and a pig were bought from a local farm, while the vegetables and commercially prepared seasonings came from a nearby market. animals were slaughtered in an open space at the town hall by 08:00 on 17 august 2014 (the day before consumption). meat and entrails were butchered to desired cuts. cooking of dishes started by 14:00 with beef dishes prepared first followed by the pork dishes. the cooking process ended by 22:30. water from communal faucets was used to wash raw ingredients and for cooking. cooked dishes were cooled in a separate room and covered with banana leaves. meals were packed between 22:45 on 17 august 2014 and 06:00 the following day. two varieties of dishes were packed in a “chorizo-like” manner where one plastic bag was used (fig. 2). packed meals were stored in either a plastic tray, carton box or empty rice sack at room temperature. fig. 2. packed meal click to download figure 2. jpg, 443kb by 11:30, packed meals were distributed among villagers. no food handlers wore aprons or hair nets during food preparation. they did not have formal food safety training, and proper hand hygiene was not observed. flies were also claimed to be present during food preparation. no chlorine residue was noted inside the water reservoir, and breakage in water distribution pipelines was seen. discussion the epidemiological evidence suggests that the most likely source of this foodborne outbreak was the consumption of contaminated packed meals served during the village festival. the short incubation period (median 1 hour 15 minutes) and the symptoms manifested by cases suggest a staphylococcus aureus enterotoxin poisoning. staphylococcus aureus was seen in the human specimens and food samples (beef steak); both consumption of filipino-style beef stew and stir-fried noodles were statistically most likely to be associated with the illness. the issue of food safety practices by the food handlers played a part in this outbreak. the observed improper food handling practices such as poor hand washing technique, prolonged serving time2,7 and improper temperature for food storage1,2,5,7 have been linked to staphylococcal foodborne outbreaks. the isolation of aeromonas hydrophilia and shigella boydii in one of the cases could have been incidental to this outbreak. the typical incubation period of 12 to 72 hours1 after ingestion of food contaminated by both bacteria does not coincide with the incubation period of the cases. the sanitation code of the philippines requires all food caterers, regardless of type and enterprise size, to secure sanitary permits and health certificates for all their employees before operation.8,9 this policy only covers licensed food establishments. however, most foodborne outbreaks in the philippines occur in home settings and at events where the food handlers are not trained on food safety.10 this study has some limitations. first, we were not able to locate and test all the food handlers. second, a majority of the cases were already treated with antibiotics before stool collection. this may have contributed to low positivity rates in clinical specimens. third, dose–response was not investigated. fourth, there is the possibility of recall bias on the specific food exposure due to the retrospective nature of data finding. in spite of these limitations, we were able to identify the source of this outbreak from both the clinical and epidemiological results. as a response to the outbreak, we recommended the reinforcement of the sanitation code of the philippines by municipal governments through the release of an ordinance mandating that village-appointed food handlers secure updated health certificates and attend formal food safety training before engaging in mass feeding activities to prevent further outbreaks. acknowledgements we are grateful for the cooperation and support of the center for health and development – northern mindanao, the local government of medina and village leaders and residents of san vicente village during the field investigation. we also thank the laboratory staff of the research instituted for tropical medicine and food and drug administration satellite laboratory for mindanao for testing the samples. funding this foodborne outbreak investigation was funded by the department of health, philippines. conflicts of interest none declared. references bad bug book (second edition). silver spring, md: united states food and drug administration; 2017 (https://www.fda.gov/food/foodborneillnesscontaminants/causesofillnessbadbugbook/). kadariya j, smith tc, thapaliya d. staphylococcus aureus and staphylococcal food-borne disease: an ongoing challenge in public health. biomed res int. 2014;2014:827965. doi:10.1155/2014/827965 pmid:24804250 food poisoning: staphylococcus. in: foodsafety.gov [website]. washington, dc: united states department of health & human resources; 2014 (https://www.foodsafety.gov/poisoning/causes/bacteriaviruses/staphylococcus/, accessed 14 october 2014). robertson j. the epidemiology of staphylococcus aureus on dairy farms. wisconsin: national mastitis council proceedings library (http://www.nmconline.org/articles/staphepid.htm, accessed 14 october 2014). javier r, sy l, de los reyes v, sucaldito m, tayag e. staphylococcal food-borne illness among participants of sui generis leadership summit in ateneo de davao university on july 29, 2012. scientific paper. 2013;23(3):2013. national epidemiology center. 2010 census of population and housing. quezon city: national statistics office; 2012 (http://www.census.gov.ph/sites/default/files/attachments/hsd/pressrelease/northern%20mindanao.pdf, accessed 19 august 2014). michino h, otsuki k. risk factors in causing outbreaks of food-borne illness originating in schoollunch facilities in japan. j vet med sci. 2000 may;62(5):557–60. doi:10.1292/jvms.62.557 pmid:10852411 implementing rules and regulations of chapter iii: food establishments of the code on sanitation of the philippines (p.d. 856). manila: department of health; 1995 (https://www.doh.gov.ph/sites/default/files/publications/chapter_3_food_establishments.pdf). sanitation code of the philippines (2013). republic act no. 10611, august 23, 2013, official gazette of the philippines (https://www.gov.ph/2013/08/23/republic-act-no-10611/, accessed 22 february 2017). rebato n, ballera j, hizon h, de los reyes v, sucaldito m, magpantay r. no.4. a 10-year meta analysis of foodborne disease outbreaks, 2005–2015. scientific paper. volume 26. epidemiology bureau; 2016. comparison of influenza surveillance data from the republic of korea, selected northern hemisphere countries and hong kong sar (china) from 2012 to 2017 surveillance report bryan inho kim,a ok park,a sangwon lee,b a division of risk assessment and international cooperation, korea centers for disease control and prevention, cheongju-si, republic of korea. b division of strategic planning for emerging infectious diseases, korea centers for disease control and prevention, cheongju-si, republic of korea. correspondence to bryan inho kim (email: globalepikim@gmail.com). to cite this article: kim bi, park o, lee s. comparison of influenza surveillance data from the republic of korea, selected northern hemisphere countries and hong kong sar (china) from 2012 to 2017. western pac surveill response j. 2020 sep;11(3). doi:10.5365/wpsar.2019.10.2.015 influenza surveillance is conducted in many countries; it is one of the most important types of infectious disease surveillance due to the significant impact and burden of the influenza virus. the republic of korea has a temperate climate, and influenza activity usually peaks in the winter as in other temperate-climate countries in the northern hemisphere. this descriptive study compared the influenza surveillance data from the korea centers for disease control and prevention with that from other countries and areas in the northern hemisphere, namely china, including hong kong sar, japan and the united states of america, to identify seasonal influenza patterns from 2012 to 2017. data on influenza-like illnesses (ilis) and laboratory surveillance were collected from various sources; visual comparisons were conducted on the onset, duration and the peak timing of each influenza season based on subtypes. correlation coefficients were estimated, and time differences for the beginning of influenza seasons between the republic of korea and other countries were measured. ilis in north china and cases reported from japan’s sentinel surveillance showed high correlations with the republic of korea. the number of confirmed influenza cases in japan showed a high correlation with the laboratory-confirmed influenza cases in the republic of korea. we found that there are similarities in the influenza patterns of the republic of korea, japan and north china. monitoring these neighbouring countries’ data may be useful for understanding influenza patterns in the republic of korea. continuous monitoring and comparison of influenza surveillance data with neighbouring countries is recommended to enhance preparedness against influenza. the influenza virus is a respiratory pathogen that is transmitted through respiratory droplets.1 during seasonal influenza epidemics, high attack rates cause a significant public health burden.2 the infection is usually self-limited in young adults but can lead to severe infections in people in high-risk groups, including elderly people (>65 years old), pregnant women, children aged 6–59 months and adults with chronic illnesses.3 the republic of korea is located in a temperate region where a seasonal pattern of influenza is normally observed.4 the annual peak is usually in january. since the establishment of the republic of korea’s influenza surveillance system in 2000,5 the early prediction of seasonal influenza epidemics has been a major priority. the surveillance systems in china, including hong kong sar, japan and the united states of america (usa) differ, but their overall structure and scope are similar. the influenza surveillance systems for all four operate year-round to detect influenza; however, their data have not been systematically compared and similarities and differences in patterns have not been identified. for this reason, this study compared the korea centers for disease control and prevention (kcdc) influenza surveillance data with influenza surveillance data in other northern hemisphere countries. materials and methods study design a descriptive study compared the republic of korea’s influenza surveillance data with that from china, including hong kong sar, japan and usa from week 36 of 2012 to week 12 of 2017 (238 weeks total) to understand the relative onset, duration and peaks of seasonal influenza. china, including hong kong sar, and japan were selected because of their geographical proximity to the republic of korea. the usa was selected because it is located in the northern hemisphere, and it has a comprehensive influenza surveillance system. the selected countries and areas operate influenza surveillance year-round and have both an influenza surveillance system that monitors clinical symptoms such as influenza-like illness (ili) and a laboratory-based influenza surveillance system. the kcdc’s definition of ili is temperature ≥38 °c with cough or sore throat. there were some differences in ili case definitions. china defines ili as temperature ≥38 °c, either cough or sore throat and no laboratory confirmation of alternative diagnosis;6 hong kong sar (china) defines ili as temperature ≥38 °c plus two of the following: sore throat, cough, rhinorrhoea, myalgia, arthralgia;7 and the usa defines ili as temperature ≥37.8 °c and cough and/or sore throat and without a known non-influenza cause. japan’s ili case definition is sudden onset of illness, temperature >38 °c, upper respiratory inflammation systemic symptoms such as general fatigue or one of these clinical criteria and a positive rapid laboratory diagnostic test for influenza.9 the ili case definitions of each participating country were used in this study to determine seasonal influenza epidemics.8 there were inherent differences in all of the influenza surveillance systems. for laboratory surveillance systems, per cent positive was used in all countries except japan where the number of confirmed cases was used instead. in-depth statistical analysis was limited due to differences in surveillance system settings. the surveillance system in the republic of korea is composed of 200 sentinel sites that report ili cases and rates. all influenza data are reported on a weekly basis. the ili rate in the republic of korea is defined as the number of ili cases divided by the number of 1000 outpatients per week. thirty-six sentinel sites also participate in the laboratory surveillance, sending respiratory specimens for confirmation and subtyping of influenza virus. in china, ili consultation rates reflect the percentage of hospital visits attributed to ili. in hong kong sar (china), ili rates are reported as cases per 1000 consultations in general outpatient clinics. in the usa, the rate of ili is the national percentage of ili patient visits to health-care providers. in japan, the number of cases per sentinel site is reported. data collection data were retrospectively collected through national weekly surveillance reports of each country or region, official websites and the world health organization’s flunet.10–15 china produces two separate sets of surveillance data: one each for north and south china (not including hong kong sar [china]),12 and data from both sets were collected for the analysis. data analysis descriptive statistics including means, standard deviations, minimum and maximum values of ili and per cent positive of influenza virus were calculated. weekly surveillance data were plotted using the same epi-weeks to enable visual comparisons (fig. 1 and 2). onset, peak and the duration of each seasonal influenza epidemic were graphically presented by country for further comparisons (fig. 3). fig. 1. ili surveillance data, 2012–2017 click to download figure 1. jpg, 92kb fig. 2. influenza laboratory surveillance data by virus subtype, 2012–2017 click to download figure 2. jpg, 160kb the week of onset was defined as the first week that exceeded the pre-defined level for countries using their own thresholds. the peak of the influenza season refers to the week that shows the highest ilis (or cases per sentinel surveillance site for japan) during epidemic periods of each influenza season. as china and hong kong sar (china) do not use an influenza epidemic threshold, the period in which influenza positivity rate was greater than 10% was used to define the epidemic period; this is normally used as the reference value of seasonal influenza in the republic of korea, the usa and other countries.16,17 pearson correlation coefficients were calculated to compare the republic of korea’s surveillance data with the surveillance data of other countries and areas. we used weekly time lags (i.e. 1 week prior, 2 weeks prior, 3 weeks prior, 4 weeks prior) and considered typical influenza transmission patterns to find the best data sources. p values less than 0.05 were considered statistically significant. results ili surveillance data the mean weekly ili rates varied by country during the study period. the mean rate for the republic of korea was 13.8 per 1000 outpatients (standard deviation [sd] 14.2); the mean rate for north china was 2.9% of ili cases (sd 0.6%); the mean rate for south china was 3.0% of ili cases (sd 0.5%); the mean rate for the usa was 1.9% (sd 1.2%); the mean rate for hong kong sar (china) was 4.8 per 1000 consultations (sd 2.0); and the mean number of cases reported per sentinel site in japan was 6.0 (sd 10.4). north and south china ili rates had small variations (north: 2.3–5.6, south: 2.2–4.5) by year compared to the republic of korea and japan. the maximum per cent positive of influenza virus in the republic of korea was 71.7%; it was significantly higher than that of the other countries, which was around 40%. among three influenza virus subtypes, the annual per cent positive of h3n2 was generally higher than the other two subtypes, except in the usa. in the usa, h3n2 and h1n1pdm09 showed similar proportions of positivity during the peak week (22.5% and 19.6%, respectively). no influenza viruses were detected during the intra-epidemic period (period between one influenza season and the next influenza season) in the republic of korea, north china or japan (table 1). in contrast, influenza was detected throughout the intra-epidemic perior in the usa. table 1. descriptive statistics of the influenza surveillance data of the republic of korea, japan, north and south china, hong kong sar (china) and usa, 2012–2017 click to download table 1. jpg, 158kb the ili rates of countries and cases per sentinel surveillance site (japan) data showed seasonality with winter season peaks during the study period (fig. 1). the ili rate in the republic of korea and cases per sentinel site in japan showed sharp increases and clear peaks of seasonal influenza during the winter. in contrast, the usa’s ili data showed gradual increases as well as decreases during influenza seasons every year. the usa’s ili data showed earlier onset of epidemics four of the five previous influenza seasons. the hong kong sar (china) and south china surveillance data demonstrated a pattern of summer epidemics. laboratory surveillance data circulating subtypes varied among countries by each influenza season, and no clear patterns were identified. the per cent positive or the total number of confirmed cases (japan) of h1n1pdm09 showed similar patterns among countries for onset and duration. the republic of korea was the only country that reported h1n1pdm09 during the 2014–15 season, but it was reported every year during the study period in the republic of korea. h1n1pdm09 showed a biennial pattern, being observed every other year in japan and the usa. h3n2 showed more variations and irregularities compared with other subtypes, and the timing varied among countries and areas. hong kong sar (china) and south china showed h3n2 epidemics in the summer seasons, but the timing varied in each influenza season. influenza b virus showed lower per cent positive (or confirmed cases in japan) and the onset was relatively delayed compared to other subtypes in all countries and areas (fig. 2). overall seasonal influenza pattern there were yearly seasonal influenza epidemics for all countries and areas during the study period. the republic of korea, north china, japan and the usa showed relatively similar influenza epidemic periods; there were interseason epidemics during the summer period in south china and hong kong sar (china) (fig. 1 and 3). fig. 3. comparisons of influenza seasons by country during the study period, 2012–2017 click to download figure 3. jpg, 135kb pearson correlation (r) analysis demonstrated that most of the data from other countries were significantly correlated with the republic of korea’s data (tables 2 and 3). there was a relatively higher correlation of ili in north china (r = 0.54, p < 0.0001) and japan’s sentinel surveillance cases (r = 0.60, p p table 2. pearson correlation coefficient between the republic of korea ili data and time lag surveillance data of other countries/areas, 2012–2017 click to download table 2. jpg, 74kb table 3. pearson correlation coefficient between the republic of korea influenza laboratory surveillance data and influenza laboratory surveillance data of other countries/areas, 2012–2017 click to download table 3. jpg, 71kb the onset of influenza epidemics in japan usually preceded that in the republic of korea by an average of 2.8 weeks, except in the 2015–16 influenza season. the onset of the influenza epidemic season started between one week (2013/2014) and seven weeks (2014/2015) earlier in japan compared to the republic of korea. the duration of the influenza season was longer in japan (average 21.5 weeks) than in the republic of korea (average 15.3 weeks). north china also preceded the republic of korea for the onset of the influenza epidemic season by one to eight weeks except for the 2016/2017 season. the periods between the onset and the peak were significantly shorter in the republic of korea compared to japan; in the 2016/2017 season it took only four weeks to reach the peak. the 2016/2017 season, was unique as the republic of korea and japan experienced earlier onsets of seasonal influenza than in other years. summer epidemics in hong kong sar (china) and south china occurred in 2013/2014 and 2014/2015. however, this pattern was not observed in the 2012/2013 or 2015/2016 seasons. the summer epidemic was delayed and eventually started in the beginning of 2016/2017 season in hong kong sar (china). an early epidemic in south china was observed and it may have influenced the earlier beginning of seasonal influenza in the 2016/2017 season in the republic of korea and japan. the usa usually reported earlier onsets compared to other countries, but the pattern reversed after the 2015/2016 season (fig. 3). discussion the study results indicated that japan and north china had similar trends and tended to have earlier influenza onsets than the republic of korea. these countries and areas are located in east asia, and geographical proximity might have resulted in similar patterns of seasonal influenza in both countries.18 also, similarities in climate conditions of the countries might explain the similar influenza surveillance results. we also found that the influenza data in the republic of korea and japan varied more than it did in other countries. in north china, clear peaks in the winter season were also observed, but there were smaller ranges of ili rates (differences between maximum and minimum) compared to the republic of korea and japan. influenza was reported throughout the year in south china and hong kong sar (china) based on laboratory surveillance data, presumably due to their geographic locations in lower latitudes and closer to the equator.19 among subtypes, influenza b and h1n1pdm09 showed better correlation than the h3n2 subtype. this may be related to the irregularities of the h3n2 subtype and relatively large variations. even though this study covered fewer than five influenza seasons, our findings suggest that there potentially may be similarities in epidemic patterns in japan, north china and the republic of korea. it is noteworthy that the onset of seasonal influenza epidemics in japan tends to precede the onset in the republic of korea. the influenza virus shows clear seasonal trends in countries with temperate climates, and the correlation analysis showed statistically significant results. nevertheless, the high correlation of ili and confirmed cases in japan and the republic of korea and in north china and the republic of korea suggests that there are similarities in the influenza patterns of these countries and areas. there are some limitations to this study. as japan uses a unique case definition for influenza surveillance, direct comparison with other countries and areas is somewhat limited. although the case definitions for influenza surveillance were generally similar for the other countries, each system operates within different settings, potentially contributing to differential sensitivity and specificity for detecting influenza cases.20 surveillance systems in each country may also have been updated during the study period. the direct comparison of these diverse data may not fully capture or sufficiently explain the differences in patterns among countries. laboratory surveillance data are also more likely to be affected by variations in surveillance system settings as they are strongly associated with the number of specimens tested. also, annual influenza vaccination coverages of each country were not taken into consideration in the analysis due to the lack of access to the vaccination data. despite the inherent discrepancies and potential lack of representativeness due to sentinel surveillance systems, these were the best national influenza data available. given the results of this observational study, additional studies to evaluate and validate the potential relationships among countries or regions are needed. further study for longer period of influenza seasons with additional countries is needed to achieve more generalized outcomes. conclusions we found that there are similarities in the influenza pattern of the republic of korea, japan and north china. monitoring influenza patterns in japan and north china may be useful for understanding influenza patterns in the republic of korea. monitoring and comparing influenza surveillance data with neighbouring countries needs to be continued both for better understanding of influenza patterns and for possible earlier detection of onsets of seasonal influenza. acknowledgements we appreciate all the countries that shared influenza surveillance data through their website. the results of this study do not necessarily represent the official position of the korea centers for disease control and prevention. references killingley b, nguyen-van-tam j. routes of influenza transmission. influenza other respirs viruses. 2013 sep;7 suppl 2:42–51. doi:10.1111/irv.12080 pmid:24034483 suh m, kang dr, lee dh, choi yj, tchoe b, nam cm, et al. socioeconomic burden of influenza in the republic of korea, 2007-2010. plos one. 2013 dec 27;8(12):e84121. doi:10.1371/journal.pone.0084121 pmid:24386339 ortiz jr, perut m, dumolard l, wijesinghe pr, jorgensen p, ropero am, et al. a global review of national influenza immunization policies: analysis of the 2014 who/unicef joint reporting form on immunization. vaccine. 2016 oct 26;34(45):5400–5. doi:10.1016/j.vaccine.2016.07.045 pmid:27646030 finkelman bs, viboud c, koelle k, ferrari mj, bharti n, grenfell bt. global patterns in seasonal activity of influenza a/h3n2, a/h1n1, and b from 1997 to 2005: viral coexistence and latitudinal gradients. plos one. 2007 dec 12;2(12):e1296. doi:10.1371/journal.pone.0001296 pmid:18074020 lee js, shin kc, na bk, lee jy, kang c, kim jh, et al. influenza surveillance in korea: establishment and first results of an epidemiological and virological surveillance scheme. epidemiol infect. 2007 oct;135(7):1117–23. doi:10.1017/s0950268807007820 pmid:17291376 yang p, duan w, lv m, shi w, peng x, wang x, et al. review of an influenza surveillance system, beijing, people’s republic of china. emerg infect dis. 2009 oct;15(10):1603–8. doi:10.3201/eid1510.081040 pmid:19861053 leung tf, chan pk, hon kl, li am, cheng fw. influenza surveillance and vaccination in hong kong children. hong kong med j. 2018;24 suppl 6(5):8–11. eick-cost aa, hunt dj. assessment of icd-9-based case definitions for influenza-like illness surveillance. msmr. 2015 sep;22(9):2–7. pmid:26418885 zaraket h, saito r. japanese surveillance systems and treatment for influenza. curr treat options infect dis. 2016;8(4):311–28. doi:10.1007/s40506-016-0085-5 pmid:28035195 world health organization. who flunet 2018. available from: http://www.who.int/influenza/gisrs_laboratory/flunet/en/ diseases nioi. influenza surveillance 2018. available from: https://www.mhlw.go.jp/stf/seisakunitsuite/bunya/kenkou_iryou/kenkou/kekkaku-kansenshou01/houdou.html protection hcfh. flu express. 2018. available from: https://www.chp.gov.hk/en/resources/29/304.html prevention ucfdc. cdc flu activity and surveillance. 2018. available from: https://www.cdc.gov/flu/weekly/index.htm center cni. influenza weekly report. 2018. available from: http://www.chinaivdc.cn/cnic/en/ korea centers for disease control and prevention. public health weekly report. 2018. available from: https://www.cdc.go.kr/board/board.es?mid=a30504000000&bid=0033 snacken r, zucs p, brown c, jorgensen p, mott ja, amato-gauci a. influenza surveillance in europe. eur j public health. 2011 oct;21(5):674–5. doi:10.1093/eurpub/ckq185 pmid:21131348 schanzer dl, sevenhuysen c, winchester b, mersereau t. estimating influenza deaths in canada, 1992-2009. plos one. 2013 nov 27;8(11):e80481. doi:10.1371/journal.pone.0080481 pmid:24312225 tamerius j, nelson mi, zhou sz, viboud c, miller ma, alonso wj. global influenza seasonality: reconciling patterns across temperate and tropical regions. environ health perspect. 2011 apr;119(4):439–45. doi:10.1289/ehp.1002383 pmid:21097384 liu xx, li y, zhu y, zhang j, li x, zhang j, et al. seasonal pattern of influenza activity in a subtropical city, china, 2010-2015. sci rep. 2017 dec 13;7(1):17534. doi:10.1038/s41598-017-17806-z pmid:29235535 penttinen p, pebody r. influenza case definitions optimising sensitivity and specificity. euro surveillance: bulletin europeen sur les maladies transmissibles = european communicable disease bulletin. 2015;20(22):21148. https://ojs.wpro.who.int/ 1wpsar vol 12, no 3, 2021 | doi:10.5365/wpsar.2020.11.3.006 original research a n estimated 71 million people globally are living with chronic hepatitis c virus (hcv) infection, but <20% of these individuals are aware of their infection status.1 although affordable directly acting antivirals are available to treat hcv,2 finding cases remains difficult, obviating increasing access to hcv treatment, especially in lowand middle-income countries such as cambodia. it has been estimated that about 2% of the population of cambodia is living with chronic hcv infection, with a higher prevalence in older age groups.3–6 genotypes 1 and 6 were the main hcv genotypes in the country, each at about 46% prevalence.7 liver cancer is the leading cause of cancer deaths in the country, with 76% attributed to hepatitis b and/or hcv infection.8,9 in a seroprevalence survey conducted in maung russey health district in cambodia, about 65% of the population was unaware of hcv.6 in early 2020, the cambodia ministry of health established a national strategic plan (2020–2024) and national guidelines for viral hepatitis b and c,10 which includes scaling up hcv testing nationwide; however, plans for screening have not yet been issued. recommendations on the cost and effectiveness of a médecins sans frontières – france, phnom penh, cambodia. b department of tropical medicine and global health, nagasaki university, japan. c national institute of public health, cambodia. d communicable disease control department, ministry of health, cambodia. e provincial health department, battambang, ministry of health, cambodia. f department of clinical medicine, nagasaki university, japan. published: 12 july 2021 doi:10.5365/wpsar.2020.11.3.006 background: when a new health programme is introduced, it is crucial to estimate the costs for rational health policy decision-making. the aim of this study was to determine the costs of implementing two strategies for hepatitis c virus (hcv) screening in rural cambodia. methods: we retrospectively analysed clinical and cost data that were collected routinely for a demonstration project for scaling up hcv screening and testing in cambodia. the programme data were collected between march and december 2018 in maung russey operational district in battambang province, cambodia. findings: during the study period, 24 230 people were screened; 1194 (5%) were hcv seropositive, of whom 793 (66%) were confirmed to be viraemic. during the study period, 18% of the estimated population of the operational district were screened, of whom 45% were estimated to be seropositive and 41% to be viraemic. with passive screening alone, 8% of the estimated population were screened, of whom 29% were estimated to be seropositive and 28% viraemic. the cost per detected viraemic case was us$ 194 for passive screening alone and us$ 283 for passive and active screening combined. labour costs (31%) and tests and materials (29%) comprised the largest proportions of the cost. conclusion: combined active and passive screening per viraemic case detected was us$ 89 more expensive than passive screening alone but provided a higher yield (41% versus 28%) of viraemic cases. therefore, adding active screening to passive screening is beneficial. selective active screening strategies, such as targeting people over 45 years and other higher-risk groups, added value for hcv diagnosis. costing analysis of field implementation of hepatitis c case detection in rural maung russey operational district, cambodia su myat han,a,b ir por,c keo samley,d voeurng bunreth,e chris smith,b koya ariyoshi,b,f jean-philippe dousseta and mickael le paiha correspondence to su myat han (email: pearl.june@gmail.com) wpsar vol 12, no 3, 2021 | doi:10.5365/wpsar.2020.11.3.006 https://ojs.wpro.who.int/2 han et alcosting analysis of hcv screening in a rural health district in cambodia in september 2018, after six months of passive screening and to increase case detection, active screening was added. active screening targeted people aged ≥45 years, as epidemiological studies indicated that this age group is at higher risk of hcv infection than others.4,6 the implementation team comprised an msf nurse, health centre staff, village chiefs and community volunteers. information on screening activities and awareness about hcv were provided to the community before hcv screening days by village and community leaders through a village information-sharing system for one half day. on the screening day, all seropositive cases were referred to their closest health centre for confirmatory testing of viral load. the active screening strategy comprised one day of screening per village between september and december 2018 in the 175 villages and sub-villages in the maung russey operational district. passive screening continued during this time. in both strategies, screening of people who were under tuberculosis (tb) treatment was postponed until the end of their treatment. people known to be living with hiv were referred to the national centre for hiv/ aids, dermatology and sexually transmitted diseases. screening of pregnant or breastfeeding women was deferred until the end of breastfeeding. there was no overlap of the passive and active programmes, as all people were systematically asked by the screening team whether they had already been screened and/or treated for hcv infection. screening test and diagnosis the rapid diagnostic test sd bioline® was used for diagnosis in both screening strategies on capillary blood collected by fingerprick by trained nurses. positive cases were considered hcv seropositive. confirmatory testing was performed with a viral load test based on a polymerase chain reaction assay for hcv rna. cases positive in this test were considered viraemic positive cases. from seropositive patients detected in the passive screening programme, venous blood was collected for a viral load test at a health centre. seropositive patients detected by active screening were referred to the nearest different screening strategies for hcv are therefore necessary to ensure effective hcv service delivery and management in cambodia and in countries with similar settings. population or mass screening has been used in countries such as egypt and rwanda;11,12 however, high costs are a potential drawback to universal programmes. in cambodia, the medical humanitarian organization médecins sans frontières (msf) has been providing free hcv screening and treatment in collaboration with the ministry of health in phnom penh since september 2016 and in battambang province since march 2018. the projects were managed in partnership with the department of communicable disease control. by the end of 2020, 130 327 people had been screened in cambodia, of whom 30 684 (22%) were found to be hcv seropositive; of those, 20 645 (70%) were hcv viraemic, and 18 900 had initiated treatment with directly acting antivirals. the aim of the current study was to evaluate the cost and effectiveness of two screening strategies in order to inform public health authorities for future national screening. methods study setting data routinely collected for an hcv programme in maung russey, cambodia, between march and december 2018 were analysed. maung russey is a rural operational district with an estimated population of 209 949 distributed in 175 villages in 2018. an msf project for hcv screening and treatment was launched with existing ministry of health services, which included 13 health centres and a referral hospital covering the entire maung russey district. screening strategies two screening strategies were used to identify hcv cases in the community: passive and active screening. passive screening covered the general population aged ≥18 years and comprised voluntary hcv testing at health centres. this was initiated in march 2018 and continued for the duration of the study period. wpsar vol 12, no 3, 2021 | doi:10.5365/wpsar.2020.11.3.006https://ojs.wpro.who.int/ 3 costing analysis of hcv screening in a rural health district in cambodiahan et al costing analysis data were collected on expenditures for both passive and active screening, and data on the salaries of ministry of health and msf staff involved in hcv screening were collected as a component of labour costs. expenditure for screening included training and capacity-building, equipment (including depreciation), labour (for project personnel and health facility staff as opportunity costs), travel, materials and tests, user fees (msf paid for uninsured patients to access other tests at the same time as hcv testing) and indirect costs considered to be associated with hcv screening, including overhead costs of the msf office in maung russey, the maung russey referral hospital and health centres. the mean cost per hcv case identified was calculated by summing the cost of all resources used for screening and dividing them by the number of viraemic cases diagnosed. costs are expressed in us dollars. results screening uptake during the study period (march to december 2018), 24 230 adults (≥18 years) were screened for hcv, of whom 1194 (5%) were seropositive. among the seropositive cases, 793 (66%) were viraemic. while passive screening of the adult population (≥18 years) was conducted of 9049 people between march and august 2018, combined active (≥45 years) and passive (≥18 years) screening covered 15 181 individuals between october and december 2018. a higher proportion of seropositive cases in the ≥45-year age group (12.4%) was detected with passive screening than with combined active and passive screening (3.7%); however, 14 448 people were screened with combined passive and active screening and only 4396 with passive screening. during the entire study period and with each of the screening modalities, the nns for detecting one hcv viraemic case in the age group ≥45 years (11 for passive and 43 for active) was lower than that for the age group 18–44 years old (95 for passive and 56 for active) (table 1). health centre for blood collection. the 2% of referred patients who did not show up for the viral load test were actively followed up by a phone call from an msf nurse. the collected blood samples were transported to the referral hospital for confirmatory assays. collected specimens were centrifuged on the same day and transported via cold chain (2–8 °c) to the maung russey hospital laboratory. samples not processed for analysis within 24 hours were stored in a refrigerator (2–8 °c). the genexpert® hcv viral load assay was used. screening effectiveness the “number needed to screen” (nns) for diagnosis of one viraemic case was calculated as the number of screened people divided by the number of confirmed hcv viraemic cases. to compare the effectiveness of the two screening strategies (passive versus passive plus active screening), three outcomes were assessed: (i) the number of serological tests performed as a percentage of the target population; (ii) the number of positive serological cases as a percentage of the estimated number of hcv cases derived from a previous seroprevalence survey;4 and (iii) the number of viraemic cases as a percentage of the estimated number of hcv cases. the denominators of each outcome were as follows. i. the targeted population was estimated from the 2013 cambodia intercensal population survey.13 the estimated targeted populations were 133 162 people aged ≥18 years and 41 823 aged ≥45 years. ii. the numbers of seropositive cases were estimated to be 2663 (≥18 years) and 2133 (≥45 years) in accordance with the results of a previous seroprevalence survey, for seropositivity rates of 2.6% (≥18 years) and 5.1% (≥45 years). iii. the numbers of viraemic cases were estimated to be 1943 (≥18 years) and 1514 (≥45 years) in accordance with the previous seroprevalence survey of a prevalence of viraemia of 1.9% in the general population and 3.6% among people ≥45 years. wpsar vol 12, no 3, 2021 | doi:10.5365/wpsar.2020.11.3.006 https://ojs.wpro.who.int/4 han et alcosting analysis of hcv screening in a rural health district in cambodia fig. 1. numbers of cases screened in the passive and active screening programmes by age group and month, maung russey operational district, cambodia, march–december 2018 pcf: passive case finding; acf: active case finding. nns: number needed to screen. 0 500 1000 1500 2000 2500 3000 3500 4000 4500 5000 pcf (18–44 years old) pcf (≥45 years old) acf (≥45 years old) month n u m b er s cr ee n ed table 1. outcomes of passive and active screening in maung russey operational district, cambodia, march–december 2018 age group total screened seropositive cases viraemic cases n n (% of total screened) n (% of seropositive cases) nns phase 1: passive screening (march–august) 18–44 years 4653 78 1.7% 49 62.8% 95 ≥45 years 4396 547 12.4% 391 71.5% 11 total 9049 625 6.9% 440 70.4% 21 phase 2: passive and active screening (september–december) 18–44 years 733 32 4.4% 13 40.6% 56 ≥45 years 14 448 537 3.7% 340 63.3% 43 total 15 181 569 3.7% 353 62.0% 43 both phases (march–december) total 24 230 1194 4.9% 793 66.4% 31 wpsar vol 12, no 3, 2021 | doi:10.5365/wpsar.2020.11.3.006https://ojs.wpro.who.int/ 5 costing analysis of hcv screening in a rural health district in cambodiahan et al be due to the fact that screening was conducted on only one day per village, so that people who were not present on that day missed the opportunity. extending the number of community screening days, a strategy that has been used in other countries such as rwanda,12 might increase participation. it is thus recommended that the national programme conduct active community screening for several days or organize annual catch-up screening campaigns. we found that active screening greatly increased community screening coverage. while passive screening at health centres may reach symptomatic patients and those with known hcv status, active screening targets people outside health centres. egypt, rwanda and taiwan (china) have implemented mass screening campaigns for the general population at community facilities such as stadiums and schools.11,12,14 however, the entire general population was screened during such mass campaigns, while in this study active case finding was conducted only among people aged ≥45 years, who are known to be at high risk.6 in cambodia, use of other locations for reaching older people and other high-risk groups might be more affordable and feasible.15,16 we also found that the nns for finding one hcv case is lower when high-risk groups are targeted. while the project was expected to achieve a higher seropositivity rate through active screening of adults aged ≥45 years, the rate in the same age group was higher with passive screening. the probable explanation is that people visiting health centres are either aware of their hcv status or are symptomatic or at a late stage and seeking care. again, the higher positivity rate among older people supports active screening of these groups in a later phase of the project. we considered seven categories of costs, some of which can be removed from future costing by changing the way screening is conducted. for example, integrating hcv screening with tb screening at all levels (health centres, district, provincial and national) would greatly reduce costs, such as for installing genexpert, transport and overhead. the cost of combined passive screening and active screening (us$ 283) was only us$ 89 higher than that for passive screening alone (us$ 194) but yielded a higher viraemic case detection rate (41% versus 28% viraemic cases, respectively). moreover, the cost per viraemic case detected was comparable to the estimated screening effectiveness fig. 1 shows the numbers of cases screened by age group and month in the passive and active screening programmes between march and december 2018. combined passive and active screening covered 18% of the target population, while passive screening covered only 8% (fig. 2). the proportions of seropositive and viraemic cases to the estimated number of cases were also higher for combined passive and active screening (45% and 41%, respectively) than for passive screening alone (29% and 28%, respectively). cost of the screening programme between march and december, the programme cost us$ 85 208 for passive screening and us$ 99 733 for active and passive screening. the cost per viraemic positive case was us$ 194 for passive screening and us$ 283 for combined passive and active screening. the largest cost contributors were labour (31%), tests and materials (29%) and indirect costs (25%) (table 2). discussion the two hcv screening strategies tested in maung russey operational district in cambodia detected 1194 (5%) seropositive cases, 793 (66%) of whom were viraemic. the programme cost a total of us$ 184 941, with a cost per case screened of us$ 194 for passive screening and us$ 283 for combined passive and active screening. to our knowledge, this is the first hcv screening intervention based in primary health care centres and at the community level in cambodia. the findings provide reliable evidence for policy and actions to scale up hcv case-finding in cambodia. screening for hcv was voluntary, and 24 230 people were tested between march and december 2018 (18% of 133 162 targeted population). this relatively low screening rate might be due to low awareness of hcv in the community. a recent cross-sectional sero-survey reported that more than 64% of respondents were unaware of hcv.6 moreover, the asymptomatic nature of hcv infection might mean that people do not seek testing. our screening programme did not include health promotion; however, information on hcv screening and treatment was provided to all eligible patients during their health centre visit. the low coverage of active screening might wpsar vol 12, no 3, 2021 | doi:10.5365/wpsar.2020.11.3.006 https://ojs.wpro.who.int/6 han et alcosting analysis of hcv screening in a rural health district in cambodia fig. 2. effectiveness of passive and active screening in maung russey operational district, cambodia, march– december 2018 0 5 10 15 20 25 30 35 40 45 50 serological test as % of the target popula�on pcf 8 18 29 45 28 41 pcf+acf posi�ve serological test as % of the es�mated cases posi�ve virological test as % of the es�mated cases p er ce n ta ge o f ta rg et p op u la ti on ( % ) pcf: passive case finding; acf: active case finding. 1 cost of training both msf and ministry of health health centre staff. 2 genexpert machine, cold chain and other medical equipment used in the field. 3 labour costs include both msf and government salaries. 4 renting of two cars and drivers for transport of active case finding team members and collected blood samples. 5 rapid diagnostic tests, viral load tests and other materials for blood collection and information, education and communication materials. 6 msf covered costs for uninsured patients to access tests other than hcv screening. 7 overhead costs (salaries, administration costs and other office operation costs). table 2. implementation costs of passive and active screening by cost category (us$, 2018) in maung russey operational district, cambodia, march–december 2018 cost items programme cost (us$) cost per case screened (us$) cost profile (%)passive (mar–aug) passive + active (sep–dec) passive (mar–aug) passive + active (sep–dec) training1 1632 1632 3.7 4.6 2 field equipment2 3352 3179 7.6 9.0 3 labour3 31 791 31 155 70.1 88.3 31 transport4 18 11 790 0.0 33.4 9 tests and materials5 24 906 28 526 56.6 80.8 29 user fees6 762 1439 1.7 2.0 1 indirect costs7 22 747 22 747 51.7 64.4 25 total cost 85 208 99 733 193.7 282.5 100 wpsar vol 12, no 3, 2021 | doi:10.5365/wpsar.2020.11.3.006https://ojs.wpro.who.int/ 7 costing analysis of hcv screening in a rural health district in cambodiahan et al intellectual content by cs and ka. all authors reviewed and approved the final version. ethical considerations the study received ethical approval from the cambodian national ethics committee for health research, with reference no. 023 nechr dated 7 february 2019. as the data presented were collected as part of routine programmatic work and were anonymized, the protocol of the study was approved by msf as fulfilling the exemption criteria set by the msf ethics review board for retrospective analyses of routinely collected data. funding the activity was funded by médecins sans frontières – france. conflicts of interest we declare no competing interests. references 1. global hepatitis report 2017. geneva: world health organization; 2017. available from: https://apps.who.int/iris/handle/10665/255016, accessed 17 june 2021. 2. lim ag, trickey a, vickerman p. screening strategies for hepatitis c virus. hepatol commun. 2019;3(3):321–4. doi:10.1002/ hep4.1330 pmid:30859145 3. blach s, zeuzem s, manns m, altraif i, duberg a-s, muljono dh et al.; the polaris observatory hcv collaborators. global prevalence and genotype distribution of hepatitis c virus infection in 2015: a modelling study. lancet gastroenterol hepatol. 2017;2(3):161–76. doi:10.1016/s2468-1253(16)30181-9 pmid:28404132 4. a population-based survey of hepatitis c prevalence and risk factors in three rural districts in western cambodia 2019. in: msf report on cambodia hepatitis c programme. paris: médecins sans frontières. 5. sreng b, kimcheng h, sovann ly, huot e. epidemiology of viral hepatitis and liver diseases in cambodia. euroasian j hepatogastroenterol. 2015;5(1):30–3. doi:10.5005/jp-journals-10018-1125 pmid:29201682 6. lynch e, falq g, sun c, bunchhoeung pdt, huerga h, loarec a et al. hepatitis c viraemic and seroprevalence and risk factors for positivity in northwest cambodia: a household cross-sectional serosurvey. bmc infect dis. 2021;21(1):223. doi:10.1186/s12879021-05826-0 pmid:33637051 7. nouhin j, iwamoto m, prak s, dousset jp, phon k, heng s et al. molecular epidemiology of hepatitis c virus in cambodia during 2016–2017. sci rep. 2019;9(1):7314. doi:10.1038/s41598-01943785-4 pmid:31086236 cost per tb case, which was us$ 249 for active doorto-door screening in poor urban areas of phnom penh, us$ 308 for testing of tb contacts and us$ 316 for symptomatic testing of the older rural population.17 integration of hcv screening with community programmes such as for tb, hiv and malaria could improve health workforce capacity and reduce the national cost of different screening programmes.14 another possible costsaving strategy would be to take advantage of community gatherings during national holidays, such as the water festival and pchum ben, as well as world hepatitis day (28 july), to conduct periodic mass screening campaigns and hcv-related education. strengths and limitations a major strength of this study is that the output and cost data were collected and analysed with input from a field implementation programme. it thus captured real-world screening outcomes and costs. moreover, having one implementing partner simplified the cost estimates. a limitation of our study is that it is based on field experience and was not initially designed as operational research; it therefore relied on pooled data collected during the screening period. moreover, we did not use common measures of effectiveness, such as quality-adjusted or disability-adjusted life years. the comparability of these findings with those of other studies is thus limited. conclusion the combined passive and active screening approach cost us$ 89 more than passive screening alone yet provided a higher yield of viraemic cases (41% versus 28%, respectively). thus, adding active screening to passive screening should be considered, as it might contribute to the objective of hcv elimination by 2030, as recommended by who. contributors jpd, mlp and ip conceived the study. smh and ip managed the data and did the statistical analysis. ip checked for consistency of the analysis. smh wrote the first draft of the article, which was edited for consistency by jpd, mlp, ip, cs and ka and critically revised for important wpsar vol 12, no 3, 2021 | doi:10.5365/wpsar.2020.11.3.006 https://ojs.wpro.who.int/8 han et alcosting analysis of hcv screening in a rural health district in cambodia 13. cambodia inter-censal population survey 2013. phnom penh: national institute of statistics, ministry of planning; 2014. available from: http://ghdx.healthdata.org/record/cambodia-intercensal-population-survey-2013, accessed 17 june 2021. 14. who guidelines on hepatitis b and c testing. geneva: world health organization; 2017. available from: https://apps.who.int/iris/handle/10665/254621, accessed 17 june 2021. 15. yi s, mun p, chhoun p, chann n, tuot s, mburu g. prevalence of and risk factors for hepatitis c virus antibody among people who inject drugs in cambodia: a national biological and behavioral survey. harm reduct j. 2019;16(1):29. doi:10.1186/s12954-019-0299-1 pmid:31036011 16. de weggheleire a, an s, de baetselier i, soeung p, keath h, so v et al. a cross-sectional study of hepatitis c among people living with hiv in cambodia: prevalence, risk factors, and potential for targeted screening. plos one. 2017;12(8):e0183530. doi:10.1371/journal. pone.0183530 pmid:28832660 17. james r, khim k, boudarene l, yoong j, phalla c, saint s et al. tuberculosis active case finding in cambodia: a pragmatic, costeffectiveness comparison of three implementation models. bmc infect dis. 2017;17(1):580. doi:10.1186/s12879-017-2670-8 pmid:28830372 8. narin p, hamajima n, kouy s, hirosawa t, eav s. characteristics of liver cancer at khmer-soviet friendship hospital in phnom penh, cambodia. asian pacific j cancer prev. 2015;16(1):35–9. doi:10.7314/apjcp.2015.16.1.35 pmid:25640378 9. chassagne f, rojas rojas t, bertani s, bourdy g, eav s, ruiz e et al. a 13-year retrospective study on primary liver cancer in cambodia: a strikingly high hepatitis c occurrence among hepatocellular carcinoma cases. oncology. 2016;91(2):106–16. doi:10.1159/000446398 pmid:27250992 10. national strategic plan for viral hepatitis b and c (nsp 20202024). pnomh penh: ministry of health cambodia; 2020. available at: http://cdcmoh.gov.kh/prevention-control/viral-hepatitis, accessed 17 june 2021. 11. schroeder se, pedrana a, scott n, wilson d, kuschel c, aufegger l et al. innovative strategies for the elimination of viral hepatitis at a national level: a country case series. liver int. 2019;39(10):1818– 36. doi:10.1111/liv.14222 pmid:31433902 12. umutesi j, liu cy, penkunas mj, makuza jd, ntihabose ck, umuraza s et al. screening a nation for hepatitis c virus elimination: a cross-sectional study on prevalence of hepatitis c and associated risk factors in the rwandan general population. bmj open. 2019;9(7):e029743. doi:10.1136/bmjopen-2019-029743 pmid:31272986 an investigation of a measles outbreak in japan and taiwan, china, march–may 2018 original research kazuki shimizu,a ryo kinoshita,a keita yoshii,a andrei r. akhmetzhanov,a sungmok jung,a hyojung leea and hiroshi nishiuraa a graduate school of medicine, hokkaido university. correspondence to hiroshi nishiura (email:nishiurah@med.hokudai.ac.jp). to cite this article: shimizu k, kinoshita r, yoshii k, akhmetzhanov ar, jung s, lee s, et al. an investigation of a measles outbreak in japan and taiwan, china, march–may 2018. western pac surveill response j. 2018 aug;9(3). doi:10.5365/wpsar.2018.9.2.005 abstract objective: to investigate a measles outbreak that spread to japan and taiwan, china during march–may 2018, exploring the characteristics of the super-spreading event. methods: a contact investigation of the index case and reconstruction of the epidemiological dynamics of measles transmission were conducted. employing a mathematical model, the effective reproduction number was estimated for each generation of cases. results and discussion: a single index case gave rise to a total of 38 secondary cases, 33 in japan and five in taiwan, china. subsequent chains of transmission were observed in highly vaccinated populations in both japan and taiwan, china. the effective reproduction number of the second generation was >1 for both japan and taiwan, china. in japan, the reproduction number was estimated to be <1 during the third generation. vaccination of susceptible individuals is essential to prevent secondary and tertiary transmission events. introduction measles is caused by the measles virus, a single-stranded negative-sense enveloped rna virus. it is a vaccine-preventable disease, subject to control and elimination via surveillance and vaccination programmes.1,2 since the year 2000, a two-dose schedule for measles vaccination has been recommended by global measles mortality reduction and regional elimination: strategic plan,2 organized by the world health organization (who), united nations children's fund and the united states centers for disease control and prevention, and substantial progress has been made towards measles elimination in countries that belong to the who western pacific region.3,4 nevertheless, the virus has continued to circulate, causing multiple outbreaks in member countries and surrounding areas.3-5 since 2017, there has been a surge of global measles cases, especially in european countries,6 and the chance of experiencing an outbreak in the western pacific region has continued to be to be high. even in highly vaccinated countries such as japan,7 imported cases can produce clusters with multiple chains of transmission.8 interrupting these chains requires supplementary vaccination among adults, especially those who are unvaccinated or have received only one vaccination.5,9 if susceptible groups of people remain unvaccinated, countries are at risk of experiencing outbreaks with additional introductions of imported cases. on 23 march 2018, the japanese government was notified of an imported case of measles in okinawa prefecture, the southernmost prefecture of japan, arising from a taiwan chinese traveller.10 an outbreak of measles occurred in okinawa, arising from the contact with the index case; moreover, there have been chains of transmission arising from the same index case in taiwan, china.11 the present study aims to investigate a cross-border outbreak of measles that spread to japan and taiwan, china and describe the dynamics of disease transmission in this outbreak. methods case definition and epidemiological data collection a measles case was defined by the presence of (1) a generalized rash, (2) fever, and (3) other typical symptoms including cough, coryza and conjunctivitis and by laboratory confirmation of measles infection. laboratory-confirmed measles is defined as the detection of measles-specific immunoglobulin m (igm) antibodies in patient serum12 or detection of virus by nested real-time polymerase chain reaction (pcr). modified measles is defined by the presence of at least one of the three signs or symptoms described above plus laboratory confirmation of measles infection. in general, modified measles is a milder form of the disease with a longer incubation period (14–20 days) and a lack of premonitory symptoms, koplik spots or a generalized rash.13 the rash, when it occurs, can be localized to a foot or hand. modified measles is less infectious than typical measles infection, but those with modified measles can spread the infection to others and still require watchful observation.14 the present study is based on governmental reports of the outbreak investigations in japan and taiwan, china.10,15 we retrospectively scanned all real-time reports of the outbreak, including those from local prefectures that were affected: okinawa, aichi, kanagawa and tokyo in japan.16-19 we then reconstructed the transmission dynamics of the measles outbreak that arose from the index case. dates of illness onset and laboratory confirmation, age, sex, country or area of residence and vaccination history of cases were retrieved, allowing us to characterize the epidemic as a function of these variables. the index case's entry and exit dates, to and from japan and taiwan, china, and a detailed history of potential contacts were retrieved from publicly available information.15,16 using this information, we characterized the descriptive epidemiological features of the epidemic. effective reproduction number effective reproduction number (rn), interpreted as the average number of secondary cases generated by a single primary case in generation n, is an objective epidemiological measure to quantify disease spread between generations. an rn value >1 reflects an increase in the number of cases, while an rn value <1 ensures that the number of cases is decreasing. the temporal distribution of rn values could thus reflect an outbreak brought under control; therefore, the measure can be used for assessing the effectiveness of public health interventions and/or for designing disease control policy in the future, such as restricting human movements during the course of an epidemic or raising awareness among the general public. because the mean generation time of measles infection is relatively long compared to its variance (mean: 11.7 days and variance: 9.0 days2),20 we estimated a generation-specific rn in the present study. we first reconstructed the transmission network using publicly available information. subsequently, we calculated the generation-dependent number of cases by either referring to the contact history or imposing an assumption that the interval between generations was constant at 11 days. to assign cases into a particular generation, first we relied on the known contact history (the link to a primary case) that was available in the case reports. we confirmed that the peaks of the generation-specific epidemic curve were about 11 days apart from each other, and then we separated cases into different generations by referring to contact-tracing results. if the transmission tree was not known, we took the mid-point between peaks as the cut-off date separating two generations. as part of the sensitivity analysis, we also calculated the number of cases in each generation, including +/1 day of the imposed cut-off date. given the number of cases in the nth generation, cn, the expected number of cases in the (n + 1)th generation was modelled as where rn represents the effective reproduction number of the nth generation which represents the average number of secondary cases generated by a single primary case. we assumed that the observed number of generation-dependent cases followed a poisson distribution: maximum likelihood estimation was employed to appropriately quantify the uncertainty (confidence intervals) of parameters. alternatively, we could have identified a point estimate of the rn by counting the number of cases in each generation and taking the ratio of the number of cases in adjacent generations. using the second equation as the likelihood function, the maximum likelihood estimate of parameters was calculated to obtain parameter estimates of the rn, and the 95% confidence interval (ci) was computed by using the profile likelihood method. data availability in addition to provided data sources,15-19 the collected information of cases is shared on an open online repository.21 ethics this study was based on publicly disclosed information as part of an outbreak investigation and did not require ethical review. results index case and contacts the cross-border outbreak has been linked to an adult man from taiwan, china who visited thailand from 1 to 4 march 2018. on 14 march, the index case developed fever and cough. on 17 march, he flew from taiwan, china to okinawa on a commercial flight, infecting two flight attendants and two passengers who were unvaccinated, and then travelled to naha city, the capital of okinawa. the index case developed a rash on 19 march, leading him to seek care at the local medical service. he was hospitalized on the date of clinical diagnosis on 19 march. on 26 march, he returned to taiwan, china on a commercial flight. fig. 1 shows the epidemic curves for japan and taiwan, china. in japan, at least eight cases were definitively linked to the index case (fig. 2). many unlinked cases also developed symptoms within a time period consistent with the transmission chain from the index case. in total, the transmission from the index case resulted in producing 123 local cases in japan and 13 local cases in taiwan, china. ten case patients in taiwan, china were exposed to measles on an aircraft or at airport-associated facilities. one case in taiwan, china acquired an infection in the workplace, and the history of transmission among the other two cases remained unknown. in japan, 10 cases were infected at an unknown (undisclosed) facility a in okinawa prefecture, 17 cases were nosocomial, 13 cases acquired infection in households, 10 cases at their workplace and three were infected in schools. out of the total 124 cases that include the index case, the route of transmission was unknown for 71 cases. due to a large number of transmission events that were very closely traced, the index case is considered to have acted as the primary case of the super-spreading event. the index case visited a densely populated area in japan (kokusai street in naha city of okinawa prefecture). in aichi prefecture, japan, nagoya daini red cross hospital was an important foci of secondary transmissions. in that hospital, a patient who had returned from a trip to okinawa sought medical attention and unintentionally exposed hospital staff who possessed only low levels of antibodies. a total of 33 cases in okinawa prefecture were diagnosed as having modified measles. the transmission potential of modified measles in the current outbreak was estimated elsewhere.14 fig. 1. transmission dynamics of measles in japan and taiwan, china march–may 2018 click to download figure 1. jpg, 1100kb fig. 2. transmission tree of measles associated with the index case in japan and taiwan, china, march–may 2018 click to download figure 2. jpg, 546kb temporal dynamics in japan the first peak of illness was observed on 30 march, and a subsequent peak occurred on 9 april (fig. 1a). referring to the contact-tracing results of known links and observing the greater variance of illness onset dates in tertiary cases as compared to secondary cases, we determined that there were 30 cases in the fourth generation. despite intensive follow-up of contacts, 12 cases in the fifth generation and three cases in the sixth generation were observed. during the third generation, one case patient moved to aichi prefecture, contributing to 10 subsequent cases in the following generation. table 1 shows the composition of cases. the vaccination coverage of case patients aged 9 years old or younger was 33.3%, indicating that they were predominately unvaccinated individuals. cases in this outbreak were primarily young adults aged 20–39 years (n = 70 (56.5%)) (table 1). cases who had received at least one dose of measles vaccine accounted for 33.1%. table. 1. age, sex and vaccination history of measles cases in japan and taiwan, china, march–may, 2018 click to download table 1. jpg, 273kb temporal dynamics in taiwan, china fig. 1b shows the epidemic curve in taiwan, china. the index case from the outbreak in japan also started chains of transmission in taiwan, china. before travelling to okinawa, the index case caused a secondary case in a workplace contact. subsequently, during his flight from taiwan, china to japan, two flight attendants and two other passengers were infected (fig. 1c). a secondary transmission event was seen on the index case's flight to japan, while no one was identified as infected on his way back to taiwan, china (fig. 2). subsequently, linked to the third and fourth cases, a total of eight tertiary cases were confirmed. estimates of reproduction number for the first generation, the rn in japan was estimated to be 33.0 (95% ci: 23.0–45.6). in the second generation, the estimate dropped to 1.3 (95% ci: 1.0–1.7); subsequently, the rn of the third, fourth and fifth generations took the value below unity, estimated at 0.7 (95% ci: 0.5–1.0), 0.4 (95% ci: 0.2–0.6) and 0.2 (95% ci: 0.0–0.6), respectively. even when we varied the cut-off date by +/1 day, the rn of the first generation was as large as 37.0 and 28.0, respectively. in taiwan, china, the reproduction number of the first generation was estimated to be 5.0 (95% ci: 1.8–10.7). in the second generation, the rn declined to 1.6 (95% ci: 0.7–3.0). subsequently, cases ceased in taiwan, china, and thus, the rn of the third generation was zero. discussion the present study explored epidemiological features of the cross-border outbreak of measles that spread to japan and taiwan, china in the who western pacific region, where great progress has been made towards measles elimination in recent years.3 as of july 2018, japan was among eight countries and areas in the western pacific region that had achieved elimination of measles (in addition to australia, brunei darussalam, cambodia, hong kong sar [china], macao sar [china], new zealand and the republic of korea). a single index case contributed to super-spreading events, leading us to observe clusters of cases in both japan and taiwan, china. given the large number of secondary cases, the chance of observing third and subsequent generations of cases was high even in these highly vaccinated populations. in japan, the rn was <1 only from the third generation, leading the incidence to wane over time. due to the large outbreak size, a substantial number of contacts were followed, resulting in a resource-demanding outbreak. two major conclusions can be drawn from our investigation. first, the outbreak was traced back to a single index case. potential contributing factors to high individual infectivity include a biological cause, such as an individual who exhales a substantial amount of viruses. in this outbreak, we did not identify a particular risk factor other than contact with the index patient, and the transmission was not restricted to health-care settings. the clinical diagnosis of the index case was swiftly made on the same day of the onset of rash, and many contact events that took place before the onset of rash contributed to secondary transmissions. second, given the large number of secondary cases, the clusters of cases did not end up with only one generation of cases even in these highly vaccinated populations. a substantial number of tertiary transmission events were observed. it must be noted that the rn of the second generation was estimated to be >1 for both japan and taiwan, china. especially in japan, the rn was <1 only from the third generation. this event led public health officials to trace a substantial number of contacts in both japan and taiwan, china, including more than 3500 contacts in taiwan, china alone. considering the potential for continued chains of transmission from secondary cases, our study endorses the need to implement supplementary immunization programmes.5,9 three categories of individuals could be susceptible to measles infection and should be targeted for immunization during supplemental campaigns: (1) unvaccinated individuals, especially children; (2) individuals who have received only one dose of measles-containing vaccine; and (3) individuals whose vaccination history is unknown. the study had several limitations. first, the outbreak in japan involved a substantial number of modified measles cases whose illness did not meet the definition of a measles case. there could potentially be undiagnosed, modified cases. second, we used epidemic curves to separate cases into different generations. while we referred to the contact-tracing results, more precise estimation using a sophisticated mathematical modeling approach has yet to be conducted. third, our study relied on published reports based on the outbreak investigation; more detailed descriptions and discussions over these outbreaks, such as phylogenetic analysis to validate contact-tracing results and detailed laboratory-testing results (e.g. viral load of cases), have yet to be reported. this study describes an outbreak of measles that originated from a single index case and estimates the rn. a super-spreading event occurred even with a swift diagnosis upon rash onset. considering the difficulty with control in this outbreak, our study endorses the importance of vaccinating international travellers, not only those visiting endemic countries but any travellers visiting geographic areas at risk of transmission. to avoid unnecessary chains of transmission, our findings also indicate the importance of continuing and strengthening routine immunization. conflicts of interest none. funding hn received funding support from the japan agency for medical research and development, jsps kakenhi grant numbers 16kt0130, 16k15356, 17h04701, 17h05808 and 18h04895, inamori foundation, and the japan science and technology agency (jst) crest program (jpmjcr1413). rk acknowledges the jsps fellowship. hl and sj have received financial support through the jsps program for advancing strategic international networks to accelerate the circulation of talented researchers. the funders had no role in study design, data collection and analysis, decision to publish, or preparation of the manuscript. acknowledgements none. references durrheim dn, crowcroft ns, strebel pm. measles the epidemiology of elimination. vaccine. 2014 dec 5;32(51):6880–3. doi:10.1016/j.vaccine.2014.10.061 pmid:25444814 perry rt, gacic-dobo m, dabbagh a, mulders mn, strebel pm, okwo-bele jm, et al.; centers for disease control and prevention (cdc). progress toward regional measles elimination–worldwide, 2000-2013. mmwr morb mortal wkly rep. 2014 nov 14;63(45):1034–8. pmid:25393223 hagan je, kriss jl, takashima y, mariano kml, pastore r, grabovac v, et al. progress towards measles elimination, western pacific region, 2013–2017. mmwr morb mortal wkly rep. 2018;67:491–95. choe yj, jee y, oh md, lee jk. measles elimination activities in the western pacific region: experience from the republic of korea. j korean med sci. 2015 nov;30 suppl 2:s115–21. doi:10.3346/jkms.2015.30.s2.s115 pmid:26617443 inaida s, matsuno s, kobune f. measles elimination and immunisation: national surveillance trends in japan, 2008-2015. epidemiol infect. 2017 aug;145(11):2374–81. doi:10.1017/s0950268817001248 pmid:28641590 filia a, bella a, del manso m, baggieri m, magurano f, rota mc. ongoing outbreak with well over 4,000 measles cases in italy from january to end august 2017 what is making elimination so difficult? euro surveill. 2017 sep 14;22(37):30614. doi:10.2807/1560-7917.es.2017.22.37.30614 pmid:28933342 tanaka-taya k. [current situation of measles in japan, 2017]. uirusu. 2017;67(1):17–24 (in japanese). doi:10.2222/jsv.67.17 pmid:29593147 nishiura h, mizumoto k, asai y. assessing the transmission dynamics of measles in japan, 2016. epidemics. 2017 sep;20:67–72. doi:10.1016/j.epidem.2017.03.005 pmid:28359662 kinoshita r, nishiura h. assessing age-dependent susceptibility to measles in japan. vaccine. 2017 jun 5;35(25):3309–17. doi:10.1016/j.vaccine.2017.05.011 pmid:28501456 [on the occurrence of measles cases associated with okinawa prefecture (up to 19 april 2018)]. tokyo: national institute of infectious diseases, 2018 (https://www.niid.go.jp/niid/ja/id/655-disease-based/ma/measles/idsc/7990-measles20180419.html) (in japanese). taiwan cdc advises public to determine need for measles vaccination and get vaccinated prior to traveling overseas as this year's first imported measles case confirmed. taipei: taiwan centers for disease control, 2018 (https://www.cdc.gov.tw/english/info.aspx?treeid=bc2d4e89b154059b&nowtreeid=ee0a2987cfba3222&tid=0e8b646fa6018f3a). centers for disease control and prevention (cdc). progress toward measles elimination–japan, 1999-2008. mmwr morb mortal wkly rep. 2008 sep 26;57(38):1049–52. pmid:18818586 ergonul o, can f, akova m, madoff l. emerging infectious diseases: clinical case studies. cambridge, ma: academic press; 2014. mizumoto k, kobayashi t, chowell g. transmission potential of modified measles during an outbreak, japan, march–may 2018. euro surveill. 2018 jun;23(24). doi:10.2807/1560-7917.es.2018.23.24.1800239 pmid:29921344 as 5 additional measles cases confirmed, taiwan cdc continues to closely monitor outbreak and health of close contacts. taipei: taiwan centers for disease control, 2018 (https://www.cdc.gov.tw/english/info.aspx?treeid=bc2d4e89b154059b&nowtreeid=ee0a2987cfba3222&tid=a414238b117bbbe3). [on the occurrence of measles]. naha: okinawa prefecture; 2018 (http://www.pref.okinawa.jp/site/hoken/eiken/kikaku/kansenjouhou/measles.html (in japanese). [on the occurrence of measles]. nagoya: aichi prefecture; 2018 (http://www.pref.aichi.jp/soshiki/kenkotaisaku/0000013280.html (in japanese). [on the occurrence of measles]. kawasaki: kanagawa prefecture; 2018 (http://www.city.kawasaki.jp/350/page/0000097465.html (in japanese). [measles]. tokyo: tokyo metropolitan infectious disease surveillance center; 2018 (http://idsc.tokyo-eiken.go.jp/diseases/measles/ (in japanese). klinkenberg d, nishiura h. the correlation between infectivity and incubation period of measles, estimated from households with two cases. j theor biol. 2011 sep 7;284(1):52–60. doi:10.1016/j.jtbi.2011.06.015 pmid:21704640 who wpsar outbreak of measles in taiwan and japan 2018. san francisco: github; 2018 (https://github.com/aakhmetz/who_wpsar_outbreak-of-measles-in-taiwan-and-japan-2018, accessed 10 august 2018). a tuberculosis contact investigation involving a large number of contacts tested with interferon-gamma release assay at a nursing school: kanagawa, japan, 2012 field investigation report masako tasaka,a tamae shimamura,b mami iwata,c takahiro toyozawad and masaki otab a kanagawa prefectural institute of public health, kanagawa, japan. b research institute of tuberculosis, tokyo, japan. c naka welfare and health office, yokohama, japan. d yokohama city health department, yokohama, japan. correspondence to (email:). to cite this article: tasaka m, shimamura t, iwata m, toyozawa t, ota m. a tuberculosis contact investigation involving a large number of contacts tested with interferon-gamma release assay at a nursing school: kanagawa, japan, 2012. western pac surveill response j. 2018 aug;9(3). doi:10.5365/wpsar.2018.9.1.001 abstract in may 2012, a teacher of a nursing school with about 300 staff members and students in japan was diagnosed with sputum smear-positive pulmonary tuberculosis (tb), leading to an investigation involving nearly 300 contacts. we describe the contacts' closeness to the index tb patient and the likelihood of tb infection and disease. a case of tb was defined as an individual with positive bacteriological tests or by a physician diagnosis of tb. a latent tb infection (ltbi) case was defined as an individual who had a positive interferon-gamma release assay (igra). a total of 283 persons screened with igra were analysed. eight persons (2.8%, 95% confidence interval [ci]: 1.2–5.4) tested positive by igra; one student who had intermediate (less than 10 hours) contact with the index patient was found to have pulmonary tb by chest x-ray. the positivity in igra among staff members with very close contact with the index patient (4 of 21, 19%, 95% ci: 5.4–42%) with a statistically significant relative risk of 17 (95% ci: 2.0–140) was high compared with that of the intermediate contacts (1 of 88, 1.1% [95% ci: 0.028–6.2]). there was a statistically significant trend in the risk of tb infection and closeness with the index patient among the staff members and students (p < 0.00022). in congregate settings such as schools, the scope of contact investigation may have to be expanded to detect a tb case among those who had brief contact with the index patient. introduction in japan, the tuberculosis (tb) notification rate has declined in the past six decades from 698.4 per 100 000 population in 1951 to 17.7 per 100 000 population in 2011.1 however, 8000 smear-positive tb cases are still reported annually, and more than 65% of those involve persons aged 65 years or older.2 tb outbreaks involving hospitals, workplaces and homeless people have also been reported;3-5 however, only a few involving schools were reported in the past decade.6,7 in may 2012, a teacher in her 50s was diagnosed with sputum smear-positive pulmonary tuberculosis (tb). she taught at a nursing school in kanagawa, japan that has over 300 staff members and students. at the school, new teachers and students are tested with tuberculin skin testing (tst), followed by interferon-gamma release assay (igra), if indicated, and annual chest x-ray (cxr) thereafter. although the teacher had a cough for several months and had an abnormal finding by cxr a year before, tb had not been suspected since she had a history of asthma and nontuberculous mycobacterial infection. the teacher had close contact with other teachers and students, particularly those in the first and second years. the affiliated hospital demanded all the staff and students be screened for tb, which led to an unusually large-scale contact investigation involving over 300 individuals. tb contact investigations in japan rely on igra1,6,8 rather than tst to screen latent tb infection (ltbi). igra is more specific and avoids interference caused by bacillus calmette–guérin (bcg) vaccination,9 which an estimated 90–95% of the population receives.10 this study aims to describe and compare the contacts' closeness to the index tb patient with the positivity of igra among those contacts. methods a case of tb was defined as an individual who was confirmed with a positive sputum smear, culture or nucleic acid amplification test (naat) or by a physician diagnosis of tb from january 2011 through december 2013. an ltbi case was defined as an individual who had a positive igra. the index patient's period of infectiousness was determined to be from december 2011 through may 2012 based on her history of symptoms. we conducted a retrospective cohort study, enrolling almost all staff members and nursing students who were considered to have had contact with the index tb patient. the following three groups were excluded from the analysis: 1) staff and students who had a history of tb, 2) students who had a history of igra positivity or ltbi treatment at or before entry to the nursing school, and 3) staff who had been working more than three years at the school and had a history of igra positivity or ltbi treatment before 2009. for these groups, it was impossible to attribute their igra positivity to contact with the index patient in this investigation, and it was unlikely that the previous events were linked to this investigation. since our focus of this study was to compare the contacts' closeness to the index tb patient with their igra results, those who were screened solely by cxr (mostly administrative staff who did not have many contacts with the index patient) were also excluded from the analysis. the contacts were divided into four groups: very close contacts (the staff who shared the same room with the index patient), close contacts (firstand second-year students who attended the class of the index patient for over 10 hours during the infectious period), intermediate contacts (third-year students who attended the index patient's class for 10 hours or less) and other contacts (remaining staff and students who had almost no contact with the index patient). the very close contacts were tested twice with igra in may and july–august 2012; the close, the intermediate and the other contacts were tested once with igra in july–august 2012. however, 19 of the other contacts, mostly administrative staff, who did not have contact with the index patient were tested only by cxr in may 2012. all the igra-positive contacts were screened by cxr, and people who had abnormal findings were referred to a chest physician for follow-up. those who were igra-positive without any abnormal findings on cxr were treated for ltbi with isoniazid for six to nine months. the one who was diagnosed with pulmonary tb was tested (sputum acid-fast bacilli smear and culture three times and naat) and treated with the standard regimen. analysis of igra positivity, 95% confidence intervals, and other statistical tests were carried out with r software (the r foundation, vienna, austria). a fisher's exact test was used to calculate the relative risks among the contact groups. the intermediate contact group was used as the reference in calculating the relative risks because they were a large group (about 90 individuals) and were less likely to be exposed to the index patient but unlikely zero positivity. a cochran-armitage test was conducted to determine whether there was a trend among the positivity of the groups. a p-value less than 0.05 was considered statistically significant. ethics this investigation was conducted in accordance with the infectious disease control act of 1999 of japan. we also obtained a waiver of ethical review for the study from the institutional review board of the research institute of tuberculosis because this study was retrospective, it relied on secondary use of the data that had been already collected by the local health offices, and it did not involve confidential information. results a total of 307 persons were enrolled as contacts for screening (table 1) either with igra (285 contacts, 93%) or cxr (134 contacts, 44%) or both (115 contacts, 37%). three first-year students had already tested positive by igra and had cxr at entry in early april 2012, and they were excluded from the initial screening. these three students were continuously followed up with cxr every six months. the 19 staff members (6%) who were screened only by cxr were excluded from the analysis. of the 285 tested by igra, one teacher and one student were also excluded since they had histories of tb (about 14 years before) and ltbi treatment, respectively, before the event. of the 283 (100%) who were analysed, eight (2.8%, 95% confidence interval [ci]: 1.2–5.4) were positive by igra (table 2). of those eight, four staff members and three second-year students tested positive by igra in may; one third-year student tested positive in july 2012. the age groups of the igra-positive students and the staff members were 20–29 years and 40–49 years, respectively. one third-year igra-positive student was found by cxr in august 2012 to have pulmonary tb; the student was smearand culture-negative (epidemic curve in fig. 1). the student had cxr in april 2012 for the routine check-up and also in may 2012 for contact investigation, and both were considered normal. no other staff member or student developed active pulmonary tb. the highest prevalence of igra test positivity was found in the very close contacts who shared the same office (19% [95% ci: 5.4–42%]), with a statistically significant relative risk of 17.0 (95% ci: 2.0–140), compared with the intermediate contacts group (1.1% [95% ci: 0.028–6.2%]) (table 2). the cochran-armitage test revealed that there was a statistically significant trend in the risk of developing tb or ltbi among the ranked groups of staff members and students (p = 0.00022). table 1. characteristics of the tb contacts of a nursing school and types of screening tests conducted, kanagawa, japan, 2011–2013 click to download table 1. jpg, 265kb table 2. numbers of persons with tb disease and with positive igra test among staff and students of a nursing school in relation to a tb contact investigation, kanagawa, japan, 2011–2013 click to download table 2. jpg, 586kb fig. 1. epidemiologic curve of tb cases at a nursing school in kanagawa, japan, by month of symptom onset or diagnosis (if asymptomatic), 2011–2013 click to download figure 1. jpg, 189kb discussion we conducted a tb contact investigation at a nursing school in japan after a teacher was diagnosed with pulmonary tb. during the investigation, almost the entire staff and student body were screened for tb infection by igra, which makes the results of the investigation more accurate than when tst is used in settings with high bcg coverage such as in japan.6–8,11,12 the staff who shared an office with the index patient were 17 times more likely to have ltbi than the intermediate contacts consisting of third-year students. although the staff members were older than the students, igra positivity among middle-aged japanese men and women is not normally as high as 19% (e.g. 3.5% [95% ci: 1.6–6.6%] in the 35–54 year age group).8 also, there was a statistically significant trend in the risk of tb infection among the staff members and students ordered by duration of close contact, implying a dose–response relationship seen in previous studies.13 these findings suggest that this event was a tb outbreak that was propagated from the index patient to staff members and students. of note, one of the intermediate contacts was not only infected with tb but also developed tb disease, suggesting contact of even fewer than 10 hours may result in tb infection. thus, the scope of tb contact investigations may have to be expanded,14 particularly in school settings.13 one weakness of this investigation is the lack of molecular data to confirm that the infective strains were related. although a third-year student developed tb disease, the sputum culture was negative. however, considering the fact that 13% of all tb cases in japan are bacteriologically negative,15 this is not uncommon. the possibility that the student acquired the infection outside of the school is small, considering the low incidence of pulmonary tb in young japanese (about 3 per 100 000 population in those aged from 15 to 24 years15) and the timing of his development of the disease at about eight months after the index patient. another limitation is that we were unable to take the baseline igra from the contacts except a few who had a large tuberculin reaction at routine entry screening and were retested with igra. however, considering the long duration of symptoms of the index patient, even if the baseline tests had been conducted, some may have already converted at the time. a final limitation is that this study was based on the observation in a single nursing school. however, we believe the results can be extrapolated to other countries with a medium burden of tb similar to japan. in congregate settings, such as schools, administrators should be vigilant against tb to prevent outbreaks. since it is difficult to distinguish cough caused by tb from cough due to asthma or other illnesses, physicians should take sputum samples for acid-fast bacilli tests from those who have persistent cough more than two weeks to minimize a diagnostic delay. in a country where bcg coverage is high, igra, rather than tst, should be used for screening in tb contact investigations. in congregate settings, the scope of contact investigation may have to be expanded to detect tb among those who had brief contact with the index patient. conflicts of interest none declared. funding this study was partially supported by the japan agency for medical research and development through grants jp15fk0108017 and jp17fk0108114. acknowledgements the authors would like to thank the public health staff members of the kanagawa prefecture and yokohama city governments for their essential contributions to this contact investigation. references katsuda n, hirosawa t, reyer ja, hamajima n. roles of public health centers (hokenjo) in tuberculosis control in japan. nagoya j med sci. 2015 feb;77(1-2):19–28. pmid:25797967 tuberculosis surveillance center; rit; jata. [tuberculosis annual report 2013--4. tuberculosis treatment and treatment outcomes]. kekkaku. 2015 jul;90(7):595–604. (in japanese) pmid:26630730 ota m, isshiki m. [an outbreak of tuberculosis in a long-term care unit of a mental hospital]. kekkaku. 2004 oct;79(10):579–86. (in japanese) pmid:15631110 seki n. [a suspected case of mass outbreak of tuberculosis infection in a small company separated into two floors] (in japanese). kekkaku. 2003 may;78(5):395–9. pmid:12806982 kinoshita s, ohmori m, tsukamoto k, ohtsuka g, mashiko m, fujiu m, et al. [outbreaks of tuberculosis in facilities used by an unspecified number of people near a train station problems regarding tuberculosis in urban areas]. kekkaku. 2007 oct;82(10):749–57. (in japanese) pmid:18018599 masuda m, harada n, shishido s, higuchi k, mori t. [usefulness of quantiferontb-2g in a suspected case of drug resistant tuberculosis outbreak in a university]. kekkaku. 2008 jan;83(1):7–11. (in japanese) pmid:18283909 matsumoto k, tatsumi t, arima k, koda s, yoshida h, kamiya n, et al. [an outbreak of tuberculosis in which environmental factors influenced tuberculosis infection]. kekkaku. 2011 may;86(5):487–91. (in japanese) pmid:21735855 ota m, kato s. risk of tuberculosis among air passengers estimated by interferon gamma release assay: survey of contact investigations, japan, 2012 to 2015. euro surveill. 2017 mar 23;22(12):30492. doi:10.2807/1560-7917.es.2017.22.12.30492 pmid:28367799 mori t. usefulness of interferon-gamma release assays for diagnosing tb infection and problems with these assays. j infect chemother. 2009 jun;15(3):143–55. doi:10.1007/s10156-009-0686-8 pmid:19554399 who and unicef estimates of immunization coverage: 2016 revision. new york: united nations international children's emergency fund; 2017 (https://data.unicef.org/wp-content/uploads/country_profiles/japan/immunization_country_profiles/immunization_jpn.pdf, accessed 8 february 2018). higuchi k, sekiya y, igari h, watanabe a, harada n. comparison of specificities between two interferon-gamma release assays in japan. int j tuberc lung dis. 2012 sep;16(9):1190–2. doi:10.5588/ijtld.11.0829 pmid:22748102 ogiwara t, kimura t, tokue y, watanabe r, nara m, obuchi t, et al. tuberculosis screening using a t-cell interferon-î³ release assay in japanese medical students and non-japanese international students. tohoku j exp med. 2013 06;230(2):87–91. doi:doi:10.1620/tjem.230.87 pmid:23759899 ridzon r, kent jh, valway s, weismuller p, maxwell r, elcock m, et al. outbreak of drug-resistant tuberculosis with second-generation transmission in a high school in california. j pediatr. 1997 dec;131(6):863–8. doi:10.1016/s0022-3476(97)70034-9 pmid:9427891 ho zjm, chee cbe, ong rt, sng lh, peh wlj, cook ar, et al. investigation of a cluster of multi-drug resistant tuberculosis in a high-rise apartment block in singapore. int j infect dis. 2018 feb;67:46–51. doi:10.1016/j.ijid.2017.12.010 pmid:29253709 patient classification 2015. in: tuberculosis in japan annual report 2016. tokyo: tuberculosis surveillance centre, research institute of tuberculosis, japan anti-tuberculosis association; 2016 (http://www.jata.or.jp/rit/ekigaku/index.php/download_file/-/view/3804/, accessed 31 may 2017). epidemic intelligence needs of stakeholders in the asia–pacific region original research aurysia hii,a abrar ahmad chughtai,b tambri housen,a salanieta saketa,c mohana priya kunasekaran,b feroza sulaiman,b nk semara yantib and chandini raina macintyreb,d a national centre for epidemiology & population health, research school of population health, australian national university, australia. b school of public health and community medicine, university of new south wales, australia. c research, evidence and information programme, public health division, pacific community, new caledonia. d college of public service and community solutions, arizona state university, united states of america. correspondence to aurysia hii (email:aurysia.hii@gmail.com). to cite this article: hii a, chughtai aa, housen t, saketa a, kunasekaran mp, sulaiman f, et al. epidemic intelligence needs of stakeholders in the asia–pacific region. western pac surveill response j. 2018 dec;9(4). doi:10.5365/wpsar.2018.9.2.009 abstract objective: to understand the global outbreak surveillance needs of stakeholders involved in epidemic response in selected countries and areas in the asia–pacific region in order to inform development of an epidemic observatory, epi-watch. methods: we designed an online, semi-structured stakeholder questionnaire to collect information on global outbreak surveillance sources and limitations from participants who use epidemic intelligence and outbreak alert services in their work in government and nongovernment organizations in the asia–pacific region. results: all respondents agreed that it was important to remain up to date with global outbreaks. the main reason cited for following global outbreak news was as an early warning for serious epidemics. mainstream media and specialist internet sources such as the world health organization (n = 54/91; 59%), the program for monitoring emerging diseases (promed)-mail (n = 45/91; 49%) and the united states centers for disease control and prevention (n = 31/91; 34%) were the most common sources for global outbreak news; rapid intelligence services such as healthmap were less common (n = 9/91; 10%). only 51% (n = 46/91) of respondents thought that their sources of outbreak news were timely and sufficient for their needs. conclusion: for those who work in epidemic response, epidemic intelligence is important and widely used. stakeholders are less aware of and less frequently use rapid sources such as healthmap and rely more on validated but less timely traditional sources of disease surveillance. users identified a need for more timely and reliable epidemic intelligence. introduction emerging and re-emerging diseases are significant threats to global health security. the asia–pacific region has been the global epicentre for many emerging infectious diseases, including some with pandemic potential.1 the emergence of new diseases such as severe acute respiratory syndrome and avian influenza, the threat of diseases external to the region such as ebola, and recurring outbreaks of endemic diseases highlight the ongoing threat that infectious diseases pose to national, regional and international health security.1–4 the asia–pacific region encompasses two world health organization (who) regions: south-east asia and the western pacific, home to 3.4 billion people, or over 53% of the world’s population.5 the region is one of the most diverse areas in the world in terms of socioeconomic development, geography and geopolitical influence.5 it is also particularly vulnerable to emerging and re-emerging infectious diseases due to several factors including increased population growth and movement, urbanization, globalization, limited access to health care, changes in food trade, land degradation and encroachment on natural habitats and antimicrobial resistance.1,6,7 this rapidly changing landscape, along with weak health systems, limited health infrastructure, resource constraints (financial, human, technical), geographical isolation and poor population health, challenge countries’ abilities to adequately prevent, detect and respond to public health threats.8–11 the ability to rapidly detect and respond to infectious diseases is critical to global health security. the international health regulations, or ihr (2005), provide the legal framework to protect the international community from these threats, requiring member states to develop core capacities to detect, assess, notify and respond to public health threats and events of national and international concern.12 ihr (2005) emphasize the importance of incorporating event-based surveillance with traditional systems to detect public health risks.12 event-based surveillance is “the organized and rapid capture of information about events that are a potential risk to public health”.13 information can be reported through official or unofficial channels such as media reports, health-care workers and nongovernment organizations.14,15 while traditional indicator-based surveillance systems are essential for collecting and analysing information on known diseases, event-based surveillance systems use broad definitions to detect rare or unusual events and are more timely and sensitive.13,16,17 they are an essential tool for the rapid detection and assessment of events that could pose serious risks to public health. increased availability and reliance on the internet has driven the development and acceptance of event-based internet surveillance as a key tool and source of epidemic intelligence.17,18 this method brings together disparate sources of data from the internet to provide a comprehensive overview on the current state of global infectious disease events in near real-time for public health action.19 there are three types of event-based internet surveillance methods for rapid epidemic detection: (1) existing internet-based surveillance systems and news aggregators that use event-based reporting and syndromic surveillance; (2) search query surveillance using web-based search engines; (3) social media.20 understanding countries’ needs to detect and respond to infectious disease risks is relevant to common frameworks such as ihr (2005) and the asia pacific strategy for emerging diseases that require cost-effective surveillance tools to coordinate health security activities. there are limited studies on the epidemic intelligence needs of end-users. a review of evaluations of 11 global electronic event-based biosurveillance systems found that evaluations focused on the quantitative analysis of system performance.16 the authors recommended that future evaluations assess the usefulness of systems for public health action for end-users. stakeholder engagement in all stages of surveillance system development from planning to implementation is important to create a successful and useful system that meets end-users’ needs.16,21 as part of the development of a new epidemic observatory, epi-watch, we sought to understand the global outbreak surveillance needs of stakeholders involved in epidemic response and surveillance in australia, pacific island countries and territories (picts), indonesia and malaysia. epi-watch is an epidemic observatory currently in development by australia’s national health and medical research council’s (nhmrc) centre for research excellence, integrated systems for epidemic response (iser) that monitors and provides critical analysis of global outbreaks and epidemics of public health significance for use by policy-makers, governments and other stakeholders. the aim of this survey was to understand the global outbreak surveillance needs of stakeholders involved in epidemic response in australia, picts, indonesia and malaysia to inform the further development of epi-watch. methods a semi-structured stakeholder survey was developed and administered electronically using surveymonkey (san mateo, california, usa) between 27 june 2017 and 9 october. the survey questions pertained to respondents’ employment characteristics (organization location and type, occupation and position level) and global outbreak surveillance sources (automated outbreak alerts, reasons for following outbreak news services, types of sources and services accessed, limitations of outbreak sources, timeliness and adequacy of outbreak news sources, types of journals accessed at least once a month and preferred format to receive information). responses to questions consisted of pre-defined single and multiple choice options and a free text “other” option. the survey was piloted in june 2017 on five individuals with infectious disease experience in government and academic institutions in australia. minor changes to the survey were made following feedback to improve the consistency and clarity of questions. pilot participants were not included in the survey sample or results. the final survey was offered in english, french and bahasa indonesia. the survey questionnaire was forward-translated into french and bahasa indonesia. we invited participants to complete the survey from the following countries and areas: australia; picts (american samoa, cook islands, fiji, french polynesia, kiribati, marshall islands, new caledonia, niue, commonwealth of the northern mariana islands, samoa, tokelau, tonga, vanuatu); indonesia; and malaysia. our sample was targeted to selected countries so that results would be relevant to inform development of an epidemic intelligence system for use within the region. malaysia and indonesia were selected in particular because of ongoing, separate research on epidemic surveillance in the malay and indonesian languages. we used several methods to recruit participants. eligible participants were those who use epidemic intelligence and outbreak alert services in their work across government and nongovernmental organizations. purposive and snowball sampling methods were used to select individual participants. representatives of all picts were invited to participate through the pacific community (spc).22 in australia, participants were identified through the communicable diseases network of australia, federal and jurisdictional health department websites, an existing list of public health contacts held by the study team, colleagues and organization websites. malaysian and indonesian participants were identified through ministries of health. participants were chosen based on their role and field of employment meeting the study inclusion criteria. the survey was emailed to 108 participants from australia, 13 participants from picts, four from malaysia and three from indonesia. participants were asked to forward the survey link to relevant colleagues. three email reminders to complete the survey were sent to countries with a low response rate to meet our overall target sample size of 88. in addition to emailing eligible participants, a stakeholder workshop was organized by iser in october 2017 to explore in more depth the outbreak surveillance needs of stakeholders. workshop attendees were required to complete the survey as a prerequisite for attendance. eligible attendees at the communicable diseases control conference in melbourne, australia from 27 to 28 june 2017 were also invited to complete the survey. responses were downloaded from surveymonkey and imported into and analysed using stata-se (version 14.0, statacorp, college station, texas, usa). to calculate proportions, two denominators were used as relevant, total number of responses or respondents. to ensure confidentiality of the respondents and strengthen the analysis, employment characteristic results from picts were combined; results from malaysia and indonesia (bahasa indonesia and bahasa malaysia were considered part of a single language group, the malay language) were also grouped together. ethics ethics approvals were obtained from the following committees: university of new south wales (unsw) human ethics committee (hc17466), australian national university human research ethics committees (2017/517), malaysia medical research and ethics committee (nmrr-17–1784–37514), indonesian health research ethics committee (lb.02.01/2/ke. 328/2017), fiji national health research ethics review committee (2017.145.mc), tonga national health ethics and research committee (310817), and samoa health research committee (no reference number was allocated). the unsw ethics approval for conduct of this research was accepted by ministries of health in american samoa, cook islands, french polynesia, kiribati, marshall islands, new caledonia, niue, commonwealth of the northern mariana islands, tokelau and vanuatu. results there were 96 responses to the survey and a 96% (92/96) completion rate. of the 128 surveys emailed to participants, we received a completed response rate of 72% (92/128). five responses were excluded because respondents did not meet the study inclusion criteria, completed only the first section of the survey or selected a country from which ethics approval was not obtained, leaving 91 (95%) eligible responses. survey respondent characteristics of the 91 respondents, 55% (50/91) worked in organizations based in australia, 30% (27/91) in organizations in picts and 15% (14/91) worked in malaysia or indonesia. table 1 shows the employment characteristics of survey respondents by region. table 1. employment characteristics of survey respondents by country, 2017* click to download table 1. jpg, 696kb importance of global outbreak news all 91 respondents agreed that it was important to be up to date with global outbreaks. when asked about sources of automated global outbreak alerts (such as google alerts or program for monitoring emerging diseases [promed]-mail updates), 60% (55/91) reported receiving automated alerts, 18% (16/91) followed outbreak news as required, 15% (14/91) sometimes received automated alerts and 7% (6/91) never got alerts. the most common reasons for following outbreak news were as an early warning for serious epidemics (91% [83/91]); to inform health system planning, preparedness and response (68% [62/91]); and to inform local surveillance needs (65% [59/91]) (table 2). table 2. reasons for following global outbreak news, 2017*† click to download table 2. jpg, 333kb global outbreak news sources fig. 1 shows the proportion of global outbreak information services used by respondents at least once a month. who outbreaks23 was used by 59% (54/91) of respondents and promed-mail24 by 49% (45/91). fig. 1. global outbreak news services used by respondents at least once a month, 2017*† click to download figure 1. jpg, 482kb other relevant services listed included outbreak news today25 (6), global public health intelligence network (gphin)26 (5), epicore27 (4), epi-watch28 (4), global incident map29 (3) and un dispatch30 (2). in the free text option, the international biosecurity intelligence system (25% [2/8]) and the european centre for disease prevention and control (ecdc) weekly reports and threat assessments (13% [1/8]) were also mentioned. when asked about other global outbreak news sources, 64% (58/91) of respondents used mainstream media and internet sources that target health professionals, 49% (45/91) relied on colleagues and 44% (40/91) on health practitioners (table 3). official sources such as national ihr focal points (29% [5/17]), the who event information site (24% [4/17]), ecdc (24% [4/17]), the united states centers for disease control and prevention (uscdc) (18% [3/17]) and networks such as pacific public health surveillance network (18% [3/17]) were reported as other sources used by respondents in the free text option. respondents were asked which journals they used at least once a month to access information on global outbreaks and infectious diseases. multiple responses were allowed. thirty-seven per cent (34/91) used the uscdc’s morbidity and mortality report, 35% (32/91) used the bulletin of the world health organization, 24% (22/91) used the western pacific surveillance and response journal, 23% (21/91) used the australian department of health’s communicable diseases intelligence journal and 20% (18/91) used ecdc’s eurosurveillance journal. twenty-seven of 91 (30%) respondents did not use any of the journals from the options provided. table 3. reported timeliness and sufficiency of global outbreak news sources, 2017* click to download table 3. jpg, 499kb limitations of global outbreak news just over half of respondents, 51% (46/91), thought their usual sources of global outbreak news were timely enough for their needs, 20% (18/91) did not find their sources timely and 29% (26/91) were unsure. fifty-one per cent (46/91) of respondents thought that their usual sources of global outbreak news were sufficient enough for their needs. twenty-four per cent (22/91) found their sources were insufficient, and an equal proportion were unsure. one respondent (1/91) reported that timeliness and sufficiency were not personally relevant. the timeliness and sufficiency of outbreak news sources were cross-tabulated by respondent’s usual sources of global infectious disease outbreak news (table 3). sixty-two per cent (36/58) of respondents thought that specialist internet sources such as event-based internet surveillance systems were timely enough for their needs, and 55% (32/58) found these sources sufficient (table 3). when asked about the limitations of global outbreak news sources, 42% (38/91) of respondents reported that there was not enough critical appraisal, and 40% (36/91) did not have enough time to read/watch or listen to information. thirty-two per cent (29/91) of respondents identified that there was not enough information, 30% (27/91) that the sources were not timely enough, and 26% (24/91) that there were too many different sources and did not know which one was best. twelve per cent (11/91) reported other reasons, such as a delay in or no reporting of events at the country level and lack of local relevance. nine per cent (8/91) reported no limitations in their sources. multiple responses were allowed for this question. preferred format to receive global outbreak news respondents overwhelmingly preferred email as a mechanism to receive global outbreak news. eighty-seven per cent (79/91) of respondents selected this option; 7% (6/91) of respondents preferred websites; 3% (3/91) chose a weekly video presentation; and one each opted for the use of short message service (sms), social media and other formats. this question did not allow for multiple responses, and feedback from some respondents indicated that they may have had several preferred methods for receiving information, depending on the nature of the outbreak. a final question asked respondents to provide any other feedback. answers included needing information for different purposes such as preparation of emergency plans, border health control and advice to traveller consultations; a need to better inform health officials for preparedness, planning and response; and a need for systematized unified surveillance. discussion our survey provides insight into the epidemic intelligence needs of a diverse range of stakeholders from across the asia–pacific region. there was consensus that timely and easily accessible global outbreak notifications are essential to plan for and respond to public health risks. respondents’ professional needs are consistent with the key attributes of successful event-based surveillance systems: to be simple, flexible, timely and sensitive.15 with automated alerts being the predominant information-seeking strategy employed by respondents, internet-based services that provide this function can support the rapid and timely identification of events to limit the spread and severity of disease outbreaks.31 a limitation of event-based surveillance systems is that new information is not necessarily disseminated efficiently.32 while healthmap33 is a rapid intelligence source, it was only used by 10% of participants, possibly reflecting low awareness of this resource. consumers preferred global outbreak alert systems be flexible in the way information is accessed and disseminated. email was identified by respondents as the preferred communication method to receive global outbreak news; however, these needs may change depending on the context of the outbreak and over time (reflecting generational change in the use of communication technology); systems should consider a range of media such as sms and social media. communication technologies such as social media can be harnessed for rapid access and dissemination of information to support emergency preparedness and response.34 the use of mainstream media and specialist internet sources for global outbreak news is not surprising given the increased accessibility and reliance on the internet for information and acceptability of event-based internet surveillance systems. approximately 65% of initial reports to who about infectious disease events come from informal sources such as the internet.35 a 2017 systematic review of event-based internet biosurveillance systems identified 50 systems, 37 of which were online and fully functioning at the time.36 many of these systems use mainstream media as a key source of information.17,36 the finding that the same proportion of respondents used both mainstream media and specialist internet sources for global outbreak news suggests that internet-based services are not meeting end-users’ needs, and other media sources are required to supplement information leading to duplication of effort. timeliness of global outbreak news sources was a limitation identified by 51% of survey respondents. one study explored end-users’ perceptions of the attributes of seven publicly available event-based internet surveillance systems and found that timeliness scores ranged from 33% to 100%.15 official sources such as who outbreaks23 and the cdc’s current outbreak list37 were more commonly used by respondents over other services such as healthmap33 but are less timely. previous studies have documented significant delays in official reporting of outbreaks compared to unofficial reports.38,39 research has identified that the majority of event-based internet surveillance systems are generated from north america and europe; few local systems in the asia–pacific region and event-based surveillance systems in general are not well understood in developed and developing countries.32,36 increased awareness of the availability and operability of systems providing timely, relevant and reliable information to professionals in the region could address some of these concerns. unofficial reports are key sources of information for internet-based systems, but they can be subject to noise and false alerts, potentially causing unnecessary investigation or alert fatigue among responders.18 our findings suggest that reliability and accuracy are important considerations in the choice of global outbreak surveillance sources; however, many respondents were unable to identify the best sources to use. who outbreaks23 and promed-mail24 were the most commonly accessed sources by many respondents. promed-mail is qualitative, but it uses human moderators to review alerts for relevance and accuracy before dissemination, increasing the reliability of reports.40 a service that can provide critical appraisal, including risk assessment within the broader context of the region, could address the need for more reliable information and help facilitate countries’ abilities to assess risks and inform decision-making for the response required. this study had several limitations. due to the cross-sectional online survey design, we were unable to monitor trends in responses/behaviour over time, and findings may not be representative because of the snapshot nature of the timing of the survey and possible non-response bias. as we were interested in stakeholder views at a point in time, this design was appropriate. the online nature of the survey meant that questions could not be explored in-depth; however, a free text option was provided for most questions. limited access to the internet and computers in remote and resource-constrained areas could have affected the response rate. compared to positing surveys, this was the most feasible option, and with some of the most remote picts participating, we do not believe access was a major barrier. the study employed purposive sampling instead of probability sampling because of the small and highly specialized pool of eligible participants. while this approach ensured participation of professionals from a wide range of backgrounds and levels who use epidemic intelligence, it can create researcher bias because of the judgmental nature of sample selection. epidemic response is a small and specialized field, so the sample frame from which we could draw was small, making purposive sampling the most appropriate. limited inclusion of other large asian countries, differences in participant selection across countries and low numbers of respondents meant that results could not be compared between countries and may not be generalizable to other countries or representative of the whole asia–pacific region. finally, survey versions in languages other than english were not back-translated, which may have affected the quality of these responses. as 11% (n = 10) of respondents completed the survey in a language other than english, translation inaccuracies are unlikely to have any impact on the overall validity of the survey. further research on language-specific needs for epidemic surveillance is warranted. conclusion for those who work in epidemic response, epidemic intelligence is important and widely used. the choice of sources for global outbreak news varies, and there is less use and awareness of rapid sources such as healthmap and more reliance on less timely, traditional sources such as who and public news media. we identified a need for more timely and reliable epidemic intelligence in the asia–pacific region. more effective and efficient sources and methods to deliver user-friendly intelligence to end-users should be explored. there are several global outbreak surveillance systems available; development of a new system should take into consideration how it can integrate into and add value to already established systems within the region. conflicts of interest the authors declare no conflicts of interest. funding this study was funded by the national health and medical research council centre for research excellence, integrated systems for epidemic response app1107393. acknowledgements we would like to acknowledge the support of dr jerico pardosi (university of new south wales), dr elizabeth kpozehouen (kirby institute) and mr dillon adams (kirby institute) for their contribution to this study. we also thank and acknowledge ministries of health from all participating countries for their support and agreement to participate and all respondents for taking the time to complete this survey. references health in asia and the pacific. manila: who regional office for the western pacific and new delhi: who regional office for south-east asia; 2008 (http://www.wpro.who.int/health_information_evidence/documents/health_in_asia_pacific.pdf). heymann dl, rodier g. global surveillance, national surveillance, and sars. emerg infect dis. 2004 feb;10(2):173–5. doi:10.3201/eid1002.031038 pmid:15040346 asia pacific strategy for emerging diseases and public health emergencies. manila: who regional office for the western pacific; 2016. lederberg j, davis jr. emerging infectious diseases from the global to the local perspective: workshop summary. washington, dc: national academies press; 2001. securing our region’s health: the asia pacific strategy for emerging diseases. manila: who regional office for the western pacific and new delhi: who regional office for south-east asia; 2010 (http://iris.wpro.who.int/handle/10665.1/6757?locale-attribute=fr). coker rj, hunter bm, rudge jw, liverani m, hanvoravongchai p. emerging infectious diseases in southeast asia: regional challenges to control. lancet. 2011 feb 12;377(9765):599–609. doi:10.1016/s0140-6736(10)62004-1 pmid:21269678 morand s, jittapalapong s, suputtamongkol y, abdullah mt, huan tb. infectious diseases and their outbreaks in asia–pacific: biodiversity and its regulation loss matter. plos one. 2014 feb 25;9(2):e90032. doi:10.1371/journal.pone.0090032 pmid:24587201 castillo-salgado c. trends and directions of global public health surveillance. epidemiol rev. 2010;32(1):93–109. doi:10.1093/epirev/mxq008 pmid:20534776 hitchcock p, chamberlain a, van wagoner m, inglesby tv, o’toole t. challenges to global surveillance and response to infectious disease outbreaks of international importance. biosecur bioterror. 2007 sep;5(3):206–27. doi:10.1089/bsp.2007.0041 pmid:17903090 craig at, kama m, samo m, vaai s, matanaicake j, joshua c, et al. early warning epidemic surveillance in the pacific island nations: an evaluation of the pacific syndromic surveillance system. trop med int health. 2016 jul;21(7):917–27. doi:10.1111/tmi.12711 pmid:27118150 health for development strategy 2015-2020. canberra: department of foreign affairs and trade; 2015 (https://dfat.gov.au/about-us/publications/documents/health-for-development-strategy-2015-2020.pdf). international health regulations (2005). geneva: world health organization; 2016 (https://www.who.int/ihr/publications/9789241580496/en/). a guide to establishing event-based surveillance. manila: who regional office for the western pacific; 2008 (http://www.wpro.who.int/emerging_diseases/documents/docs/eventbasedsurv.pdf). early detection, assessment and response to acute public health events. geneva: world health organization; 2014 (https://www.who.int/ihr/publications/who_hse_gcr_lyo_2014.4/en/). barboza p, vaillant l, mawudeku a, nelson np, hartley dm, madoff lc, et al.; early alerting reporting project of the global health security initiative. evaluation of epidemic intelligence systems integrated in the early alerting and reporting project for the detection of a/h5n1 influenza events. plos one. 2013;8(3):e57252. doi:10.1371/journal.pone.0057252 pmid:23472077 gajewski kn, peterson ae, chitale ra, pavlin ja, russell kl, chretien j-p. a review of evaluations of electronic event-based biosurveillance systems. plos one. 2014 oct 20;9(10):e111222. doi:10.1371/journal.pone.0111222 pmid:25329886 yan sj, chughtai aa, macintyre cr. utility and potential of rapid epidemic intelligence from internet-based sources. int j infect dis. 2017 oct;63:77–87. doi:10.1016/j.ijid.2017.07.020 pmid:28765076 keller m, blench m, tolentino h, freifeld cc, mandl kd, mawudeku a, et al. use of unstructured event-based reports for global infectious disease surveillance. emerg infect dis. 2009 may;15(5):689–95. doi:10.3201/eid1505.081114 pmid:19402953 chunara r, freifeld cc, brownstein js. new technologies for reporting real-time emergent infections. parasitology. 2012 dec;139(14):1843–51. doi:10.1017/s0031182012000923 pmid:22894823 guo p, wang l, zhang y, luo g, zhang y, deng c, et al. can internet search queries be used for dengue fever surveillance in china? int j infect dis. 2017 oct;63:74–6. doi:10.1016/j.ijid.2017.08.001 pmid:28797591 groseclose sl, buckeridge dl. public health surveillance systems: recent advances in their use and evaluation. annu rev public health. 2017 mar 20;38(1):57–79. doi:10.1146/annurev-publhealth-031816-044348 pmid:27992726 the pacific community [website]. noumea: pacific community; 2018 (https://www.spc.int/). disease outbreak news geneva [website]. geneva: world health organization; 2018 (http://www.who.int/csr/don/en/). promed international society for infectious diseases [website]. brookline, ma: international society for infectious diseases; 2010 (https://www.promedmail.org/). outbreak news today florida [website]. tampa, fl: the global dispatch, inc.; 2018 (http://outbreaknewstoday.com/). global public health intelligence network [website]. ottawa: public health agency of canada; 2018 (https://gphin.canada.ca/cepr/listarticles.jsp?language=en_ca). epicore [website]. san francisco, ca: ending pandemics; ashburn, ct: healthmap; brookline, ma: promed-mail; decatur, ga: tephinet; 2018 (https://epicore.org/#/home). epi-watch [website]. sydney: university of new south wales; 2018 (https://sphcm.med.unsw.edu.au/centres-units/centre-research-excellence-epidemic-response/epi-watch). global incident map [website]. chicago: globalincidentmap.com; 2018 (http://www.globalincidentmap.com/). un dispatch [website]. denver, co: un dispatch; 2018 (https://www.undispatch.com/). wilson k, brownstein js. early detection of disease outbreaks using the internet. cmaj. 2009 apr 14;180(8):829–31. doi:10.1503/cmaj.1090215 pmid:19364791 velasco e, agheneza t, denecke k, kirchner g, eckmanns t. social media and internet-based data in global systems for public health surveillance: a systematic review. milbank q. 2014 mar;92(1):7–33. doi:10.1111/1468-0009.12038 pmid:24597553 healthmap [website]. boston, ma: boston children’s hospital; 2018 (http://www.healthmap.org/en/). houston jb, hawthorne j, perreault mf, park eh, goldstein hode m, halliwell mr, et al. social media and disasters: a functional framework for social media use in disaster planning, response, and research. disasters. 2015 jan;39(1):1–22. doi:10.1111/disa.12092 pmid:25243593 heymann dl, rodier gr. hot spots in a wired world: who surveillance of emerging and re-emerging infectious diseases. lancet infect dis. 2001 dec 1;1(5):345–53. o’shea j. digital disease detection: a systematic review of event-based internet biosurveillance systems. int j med inform. 2017 may;101:15–22. doi:10.1016/j.ijmedinf.2017.01.019 pmid:28347443 cdc current outbreak list. atlanta, ga: united states centers for disease control and prevention; 2018 (https://www.cdc.gov/outbreaks/index.html). chan eh, brewer tf, madoff lc, pollack mp, sonricker al, keller m, et al. global capacity for emerging infectious disease detection. proc natl acad sci usa. 2010 dec 14;107(50):21701–6. doi:10.1073/pnas.1006219107 pmid:21115835 mondor l, brownstein js, chan e, madoff lc, pollack mp, buckeridge dl, et al. timeliness of nongovernmental versus governmental global outbreak communications. emerg infect dis. 2012 jul;18(7):1184–7. doi:10.3201/eid1807.120249 pmid:22709741 carrion m, madoff lc. promed-mail: 22 years of digital surveillance of emerging infectious diseases. int health. 2017 may 1;9(3):177–83. doi:10.1093/inthealth/ihx014 pmid:28582558 pulmonary tuberculosis and non-recent immigrants in japan – some issues for post-entry interventions surveillance report lisa kawatsu,a kazuhiro uchimura,a akihiro ohkadoa,b and seiya katoc a department of epidemiology and clinical research, the research institute of tuberculosis, japan anti-tuberculosis association, japan. b nagasaki university graduate school of biomedical sciences, nagasaki, japan. c the research institute of tuberculosis, japan anti-tuberculosis association, japan. correspondence to lisa kawatsu (email:mailto:kawatsu@jata.or.jp). to cite this article: kawatsu l, uchimura k, ohkado a, kato s. pulmonary tuberculosis and non-recent immigrants in japan – some issues for post-entry interventions. western pac surveill response j. 2017 may;8(4). doi:10.5365/wpsar.2017.8.3.003 abstract foreign-born persons are considered one of the high-risk populations for tuberculosis (tb), and numerous studies have discussed the potential role of pre-entry tb screening for immigrants. however, rates of tb disease among immigrants can remain high several years after entry. in japan, approximately 50% of tb among foreign-born persons occurs among those who have entered japan more than five years before being diagnosed, i.e. non-recent immigrants. however, little attention has been paid so far to the issue of tb control among the non-recent immigrants. a detailed analysis of the japan tuberculosis surveillance data was therefore conducted to describe the characteristics of tb among non-recent immigrants and discuss policy implications in terms of post-entry interventions in japan. the main findings were as follows: 1) the proportion of pulmonary tb cases aged 65 years and older was higher among non-recent than recent immigrants (9.8% vs 1.2%); 2) the proportion of those with social risk factors including homelessness and and being on social welfare assistance was higher among non-recent than recent immigrants; and 3) the proportion of those detected via routine screening at school or workplace was significantly lower among non-recent immigrants aged between 25 and 64 than among recent immigrants in the same age group (15.4% vs 28.7%). our results suggested the need to increase the opportunities for and simultaneously improve the take-up rate of community-based screening for non-recent immigrants. background the proportion of tuberculosis (tb) borne by foreign-born persons, especially in low-incidence countries, has been increasing.1 several of these countries have adopted screening programmes for immigrants that may take place either before entering the destination country, at entry or post entry.1 the effectiveness of these programmes has been discussed elsewhere;2 however, rates of tb disease among immigrants can remain high several years after entry,3,4 and return and repeated visits to their country of origin may be a significant risk factor for immigrants as well.5,6 post-entry intervention is, therefore, also potentially important in considering tb control among foreign-born populations. japan is a tb medium-burden country with a notification rate of 14.4 per 100 000 population in 2015.7 although the proportion of foreign-born persons among the total cases is relatively small compared to similarly industrialized countries, between 2005 and 2014, it steadily increased by approximately 1.7 times (from 3.5% to 5.8%) and among those aged 20 to 29 by 2.5 times (from 17.8% to 44.1%).7 it has also been estimated that the tb notification rate per 100 000 population among foreign-born persons increased from 40.7 in 2007 to 56.2 in 2016, in contrast to the decreasing notification rate among the general population.8 furthermore, data from the japan tb surveillance (jtbs) indicate that approximately 50% of tb among foreign-born persons occurs among those who entered japan more than five years before being diagnosed.9 although discussions have begun regarding the possible impact of pre-entry tb screening if it were introduced in japan, little attention has been paid so far to the issue of tb control among these non-recent immigrants. our objective, therefore, was to describe and analyse the characteristics of tb among non-recent immigrants compared with recent immigrants who had entered japan within five years of being diagnosed and to discuss policy implications in terms of post-entry interventions in japan. japan tuberculosis surveillance japan introduced the first nationwide computerized tb surveillance system, the jtbs, in 1987. tb is a notifiable disease, and public health centres (phcs) are responsible for collecting and entering the data of notified patients to the system. the data are summarized every month and annually and are made available online. mechanisms to ensure data quality include the system's automatic verification programme as well as regular meetings attended by local staff from hospitals and phcs. periodic refresher trainings on data entry are also provided to phc staff across the nation.9 data regarding the nationality of patients (either japanese or non-japanese) were added to the jtbs in 1998. the country name and the timing of entry (either within five years, more than five years or unknown) were added in 2007. in 2012, the category of nationality was changed to country of birth (either japan-born or foreign-born); for the foreign-born persons, the name of the country and the year of entry are simultaneously collected. methods we conducted a cross-sectional study whereby aggregated cohort data of pulmonary tb (ptb) cases newly notified to the jtbs between 1 january 2007 and 31 december 2014 were analysed. a tb case was defined as either a person whose biological specimen was positive by smear, culture or other examinations or a person without bacteriological confirmation but active tb was diagnosed by a clinician. a ptb case includes both those exclusively with pulmonary or bronchial infection and those with concomitant extrapulmonary disease. immigrants were defined as either those patients whose nationality has been recorded as non-japanese before 2012 or those whose county of birth was foreign-born after 2012. those whose nationality or country of birth was recorded as unknown were excluded from the analysis (n = 3830, 2007–2014). non-recent immigrants were defined as those who had entered japan more than five years before being diagnosed or whose timing of entry was unknown; recent immigrants were those who had entered japan within five years of being diagnosed. characteristics of ptb among non-recent immigrants were analysed and compared with the recent immigrants in terms of sex, age groups, countries of birth, job categories, modes of case detection and treatment outcomes. standardized death rates were calculated using the japanese population of 1985 as reference. χ2 tests or fisher's exact tests were conducted to compare proportions, and bonferrni correction was applied for multiple comparisons. r version 3.1.3 (r development core team, vienna, austria) was used for all statistical analyses. ethics ethical clearance was deemed not necessary, as the electronic jtbs data do not include case identifiers per the ethical guidelines for epidemiological research established by the ministry of education, culture, sports, science and technology and ministry of health, labour and welfare of japan. results general characteristics between 2007 and 2014, a cumulative total of 6211 foreign-born ptb cases were notified; 46.8% (n = 2908) were non-recent and 53.2% (n = 3303) were recent immigrants. general characteristics of the two groups are summarized in table 1. the age distribution was significantly different with a higher proportion of those aged 65 and above among the non-recent than among the recent immigrants (9.8% versus 1.2%). the proportion of females among the non-recent immigrants was significantly greater than that among the recent immigrants (58.0% versus 49.9%, p < 0.001). the overall distribution of cases by country of birth was also significantly different. furthermore, looking at the country of birth by age groups, the recent immigrants from the people's republic of china (china) and the philippines combined contributed approximately 50% of all recent immigrants for all age groups; among the non-recent immigrants, the proportion of those from the republic of korea increased with increasing age group. among those aged 65 and above, those from the republic of korea and china contributed approximately 66% of the non-recent immigrants (fig. 1). table 1. general characteristics of non-recent and recent immigrants with pulmonary tb, newly notified, 2007–2014 click to download table 1. jpg, 525kb fig. 1. countries of birth among non-recent and recent immigrants with pulmonary tb, newly notified, by age groups, 2007–2014 click to download figure 1. jpg, 319kb job categories of those aged between 25 and 64 years old were also compared. there was a significant difference in the overall distribution of job categories with a higher proportion of those with no regular income, i.e. unemployed and homemaker, and a lower proportion of high-school, university and college students among the non-recent compared with the recent immigrants (33.0% vs 22.0%, 6.1% vs 21.7%) (table 1). case detection of ptb among non-recent immigrants table 2 summarizes the modes of detection of non-recent immigrants with ptb compared with that of recent immigrants among the working-age group (aged 25 to 64) and the elderly (aged 65 and above). in the working-age group, there was a significant difference in the overall distribution of the modes of detection with the proportion of those with tb symptoms detected at medical institutions (64.7% vs 56.2%, p < 0.001, with bonferroni correction) and via health checks as outpatients or inpatients for other diseases (7.6% vs 2.3%, p < 0.001, with bonferroni correction) significantly greater; those detected via routine screening, either at workplace or school, were significantly smaller (15.4% vs 28.7%, p < 0.001, with bonferroni correction) among non-recent than recent immigrants. the odds ratios of non-recent migrants being detected at medical institutions with tb symptoms and via health checks were 1.48 and 3.50, respectively, while the odds ratio of being detected via routine screening was 0.45. no significant difference in the distribution of modes of case detection between non-recent and recent immigrants was observed among those age 65 and above. table 2. modes of detection among non-recent and recent immigrants with pulmonary tb, newly notified, by age group, 2007–2014 click to download table 2. jpg, 420kb social risk factors of ptb among non-recent immigrants table 3 summarizes the social risk factors besides unemployment of non-recent immigrants with ptb compared with that of recent immigrants among the working-age group and the elderly. the proportions of those with a history of homelessness (2.1% vs 0.9%, p = 0.02) and those receiving social welfare benefits (8.2% vs 1.3%, p < 0.001) were significantly greater among non-recent than recent immigrants with ptb; the same tendency was observed for both age categories. table 3. social risk factors of non-recent and recent immigrants with pulmonary tb, newly notified, 2007–2014 click to download table 3. jpg, 310kb treatment outcome of ptb among non-recent immigrants table 4 summarizes the treatment outcomes at the end of 12 months of non-recent immigrants with ptb compared with those of recent immigrants. the proportion of those who had died was significantly higher among the non-recent immigrants (3.2% vs 0.3%, p < 0.001, with bonferroni correction); after adjusting for age, the standardized mortality rate ratio was 2.3. table 4. treatment outcomes of non-recent and recent immigrants with pulmonary tb, newly notified, 2007–2014 click to download table 4. jpg, 261kb discussion two distinctive issues in tb among the non-recent immigrants were identified in our study: a larger proportion of those aged 65 and above and a smaller proportion of those being detected via routine school and workplace screening among those aged between 25 and 64. for the first issue, a significantly greater proportion of non-recent than recent immigrants were aged 65 and above (9.8% vs 1.2%), 66% of whom were from the republic of korea and china. several studies have raised the issue of poor socioeconomic and health status of older foreign-born residents in japan, especially those from asia, including higher smoking and drinking rates.10,11 it has also been suggested that higher morbidity and mortality among the older foreign-born residents may to a certain extent be attributable to long years of poor working and living conditions in japan.11 we also found the proportion of those with social risk factors, such as a history of homelessness and those receiving social welfare benefits, were significantly higher among non-recent than recent immigrants. among those aged 65 and above, the difference was even more evident with the proportion of those with a homeless history being 4.2% and 0.0% and of those receiving social welfare benefits being 26.3% and 2.6% among the non-recent and recent immigrants, respectively. these socioeconomic factors have been reported to be associated with poor treatment outcomes, including death and prolonged treatment.12 the second issue concerned the proportion of those detected via routine screening at school or workplace, which was significantly smaller among non-recent than recent immigrants aged between 25 and 64 (15.4% vs 28.7%). in japan, under the infectious diseases control law, routine tb screening is mandatory for school students, teachers and employees of selected institutions including hospitals, social welfare facilities and nursing homes for the elderly. for full-time employees aged 40 and above in other industries, chest x-rays are included in the annual workplace health check per the industrial safety and health law. from the job categories of the jtbs, it is reasonable to assume that that full-time workers; health-care professionals; and high-school, university and college students are eligible for those routine screening. according to our results, of the 2194 non-recent immigrants aged between 25 and 64, the proportion of those who belonged to these job categories was lower at 44.2% (969/2194) as compared with 58.7% (1025/1745) among the recent immigrants. on the other hand, screening opportunities for working-age immigrants who are unemployed, self-employed or homeworkers, including 36% (790/2194) of non-recent immigrants aged between 25 and 64, are limited to ad hoc tb screening campaigns organized by local authorities and nongovernmental organizations for the general community and some specifically targeting foreign residents. although reports are limited, the take-up of community-based screenings by foreign residents appears to be low due to various barriers including language, geographical distance, lack of information and economic difficulties.13 analysis of the tb surveillance data indicates that the proportion of sputum smear-positive ptb cases detected via routine screening has constantly been smaller than that of those detected in hospitals while being hospitalized for other diseases or while seeing a doctor for other diseases (25.6% vs 62.1% in 2015).14 another study has similarly reported smaller proportions of positive sputum smears and cavity disease among those patients with professions that are more likely to be detected via routine workplace screening.15 this suggests the possibility that non-recent immigrants, who have fewer opportunities for routine school and workplace screening, are more likely to be detected with a progressed disease and thereby are at a higher risk of infecting others. increasing the opportunities for and improving the take-up rate of community-based screenings for non-recent immigrants may not only contribute to early detection of tb, prevention of secondary infection and better treatment outcome but also may provide improved general health, especially for the elderly immigrants. further studies are needed to assess the cost–effectiveness of possible different routine screening programmes for those who are not eligible for workplace and school-based screenings. limitations the study is not without limitations. first, as this was a cross-sectional study in design, we merely compared the characteristics between non-recent and recent immigrants, and we could not determine whether the status of being a non-recent immigrant was a risk factor for tb. second, the timing of entry was only dichotomized in our analysis – within five years and more than five years. this was due to the fact that the year of entry was collected only after 2012; before that, the timing of entry to japan had only been collected as within five years, more than five years or year of entry unknown. as we had placed a greater emphasis on increasing the number of cases for analysis, the study period was set from 2007. nonetheless, a recently published report suggests that of the non-recent immigrants approximately 40% entered between five and nine years and 60% more than 10 years before being diagnosed with tb.8 third, the general tb screening policy has undergone some changes in the recent years – for example, since 2010, a chest x-ray is no longer mandatory in the annual routine workplace screening for those aged 40 and below. the extent to which such a change affects the epidemiology of foreign-born tb remains to be investigated. conclusions the demographic and socioeconomic background of pulmonary tb among non-recent immigrants are distinctively different from that of recent immigrants. the former, being more integrated into the japanese society, may be more invisible and hard to reach than recent immigrants. despite being integrated, they often fail to benefit from tb programmes targeting the obvious foreign-born population in japan such as workplace and school-based tb screening. an integrated approach, including a community-based comprehensive health check, may be necessary as part of the greater effort to control tb among the foreign-born population in japan. conflicts of interest none declared. funding this research was partially funded by the research program on emerging and re-emerging infectious diseases from japan agency for medical research and development (no.17fk0108304h0003). acknowledgements none. references aldridge rw, yates ta, zenner d, white pj, abubakar i, hayward ac. pre-entry screening programmes for tuberculosis in migrants to low-incidence countries: a systematic review and meta-analysis. lancet infect dis. 2014 dec;14(12):1240–9. pmid:25455991 doi:10.1016/s1473-3099(14)70966-1 klinkenberg e, manissero d, semenza jc, verver s. migrant tuberculosis screening in the eu/eea: yield, coverage and limitations. eur respir j. 2009 nov;34(5):1180–9. pmid:19880618 doi:10.1183/09031936.00038009 tuberculosis in england 2016 report. london: tuberculosis section, centre for infectious disease surveillance and control, national infection service, public health england; 2016 (https://www.gov.uk/government/publications/tuberculosis-in-england-annual-report, accessed 8 august 2016). toms c, stapledon r, waring j, douglas p. tuberculosis notifications in australia, 2012 and 2013. commun dis intell. 2014;38:e356–68. pmid:26234258 kik sv, mensen m, beltman m, gijsberts m, van ameijden ej, cobelens fg, et al. risk of travelling to the country of origin for tuberculosis among immigrants living in a low-incidence country. int j tuberc lung dis. 2011 jan;15(1):38–43. pmid:21276294 ormerod lp, green rm, gray s. are there still effects on indian subcontinent ethnic tuberculosis of return visits?: a longitudinal study 1978-97. j infect. 2001 aug;43(2):132–4. pmid:11676520 doi:10.1053/jinf.2001.0872 kawatsu l, uchimura k, izumi k, ohkado a, ishikawa n. profile of tuberculosis among the foreign-born population in japan, 2007-2014. west pac surveill response. 2016 06 15;7(2):7–16. pmid:27508086 doi:10.5365/wpsar.2016.7.1.008 tuberculosis in japan – annual report 2017. tokyo: department of epidemiology and clinical research, the research institute of tuberculosis; 2017 (http://www.jata.or.jp/rit/ekigaku/en/statistics-of-tb/, accessed 17 november 2017). tuberculosis in japan – annual report 2016. tokyo: tuberculosis surveillance center, department of epidemiology and clinical research, the research institute of tuberculosis; 2016 (http://www.jata.or.jp/rit/ekigaku/en, accessed 8 august 2016). lee k, lee s, nakamura y. zainichi korean no jinko koreika to shibou no doukou [aging and mortality trend among zainichi koreans in japan]. journal of health and welfare statistics. 2012;59:27–32 [in japanese]. yan sz, aoike a, kawai k, ubukata t, morinaga k, oshima a. [a socio-medical study of adult diseases related to life style–comparison of foreigners living in japan and japanese]. nihon koshu eisei zasshi. 1990 aug;37(8):603–9 [in japanese]. pmid:2132388 waitt cj, squire sb. a systematic review of risk factors for death in adults during and after tuberculosis treatment. int j tuberc lung dis. 2011 jul;15(7):871–85. pmid:21496360 doi:10.5588/ijtld.10.0352 morimoto y, tomita s, takayanagi k, sawada t, ma o, shiota d, et al. activities to improve access to annual health checkups for foreign residents of shinjuku, who are linguistic minorities. journal of japan association for international health. 2016;31:241. statistics of tb 2016. tokyo: japan anti-tuberculosis association; 2016. tuberculosis surveillance center, rit, jata. [tuberculosis annual report 2009–series 5. case findings]. kekkaku. 2011 sep;86(9):787–91 [in japanese]. pmid:22111387 hospital preparedness for ebola virus disease: a training course in the philippines original research celia carlos,a rowena capistrano,a charissa fay tobora,a mari rose delos reyes,a socorro lupisan,a aura corpuz,b charito aumentado,b lyndon lee suy,c julie hall,b julian donald,b megan counahan,b melanie s curless,d wendy rhymer,e melanie gavin,d chelsea lynch,d meredith a black,d albert d anduyon,a petra buttnerf and rick spearef,g a research institute for tropical medicine, alabang, philippines. b office of the who representative in the philippines, manila, philippines. c national center for disease prevention and control, department of health, manila, philippines. d johns hopkins hospital, hospital epidemiology and infection control, baltimore, maryland, united states of america. e consultant, winnipeg, manitoba, canada. f tropical health solutions pty ltd, townsville, australia. g college of public health, medical and veterinary sciences, james cook university, townsville, australia. correspondence to rick speare (e-mail: rickspeare@gmail.com). to cite this article: carlos c et al. hospital preparedness for ebola virus disease: a training course in the philippines. western pacific surveillance and response journal, 2015, 6(1):33–43. doi:10.5365/wpsar.2014.5.4.008 abstract objective: to develop, teach and evaluate a training workshop that could rapidly prepare large numbers of health professionals working in hospitals in the philippines to detect and safely manage ebola virus disease (evd). the strategy was to train teams (each usually with five members) of key health professionals from public, private and local government hospitals across the philippines who could then guide ebola preparedness in their hospitals. methods: the workshop was developed collaboratively by the philippine department of health and the country office of the world health organization. it was evaluated using a preand post-workshop test and two evaluation forms. chi-square tests and linear regression analyses were conducted comparing preand post-workshop test results. results: a three-day workshop was developed and used to train 364 doctors, nurses and medical technologists from 78 hospitals across the philippines in three initial batches. knowledge about evd increased significantly (p p = 0.018) with 96% of participants feeling more prepared to safely manage evd cases. discussion: the three-day workshop to prepare hospital staff for evd was effective at increasing the level of knowledge about evd and the level of confidence in managing evd safely. this workshop could be adapted for use as baseline training in evd in other developing countries to prepare large numbers of hospital staff to rapidly detect, isolate and safely manage evd cases. introduction the west african ebola virus disease (evd) outbreak was declared a public health emergency of international concern (pheic) by the world health organization (who) on 8 august 2014.1 this outbreak is unprecedented with ongoing transmission in guinea, liberia and sierra leone and secondary localized outbreaks in mali, nigeria, spain and the united states of america. although estimates vary, the case fatality rate (cfr) is high in the three west african countries with ongoing transmission: cumulative cfr for the outbreak on 24 december 2014 was 70% for cases with a recorded definitive outcome; 58–60% for hospitalized patients; and 55% (359/649) for health-care workers (hcws).2 using the total figures for guinea, liberia and sierra leone gives a cumulative cfr of 39% (7574/19 463) for all probable and confirmed cases, an underestimate of cfr since the fate of apparently more than 2000 cases are unknown.2 this evd outbreak was the third pheic to be declared under the international health regulations (2005) (ihr). ihr is a legal framework that directs and governs its signatories’ activities, aiming to protect the global community from public health risks and emergencies that cross international borders.3 at its core is the obligation for countries to develop, strengthen and maintain public health capacities for surveillance and response to be able to detect, assess, notify and report events and respond to a pheic.3 the west african evd outbreak is considered such a threat to global security that for the first time the united nations general assembly, supported by the united nations security council, mandated a united nations mission for ebola emergency response for a public health event.4 in 2013 the philippines had 2.295 million formally registered overseas filipino workers (ofw).5 of these, 1700 (6 it is traditional for ofw to return to the philippines in high numbers at christmas time.7 the philippine department of health (doh) is experienced with the management of outbreaks and has a relatively robust surveillance system with a history of managing imported emerging and re-emerging infectious diseases.8–10 it was against this backdrop of the risk of global transmission and returning ofw that the doh asked the who country office in the philippines for assistance in designing and implementing a training workshop to prepare government and private health practitioners in the management of evd. countries unaffected by evd, such as the philippines, are required to prepare for the introduction of cases. even if no evd cases occur, symptomatic travellers from west africa who meet the case definition of suspected evd have to be managed according to the same protocols until they are confirmed as evd negative.11 although briefings for health care workers (hcws) in ebola treatment centres have been published,12–14 we were unable to locate a course designed to prepare clinicians for imported evd in developing country settings. the goal of the training was to increase capacity to rapidly detect, isolate and safely care for evd cases within the philippine health system, both public and private. the aims of the workshop were for participants to be able to provide safer care for patients with evd and to prevent disease transmission in the health-care and community settings. the strategy was to train teams (each usually with five members) of key health professionals from public, private and local government hospitals across the philippines who could then guide ebola preparedness in their hospitals. the focus was on hospitals since it is highly likely that, if evd occurs in the philippines, patients will be identified and managed in hospitals. although the doh has appointed some hospitals to be evd referral hospitals, the initial presentation of cases could occur at any hospital. to ensure that participants followed official guidelines, the workshop was based on the doh’s interim guidelines for the prevention and management of ebola virus disease (26 august 2014). the aim of this paper is to describe the training programme and its evaluation. methods setting the curriculum and content were developed collaboratively by the research institute for tropical medicine (ritm, the doh research institute for infectious diseases), the who country office and consultants employed by who as private individuals or from johns hopkins hospital and tropical health solutions. ritm, located in metropolitan manila, has a large training centre and staff experienced in running workshops. training laboratories were available for practical sessions, and ritm’s infection control team (experienced with sars and other emerging infectious diseases) played a major role. workshops each workshop extended over three days and consisted of 18 lectures and 10 practical or small group sessions, including three practical sessions to don (put on) and doff (take off) personal protective equipment (ppe) (table 1).15 everyone participated in at least two ppe sessions. at registration, every participant was given one set of ppe (apart from rubber boots) for personal use during the workshop. the ppe sessions were conducted in large groups numbering from 50 to 120 (figure 1). ppe donning and doffing skills were first demonstrated to the whole group, which was then divided into two groups for demonstration and practice. rigid donning and doffing protocols were followed and overseen by participants acting as trained observers supervised by course facilitators. in the final ppe session, red water-based paint was applied to the ppe to simulate contamination by body fluids, adding a sense of realism to the doffing process (figure 2). table 1. structure of workshop on hospital management of evd* click to download table 1. jpg, 548kb * modules and guide are available at http://www.wpro.who.int/philippines/mediacentre/features/ebolatraining_materials/en/. doh, department of health; evd, ebola virus disease; ppe, personal protective equipment; uv, ultraviolet rays; who, world health organization. figure 1. donning and doffing ppe during the philippine doh ebola preparedness workshop* click to download figure 1. jpg, 905kb source: photo taken by the research institute for tropical disease photographer. * each health-care provider worked with a trained observer. facilitators supervised groups of participants. tape on the floor helped simulate workflow by identifying low and high risk areas. figure 2. water-based red paint has been applied to a participant’s ppe to simulate extensive contamination by blood* click to download figure 2. jpg, 608kb source: photo taken by rick speare. * gloves, gown and the clear, disposable apron are contaminated. a specialized series of three lectures and a practical session were run separately for medical technologists (table 1). in the philippines, medical technologists have a bachelor of science in medical technology and are equivalent to laboratory scientists in other countries. the medical technologists’ sessions included opportunities to practise venepuncture and use laboratory equipment while wearing evd ppe. at the closing session on day 3, the director of ritm and the who representative or their delegates gave closing speeches and presented certificates of participation. participants since the doh wished to rapidly and extensively distribute evd knowledge and skills, three initial workshops were held from 28 october to 13 november 2014 with large numbers of participants in each. hospitals selected by the doh from each province were asked to send a team of five including at least one doctor, one nurse and one medical technologist. batches 1, 2 and 3 had 127, 115 and 122 participants, respectively, from 78 hospitals (21 regional hospitals, 22 private hospitals and 35 local government hospitals). the training programme for each batch of trainees was modified as new evidence was reported in the literature or online by the centers for disease control and prevention (cdc) and who.16,17 evaluation three tools were used to evaluate the workshop: a preand post-workshop test, two evaluation forms post-workshop and one minute reflections (omr)18 on days 1 and 2. the test was developed by who consultants and piloted on ritm medical and nursing staff; the ritm evaluation form is used routinely for all workshops, and the evd-specific evaluation form was a modification of the johns hopkins hospital form used for evd training workshops. all questionnaires were anonymous. effect of the workshop on knowledge was tested using a preand post-workshop test administered on day 1 before the lectures commenced and on day 3 before the final practical session on ppe. knowledge was assessed by 10 questions. confidence in being able to manage evd was assessed on a five-point likert scale (strongly disagree, disagree, neither disagree or agree, agree and strongly agree) in response to the statement: “i am confident that i can be safe when caring for a patient with ebola virus disease.” the answers were summarized and presented to the participants before the closing session on day 3. at the end of activities on days 1 and 2 participants were asked to complete the omr which asked two questions: (1) what was the most useful, meaningful or intriguing thing/s that you learnt during this day? and (2) what question/s remains uppermost in your mind as we end this day? the responses from the omr were addressed in the first sessions on days 2 and 3. statistical analysis preand post-workshop test: if a response to one of the 10 knowledge questions was missing, it was set to being incorrect. the number of missing values per question ranged between 0 and 4 for the pre-workshop test and between 0 and 6 for the post-workshop test. the 10 knowledge questions were recoded to 0 for “incorrect” and 1 for “correct” and added up to get the overall number of correct answers. this outcome variable was logarithmically transformed to achieve approximate normal distribution for the linear regression analysis. preand post-workshop participants were analysed as unpaired data because questionnaires could not be linked. categorical characteristics are described using absolute and relative frequencies. age was described using mean value and standard deviation. the number of correct answers given to the 10 knowledge questions was described using median value and inter-quartile range (iqr). confidence intervals of 95% were calculated for correct answers to knowledge questions; preand post-workshop test results were compared using chi-square tests. the overall logarithmically transformed number of correct answers preand post-training were compared using linear regression. linear regression analysis was conducted to analyse whether profession, age and gender showed independent effects on the logarithmically transformed number of correct answers post-workshop. profession and gender were dummy coded for this analysis, while age was initially considered, continuous and was then categorized using the quartiles and dummy coded. chi-square tests were used to assess effects of age, gender and profession on level of confidence dealing with an ebola case post-workshop. all analysis was adjusted for the cluster effect of the three workshops. analysis was conducted using stata, release 12.1 (statacorp lp, college station, texas). since this was an operational evaluation and findings were progressively used to improve the workshop, ethics approval was not sought. results participants a total of 285 participants (78.3% of all participants) and 364 participants (100% of all participants) completed the preand post-workshop tests, respectively. for the preand post-workshop tests, respectively, participants were doctors (33.3% and 35.0%), nurses (42.9% and 40.0%), medical technologists (20.3% and 20.1%) and others (3.4% and 4.5%). participants who completed the preand post-training participants were predominantly female (59.6% and 61.9%, respectively) and mean ages and ranges were the same at 38.2 (21 to 62 years). improvement in knowledge of the 10 knowledge questions, three were correctly answered by more than 90% of pre-workshop test participant (no skin exposed in evd ppe, evd waste handled differently, no embalming with evd) (table 2). for the other seven questions, pre-workshop knowledge was poor (table 2). table 2. percentage and 95% confidence interval of correct responses to 10 knowledge questions preand post-workshop* click to download table 2. jpg, 640kb * correct answers in parenthesis. † 95% confidence intervals are cluster-adjusted. ‡ p-values are results of cluster-adjusted chi-square tests. the percentage of participants who correctly answered all 10 questions was 2.8% (8 of 285) and 22.5% (82 to 364) preand post-workshop, respectively. the number of questions correctly answered by participants rose from a pre-workshop median of seven (iqr = 6 to 8; range 3 to 10) to a post-workshop median of nine (iqr = 8 to 9; range 4 to 10)(p figure 3). figure 3. percentage of knowledge questions correctly answered preand post-workshop click to download figure 3. jpg, 202kb profession (nurse p = 0.775, medical technologist p = 0.431, other p = 0.335, doctor = reference group), age (30–39 years p = 0.271; 40–44 years p = 0.273; ≥ 45 years p = 0.728; reference p = 0.071) showed no significant independent effects on the number of correct answers post-workshop (table 3). table 3. associations between number of correct responses and level of confidence post-workshop and age, gender and profession click to download table 3. jpg, 411kb * p-values are results of a linear regression model for post-workshop outcome including profession, age and gender as independent variables. † p-values are results of chi-square tests. p-values are adjusted for cluster-effect. iqr, inter-quartile range. improvement in confidence participants’ level of confidence in safely caring for an evd patient rose markedly by the end of the workshop (p = 0.018). pre-workshop, 27.3% disagreed or strongly disagreed with the statement: “i am confident that i can be safe when caring for a patient with ebola virus disease,” while post-training this percentage fell to 2.6% (p = 0.018). on the other hand, pre-workshop, 32.5% of participants agreed or strongly agreed with the statement; post-training this percentage had risen to 87.2%. the post-workshop level of confidence was not influenced by age (p = 0.412), gender (p = 0.404) or profession (p = 0.458) (table 3). evaluations ratings in both evaluation forms were at the high end of a five-point likert scale (tables 4 and 5). the overall rating for the workshop was excellent (72.2%), good (26.7%), fair (0.6%) and poor (0%) (table 4). to the question “do you feel you are more prepared to screen for and manage patients with ebola?” 96.4% of participants answered “yes” (table 5). table 4. evaluation of the evd workshop using the general ritm form (n = 328) click to download table 4. jpg, 143kb table 5. ratings on evd-specific evaluation form (n = 333) click to download table 5. jpg, 523kb the omr provided a useful means of addressing questions that were left unanswered after days 1 and 2. these questions fell mainly into two areas: knowledge and support. the former category consisted largely of questions about the disease. the latter category included detailed questions about how things would be done if an evd case occurred; where the specialized items of ppe could be obtained; funding for preparedness; and the roles of institutions, doh and other government bodies. questions on knowledge were answered by lecturers and ritm staff. on the last day, the director of the emerging infectious disease control programme was on hand to answer operational questions. his attendance was very important because the policy situation is dynamic and evolving. discussion this three day workshop on hospital preparedness for evd raised knowledge and increased the confidence of participants. two areas of knowledge that were not as well understood that soap and water is effective for hand hygiene in evd and the transmission of ebola virus. the change in the former is understandable since during the practical sessions alcohol-based hand rubs were used for hand hygiene practice and to decontaminate gloves between doffing steps. soap and water is recommended by who for hand hygiene for evd if alcohol-based hand rubs are unavailable and as the preferred method if hands are visibly soiled.19 however, in many resource-limited settings sinks may not be available at point of care or may not have adequate soap or hand drying materials.20 this has been identified as a current problem in liberian hospitals.21,22 in the workshop, emphasizing the indications for soap and water may have increased the correct answers. epidemiological studies in african communities have shown that direct contact with a symptomatic case of evd is required for transmission.23–25 interestingly, although an early study showed no transmission in the community without direct contact, one of the primary cases acquired evd while visiting the local hospital in sudan with no identified contact with a hospitalized evd case.23 conveying how evd transmits in the health care setting remains a difficult issue.26,27 when two nurses in the usa acquired evd while wearing ppe with no apparent breaches in protocol,28 standards of ppe for evd were upgraded by both cdc and who.16,17 in hospitals and evd isolation units the concept of “direct transmission” is confusing when it also includes transmission by needlestick, droplets and splashes and when aerosol transmission associated with clinical procedures (i.e. intubation) must be regarded as a risk.26 although the correct answers for the question on transmission increased, it remained unacceptably low at 59.1%. we need to develop a new approach for conveying the complexities of transmission routes in the health-care setting. the increase in level of confidence was verified by the preand post-workshop test and by two questions in the evd-specific evaluation form. improvement in the knowledge of participants, particularly in the practice of proper donning and doffing of ppe, could have contributed to this. in the omr, participants often mentioned ppe as the most useful thing learnt. this workshop appeared to be effective in providing baseline training to raise awareness in large numbers of hcws. screening and triage procedures were emphasized in lectures and reinforced by a practical session using the doh screening and triage forms on six cases, illustrating the importance of a detailed travel, contact and illness history in the non-ebola setting. failure to screen and triage patients in the hospital setting in liberia has led to infection of hcws.21,29 screening and triage are essential strategies to rapidly detect evd patients in countries not affected by evd and to prevent transmission. we could find no specific guidelines for training hcws in non-ebola countries to be prepared to manage evd. the approach we used trained teams of key health professionals from hospitals across the philippines in the basics with the aim that they would train others when they returned home. in developed countries the focus appears to be on major hospitals, some designated for high consequence pathogens such as ebola, to do intensive preparatory training.30–32 the former approach may be more suitable in countries with limited resources. in these settings, non-specialized clinicians will be expected to participate in the management of evd patients. providing basic training for large groups of hcws may best protect the majority of hcws. once a case of evd is identified, more intensive training can be provided to those hcws managing the case to quickly build on the basic knowledge and skills. although knowledge may not always be retained over time, brief educational intervention of eight hours duration for disaster preparedness was proven to be effective and to have a long-term impact on nurses’ knowledge.33 limitations include use of the same test preand post-workshop, meaning increases in knowledge may be testrather than disease-specific; and the 27.7% increase in responses for the post-workshop test which may breach the assumption that the preand post-workshop populations were the same. however, the professional, age and gender compositions of the samples were similar. although the context of the training was specific to the philippines, the workshop could be adapted to other countries by substituting the philippine doh interim guidelines for evd with each country’s own guidelines and omitting the lecture on ebola reston since this species of ebola virus is endemic only in the philippines and china.34,35 mention of ebola reston in the background lecture on ebola would be adequate for other developing countries. conclusions the three-day workshop developed by the philippine doh to prepare hospital staff for evd was effective at increasing the level of knowledge about evd and the level of confidence in managing evd safely. in an ebola outbreak, additional specialized training in use of ppe would be needed for those caring for evd patients in hospital to reinforce the baseline training. this workshop could be adapted for use in other developing countries preparing their hospital staff to rapidly detect, isolate and safely manage evd cases. conflicts of interest none declared. funding development and evaluation of the workshop and employment of who consultants (speare, rhymer, curless, lynch, gavin and black) was funded by the department for international development. philippine doh provided funds to conduct the workshop. all staff of ritm, doh and who were funded by their respective employers under routine funding. acknowledgement we thank a large number of staff of ritm for logistic support in developing and conducting workshops and the it staff of ritm in particular for assistance in entering data from evaluation forms. references: statement on the first meeting of the ihr emergency committee on the 2014 ebola outbreak in west africa. geneva, world health organization, 8 august 2014. available from: http://www.who.int/mediacentre/news/statements/2014/ebola-20140808/en/ [accessed 25 november 2014]. ebola response roadmap situation report 24 december 2014. geneva, world health organization, 2014. available from: http://apps.who.int/iris/bitstream/ 10665/146311/1/roadmapsitrep_24dec14_eng.pdf?ua=1 [accessed 30 december 2014]. international health regulations (2005) second edition. geneva, world health organization, 2008. available from: http://whqlibdoc.who.int/publications/ 2008/9789241580410_eng.pdf [accessed 24 november 2014]. resolution adopted by the general assembly on 19 september: 69/1. measures to contain and combat the recent ebola outbreak in west africa. new york, united nations general assembly, 2014. available from: http://www.un.org/en/ga/ search/view_doc.asp?symbol=a/res/69/1 [accessed 25 november 2014]. statistical tables on overseas filipino workers (ofw): 2013. manila, national statistics office, 2014. available from: http://census.gov.ph/content/statistical tables-overseas-filipino-workers-ofw-2013 [accessed 25 november 2014]. stock estimate of filipinos overseas as of december 2012. manila, commission on filipinos overseas, 2013. available from: http://cfo.gov.ph/images/stories/pdf/ stockestimate2012.pdf [accessed 26 november 2014]. anonymous. overseas filipino workers. manila, wikipilipinas, 2008. available from: http://en.wikipilipinas.org/index.php/overseas_filipino_workers [accessed 21 december 2014]. pamaran rr et al. epidemiological characterization of influenza a(h1n1)pdm09 cases from 2009 to 2010 in baguio city, the philippines. plos one, 2013, 11;8(11):e79916. doi:10.1371/journal.pone.0079916 pmid:24244578 anonymous. sars outbreak in the philippines. weekly epidemiological record, 2003, 78:189–192. pmid:12836452 corpuz a, banatin ca. surveillance in post extreme emergencies and disasters (speed). early warning alert and response network humanitarian emergency conference, geneva, 17–19 march 2014. ebola and marburg virus disease epidemics: preparedness, alert, control, and evaluation interim version 1.1. geneva, world health organization, 2014. available from: http://www.who.int/csr/disease/ebola/pace_outbreaks_ebola_marburg_en.pdf [accessed 26 november 2014]. med box. ebola toolbox. wursburg, department of humanitarian collaboration medical missions institute, advisory organization for international health. available from: http://www.medbox.org/ebola-training-material/listing [accessed 20 november 2014]. ebola ebriefing. barcelona, médecins sans frontières, 2014. available from: http://ecampus.msf.org/moodlemsf/mod/page/view.php?id=22246 [accessed 26 november 2014]. 2014 west africa ebola virus disease outbreak briefing pack: foreign medical teams international response. geneva, world health organization, 2014: p. 24. available from: http://ecampus.msf.org/moodlemsf/pluginfile.php/30615/block_html/ content/who%20briefing%20foreign%20medical%20teams.pdf [accessed 26 november 2014]. training on hospital management of ebola virus disease (evd). manila, world health organization regional office for the western pacific, 2014. available from: http://www.wpro.who.int/philippines/mediacentre/features/ebolatraining_materials/en/ [accessed 5 january 2015]. guidance on personal protective equipment to be used by healthcare workers during management of patients with ebola virus disease in u.s. hospitals, including procedures for putting on (donning) and removing (doffing). atlanta, centers for disease control and prevention, 2014. available from: http://www.cdc.gov/vhf/ebola/hcp/procedures-for-ppe.html [accessed 27 november 2014]. who updates personal protective equipment guidelines for ebola response. geneva, world health organization, 2014. available from: http://www.who.int/mediacentre/ news/releases/2014/ebola-ppe-guidelines/en/ [accessed 27 november 2014]. redman-maclaren ml et al. research workshop to research work: initial steps in establishing health research systems on malaita, solomon islands. health research policy and systems/biomed central, 2010, 8:33. doi:10.1186/1478-4505-8-33 pmid:21034512 guideline on hand hygiene in health care in the context of filovirus disease outbreak response. geneva, world health organization, 2014. available from: http://apps.who.int/iris/bitstream/10665/144578/1/who_his_sds_ 2014.15_eng.pdf?ua=1 [accessed 5 december 2014]. devnani m et al. a survey of hand-washing facilities in the outpatient department of a tertiary care teaching hospital in india. journal of infection in developing countries, 2011, 5:114–118. doi:10.3855/jidc.1003 pmid:21389590 matanock a et al. ebola virus disease cases among health care workers not working in ebola treatment units liberia, june-august, 2014. morbidity and mortality weekly report, 2014, 63:1077–1081. pmid:25412067 kilmarx ph et al. ebola virus disease in health care workers sierra leone, 2014. morbidity and mortality weekly report, 2014, 63:1168–1171. pmid:25503921 baron rc, mccormick jb, zubeir oa. ebola virus disease in southern sudan: hospital dissemination and intrafamilial spread. bulletin of the world health organization, 1983, 61:997–1003. pmid:6370486 dowell sf et al. transmission of ebola hemorrhagic fever: a study of risk factors in family members, kikwit, democratic republic of the congo, 1995. commission de lutte contre les epidémies à kikwit. the journal of infectious diseases, 1999, 179 suppl 1;s87–91. doi:10.1086/514284 pmid:9988169 review of human-to-human transmission of ebola virus. atlanta, centers for disease control and prevention, 2014. available from: http://www.cdc.gov/vhf/ebola/ transmission/human-transmission.html [accessed 2 november 2014]. jones rm, brosseau lm. ebola virus transmission via contact and aerosol – a new paradigm. center for infectious disease research and policy, 2014. available from: http://www.cidrap.umn.edu/news-perspective/2014/11/commentary-ebola-virus-transmission-contact-and-aerosol-new-paradigm [accessed 20 november 2014]. brisseau lm, jones rm. health workers need optimal respiratory protection for ebola. center for infectious disease research and policy, 2014. available from: http://www.cidrap.umn.edu/news-perspective/2014/09/commentary-health-workers-need-optimal-respiratory-protection-ebola [ accessed 5 november 2014]. chevalier ms et al. ebola virus disease cluster in the united states dallas county, texas, 2014. morbidity and mortality weekly report, 2014, 63:1087–1088. pmid:25412069 forrester jd et al.; centers for disease control and prevention (cdc). cluster of ebola cases among liberian and u.s. health care workers in an ebola treatment unit and adjacent hospital – liberia, 2014. morbidity and mortality weekly report, 2014, 63:925–929. pmid:25321070 bannister b, prygodzicz a, ippolito g; etide working group. training health care workers to face highly infectious diseases. clinical microbiology and infection, 2009, 15:740–742. doi:10.1111/j.1469-0691.2009.02872.x pmid:19486076 anonymous. hospitals prepare plans, drill staff to ensure that potential ebola patients are identified, isolated, and managed safely. ed magazine, 2014, 26:138–141. ashino y et al. ebola virus disease: preparedness in japan. disaster medicine and public health preparedness, 2014, 1–5. epub ahead of print. doi:10.1017/dmp.2014.130 pmid:25399765 pesiridis t et al. development, implementation and evaluation of a disaster training programme for nurses: a switching replications randomized controlled trial. nurse education in practice, 2014, pii: s1471–5953(14)00016-x. epub ahead of print. doi:10.1016/j.nepr.2014.02.001 pmid:24560740 miranda me, miranda nlj. reston ebolavirus in humans and animals in the philippines: a review. the journal of infectious diseases, 2011, 204 suppl 3;s757–760. doi:10.1093/infdis/jir296 pmid:21987747 pan y et al. reston virus in domestic pigs in china. archives of virology, 2014, 159:1129–1132. doi:10.1007/s00705-012-1477-6 pmid:22996641 https://ojs.wpro.who.int/ 1wpsar vol 12, no 1, 2020 | doi: 10.5365/wpsar.2020.11.4.004 lessons from the field problem v anuatu, in the south pacific, comprises 83 islands with a total population of around 307 000. as of 1 august 2020, it was one of the few countries with no confirmed cases of coronavirus disease 2019 (covid-19),1 mainly due to international border restriction measures implemented from late january 2020 and full border closure from 23 march 2020. a state of emergency (soe) was declared on 26 march 20202 to strengthen prevention and containment measures in response to the covid-19 global pandemic (fig. 1). the soe was extended to include tropical cyclone harold, which struck vanuatu on 6–7 april 2020,3 and was subsequently extended to 31 december 2020.4 many vanuatu citizens and residents travel or reside overseas, particularly under seasonal work programmes in australia and new zealand, or for study in fiji and new caledonia. as the global covid-19 pandemic affected work and study abroad, many of these expressed interest in being repatriated to vanuatu. context the government of vanuatu undertook bilateral negotiations to ensure the safe and timely return of priority citizens and residents. phase 1 of the operations (may–july 2020) aimed to ensure that priority repatriation and quarantine were completed ahead of the celebrations for the 40th anniversary of independence (23–31 july 2020). phase 2 of the operations started after these celebrations. a vanuatu ministry of health, port-vila, vanuatu. b vanuatu country liaison office, world health organization, port-vila, vanuatu. c vanuatu health program, port-vila, vanuatu. d school of population and global health, the university of melbourne, melbourne, australia. e burnet institute, melbourne, australia. published: 10 march 2021 doi: 10.5365/wpsar.2020.11.4.004 international borders to vanuatu closed on 23 march 2020 due to the global covid-19 pandemic. in may–july 2020, the government of vanuatu focused on the safe and timely return of citizens and residents while ensuring vanuatu remained covid-19 free. under phase 1 of repatriation, between 27 may and 23 june 2020, 1522 people arrived in the capital, port vila, and were placed in compulsory government-mandated 14-day quarantine in 15 hotels. pre-arrival health operations included collection of repatriate information, quarantine facility assessments, training for personnel supporting the process, and tabletop and functional exercises with live scenario simulations. during quarantine, health monitoring, mental health assessments and psychosocial support were provided. all repatriates completed 14 days of quarantine. one person developed symptoms consistent with covid-19 during quarantine but tested negative. overall health operations were considered a success despite logistical and resource challenges. lessons learnt were documented during a health sector after-action review held on 22 july 2020. key recommendations for improvement were to obtain timely receipt of repatriate information before travel, limit the number of repatriates received and avoid the mixing of “travel cohorts”, ensure sufficient human resources are available to support operations while maintaining other essential services, establish a command and control structure for health operations, develop training packages and deliver them to all personnel supporting operations, and coordinate better with other sectors to ensure health aspects are considered. these recommendations were applied to further improve health operations for subsequent repatriation and quarantine, with phase 2 commencing on 1 august 2020. lessons from covid-19-free vanuatu: intensive health operations for phase 1 of repatriation and quarantine, may–july 2020 posikai samuel tapo,a tessa b knox,b caroline van gemert-doyle,c,d,e obed manwo,a edna iavro,a wendy williams,a rosaria maurice,a griffith harrison,b matthew cornish,c michael benjamin,c vincent atua,a jimmy obed,a geoff clark,c philippe guyant,b basil leodorob and len tarivondaa correspondence to tessa bellamy knox (knoxt@who.int) wpsar vol 12, no 1, 2020 | doi: 10.5365/wpsar.2020.11.4.004 https://ojs.wpro.who.int/2 tapo et alvanuatu health operations for quarantine, may–july 2020 31 december 2019 cluster of pneumonia cases reported in wuhan, china 2020 7 january novel coronavirus (sars-cov-2) identified as the causative agent 25 january first confirmed case in the pacific (australia) 30 january who declares covid-19 a public health emergency of international concern (pheic) 1 march first covid-19 death in the pacific (australia) 8 march 100 countries with confirmed cases 11 march who characterizes covid-19 as a global pandemic 17 march 200 countries with confirmed cases 20 march 10 000 deaths worldwide 26 march first covid-19 death in picts* (guam) 4 april 1 million confirmed cases worldwide 157 cases in picts 12 april 100 000 covid -19 deaths worldwide 17 april 2 million confirmed cases worldwide 28/29 april 3 million confirmed cases worldwide 200 000 deaths worldwide 11 may 4 million confirmed cases worldwide 16 may 300 000 covid-19 deaths worldwide 1 june 6 million confirmed cases worldwide 293 cases in picts 30 june 10 million confirmed cases worldwide 500 000 covid-19 deaths worldwide 397 cases and 7 deaths in picts 23 july 15 million confirmed cases worldwide 619 000 covid-19 deaths worldwide 503 cases and 7 deaths in picts 20 january national coronavirus taskforce formed government of vanuatu starts to implement border restrictions 24 january preparedness and response plan developed first press release issued 5 february national health cluster activated surveillance enhanced border restrictions progressively increased march national health incident management team formed: intensive planning, community outreach, surveillance, communications and mass media 119 hotline and moh website set up provincial eocs activated 22 march first suspected case tests negative 23 march international borders close 26 march state of emergency declared for 2 weeks 1 april 10 000 persons reached with community outreach activities 6-7 april tropical cyclone harold (category 5) strikes vanuatu and causes widespread damage 11 april state of emergency extended for 30 days for covid-19 and tropical cyclone harold 20 april 5000 calls to 119 hotline 100 000 hits on moh webpages 1 may health technical advisory group formed 25 may local sars-cov-2 testing established 27 may phase i of repatriation of citizens/residents started 19–23 june over 1200 repatriates arrived 8 july all phase i repatriates out of quarantine 23–30 july mass celebrations for 40th anniversary of independence covid-19 prevention and preparedness continues global & pacific region vanuatu eoc: emergency operations centre; moh: ministry of health; pict: pacific island country or territory; who: world health organization. fig. 1. timeline of the covid-19 pandemic globally, in the pacific and in vanuatu and beyond, 31 december 2019 to 30 july 2020 wpsar vol 12, no 1, 2020 | doi: 10.5365/wpsar.2020.11.4.004https://ojs.wpro.who.int/ 3 vanuatu health operations for quarantine, may–july 2020tapo et al temperature and symptom checks, added a considerable burden to the public health system. the aar therefore recommended that, for phase 2, human resource requirements to support operations should be clearly mapped out and options should be identified for surge capacity (e.g. those working in provincial offices, retired staff or new recruits), with opportunities provided for upskilling. the aar strongly recommended limiting the number of arriving repatriates and those in quarantine to a manageable number, based on staff numbers and availability of quarantine facilities. during phase 1, separate daily meetings were held at both the moh and shefa community health services, during which staff provided updates on operations, identified or were notified about current health issues, and determined the actions required. the aar highlighted the need to strengthen coordination of health operations between the moh and provincial health offices, to avoid replication and undue burden on managers, and to ensure joint daily briefings, debriefings and production of consolidated situation reports. tabletop and functional exercises with live scenario simulation exercises were conducted with national and provincial staff throughout phase 1, in parallel with ongoing repatriation operations. they covered arrival, transfer from airport to quarantine facilitiess and registration – lessons learnt were fed back for continuous improvement. pre-arrival preparations in phase 1, the moh requested repatriate information (e.g. age, sex, health issues, medical conditions and required medication) from foreign missions in advance of travel, but little information was provided. this constrained preparatory work by the health operations team (e.g. pre-arrival quarantine facility allocations). the aar recommended that the moh develop an electronic system to collect repatriate information 72 hours before travel to enable moh assessment of epidemiological risk and health approval before travel; preparation for quarantine, including pre-allocation to quarantine facilities based on health and medical needs; and systematic registration and tracking of all arriving repatriates. the aar also highlighted the need to strengthen coordination with the other agencies involved in repatriaactions between 27 may and 23 june 2020, 1522 returning citizens and residents arrived through the phase 1 repatriation operation. fourteen flights were received in the capital, port vila, from solomon islands (1), fiji (1), the philippines (1), new zealand (8), new caledonia (1) and australia (2), with 11 of these flights arriving between 19 and 23 june 2020. in accordance with the vanuatu public health act [cap. 234],5 mandatory quarantine in governmentdesignated hotel facilities was instituted for all arriving repatriates. quarantine was for a 14-day period, based on technical recommendations from the vanuatu health technical advisory group6 and the incubation period of severe acute respiratory syndrome coronavirus 2 (sarscov-2). the health operation activities are summarized in table 1 and fig. 2. twenty people involved in phase 1 of the health operations from the ministry of health (moh) and development partner organizations participated in an afteraction review (aar), held on 22 july 2020. the aar was facilitated by the world health organization (who) vanuatu country liaison office, with five observers (who staff and senior moh staff) and three rapporteurs. this report presents the main observations and lessons learnt from phase 1. main observations and lessons learnt coordination and staffing the health operations team comprised staff from the moh and development partner organizations, with existing staff repositioned or additional personnel contracted to meet critical gaps. a total of 34 provincial public health staff (public health officers, nurses and medical officers) were involved in daily monitoring across the 15 government-designated quarantine facilities, with staff redeployed from other services. the team was highly motivated to support the quarantine process during phase 1, and continual improvements were made. however, the rapid influx of repatriates over a 5-day period, and the requirement to register and then monitor each person daily with in-person wpsar vol 12, no 1, 2020 | doi: 10.5365/wpsar.2020.11.4.004 https://ojs.wpro.who.int/4 tapo et alvanuatu health operations for quarantine, may–july 2020 table 1. purpose and description of health operation activities for phase 1 of repatriation and quarantine in vanuatu, may–july 2020 stage/activity purpose coordination and staffing operations coordination to ensure coordination and communication across teams involved in health operations through daily meetings, debriefings and situation reports. pre-arrival preparations quarantine facility assessments to ensure quarantine facilities selected meet minimum moh/who standards to support compliance while maintaining good health and well-being of repatriates. quarantine facility training and information to educate managers and staff on quarantine sops, including appropriate use of ppe. other training to educate others supporting the repatriation and quarantine process (border security, police, drivers and others) on general covid-19 information and quarantine sops. tabletop and live scenario simulations to replicate processes to identify potential issues and areas for improvement, including pre-arrival, transfer from airport to quarantine facilities and registration. procurement and issuance of ppe to provide ppe (gloves, masks, gowns, eye protection and hand sanitizer) to those who require it, in accordance with moh guidance. before departure from origin information to repatriates to enable appropriate preparation for travel and quarantine. information to moh to inform health operations team preparations based on passenger information (age, pre-existing health issues or medical conditions, and medication requirements). pre-boarding screening to collect (through a passenger health declaration form) travel history and ensure repatriates are fit to travel. upon arrival at the airport in vanuatu information to repatriates at border to provide further educational information, including through videos screened in the arrival hall. health screening to check for signs or symptoms of covid-19 and review information on passenger health declaration forms before transferring them to quarantine facilities. assigning to quarantine facilities to ensure all those who may require specialized medical or health support can access it. luggage and transportation logistics to support smooth operations and ensure the comfort of repatriates (including access to required medication). check-in to quarantine facilities quarantine order to provide medical authorization for placing persons in quarantine through quarantine admission letters. quarantine facility registration to collect health and other information to enable admission to quarantine, including through interviews and forms used for subsequent daily health assessments and health clearance. orientation briefing to provide repatriates with additional information to support the quarantine process, including advisories from health, hotel and security staff. during quarantine daily health screening to rapidly detect any covid-19 symptoms (including fevers through measurement of temperature) or other medical issues throughout the quarantine period. other health and medical support to provide repatriates with any additional support needed for health and well-being, with a 24/7 nurse and doctor on roster. evaluation of possible covid-19 cases to ensure the detection of covid-19 cases by testing repatriates who fulfilled the who case definition (or others in exceptional circumstances). psychosocial surveys and support to detect or assess any mental health or other issues to provide timely support, through surveys including an adapted kessler psychological distress scale on days 3 and 7 of quarantine. other support to provide further support to children or others in quarantine with additional needs (e.g. providing activity packs for children and other services such as currency exchange). incident reports and health risk assessments to facilitate rapid reporting of any incidents and inform follow-up or mitigating actions through a standard online incident log system and health risk assessment process. quarantine discharge health clearance letters to provide medical authorization for discharge from quarantine following 14 days of monitoring, with clearance by a medical officer. pre-discharge debriefing to provide final health and other information to repatriates before their departure from quarantine. moh: ministry of health; ppe: personal protective equipment; sop: standard operating procedure; who: world health organization. wpsar vol 12, no 1, 2020 | doi: 10.5365/wpsar.2020.11.4.004https://ojs.wpro.who.int/ 5 vanuatu health operations for quarantine, may–july 2020tapo et al before departure from origin information on the process, requirements and restrictions for quarantine was provided to repatriates in a pre-travel information note issued by the director of public health, enabling repatriates to adequately prepare mentally and logistically for quarantine. however, surveys conducted during quarantine indicated that not all repatriates received adequate information before departure, and people were frustrated, mainly due to unclear or conflicting information on access to tobacco and alcohol products, and kava. the information was provided primarily through vanuatu overseas missions, which may not have received accurate information and which were not available in some countries from which people travelled. the aar therefore recommended that consistent pre-travel information be issued to repatriates well in advance of travel, to clearly communicate quarantine rationale, processes and restrictions, and consequences of non-compliance. upon arrival at the airport in vanuatu quarantine admission letters were issued by the director of public health, in line with the public health act.5 in phase 1, arriving repatriates completed a paper passenger health declaration form, providing information on travel or contact history, signs and symptoms of covid-19 or any other health issues or conditions. completed forms were evaluated by shefa community health services to determine whether repatriates required specialized quarantine conditions, although the criteria for such exceptions were unclear. feedback from the health operations team highlighted the lack of a clear tion planning and execution, such as the department of foreign affairs and the national disaster management office (ndmo). in phase 1, the moh developed selection criteria to guide the identification of suitable quarantine facilities. criteria included status of services (running water, hot water, electricity, phone, internet and television) and spacing between beds, potential to open windows for airflow, pathways around the quarantine facility, and outdoor space available for movement and exercise, accessibility to emergency or other medical care, and logistics for daily monitoring. however, the selection of facilities was led by the ndmo rather than the moh. the aar recommended that the moh define clear selection criteria for quarantine facilities and decide which facilities would be appropriate for phase 2. to minimize costs, one to six people were allocated to a room in phase 1, with people from different travel origins sometimes housed together, which the moh identified as an elevated transmission risk. the aar therefore recommended that, for phase 2, no more than two people should share a room, and “travel cohorts” should be maintained by allocating people from a particular travel origin and plane to a single quarantine facility (unless access to specialized medical care was needed). the issues identified with quarantine facility selection and room allocation highlighted the importance of multisectoral coordination, and the need for the moh to actively engage with the ndmo, to enable appropriate planning and operations that consider health risk factors, logistics and cost. quarantine facility assessments sops + training ppe issuance simulations pre-travel information arrival health briefing arrival health screening quarantine order (public health act) assigning and transport to quarantine facility registration quarantine facility health briefing daily health monitoring provision of other medical + health support evaluation of possible cases (+ testing) psychosocial assessments + support pre-arrival preparations arrival & quarantine admission 14-day quarantine fig. 2. overview of health operation activities for phase 1 of repatriation and quarantine in vanuatu, may–july 2020 ppe: personal protective equipment; qf: quarantine facility; sop: standard operating procedure. wpsar vol 12, no 1, 2020 | doi: 10.5365/wpsar.2020.11.4.004 https://ojs.wpro.who.int/6 tapo et alvanuatu health operations for quarantine, may–july 2020 individuals showed signs of moderate or severe distress. at some facilities, there was dissatisfaction with the amount of time allocated for exercise or physical activity, or with special dietary requirements (e.g. food allergies or religion) not being adequately met. almost all (99%) repatriates felt safe during quarantine and 92% knew who to contact for any health issues, but 16% were worried about their safety after discharge from quarantine. consultations were held with community leaders in areas to which repatriates were to return, to address concerns and promote understanding that those discharged from quarantine did not pose a health risk to the population. the aar recommended proactive community engagement to reduce stigma towards those discharged from quarantine, and follow-up psychosocial monitoring for those discharged from quarantine. a total of 43 incidents were logged using the moh system. most were related to non-health incidents (e.g. losses or delays with luggage); others related to the absence or behaviour of quarantine support staff, including non-compliance with quarantine restrictions. two instances of breaches of procedures and protocols by quarantine staff triggered health risk assessments. both incidents led to hotel staff being quarantined, even though this was not in line with moh recommendations. the aar noted that a streamlined quarantine facility incident reporting and health risk assessment system is imperative to address issues rapidly and to mitigate risks. the aar also recommended that the public health act be revised to adequately reflect directed quarantine, and to enable penalties for breaches of quarantine directives, either by those in quarantine or by other members of the public. personal protective equipment (ppe), including gloves, masks, gowns, eye protection and alcohol sanitizer, were issued in accordance with moh guidelines to all staff working in quarantine facilities and airports and to drivers and boat operators involved in transporting repatriates to quaratine facilities. there were some reports of inappropriate use of this ppe (e.g. unnecessary use of gloves). although 695 people attended some 29 formal training sessions, not everyone supporting repatriation and quarantine processes received training; this led to differences in how protocols were applied and standards were maintained (e.g. ppe use and the amount of time allowed for daily exercise). the aar therefore recommended that a full and comprehensive training package process if a repatriate with no symptoms was found to have a temperature over a pre-established threshold. the aar therefore recommended updating standard operating procedures for arrival health screening. upon arrival or registration, issues were identified for 42 people; these included medication requirements (41), pregnancy (14), allergies (30), addiction5 and disability.3 the aar recommended that allocation to quarantine facilities consider pre-existing health conditions or issues, travel origin and travel history. check-in to quarantine facilities data from passenger health declaration forms were later entered into a database; this process led to delays in data availability and constrained use of the data for quarantine operations. separate registration forms were required for check-in to quarantine facilities and were again reviewed by shefa community health services. the aar recommended improving information collection and management by using tablets for onsite data entry, updating online forms, and developing dashboards for rapid and clear communication and action. during quarantine daily health screenings included assessment of selfreported symptoms and measurement of temporal temperature by infrared thermometer to detect fever. in phase 1, only one person was identified with symptoms consistent with the who case definition for covid-19 at the time.7 a nasopharyngeal swab was found to be negative for sars-cov-2; the person was discharged following 14 days of quarantine and was later reclassified as not having been a suspected case. health screenings also identified other health issues (e.g. foodborne illness and dental issues). all those in quarantine were cleared for discharge on day 15 after their arrival (to ensure a full 14 days in quarantine). a total of 2480 quarantine-experience surveys and 2098 kessler psychological distress scale assessments were conducted around days 3 and 7 of quarantine. the aim was to conduct two surveys for each individual, but limited numbers of trained health staff meant this was not always possible. pooled results indicated that quarantine was “easy” for 78%, “a bit difficult” for 20% and “very difficult” for 2% of respondents. overall, eight wpsar vol 12, no 1, 2020 | doi: 10.5365/wpsar.2020.11.4.004https://ojs.wpro.who.int/ 7 vanuatu health operations for quarantine, may–july 2020tapo et al acknowledgements the following government of vanuatu departments are acknowledged for their key support to the repatriation process: national disaster management office; ministry of foreign affairs, international cooperation and external trade; vanuatu customs and inland revenue; department of immigration and passport services; biosecurity department; airports vanuatu ltd; vanuatu terminal services ltd; and vanuatu police force. the following development partners are acknowledged for their technical and financial support: world health organization; australian department of foreign affairs and trade; new zealand ministry of foreign affairs and trade; french embassy in vanuatu; wan smolbag; and messy haos. the tireless work by the shefa community health services team for daily health screenings and the mental health and psychosocial support services team for surveys is acknowledged with gratitude. the management and staff of the 15 hotels in and around port vila that served as quaratine facilities are thanked for their important role in ensuring a successful process. all communities and groups who supported the repatriates and teams are thanked. the following are acknowledged for their assistance with data entry and other information management: charity david, rebecca iaken, menie nakoham, norah nombong, lina rabty, sandy moses sawan and edrien walter. in addition to the authors, the aar was also attended by myriam abel, morris amos, emily deed, rebecca iaken, cliff kal, kalangai kalkandi, agnes mathias, roderick mera, rebecca olul, angelline phatu, barry saniel and shamayel shafiee, and all are thanked for their contributions. conflicts of interest all authors declare no conflicts of interest. funding information funding for health operations related to repatriation and quarantine was provided by the government of vanuatu, with additional support and technical assistance from development partners, including the world health organization, the united nations children’s fund be developed to include content tailored for various staff supporting the quarantine process. other support during quarantine included provision of activity and entertainment packs to children and services such as exchange of currency and shopping. the health operations team also liaised with hotel management on health-related issues; the aar recommended that this additional role be clearly defined for phase 2. quarantine discharge some delays were experienced as repatriates went through health clearance and discharge from quarantine, due mainly to the limited availability of medical officers to appraise health data. the aar therefore recommended improved quarantine discharge and additional registered medical officers to assess and sign discharge summaries. before discharge, repatriates were debriefed on actions to take if covid-19 signs and symptoms were observed, and to thank them for their cooperation that enabled a successful quarantine process. conclusion health operations instituted in vanuatu to support government-managed repatriation and quarantine from may to july 2020 were successful. challenges included a lack of information to guide health planning, high volumes of arrivals, insufficient health staff, poor consideration of health factors for quarantine facility selection and allocations, and inadequate multisectoral coordination. lessons learnt from health operations in phase 1 were documented during an aar in late july 2020. the recommendations will be applied to phase 2 (from august 2020). ethics statement the vanuatu health ethics and research committee advised that ethics approval was not required because data were collected as part of the pandemic response and in line with the vanuatu public health act of 1994, with only non-identifiable data collated. wpsar vol 12, no 1, 2020 | doi: 10.5365/wpsar.2020.11.4.004 https://ojs.wpro.who.int/8 tapo et alvanuatu health operations for quarantine, may–july 2020 3. extension of the declaration of state of emergency order no. 70 of 2020. extraordinary gazette numero special 1. republic of vanuatu official gazette; 12 may 2020. 4. extension of the declaration of state of emergency order no. 93 of 2020. extraordinary gazette numero special no. 3. republic of vanuatu official gazette; 13 july 2020. available from: https://www.gov.vu/index.php/events/news/86-extension-of-thedeclaration-of-the-soe-order-no-93-of-2020, accessed 22 january 2021. 5. public health act [cap. 234]. act 22 of 1994. republic of vanuatu, 1994. 6. recommendations on measures to prevent, contain and respond to covid-19 in vanuatu, version 5.1 (21 july 2020). vanuatu health technical advisory group; 2020. 7. surveillance strategies for covid-19 human infection: interim guidance, 10 may 2020. geneva: world health organization; 2020. available from: https://apps.who.int/iris/handle/10665/332051, accessed 22 january 2021. (unicef) and the australian department of foreign affairs and trade. references 1. coronavirus disease (covid-19) situation report 194. geneva: world health organization; 2020. available from: https://www.who.int/ docs/default-source/coronaviruse/situation-reports/20200801covid-19-sitrep-194.=pdf?sfvrsn=401287f3_2, accessed 22 january 2021. 2. declaration blong president blong republic to the people of the republic of vanuatu in relation to the state of emergency, 26 march 2020. port vila: national disaster management office; 26 march 2020. available from: https://ndmo.gov.vu/covid-19/category/95state-of-emergency-orders?download=290:he-hos-declarationof-soe-march-26-2020, accessed 22 january 2021. https://www.gov.vu/index.php/events/news/86-extension-of-the-declaration-of-the-soe-order-no-93-of-2020 https://www.gov.vu/index.php/events/news/86-extension-of-the-declaration-of-the-soe-order-no-93-of-2020 https://apps.who.int/iris/handle/10665/332051 https://apps.who.int/iris/handle/10665/332051 https://ojs.wpro.who.int/ 1wpsar vol 11, no 4, 2020 | doi: 10.5365/wpsar.2019.10.1.005 outbreak investigation report a department of emergency, lianyungang municipal center for disease control and prevention, lianyungang, jiangsu, china. b haizhou district center for disease control and prevention, lianyungang, jiangsu, china. c department of paediatrics, lianyungang no. 1 people’s hospital, lianyungang, jiangsu, china. published: 28 december 2020 doi: 10.5365/wpsar.2019.10.1.005 introduction: at 11:20 on 26 may 2018, a physician from lianyungang no. 1 people’s hospital, china, reported that six family members were being treated in the hospital with symptoms from an unknown cause. methods: a case series for a food poisoning investigation and an environmental survey were conducted. the patients and their relatives were interviewed in person with a questionnaire contained on a digital tablet, and an investigation of the patients’ home was conducted in the presence of police officers. probable case and confirmed case were defined to serve as a basis for identifying additional cases. confirmed cases were defined as those probable cases in which blood, stool or vomitus specimens tested positive for paliperidone palmitate and/or its metabolites. a descriptive analysis was performed. follow-up by telephone was conducted four months later. results: there were six probable cases. the median age was 35 years (range: 5–76 years). the attack rate was 100% (n = 6/6) of persons who consumed a family dinner, and the hospitalization rate was also 100% (n = 6/6). the median period between exposure and symptom onset was two hours. the main symptoms included vomiting, nausea, drowsiness, dizziness and severe abdominal pain for adults, and vomiting and severe lethargy for children. an 8-year-old girl further showed changes in the st segment of her electrocardiogram, and a 5-year-old boy showed qt prolongation. the poisoning substance was suspected to be paliperidone palmitate based on the patients’ symptoms and epidemiological findings. discussion: we investigated the household food poisoning outbreak through epidemiological analysis and an environmental investigation and determined that it was caused by paliperidone palmitate. the source of the paliperidone palmitate was found to be aluminium containers, taken home by the eldest son who worked at a pharmaceutical company. the containers were sent to a drug disposal centre, and the pharmaceutical company was required to enhance the regulation on the pharmaceutical waste materials to prevent drug poisoning events. by the end of september 2018, the six patients recovered and were released from the hospital, and they did not show any clinical sequelae in four follow-up visits. a t 11:20 on 26 may 2018, the staff at the haizhou district health bureau received a call from a doctor in the health department informing them that six patients with symptoms from an unknown origin were being treated at the liayungang no. 1 people’s hospital, china. at that time, three epidemiologists and two laboratory personnel from the lianyungang municipal and haizhou district centers for disease control and prevention were sent to that hospital to open an investigation. methods epidemiological, laboratory and environmental investigations were conducted. epidemiological investigation a case series for a food poisoning investigation and an environmental survey were conducted in accordance with chinese technical guidelines for epidemiological investigations of food safety incidents.1 we interviewed the patients and their relatives in person with a questionnaire contained on a digital tablet. the questionnaire included demographic information, clinical symptoms and treatments, and dietary exposure information over the previous 72 hours. blood specimens and food samples were collected. probable cases were defined as members of the family who ate leftover fish, dry lettuce with sauce, scalan accidental household outbreak of paliperidone palmitate poisoning via pancake consumption in lianyungang, china tinglu zhang,a zhentao li,b peiliang luo,c qingjun sunb correspondence to tinglu zhang (email: tlzhang66@163.com) wpsar vol 11, no 4, 2020 | doi: 10.5365/wpsar.2019.10.1.005 https://ojs.wpro.who.int/2 zhang et ala food poisoning outbreak in lianyungang, china and rice porridge (table 1). the six patients ate dinner between 18:00 and 18:30. the eldest son went out for a haircut after dinner. upon returning to the house, he found the five other members of his family in a lethargic state. he called emergency services, and ambulances soon arrived, taking the patients to the emergency department of lianyungang no. 1 people’s hospital for treatment. epidemiologic and clinical profiles there were six probable cases. the first case displayed symptoms, at 20:10 on 25 may 2018; the five remaining cases displayed symptoms by 20:30. the median incubation period was two hours. the attack rate was 100% (n = 6/6) as shown in fig. 1, and the hospitalized rate was 100% (n = 6/6). all four adult case patients reported dizziness, drowsiness, malaise, nausea, severe abdominal pain and vomiting. coffee-ground vomitus was not reported, indicating that gastric bleeding had not occurred. the main symptoms and signs exhibited by both children included contracted pupils, severe lethargy (one child was in a coma for two days, and the other for four days), tachycardia and vomiting, but they were otherwise haemodynamically stable. the girl showed st segment changes in her electrocardiogram, and the boy displayed prolongation of the interval between the q wave and the t wave (qtc prolongation). laboratory blood specimens of all six case patients were collected and sent to the municipal and provincial center for disease control and prevention laboratories, but those laboratories did not have the capacity to test for paliperidone (as suspected from environmental investigation, see below). the dry lettuce tested negative for pathogenic organisms. stool and vomitus specimens were not collected. treatments at 21:44 of 25 may 2018, the six patients arrived at lianyungang no. 1 people’s hospital by ambulance. the four adults were quickly transferred to the emergency department, and the two children were transferred to the paediatrics department. all six case patients were admitted to intensive care units and received supportive lion pancakes and rice porridge for dinner on 25 may 2018, and presented with acute gastroenteritis with at least one of the symptoms: vomiting, malaise and severe abdominal pain. confirmed cases were defined as those who met the case definition for the probable cases, and whose blood, stool or vomitus specimens tested positive for paliperidone palmitate or its metabolites. statistical analysis we entered the data into a computerized database. the descriptive analysis included the distribution of onset dates and the process used to make the food. in addition, the attack rate (the number of cases divided by the number of family members who ate the scallion pancakes) and the hospitalized rate (the number of hospitalized cases divided by the number of cases) were calculated. laboratory investigation blood specimens were collected from probable cases and sent to the municipal and provincial center for disease control and prevention laboratories and the pharmaceutical company laboratory. the dry lettuce (no other dishes from the meal were available) was collected (about 200 g) and sent to the lianyungang municipal center for disease control and prevention to test for pathogenic organisms. ethical approval this outbreak investigation was conducted by public health agencies as a part of their legally authorized mandate. it was, therefore, considered research with minimal risk and was exempted from ethical approval by institutional review boards. results case characteristics the six patients being treated in hospital were members of a family that lived in taiping village, haizhou district, lianyungang, china. they included a 76-year-old man, a 63-year-old woman, a 35-year-old man, a 35-year-old woman, an 8-year-old girl and a 5-year-old boy. the family’s dinner on 25 may 2018 included leftover fish from lunch, dry lettuce with commercially produced soybean sauce, homemade scallion pancakes wpsar vol 11, no 4, 2020 | doi: 10.5365/wpsar.2019.10.1.005https://ojs.wpro.who.int/ 3 a food poisoning outbreak in lianyungang, chinazhang et al treatment with gastric lavage for presumed poisoning, followed by intravenous fluid infusion. they received diuretics to facilitate excretion of the paliperidone palmitate and its metabolites once they were in a stable condition, and after environmental investigation and according to the product prescription by janssen pharmaceutica n.v. the median length of hospital stay was 13 days (range: 12-15 days). four follow-up visits were conducted by the end of september 2018; all six discharged patients reported no clinical sequelae. food-making process investigation epidemiologists spoke with the 63-year-old’s niece, who reported that the grandmother had mixed a handful of white, tasteless “starch” from an aluminium container into the flour when making scallion pancakes on the afternoon of 25 may 2018. the epidemiologists visited the family home to investigate on the morning of 27 may 2018. two aluminium containers with lids were found in the kitchen; there was a white substance at the bottom of each aluminium container. the containers were labelled “paliperidone palmitate”. these aluminium containers had been abandoned in a warehouse of a pharmaceutical company in lianyungang, china, after most of the powder stored in the containers had been used. the grandmother’s eldest son worked for the company and had taken two aluminium containers from the warehouse, without permission, to use for storing items. on the morning of 27 may 2018, the grandmother described her food-making process to the epidemiologists. she told them that she took some white powder from an aluminium container that her son had brought home from the pharmaceutical company. she said he had told her that the white powder left in containers might be “starch”. she used a sieve over a flour-mixing basin to sift any impurities from what she thought was starch on the afternoon of 25 may 2018, then mixed the filtered white powder with water in a bowl. because paliperidone leftover fish from lunch (mouthfuls) dry lettuce with commercially produced soybean sauce (mouthfuls) pancake (g) rice porridge (bowls) female 63 3 3 50 1 male 35 2 4 50 1 male 76 4 2 100 1 female 8 0 2 100 1 male 5 0 1 150 1 female 35 1 2 50 1 sex age (years) dinner foods 17:00 5 4 3 2 1 0 17:30 18:00 18:30 19:00 19:30 20:00 20:30 21:00 21:30 22:00 22:30 23:00 23:30 c as es time started to eat dinner first case patient displayed symptoms: vomiting, malaise and severe abdominal pain five remaining case patients displayed symptoms arrived at hospital transferred to lianyungang no. 1 people’s hospital by 120 emergency ambulance table 1. types and approximate portions of food consumed by patients at dinner (18:00) on 25 may 2018 fig. 1. distribution of six food poisoning cases in taiping village, haizhou district, lianyungang, china, on 25 may 2018 wpsar vol 11, no 4, 2020 | doi: 10.5365/wpsar.2019.10.1.005 https://ojs.wpro.who.int/4 zhang et ala food poisoning outbreak in lianyungang, china schizophrenia cases. previously reported adverse events include dizziness and vomiting, which were very similar to symptoms of the six patients, except for severe abdominal pain in this event.2–13 the half-life of paliperidone palmitate is 25–49 days after a single oral dose of 25–125 mg, according to the product prescription by janssen pharmaceutica n.v. in this outbreak, the young girl showed st segment changes in her electrocardiogram, and the young boy displayed prolongation of the interval between the q wave and the t wave (qtc prolongation). some studies have shown that prolongation of the qt intervals remains a concern with the use of antipsychotics.14 while others have reported no evidence of clinically significant qtc prolongation with paliperidone palmitate at doses up to 100 mg equivalent. when four follow-up visits for the discharged patients were conducted by the end of september 2018, all six discharged patients reported no clinical sequelae. limitations the laboratories did not have the capability to test for paliperidone palmitate. conclusion we reported a household food poisoning outbreak that is suspected to have been caused by paliperidone palmitate that was accidentally incorporated into scallion pancakes, according to the clinical symptoms of six patients and the epidemiological findings. it is suggested that the pharmaceutical company strictly enforce regulations on the destruction and disposal of pharmaceutical waste and expired materials. in addition, it is suggested the people not take home unknown and/or abandoned commodities and not to eat unknown food in order to prevent the food-related poisoning events. acknowledgements we thank the local food and drug administration and the police for their help and cooperation in the investigation of the outbreak in this food poisoning event. palmitate is insoluble in water, the grandmother threw the contents of the bowl, including possibly 20 g of powder, on the ground. but there was still a little of what she believed to be starch (potentially 5 g) sprinkled into the flour-mixing basin during the sifting (fig. 2). finally, she used the flourmixing basin to mix the wheat flour (about 500 g), and baked the scallion pancakes as a staple food for dinner. control measures the following public health control measures were implemented following the food poisoning outbreak and discovery: 1. police officers sealed the aluminium containers and other related articles for safekeeping in the patients’ home, and then transferred them to the drug disposal centre for future elimination at the lianyungang public security bureau. none of the contaminated scallion pancakes remained. 2. clinicians were informed of the discovery of paliperidone palmitate in the patients’ food, to inform treatment decisions” 3. the local food and drug administration immediately launched an investigation into the food poisoning outbreak. it required the pharmaceutical company implicated to strictly enforce regulations on the destruction of expired materials or medicines in pharmaceutical production and storage and to standardize and update protocols for destroying those wastes to prevent drug poisoning events. discussion we describe a household food poisoning outbreak caused by paliperidone palmitate that accidentally contaminated flour that was incorporated into scallion pancakes consumed by a family in taiping village, haizhou district, lianyungang, china, on 25 may 2018. although we could not confirm it by laboratory testing, the epidemiologic and environmental investigation support the conclusion that the patients were poisoned with paliperidone palmitate, used in preparing the pancakes consumed by the family admitted to the emergency department. paliperidone palmitate is an antipsychotic medication used for the acute treatment and maintenance of wpsar vol 11, no 4, 2020 | doi: 10.5365/wpsar.2019.10.1.005https://ojs.wpro.who.int/ 5 a food poisoning outbreak in lianyungang, chinazhang et al 7. zhang f, si t, chiou cf, harris aw, kim cy, jahagirdar p, et al. efficacy, safety, and impact on hospitalizations of paliperidone palmitate in recent-onset schizophrenia. neuropsychiatr dis treat. 2015 mar 11;11:657–68. doi:10.2147/ndt.s77778 pmid:25792835 8. berwaerts j, liu y, gopal s, nuamah i, xu h, savitz a, et al. efficacy and safety of the 3-month formulation of paliperidone palmitate vs placebo for relapse prevention of schizophrenia: a randomized clinical trial. jama psychiatry. 2015 aug;72(8):830–9. doi:10.1001/jamapsychiatry.2015.0241 pmid:25820612 9. lamb yn, keating gm. paliperidone palmitate intramuscular 3-monthly formulation: a review in schizophrenia. drugs. 2016 oct;76(16):1559–66. doi:10.1007/s40265-016-0645-5 pmid:27699643 10. hargarter l, cherubin p, bergmans p, keim s, rancans e, bez y, et al. intramuscular long-acting paliperidone palmitate in acute patients with schizophrenia unsuccessfully treated with oral antipsychotics. prog neuropsychopharmacol biol psychiatry. 2015 apr 3;58:1–7. doi:10.1016/j.pnpbp.2014.11.006 pmid:25448776 11. yong p. efficacy and safety of paliperidone palmitate injection in patients with first episode schizophrenia. cardiovascular disease journal of integrated traditional chinese and western medicine. 2018;18(6):98–99. doi:10.16282/j.cnki.cn11 9336/r.2018.18.073 12. zhaoyu h, sheng w, lu l, jingtao g. comparative study and economic evaluation of palioprostone palmitate injection and paliperidone extended-release tablets in treatment of schizophrenia. evaluation and analysis of drug-use in hospitals of china. 2017;6(17):792–95. doi:10.14009/j.issn.1672– 2124.2017.06.027 13. jihong q, xiaoping c. clinical evaluation on paliperidone palmitate injection in treating schizophrenia in 45 cases. china pharmaceuticals. 2018;14(27):38–40. doi:10.3969/j.issn.1006– 4931.2018.14.013 14. taylor dm. antipsychotics and qt prolongation. acta psychiatr scand. 2003 feb;107(2):85–95. doi:10.1034/j.16000447.2003.02078.x pmid:12534433 conflict of interest the authors declare no conflicts of interest. funding no funding. references 1. the chinese technical guidelines for the epidemiological investigation of food safety incidents. beijing; ministry of health of the people’s republic of china. 2012. 2. gopal s, hough dw, xu h, lull jm, gassmann-mayer c, remmerie bm, et al. efficacy and safety of paliperidone palmitate in adult patients with acutely symptomatic schizophrenia: a randomized, double-blind, placebo-controlled, dose-response study. int clin psychopharmacol. 2010 sep;25(5):247–56. doi:10.1097/yic.0b013e32833948fa pmid:20389255 3. pandina gj, lindenmayer jp, lull j, lim p, gopal s, herben v, et al. a randomized, placebo-controlled study to assess the efficacy and safety of 3 doses of paliperidone palmitate in adults with acutely exacerbated schizophrenia. j clin psychopharmacol. 2010 jun;30(3):235–44. doi:10.1097/jcp.0b013e3181dd3103 pmid:20473057 4. gopal s, vijapurkar u, lim p, morozova m, eerdekens m, hough d. a 52-week open-label study of the safety and tolerability of paliperidone palmitate in patients with schizophrenia. j psychopharmacol. 2011 may;25(5):685–97. doi:10.1177/0269881110372817 pmid:20615933 5. li h, rui q, ning x, xu h, gu n. a comparative study of paliperidone palmitate and risperidone long-acting injectable therapy in schizophrenia. prog neuropsychopharmacol biol psychiatry. 2011 jun 1;35(4):1002–8. doi:10.1016/j.pnpbp.2011.02.001 pmid:21315787 6. zhao j, li l, shi j, li y, xu x, li k, et al. safety and efficacy of paliperidone palmitate 1-month formulation in chinese patients with schizophrenia: a 25-week, open-label, multicenter, phase iv study. neuropsychiatr dis treat. 2017 aug 2;13:2045–56. doi:10.2147/ndt.s131224 pmid:28814873 fig. 2. the insoluble “starch” solution was thrown away on the ground after sifting the insoluble aqueous solution in the bowl had been thrown away on the ground sieve for sifting flour bowl flour mixing basin influenza-associated paediatric respiratory hospitalizations in china, 1996–2012: a systematic analysis original research mei shang,a,b kathryn e. lafond,b jeffrey mcfarland,a,b suizan zhou,a,b john klenaa and marc-alain widdowsonb a china-us collaborative program on emerging and reemerging infectious diseases, centers for disease control and prevention, beijing, china. b influenza division, centers for disease control and prevention, atlanta, ga, usa. correspondence to mei shang (email:pmyvonne@yahoo.com). to cite this article: shang m, lafond ke, mcfarland j, zhou s, klena j, widdowson ma. influenza-associated paediatric respiratory hospitalizations in china, 1996–2012: a systematic analysis. western pac surveill response j. 2018 oct;9(5). doi:10.5365/wpsar.2018.9.1.004 abstract background: the world health organization recommends that children aged ≥6 months be vaccinated against influenza. influenza vaccination policies depend on the evidence of the burden of influenza, yet few national data on influenza-associated severe outcomes among children exist in china. methods: we conducted a systematic review of articles published from 1996 to 2012 on laboratory-confirmed, influenza-associated paediatric respiratory hospitalizations in china. we extracted data and stratified the percentage of samples testing positive for influenza by age group (<2, <5 and <18 years old); case definition; test methods; and geographic location. the pooled percentage of samples testing positive for influenza was estimated with a random effects regression model. results: influenza was associated with 8.8% of respiratory hospitalizations among children aged <18 years, ranging from 7.0% (95% confidence interval: 4.2–9.8%) in children aged <2 years to 8.9% (95% confidence interval: 6.8–11%) in children aged <5 years. the percentage of samples testing positive for influenza was consistently higher among studies with data from children aged <5 years and <18 years than those restricted only to children aged <2 years; the percentages were higher in northern china than southern china. discussion: influenza is an important cause of paediatric respiratory hospitalizations in china. influenza vaccination of school-aged children could prevent substantial influenza-associated illness, including hospitalizations, in china. introduction young children are at an increased risk of severe disease due to influenza infection compared to older children and young adults.1-5 data from temperate northern hemisphere countries indicate that rates of influenza-associated hospitalizations among children aged <5 years range from 0.36 to 5.16 per 1000 children with the highest rate among children aged <2 years.4,6,7 therefore, the world health organization (who) recommends the inclusion of children aged 6 to 59 months as a priority group for seasonal influenza vaccination.8 who also provides global guidance on surveillance for influenza, including influenza-like illness (ili) among outpatients and severe acute respiratory infection (sari) among inpatients, to capture influenza epidemiology, including disease burden.9 few nationally representative studies exist on influenza-associated severe disease among children in china. since 2007, the chinese center for disease control and prevention (china cdc) has recommended annual seasonal influenza vaccination for children aged ≥6 months10,11 based largely on disease burden data from other northern hemisphere countries. however, influenza vaccine uptake among children remains low. a telephone survey in four provinces, representing eastern and central china, found that influenza vaccination coverage among children aged <5 years in urban settings was 21.9% for the 2009–2010 season and 25.6% for the 2011–2012 season.12 to better understand the epidemiology of influenza and influenza-associated disease burden, china cdc has implemented national and provincial-level surveillance systems. ili surveillance, which began in 2009, monitors the predominant influenza virus strains circulating in outpatient settings and covers all provinces in mainland china, but it is not designed to estimate the disease burden. in 2011, china cdc also began inpatient surveillance for sari in 10 provinces; however, the surveillance only covers a limited geographic area, mostly in the more developed eastern provinces. furthermore, sari sentinel site surveillance uses a modified version of the who sari case definition which includes different criteria for patients aged >5 years and ≤5 years and is also more specific.13 therefore, sari surveillance likely underestimates the impact of influenza-associated hospitalizations nationwide, particularly those that do not fall within the strict sari case definition. the contribution of influenza among respiratory hospitalizations in children aged <18 years remains a key knowledge gap. to address this gap, we conducted a systematic review of the chinese and english literature to assess the burden of influenza-associated paediatric respiratory hospitalizations in china. we wanted to better understand influenza-associated hospitalizations, especially during the period when relevant data were not well described. the evidence provided will help to improve estimates of the influenza burden in china, refine influenza vaccination policy and reduce nationwide influenza-associated paediatric morbidity and mortality. methods systematic review of the literature we conducted a systematic search of biomedical reference databases (pubmed, embase, web of science, cinahl, indmed, lilacs, wholis, cnki and global health) to identify articles published from 1 january 1996 to 31 december 2012. keywords that were used for searching were grouped in two categories: respiratory infection and viral etiology (full list of search terms and results are provided in supplementary table 1). we adopted the same literature search strategy as the one used to assess influenza-associated paediatric respiratory hospitalizations at the global level.14 two independent reviewers screened the identified papers to select those that met the following inclusion criteria: (1) presented original data; (2) the study population included chinese children aged <18 years old; (3) collected data from a minimum of 12 months of continuous surveillance; (4) conducted laboratory testing for influenza; (5) stated a pre-specified case definition or other clear criteria for specimen collection and testing; (6) included hospitalized case-patients (nosocomial infections were excluded); (7) provided both the numerator and denominator for influenza testing; (8) and tested a minimum of 50 children for influenza infection. for papers meeting these criteria, the full-text articles were obtained and re-screened by two reviewers. key data that were extracted included study duration in years; geographic location of the study (defined as northern or southern china; demarcated by the qinling mountains-huaihe river line);15 total numbers of inpatients tested and total numbers tested positive for influenza; age group; case definition used to screen patients for testing (e.g. community-acquired pneumonia, sari and acute respiratory infection); type of diagnostic tests used; and publication year. since distinct age groups in the published data were not standardized for easy comparison, we created three overlapping age groups: <2 years, <5 years and <18 years old. the <18 years old group included the <2 years and <5 years old groups, and the <5 years old group included the <2 years old group. to ensure the disease burden data are associated with seasonal influenza, we excluded results that covered the 2009 influenza a(h1n1) pandemic period. quality assessment data quality for each eligible article was scored using a modified newcastle-ottawa checklist for bias assessment16 with three standards: (1) representativeness of the sampling process for enrolment; (2) specificity of enrolment criteria; (3) and clarity of reported results. a score of one or zero was given to each item accordingly. statistical analyses we first described eligible studies by age group, study duration, total numbers tested and positive for influenza infection, case definition, type of diagnostic tests used and geographic location. we calculated the percentage of samples that tested positive for influenza (hereafter referred to as per cent influenza-positive). kruskal–wallis one-way analysis of variance was used to test the difference among medians.17 we then calculated pooled estimates of the per cent influenza-positive using a dersimonian and laird random effects meta-analysis model18 for the three age groups stratified by geographic location. briefly, in the random effect model, we assumed that the per cent influenza-positive estimated in the different studies were not identical. because of variations in the sensitivity and specificity of different diagnostic tests,19-27 we also calculated pooled estimates stratified by a different diagnostic approach: (1) diagnosis based on polymerase chain reaction (pcr); (2) any diagnostic test except alkaline phosphatase-anti-alkaline phosphatase technique (apaap); (3) any diagnostic test except immunoassay; (4) any diagnostic test except apaap or immunoassay. all reported tests were two-sided, and p-values < 0.05 indicated statistical significance. data were analysed using stata, version 12 (statacorp, college station, tx). results study characteristics the systematic literature search identified 42 456 unique records (4450 chinese and 38 006 english) from the nine scientific literature databases. a total of 1176 full-text articles (219 in chinese and 957 in english) were reviewed. after excluding articles that did not meet the inclusion criteria and those with overlapping populations, 79 articles (69 in chinese and 10 in english) were included in the descriptive analysis (fig. 1). the full list of included articles is provided in supplementary table 2. the number of available studies published before 2004 was limited (n = 12). the number of studies increased to eight in 2004 and 14 in 2010, reflecting the 2009 influenza a(h1n1) pandemic. the data sets covered 23 provinces and special administrative regions (fig. 2). of the 79 articles included, 50 studies (63%) were from southern china and 29 (37%) were from northern china (table 1). more than 95% of the studies tested at least 100 patients during the study period. more than 40% of the studies used immunofluorescence as the diagnostic test. most studies differentiated influenza a and influenza b (n = 60 of 79). over the years, influenza a positivity remained higher than influenza b positivity (median, interquartile range [iqr]: 2.5% [1.2–7.3%] vs 0.5% [0.2–4.1%]). the most commonly used case definitions for screening were acute respiratory infection (ari), acute lower respiratory infection and pneumonia. ari case definitions varied in different settings, but mostly met one or more of the following criteria: (1) symptoms of acute infection; (2) a body temperature >38.0 °c; (3) white blood cell count of >10 000/ml; (4) and signs/symptoms of acute respiratory illness. only one study used sari as a case definition. for patients >5 years, sari is defined as an acute onset of elevated temperature (axillary temperature ≥38 °c), cough or sore throat tachypnea (respiratory rate ≥25/min) or dyspnea (difficulty breathing) either at admission or during stay. for patients aged ≤5 years, sari is defined as an acute onset of cough or dyspnea either at admission or during stay, and at least one of the following six signs or symptoms: (1) tachypnea (respiratory rate >60/min for those aged <2 months, respiratory rate >50/min for those aged 2 to <12 months, respiratory rate >50/min for those aged 1 to ≤5 years); (2) inability to drink or breastfeed; (3) vomiting; (4) convulsions; (5) lethargy or unconsciousness; (6) and chest in-drawing or stridor in a calm child. fig. 1. flow diagram for systematic review process click to download figure 1. jpg, 314kb fig. 2. the distribution of studies included in the systematic analysis* (n = 79) click to download figure 2. jpg, 300kb table 1. characteristics of published studies and data sources about influenza-associated paediatric respiratory hospitalizations in china, 1996–2012 (n = 79) click to download table 1. jpg, 438kb crude median per cent influenza-positive the crude median per cent influenza-positive among studies with data from children aged <2 years was 2% (iqr: 1–8%) and from children aged <5 years and <18 years was 6% (iqr: 2–11%, table 2). the crude median per cent influenza-positive was four times lower among the 34 data sets that used immunofluorescence alone as compared to the 44 data sets that used other methods (2% versus 8%, kruskal–wallis test p < 0.05). the crude per cent influenza-positive was almost four times higher among the seven data sets that used apaap as compared to the 71 data sets that used other methods (19% versus 5%; kruskal–wallis test p < 0.05). stratification by age did not change the patterns. the crude per cent influenza-positive was not associated with case definition, geographic location or study duration (kruskal–wallis test p > 0.05 for all). table 2. crude proportion of respiratory samples from hospitalized children testing positive for influenza by age group, diagnostic test, case definition, clinical diagnosis and geographic location in china, 1996–2012 click to download table 2. jpg, 461kb pooled estimates of per cent influenza-positive the overall pooled estimates of the per cent influenza-positive among paediatric respiratory inpatients was 4.7% (95% confidence interval [ci]: 4.0–5.4%), 7.3% (95% ci: 6.4–8.1%); and 7.9% (95% ci: 7.1–8.7%) among children aged <2 years, <5 years and <18 years respectively (table 3). considering the observed low sensitivity of immunoassay tests and the low specificity of apaap tests, we did three additional analyses that excluded either one or both of them. however, children aged <5 years and <18 years consistently had higher point pooled per cent influenza-positive than children aged <2 years. the 95% cis of pooled per cent influenza-positive for children aged <5 years and <18 years overlapped considerably (table 3). table 3. pooled estimates of per cent influenza-positive of influenza-associated paediatric respiratory hospitalizations, by age group and by diagnostic test method in china, 1996–2012 click to download table 3. jpg, 616kb in all age groups, per cent influenza-positive in the northern provinces was higher than that in the southern provinces (7.1% vs 3.8%, 10.4 vs 5.9%, 9.8% vs 7.1%). additional stratified analyses by diagnostic test did not significantly change the pattern. the final pooled analyses of only pcr-confirmed data included 13 data sets; most of them were in the more developed eastern or southern provinces (n = 10 of 13). the point per cent influenza-positive remained higher among children aged <5 years and <18 years, but the 95% cis of per cent influenza-positive of the three groups overlapped considerably (point per cent influenza-positive and 95% ci: 7% [4.2–9.8%] for <2 years, 8.9% [6.8–11%] for <5 years, and 8.8% [7.0–10.7%] for <18 years). discussion our study of influenza-associated severe hospitalizations from 23 provinces and autonomous administrative areas of china during the period 1996–2012 is the first systematic review of influenza-associated paediatric hospitalizations in china. findings from this review complement results from china's two influenza surveillance systems that are limited in their ability to capture the true number of influenza-associated paediatric hospitalizations either by using sari as an overly specific case definition or by excluding many jurisdictions before 2012. our review covered well-developed provinces as well as the less-developed provinces for which only limited influenza-associated disease burden estimates are available. using pcr-confirmed outcomes, we found that in addition to the significant burden of influenza in respiratory hospitalizations among children aged <2 years, as observed in other northern hemisphere counties, the relative contribution of influenza was also high among acute respiratory hospitalizations in children aged <5 years and <18 years in china. the fact that influenza is associated with severe outcomes among younger children as well as among older children is consistent with the sari surveillance results from china and results from the systematic analysis on respiratory hospitalizations at the global level during similar study periods.13,14,28 all three studies reported that influenza-associated hospitalization was higher among children of older age groups than among children aged <2 years. similar percentage of influenza-contributed respiratory hospitalizations among children <18 years was also estimated from the global report14 with 7.7% in developing countries and 8.5% in the who western pacific region. influenza not only contributes to respiratory hospitalization among children aged <18 years, it also contributes to a significant percentage of outpatient visits. one study conducted in two northern provinces of china during 2012–2015 found that influenza was the most commonly detected virus in ambulatory patients across all age groups,29 though this study used ari for patient screening. ari was also the most commonly used case definition in all articles included in our analysis. this case definition is more sensitive than the strict sari definition used in the surveillance system during 2011–2013.13 in most populated developing country hospitals, including hospitals that conduct surveillance associated with severe outcomes of a respiratory virus, busy clinicians examining patients describe the patient's general condition related with ari rather than list numerous signs and symptoms in detail.30 for future surveillance on influenza-associated severe outcomes, if clinicians are responsible for case enrolment or if enrolment is based on patient chart review, standardization and simplification of the case definition are encouraged to improve case capture and surveillance quality. there was a substantial difference in the percentage by diagnostic test, with high positivity in those tested with immunoassay and low positivity in those tested by apaap assay. though studies have shown that pcr is more sensitive than other test methods,31,32 our pooled results from other testing methods (not including apaap and immunoassay) had higher positivity than pcr. this may be because the use of pcr was largely limited to the resourceful southern provinces that have lower proportions of influenza-associated hospitalizations compared with the northern provinces. other testing methods were used with similar frequency among studies from southern and northern provinces. we also found that the proportion of hospitalizations due to influenza was higher in the northern provinces than the southern provinces. as there were relatively fewer studies in northern china, we suggest the strengthening of respiratory disease-related surveillance in northern china to better understand the drivers of the disparity comparing with southern china (e.g. etiologies, interventions, health seeking behaviours, influenza vaccine and pneumococcal vaccine uptake) to inform local prevention and control strategies. our analysis is subject to several limitations. first, the data sets were all from cities (prefectures) or referral hospitals in the provinces. respiratory disease burden may differ between urban and rural areas, and we may not have adequately captured data from rural populations because of their limited access to city hospitals. second, many data sets did not use pcr as a diagnostic test, particularly among northern provinces, raising uncertainty regarding the accuracy of their results. although we attempted to address this limitation by generating a pooled estimate restricted only to pcr-based results, the pooled estimate is less representative of northern china. third, although we screened studies for use of clear criteria for influenza testing, it is possible that subjective clinical judgment may have influenced clinician testing practices and therefore our outcomes. finally, we were not able to exclude 2009 influenza a(h1n1) data from nine data sets because the results were not stratified to allow this separate analysis. our study results suggest that influenza was responsible for almost 9% of paediatric respiratory hospitalizations. though more studies are warranted on the influenza-associated outpatient burdens among these age groups and in northern china, inclusion of school-aged children in the influenza vaccination priority group and collaborations with other organizations (for instance schools) to improve vaccine uptake may reduce substantial influenza-associated morbidities among children in china. references brotherton j, mcintyre p, puech m, wang h, gidding h, hull b, et al. vaccine preventable diseases and vaccination coverage in australia 2001 to 2002. commun dis intell q rep. 2004 dec;28 suppl 2:vii–s116. pmid:15732752 iskander m, booy r, lambert s. the burden of influenza in children. curr opin infect dis. 2007 jun;20(3):259–63. doi:10.1097/qco.0b013e3280ad4687 pmid:17471035 neuzil km, zhu y, griffin mr, edwards km, thompson jm, tollefson sj, et al. burden of interpandemic influenza in children younger than 5 years: a 25-year prospective study. j infect dis. 2002 jan 15;185(2):147–52. doi:10.1086/338363 pmid:11807687 poehling ka, edwards km, weinberg ga, szilagyi p, staat ma, iwane mk, et al.; new vaccine surveillance network. the underrecognized burden of influenza in young children. n engl j med. 2006 jul 6;355(1):31–40. doi:10.1056/nejmoa054869 pmid:16822994 thompson ww, shay dk, weintraub e, brammer l, bridges cb, cox nj, et al. influenza-associated hospitalizations in the united states. jama. 2004 sep 15;292(11):1333–40. doi:10.1001/jama.292.11.1333 pmid:15367555 hirve s, krishnan a, dawood fs, lele p, saha s, rai s, et al. incidence of influenza-associated hospitalization in rural communities in western and northern india, 2010-2012: a multi-site population-based study. j infect. 2015 feb;70(2):160–70. doi:10.1016/j.jinf.2014.08.015 pmid:25218056 schrag sj, shay dk, gershman k, thomas a, craig as, schaffner w, et al.; emerging infections program respiratory diseases activity. multistate surveillance for laboratory-confirmed, influenza-associated hospitalizations in children: 2003-2004. pediatr infect dis j. 2006 may;25(5):395–400. doi:10.1097/01.inf.0000214988.81379.71 pmid:16645501 vaccines against influenza who position paper – november 2012. geneva: world health organization; 2018 (http://www.who.int/wer/2012/wer8747.pdf?ua=1, accessed 9 aug 2018). who global epidemiological surveillance standards for influenza. geneva: world health organization; 2018 (http://www.who.int/influenza/resources/documents/who_epidemiological_influenza_surveillance_standards_2014.pdf?ua=1, accessed 27 jan 2018). guideline on seasonal influenza vaccination during during the 2007–2008 season in china (2007). beijing: chinese center for disease control and prevention; 2018 (https://wenku.baidu.com/view/ce056a3331126edb6f1a100b.html, accessed 28 jan 2018). guideline on seasonal influenza vaccination during the 2011–2012 season in china (2011). beijing: chinese center for disease control and prevention; 2018 (http://www.moh.gov.cn/mohyzs/s3585/201103/50776.shtml, accessed 28 jan 2018). zhou l, su q, xu z, feng a, jin h, wang s, et al. seasonal influenza vaccination coverage rate of target groups in selected cities and provinces in china by season (2009/10 to 2011/12). plos one. 2013 09 9;8(9):e73724. doi:10.1371/journal.pone.0073724 pmid:24040041 peng z, feng l, carolyn gm, wang k, zhu g, zhang y, et al. characterizing the epidemiology, virology, and clinical features of influenza in china's first severe acute respiratory infection sentinel surveillance system, february 2011-october 2013. bmc infect dis. 2015 03 22;15(1):143. doi:10.1186/s12879-015-0884-1 pmid:25885096 lafond ke, nair h, rasooly mh, valente f, booy r, rahman m, et al.; global respiratory hospitalizations–influenza proportion positive (gripp) working group. global role and burden of influenza in pediatric respiratory hospitalizations, 1982-2012: a systematic analysis. plos med. 2016 03 24;13(3):e1001977. doi:10.1371/journal.pmed.1001977 pmid:27011229 wang jdla. the geographical border and difference of southern and northern china. geography education. 2009(6):16. hong kong sar (china): baidu; 2018 (https://wenku.baidu.com/view/f7408a66011ca300a6c39084.html, 9 aug 2018) [in chinese]. wells g, shea b, o'connell d, peterson j, welch v, losos m, et al. the newcastle-ottawa scale (nos) for assessing the quality of nonrandomised studies in meta-analyses. ottawa: the ottawa hospital; 2018 (http://www.ohri.ca/programs/clinical_epidemiology/oxford.asp, accessed 9 aug 2018). spurrier jd. on the null distribution of the kruskal–wallis statistic. j nonparametr stat. 2003;15(6):685–91. doi:10.1080/10485250310001634719 dersimonian r, laird n. meta-analysis in clinical trials. control clin trials. 1986 sep;7(3):177–88. doi:10.1016/0197-2456(86)90046-2 pmid:3802833 templeton ke, scheltinga sa, beersma mf, kroes ac, claas ec. rapid and sensitive method using multiplex real-time pcr for diagnosis of infections by influenza a and influenza b viruses, respiratory syncytial virus, and parainfluenza viruses 1, 2, 3, and 4. j clin microbiol. 2004 apr;42(4):1564–9. doi:10.1128/jcm.42.4.1564-1569.2004 pmid:15071005 takahashi h, otsuka y, patterson bk. diagnostic tests for influenza and other respiratory viruses: determining performance specifications based on clinical setting. j infect chemother. 2010 jun;16(3):155–61. doi:10.1007/s10156-010-0035-y pmid:20191301 shetty ak, treynor e, hill dw, gutierrez km, warford a, baron ej. comparison of conventional viral cultures with direct fluorescent antibody stains for diagnosis of community-acquired respiratory virus infections in hospitalized children. pediatr infect dis j. 2003 sep;22(9):789–94. doi:10.1097/01.inf.0000083823.43526.97 pmid:14506369 lasala pr, bufton kk, ismail n, smith mb. prospective comparison of r-mix shell vial system with direct antigen tests and conventional cell culture for respiratory virus detection. j clin virol. 2007 mar;38(3):210–6. doi:10.1016/j.jcv.2006.12.015 pmid:17229589 dominguez ea, taber lh, couch rb. comparison of rapid diagnostic techniques for respiratory syncytial and influenza a virus respiratory infections in young children. j clin microbiol. 1993 sep;31(9):2286–90. pmid:8408545 irmen ke, kelleher jj. use of monoclonal antibodies for rapid diagnosis of respiratory viruses in a community hospital. clin diagn lab immunol. 2000 may;7(3):396–403. pmid:10799452 uyeki tm. influenza diagnosis and treatment in children: a review of studies on clinically useful tests and antiviral treatment for influenza. pediatr infect dis j. 2003 feb;22(2):164–77. doi:10.1097/01.inf.0000050458.35010.b6 pmid:12586981 chartrand c, leeflang mm, minion j, brewer t, pai m. accuracy of rapid influenza diagnostic tests: a meta-analysis. ann intern med. 2012 apr 3;156(7):500–11. doi:10.7326/0003-4819-156-7-201204030-00403 pmid:22371850 duan p, zhang l, han h, et al. clinical application of monoclonal antibodies against influenza a and b in rapid diagnosis of influenza by apaap. journal of cellular and molecular immunoology. 1991;7(1):45–8. huai y, guan x, liu s, uyeki tm, jiang h, klena j, et al. clinical characteristics and factors associated with severe acute respiratory infection and influenza among children in jingzhou, china. influenza other respir viruses. 2017 03;11(2):148–56. doi:10.1111/irv.12419 pmid:27465959 yu j, xie z, zhang t, lu y, fan h, yang d, et al. comparison of the prevalence of respiratory viruses in patients with acute respiratory infections at different hospital settings in north china, 2012-2015. bmc infect dis. 2018 02 8;18(1):72. doi:10.1186/s12879-018-2982-3 pmid:29422011 roth de, gaffey mf, smith-romero e, fitzpatrick t, morris sk. acute respiratory infection case definitions for young children: a systematic review of community-based epidemiologic studies in south asia. trop med int health. 2015 dec;20(12):1607–20. doi:10.1111/tmi.12592 pmid:26327605 zazueta-garcãa r, canizalez-roman a, flores-villaseã±or h, martãnez-garcia j, llausas-vargas a, leã³n-sicairos n. effectiveness of two rapid influenza tests in comparison to reverse transcription-pcr for influenza a diagnosis. j infect dev ctries. 2014 03 13;8(3):331–8. doi:10.3855/jidc.3726 pmid:24619265 kim dk, poudel b. tools to detect influenza virus. yonsei med j. 2013 may 1;54(3):560–6. doi:10.3349/ymj.2013.54.3.560 pmid:23549796 2015.6.1.008_or_shield.en.indd original research wpsar vol 6, no 1, 2015 | doi: 10.5365/wpsar.2015.6.1.008www.wpro.who.int/wpsar 1 a la trobe university, bendigo, victoria, australia. b queensland museum, brisbane, queensland, australia. c menzies school of health research, darwin, northern territory, australia. d ngalkanbuy health centre, galiwin’ku, northern territory, australia. e royal darwin hospital, darwin, northern territory, australia. f university of queensland, brisbane, queensland, australia. submitted: 14 january 2015; published: 6 march 2015 doi: 10.5365/wpsar.2015.6.1.008 introduction: parasitic infections can adversely impact health, nutritional status and educational attainment. this study investigated hookworm and other intestinal parasites in an aboriginal community in australia from 1994 to 1996. methods: seven surveys for intestinal parasites were conducted by a quantitative formol-ether method on faecal samples. serological testing was conducted for strongyloides stercoralis and toxocara canis igg by enzyme-linked immunosorbent assays. results: of the 314 participants, infections were as follows: trichuris trichiura (86%); hookworm, predominantly ancylostoma duodenale (36%); entamoeba spp. (e. histolytica complex [e. histolytica, e. dispar and e. moskovski], e. coli and e. hartmanni) (25%); s. stercoralis (19%); rodentolepis nana (16%); and giardia duodenalis (10%). serological diagnosis for 29 individuals showed that 28% were positive for s. stercoralis and 21% for t. canis. there was a decrease in the proportion positive for hookworm over the two-year period but not for the other parasite species. the presence of hookworm, t. trichiura and entamoeba spp. was significantly greater in 5–14 year olds (n = 87) than in 0–4 year olds (n = 41), while the presence of s. stercoralis, r. nana, g. duodenalis and entamoeba spp. in 5–14 year olds was significantly greater than 15–69 year olds (n = 91). discussion: faecal testing indicated a very high prevalence of intestinal parasites, especially in schoolchildren. the decrease in percentage positive for hookworm over the two years was likely due to the albendazole deworming programme, and recent evidence indicates that the prevalence of hookworm is now low. however there was no sustained decrease in percentage positive for the other parasite species. p arasitic infections adversely affect health. heavy infections with helminths cause clinical disease including anaemia, diarrhoea and malabsorption of nutrients.1–5 moderate or light infections cause morbidity by adversely affecting nutritional status6 and affect educational outcomes by impairing cognitive processes.7 trichuris trichiura infection has been associated with poor immunogenicity from bcg vaccination.8 several intestinal parasite species occur in australia with a high prevalence in rural and remote aboriginal communities. hookworm (predominantly ancylostoma duodenale) occurs mainly north of 22°s particularly near the coast.9–12 whipworm (t. trichiura) is rare in western australia,9 more common in queensland1 and also occurs in the northern territory (nt).10,13,14 strongyloides stercoralis is more widespread, occurring intestinal parasites of children and adults in a remote aboriginal community of the northern territory, australia, 1994–1996 jennifer shield,a kieran aland,b thérèse kearns,c glenda gongdjalk,d deborah holt,c bart curriece and paul procivf correspondence to jennifer shield (e-mail: j.shield@latrobe.edu.au). throughout the northern two thirds of australia (jennifer shield, la trobe university, unpublished collated data). dwarf tapeworm (rodentolepis nana [= hymenolepis nana]) and the protozoan giardia duodenalis are common in aboriginal communities throughout western australia,9 queensland1 and the nt.10,13 entamoeba spp. occur throughout australia.1,15,16 among the pathogenic species of intestinal protozoa, entamoeba histolytica is the second leading cause of death globally after malaria,15 and g. duodenalis causes chronic diarrhoea, malabsorption and weight loss and contributes to stunting and cognitive impairment in children.17 in the past, morbidity of parasitic infections was assessed on a species-by-species basis. current evidence, however, suggests that when a person is wpsar vol 6, no 1, 2015 | doi: 10.5365/wpsar.2015.6.1.008 www.wpro.who.int/wpsar2 shield et alintestinal parasites in an australian aboriginal community, 1994–1996 and the presence of s. stercoralis larvae, r. nana eggs, g. duodenalis, entamoeba spp. and other protozoa cysts or trophozoites were noted. the number of eggs per ml faeces was calculated by multiplying the count by a factor (total volume of faecal suspension/[volume of the faecal sample x volume of sample counted]). the size of the multiplication factor varied between 10 and 42. the counts were adjusted for faecal consistency using the stoll correction factors.19 determination of hookworm species vermiculite cultures of 10 faecal samples with a substantial number of eggs in the direct smear were prepared to determine the species of hookworm based on the morphology of the cultured filariform larvae.20 adult hookworms were collected from the digestive system on autopsy of stray dogs. twelve adult worms were measured and examined in detail to determine the species. serology (specifi c serum immunoglobulin g [igg] tests) venous blood was collected from 39 adults and children as part of their normal routine testing and igg levels against strongyloides and toxocara were measured using enzyme-linked immunosorbent assay. the strongyloides assay used s. ratti l3 as the antigen and had an estimated sensitivity of 93% and specificity of 95%.21 the toxocara assay used t. canis excretory/secretory antigen as the antigen and had an estimated sensitivity of 91% and specificity of 86%.22 statistical analysis a parasitic infection was defined as specimens positive by the quantitative formol-ether method only. survey results included participants who were present at more than one survey; only the first examination was included. geometric means of egg counts of infected people were calculated using logarithm to base e (ln) transformed data and egg counts recovered by antilogarithm. when the egg counts for a. duodenale and t. trichiura were grouped using a logarithmic scale, the plotted frequencies had a normal distribution, indicating that statistical methods applicable to normal distributions were valid when performed on logarithmically transformed egg count infected with two or more parasite species, there is an additive or multiplicative impact on nutrition and organ pathology.18 there is a shortage of published surveys of intestinal parasites in australia. this paper documents the prevalence of intestinal parasites in a remote aboriginal community in australia from 1994 to 1996. historical data such as these are rare and are of intrinsic value. in addition, they provided baseline data with which to compare the current situation, enabling the evaluation of deworming strategies. methods subjects and location this study was conducted in a remote township, in north-eastern arnhem land between july 1994 and october 1996. most residents belong to the yolngu group of aboriginal australians. collection of faecal samples each household was visited by the parasitologist and health educator. information about hookworm infection, transmission and diagnosis was given in the local language using prepared illustrations, and then a faecal sample was requested. each person was given a labelled rectangular plastic container with a snap-on lid and a brown paper bag. the containers were collected the following morning. sampling occurred during seven time periods: july 1994 (1 to 18 july), october 1994 (30 september to 19 october), december 1994 (8 to 19 december), may 1995 (5 to 22 may), august 1995 (4 to 19 august), december 1995 (20 november to 19 december) and october 1996 (exact dates not recorded). collections in november and december were during the wet season; the other collections were during the dry season. examination of faecal samples in the field laboratory, a direct saline wet preparation of the faecal specimen was examined microscopically as soon as possible, and a 0.91ml aliquot of faeces was preserved in 5–10ml 4% formaldehyde for later examination by a quantitative formol-ether count method. hookworm and t. trichiura eggs were counted wpsar vol 6, no 1, 2015 | doi: 10.5365/wpsar.2015.6.1.008www.wpro.who.int/wpsar 3 intestinal parasites in an australian aboriginal community, 1994–1996shield et al serological diagnosis for 39 individuals showed that 28% were positive and 18% equivocal for s. stercoralis, and 21% were positive and 5% equivocal for t. canis. the median age for the 21 persons for whom ages were known was 32 years (iqr 24 to 41). comparison of the seven surveys there were 55 (18%) participants represented in more than one survey. there was significant variation in the percentage of participants positive for hookworm and s. stercoralis over the study period (table 1). the percentage positive for hookworm was high in october 1994 preceding the wet season, low in august 1995 following the introduction of an albendazole treatment programme and high in december 1995 during the wet season. there was a significant decrease between october 1994 and october 1996 (p < 0.0002; table 1). the percentage positive for s. stercoralis was high in may 1995, low in august 1995 following the introduction of albendazole, high in december 1995 (wet season) and low in october 1996 (table 1). there was no significant variation in the percentage of participants positive for t. trichiura, r. nana, g. duodenalis or entamoeba spp. there was no significant variation in the geometric mean egg counts of positive samples during the seven surveys for hookworm (table 1). for t. trichiura, the geometric mean of egg counts in december 1995 (2200 eggs/ml) was significantly greater than those of all the other surveys (p < 0.001) (table 1). this result was likely due to markedly increased egg counts in children (0–14 years) at that time. comparisons of age groups and sex the median age of the 219 participants whose age was known was 11 years (iqr 6 to 29) (figure 1); 129 children were aged 0–14 years (approximately 37% of the child population) and 91 adults were aged 15 years and above (approximately 12% of the adult population). there was a significantly greater percentage positive in schoolchildren (5–14 years) compared with preschool children (0–4 years) for any parasitic infection, hookworm, t. trichiura and entamoeba spp, and a significantly lower percentage positive in adults (≥15 years) compared with schoolchildren for s. stercoralis, r. nana, g. duodenalis and entamoeba spp (figure 1). hookworm, t. trichiura, r. nana and data. intensity of infection was classified according to world health organization categories23 (assuming that eggs/ml is approximately equivalent to eggs/g faeces). the difference of two independent proportions was compared by calculation of the z ratio, taking the two-tail value for p (probability). where the number infected or the number negative was too small for this test, the fisher’s exact test was used. ln transformed mean egg counts were compared using a two-tailed t-test for independent samples and unequal variances. frequency data were analysed using yates’ chi-square test. a p-value of < 0.05 was considered significant. all statistical calculations were performed by the online calculators provided by the vassarstats web site for statistical calculations (http://www.vassarstats. net/). graphs were drawn using excel. ethics statement ethical approval for this study was obtained from the human research ethics committee of the nt department of health and menzies school of health research (registration no. ec00153), approval number 94/19. everyone who tested positive for parasites by the field smear was notified and asked to go to the health centre for treatment. results intestinal parasites: combined faecal count data from all surveys of the 314 participants, the overall percentage positive for intestinal parasites was 89% and for one or more helminth species was 88%. the most common parasite species was t. trichiura (86% positive) followed by hookworm (36%), entamoeba spp. [e. histolytica complex: e. coli and e. hartmanni] (29%); s. stercoralis (19%), r. nana (16%) and g. duodenalis (10%). enterobius vermicularis, chilomastix mesnilii, retortamonas intestinalis and blastocystis spp. were present in a small number of participants. the intensity of infection for the 314 participants for hookworm was: negative: 64%; light (1–1999 eggs/ml faeces): 35%; moderate (2000–3999 eggs/ml): 1%; and for t. trichiura was: negative: 16%; light (1–999 eggs/ml): 50%; moderate (1000–9999 eggs/ml): 30%; and heavy (≥ 10000 eggs/ml): 4%. wpsar vol 6, no 1, 2015 | doi: 10.5365/wpsar.2015.6.1.008 www.wpro.who.int/wpsar4 shield et alintestinal parasites in an australian aboriginal community, 1994–1996 table 1. number and proportion of participants who tested positive for intestinal parasites by survey, northern territory, australia, july 1994 to october 1996, n = 383 survey date no. people tested any parasite hookworm t. trichiura s. stercoralis r. nana g. duodenalis entamoeba spp positive no. (%) positive no. (%) geom mean (eggs/ml) [exp (ci)] positive no. (%) geom mean (eggs/ml) [exp (ci)] positive no. (%) positive no. (%) positive no. (%) positive no. (%) jul 1994 62 57 (92) 19 (31) 200 53 (86) 820 13 (21) 15 (24) 10 (16) 18 (29) [120–350] [520–1300] oct 1994 76 73 (94) 43 (57)* 180 68 (89) 560 13 (16) 13 (16) 9 (11) 22 (27) [120–250] [390–800] dec 1994 37 31 (84) 17 (46) 110 29 (78) 400 4 (11) 3 (8) 3 (8) 11 (30) [61–190] [260–620] may 1995 48 44 (92) 16 (33) 120 40 (83) 800 17 (35)* 7 (15) 0 (0) 10 (21) [73–200] [460–1400] jun 1995 single-dose albendazole deworming programme begins, replacing previous programmes using pyrantel and mebendazole. aug 1995 63 57 (90) 7 (11)*† 130 53 (84) 520 6 (19)* 12 (19) 4 (6) 23 (37) [42–420] [360–740] dec 1995 44 41 (93) 15 (34)* 140 38 (86) 2200*‡ 13 (30)* 12 (27) 5 (11) 17 (27) [79–250] [1400–3300] oct 1996 53 46 (87) 13 (25)† 100 44 (83) 380 4 (8)* 7 (13) 5 (9) 21 (40) [53–180] [230–640] total§ 383 349 (91) 130 (34) 100 325 (85) 650 70 (18) 69 (18) 36 (9) 122 (32) [110–190] [550–780] exp (ci), exponentially recovered confidence interval; geom mean, geometric mean for those infected. * significant difference with the previous survey. † significant difference with the survey conducted approximately one year earlier. ‡ significant difference with the geometric means of all other surveys. § some participants were included in more than one survey. 0 20 40 60 80 100 0–1 n = 11 2–4 n = 30 5–14 n = 87 15 and above n = 91 % p os iti ve a. duodenale t. trichiura s. stercoralis r. nana g. duodenalis entamoeba spp a. duodenale t. trichiura s. stercoralis r. nana g. duodenalis entamoeba spp figure 1. proportion of intestinal parasites detected among participants by age group* and species, northern territory, australia, july 1994 to october 1996 * age group was available for 219 (70%) of participants, 0–4 years age group was divided into 0–1 and 2–4. age group (years) wpsar vol 6, no 1, 2015 | doi: 10.5365/wpsar.2015.6.1.008www.wpro.who.int/wpsar 5 intestinal parasites in an australian aboriginal community, 1994–1996shield et al faecal testing were the same as in two smaller studies in the same region at about the same time,10,13 but the percentages positive in our study were greater. this likely reflects the greater sensitivity of the quantitative formolether method. even though this method was much more sensitive than direct smears due to the relatively large amount of faeces examined, it likely underestimated the true prevalence; for example, 28% of a small group (n = 39) were positive for s. stercoralis by serology compared with 19% positive by formol-ether count (n = 314). a study of a similar method using ethyl acetate instead of ether showed that it was much less sensitive than agar plate culture in detecting s. stercoralis.24 a positive test by serology indicates a current infection because if the s. stercoralis are eliminated, the antibody levels decrease to negative within three to six months of effective treatment.25,26 although the larvae harvested from the vermiculite cultures were ancylostoma sp, probably a. duodenale, the presence of necator americanus cannot be excluded. a. ceylanicum may also be present, as it is present in dogs in australia27 and has also been detected in people.28 the observed seasonal variations in the percentage positive for hookworm provide additional evidence that the hookworm was at least predominantly a. duodenale. the variation is likely due to larval hypobiosis during the dry season and increased transmission during the wet season.29 the lifespan of adult a. duodenale is approximately six months. larvae that enter the body late in the wet season do not develop but remain in the tissues and mature late in the dry season. treatment entamoeba spp. were present in 0–1 year old children. all six species were present in 2–4 year old children (figure 1). for t. trichiura, the geometric mean egg count in infected schoolchildren (1200 eggs/ml) was significantly greater than in both preschool children (400 eggs/ml) and adults (410 eggs/ml) (p < 0.001). for hookworm, there was no significant difference between geometric mean egg counts for the age groups. the sex was known for 100 males and 115 females. the percentage positive in males was significantly greater than in females for hookworm (47% compared with 30%; p = 0.012), t. trichiura (92% compared with 79%; p = 0.0082) and g. duodenalis (17% compared with 6%; p = 0.011). polyparasitism of the 314 participants, 152 (48%) were infected with more than one helminth species and 109 (35%) were infected with one or more helminth species and one or more protozoa species (figure 2). there was a statistically significant association of helminth infection with protozoa infection (p = 0.0039). hookworm species infective larvae recovered from vermiculite faecal cultures were all identified as ancylostoma spp., most likely ancylostoma duodenale. adult ancylostoma collected from dogs were all identified as a. caninum. discussion these results indicate a very high prevalence of infection with one or more intestinal parasite species in this community between 1994 and 1996 despite the deworming programme in children that was conducted from before the study began until the present time. in 1994, the standard treatment was pyrantel 20mg/kg as a single dose or mebendazole 100mg twice daily for three days. from may 1995 albendazole (single dose of 200mg for children 8 to < 10kg body weight and 400mg for children ≥ 10kg) was the usual anthelmintic treatment during yearly child health checks; for adults and children with suspected or confirmed gastrointestinal helminths, the standard treatment was daily albendazole 400mg for three days. the parasite species detected by 0 10 20 30 40 50 0 n = 37 1 n = 125 2 n = 101 3 n = 46 4 n = 5 % in fe ct ed % helminths only % helminths + protozoa figure 2. proportion of helminth infections with and without protozoa infection, northern territory, australia, july 1994 to october 1996, (n = 314)* * there was a statistically significant association of helminth infection with protozoa infection (p = 0.0039). number of helmith species wpsar vol 6, no 1, 2015 | doi: 10.5365/wpsar.2015.6.1.008 www.wpro.who.int/wpsar6 shield et alintestinal parasites in an australian aboriginal community, 1994–1996 t. canis is common in dogs and is found as eggproducing adult worms mainly in pups. our finding of specific igg against t. canis in 21% of people tested indicates a significant level of human exposure to infection (putatively via egg ingestion). by way of comparison, 43% of another aboriginal group in far north-eastern arnhem land,10 11.1% of another nt group and 5.7% of the general australian population34 were seropositive in the 1990s. the clinical significance of t. canis in the aboriginal population is unknown. the larvae can cause hepatic disease (visceral larva migrans) or eye lesions (ocular larva migrans).19 visceral larva migrans has been occasionally diagnosed in the non-aboriginal population of the nt, but confirmed cases in the aboriginal population have not occurred in recent years (bart currie, royal darwin hospital, unpublished data). the variations in s. stercoralis percentage positive are difficult to interpret. intermittent larval shedding has been documented in this species35 and may explain the variations seen. another possibility is that pyrantel, mebendazole or albendazole treatment was not eradicating infection but causing only a temporary decrease in larval output. currently, the use of ivermectin is greatly improving the efficacy of treatment.25 the effectiveness of community-wide ivermectin treatment to reduce s. stercoralis infection is currently being assessed.26 the results of the october 1996 survey suggest that the albendazole treatment programme was reducing the prevalence of hookworm as the percentage of participants positive for hookworm decreased significantly at a time of year when an increase would be expected from maturation of dormant larvae of a. duodenale. this result is also consistent with the eradication of the dormant larvae in those who had received albendazole treatment. initial treatment with albendazole was likely responsible for the drop in percentage positive for hookworm in august 1995. recent work indicates that a. duodenale is now well controlled,36,37 but a high proportion of the children tested were positive for t. trichiura and r. nana.37 a recent review of laboratory data indicated that the detection rates of t. trichiura in the nt have substantially decreased over the last decade.14 singledose albendazole is much less effective at eliminating t. trichiura in children than in adults38 and is not effective against r. nana.39 our results are consistent with pyrantel eradicates adult a. duodenale but not the dormant larvae.29 the peak in percentage positive in october 1994, late in the dry season, is consistent with this. increased transmission during the wet season accounts for the high percentage positive for a. duodenale in december 1994 and 1995. the very high prevalence of infection with two or more intestinal parasites observed in this study is of concern; individuals with multiple infections suffer increased morbidity18 due to the differing pathologies caused by the different parasitic species. a greater prevalence of hookworm, t. trichiura and g. duodenalis in males than females has been observed elsewhere.30 the greater percentages positive for intestinal parasites in school-aged children compared with other age groups follows patterns elsewhere.18 there was an appreciable percentage positive in very young children of 2–4 years at this critical stage in their development. the finding that r. nana and g. duodenalis infections occur primarily in children under 15 years of age is consistent with findings in aboriginal communities throughout western australia.9 the percentage of participants positive for hookworm and t. trichiura in schoolchildren compared with adults were not significantly different, but the infection intensity of t. trichiura in schoolchildren was significantly greater than in adults. the finding of an appreciable percentage of adult participants positive for hookworm, t. trichiura and s. stercoralis justifies regular anthelmintic treatment of adults as well as children. the lower percentage of adult participants positive for s. stercoralis compared with schoolchildren is of interest since infection with this species can be life-long in the absence of effective treatment.31 single-dose albendazole does not usually eliminate the infection.25 the presence of a. caninum in dogs raises the possibility of zoonotic infections in humans, which may be asymptomatic or cause eosinophilic enteritis.32 seroepidemiological studies showed it to be common in queensland in the 1990s.32 while eosinophilic enteritis has been recognized in the non-aboriginal population of the nt, it has not been documented as a clinical issue in the aboriginal population,33 possibly because of the albendazole deworming programme. wpsar vol 6, no 1, 2015 | doi: 10.5365/wpsar.2015.6.1.008www.wpro.who.int/wpsar 7 intestinal parasites in an australian aboriginal community, 1994–1996shield et al other species of intestinal parasites. this historical data adds to our limited knowledge of parasitic infections in the 1990s and provides a base line for comparison with the current situation, enabling the evaluation of deworming strategies. confl icts of interest none declared. funding this work was funded by a national health and medical research council grant through the public health research and development committee to the ngalkanbuy health centre at galiwin’ku for hookworm research. kieran aland was supported by a commonwealth postgraduate scholarship at the university of queensland. acknowledgements the authors gratefully acknowledge the people of the galiwin’ku community who provided faecal and blood samples to enable this study to take place; john walker and rogan lee, pathology west, institute of clinical pathology and medical research, westmead, sydney, nsw, who provided the serology results and details of the method used, respectively; and david shield, who was the statistical consultant for the data analysis. references: 1. jose dg, welch js. growth retardation, anaemia and infection, with malabsorption and infestation of the bowel. the syndrome of protein-calorie malnutrition in australian aboriginal children. the medical journal of australia, 1970, 1:349–356. pmid:5439141 2. layrisse m, roche m. the relationship between anemia and hookworm infection. results of surveys of rural venezuelan population. american journal of hygiene, 1964, 79:279–301. pmid:14159948 3. lucas sb et al. aberrant form of hymenolepis nana: possible opportunistic infection in immunosuppressed patients. lancet, 1979, 2:1372–1373. doi:10.1016/s0140-6736(79)92859-9 pmid:92715 4. cooper es, bundy da, henry fj. chronic dysentery, stunting, and whipworm infestation. lancet, 1986, 2:280–281. doi:10.1016/ s0140-6736(86)92093-3 pmid:2874297 5. speare r. fatal strongyloidiasis: lessons from the literature. in: second national workshop on strongyloidiasis. brisbane, queensland, 2003 (http://www.jcu.edu.au/school/phtm/phtm/ss/ acrrm-cd/cd-index.pdf, accessed 11 february 2015). 6. stephenson ls et al. treatment with a single dose of albendazole improves growth of kenyan schoolchildren with hookworm, trichuris trichiura, and ascaris lumbricoides infections. the american journal of tropical medicine and hygiene, 1989, 41:78–87. pmid:2764230 with this. the efficacy of albendazole against t. trichiura, r. nana and g. duodenalis is improved if given daily for three days.38,39 it is not possible to conclude whether the entamoeba spp. observed were of public health significance. determination of the extent of the recognized pathogens e. histolytica and e. moshkovski present in participants would require molecular faecal testing that is available now but not at the time of the study. a factor that probably contributes to the high prevalence of parasites is the large number of people per house,40 putting pressure on food preparation, washing and sanitary facilities.41 recently, there has been an attempt to address this issue with the addition of new and renovated houses. there is an urgent need for a more holistic approach to the control of the remaining parasites, combining health promotion and adequate treatment. a key ingredient is community empowerment through respectful adult community education. in this study, the samples were not randomly selected, sample sizes were small and largely made up of newly recruited participants. there was variation in the proportion of children (45–70%) and in the maleto-female ratio (0.8 to 1.7) from survey to survey. the pooled values used to compare different age groups, sex and multiple infections did not take into account the seasonal variation in hookworm or s. stercoralis. documentation of anthelmintic treatment at the individual level depended on health centre records which were incomplete; therefore we examined the effect of the treatment programme on the prevalence of the parasites. there was no attempt to distinguish between new infections and those detected in the previous surveys. conclusions in spite of the above limitations, this study highlights the very high prevalence of infection with intestinal parasites, frequently with more than one species, in this remote aboriginal community in the 1990s, particularly in schoolchildren. the survey data showed that, following the introduction of a yearly single-dose albendazole treatment programme for children, there was a significant reduction in the percentage of participants positive for hookworm but no significant change in the wpsar vol 6, no 1, 2015 | doi: 10.5365/wpsar.2015.6.1.008 www.wpro.who.int/wpsar8 shield et alintestinal parasites in an australian aboriginal community, 1994–1996 25. page wa, dempsey k, mccarthy js. utility of serological follow-up of chronic strongyloidiasis after anthelminthic chemotherapy. transactions of the royal society of tropical medicine and hygiene, 2006, 100:1056–1062. doi:10.1016/j. trstmh.2005.12.006 pmid:16551471 26. kearns t et al. ivermectin mass drug administration program to treat endemic scabies and strongyloidiasis in a remote aboriginal community in northern australia. tropical medicine & international health, 2011, 16 s1;198–199. 27. palmer cs et al. the veterinary and public health significance of hookworm in dogs and cats in australia and the status of a. ceylanicum. veterinary parasitology, 2007, 145:304–313. doi:10.1016/j.vetpar.2006.12.018 pmid:17276602 28. koehler av et al. genetic characterization of selected gastrointestinal parasites associated with humans using a mutation scanningcoupled approach. electrophoresis, 2013, 34:1720–1722. doi:10.1002/elps.201300100 pmid:23592267 29. prociv p, luke ra. evidence for larval hypobiosis in australian strains of ancylostoma duodenale. transactions of the royal society of tropical medicine and hygiene, 1995, 89:379. doi:10.1016/0035-9203(95)90016-0 pmid:7570868 30. zuk m, mckean ka. sex differences in parasite infections: patterns and processes. international journal for parasitology, 1996, 26:1009–1023. doi:10.1016/s0020-7519(96)00086-0 pmid:8982783 31. adams m, page w, speare r. strongyloidiasis: an issue in aboriginal communities. rural and remote health, 2003, 3:152. pmid:15877491 32. prociv p. zoonotic hookworm infections (ancylostomosis). in palmer sr, lord soulsby, simpson dih, editors. zoonoses: biology, clinical practice, and public health control. oxford, oxford university press, 1998, p. 803–822. 33. currie b, anstey n. eosinophilic enteritis in the northern territory. the medical journal of australia, 1991, 154:71. pmid:1984596 34. conner g. diagnosis and epidemiology of toxocara canis infection in humans (masters of applied science thesis). sydney, university of technology, 1990. 35. dreyer g et al. patterns of detection of strongyloides stercoralis in stool specimens: implications for diagnosis and clinical trials. journal of clinical microbiology, 1996, 34:2569–2571. pmid:8880521 36. davies j et al. hookworm in the northern territory: down but not out. the medical journal of australia, 2013, 198:278–281. doi:10.5694/mja12.11615 pmid:23496406 37. kearns t et al. faecal parasitology of human specimens collected from a remote aboriginal community in the northern territory. asm/actm poster abstract, parasitology masterclass 14–17 july, 2011, cairns. annals of the actm, 2011, 12:55. 38. horton j. albendazole: a review of anthelmintic efficacy and safety in humans. parasitology, 2000, 121 suppl;s113–132. doi:10.1017/s0031182000007290 pmid:11386684 39. reynoldson ja et al. efficacy of albendazole against giardia and hookworm in a remote aboriginal community in the north of western australia. acta tropica, 1998, 71:27–44. doi:10.1016/ s0001-706x(98)00048-5 pmid:9776141 40. castles i. census counts for small areas: northern territory – 1991 census of population and housing. canberra, australian bureau of statistics, 1993. 41. li sq et al. from infancy to young adulthood: health status in the northern territory. darwin, northern territory government department of health and community services, 2006. 7. ezeamama ae et al. helminth infection and cognitive impairment among filipino children. the american journal of tropical medicine and hygiene, 2005, 72:540–548. pmid:15891127 8. elias d et al. poor immunogenicity of bcg in helminth infected population is associated with increased in vitro tgf-beta production. vaccine, 2008, 26:3897–3902. doi:10.1016/j. vaccine.2008.04.083 pmid:18554755 9. jones hi. intestinal parasite infections in western australian aborigines. the medical journal of australia, 1980, 2:375–380. pmid:7453610 10. flannery g, white n. immunological parameters in northeast arnhem land aborigines: consequences of changing settlement patterns and lifestyles. in: schell m, bilsborough a, editors. urban ecology and health in the third world. society for the study of human biology symposium series. melbourne, cambridge university press, 1993, pp. 202–220. 11. prociv p, luke ra. the changing epidemiology of human hookworm infection in australia. the medical journal of australia, 1995, 162:150–154. pmid:7854229 12. hopkins rm et al. the prevalence of hookworm infection, iron deficiency and anaemia in an aboriginal community in north-west australia. the medical journal of australia, 1997, 166:241– 244. pmid:9076267 13. fryar d, hagan s. pilot screening program for intestinal parasites and anaemia in adults in a top end aboriginal community. northern territory communicable diseases bulletin, 1997, 4:20–21. 14. crowe al et al. decreasing prevalence of trichuris trichiura (whipworm) in the northern territory from 2002 to 2012. the medical journal of australia, 2014, 200:286–289. doi:10.5694/mja13.00141 pmid:24641155 15. van hal sj et al. amoebiasis: current status in australia. the medical journal of australia, 2007, 186:412–416. pmid:17437396 16. mccarthy js et al. endemic invasive amoebiasis in northern australia. the medical journal of australia, 2002, 177:570. pmid:12429010 17. ali sa, hill dr. giardia intestinalis. current opinion in infectious diseases, 2003, 16:453–460. doi:10.1097/00001432200310000-00012 pmid:14501998 18. drake lj, bundy da. multiple helminth infections in children: impact and control. parasitology, 2001, 122 suppl;s73–81. doi:10.1017/s0031182000017662 pmid:11442199 19. beaver pc, jung rc, cupp ew. clinical parasitology. 9th ed. philadelphia, lea & febiger, 1984. 20. basic laboratory methods in medical parasitology. geneva, world health organization, 1991. 21. grove di. diagnosis. in: grove di, editor. strongyloidiasis a major roundworm infection of man. london, taylor and francis, 1989, pp. 175–197. 22. jacquier p et al. immunodiagnosis of toxocarosis in humans: evaluation of a new enzyme-linked immunosorbent assay kit. journal of clinical microbiology, 1991, 29:1831–1835. pmid:1774303 23. montresor a et al. guidelines for the evaluation of soil-transmitted helminthiasis and schistosomiasis at community level: a guide for managers of control programmes. geneva, world health organization, 1998. 24. intapan pm et al. comparison of the quantitative formalin ethyl acetate concentration technique and agar plate culture for diagnosis of human strongyloidiasis. journal of clinical microbiology, 2005, 43:1932–1933. doi:10.1128/ jcm.43.4.1932-1933.2005 pmid:15815023 https://ojs.wpro.who.int/ 1wpsar vol 13, no 1, 2022 | doi: 10.5365/wpsar.2022.13.1.772 covid-19: brief report a department of medicine, raja isteri pengiran anak saleha hospital, bandar seri begawan, brunei darussalam. b department of medicine, pengiran muda mahkota pengiran muda haji al-muhtadee billah hospital, tutong, brunei darussalam. c pengiran anak puteri rashidah sa’adatul bolkiah institute of health sciences, universiti brunei darussalam, bandar seri begawan, brunei darussalam. d department of public health, ministry of health, bandar seri begawan, brunei darussalam. published: 6 january 2022 doi: 10.5365/wpsar.2022.13.1.772 in any infectious disease outbreak, early diagnosis, isolation of cases and quarantine of contacts are central to disease containment. in brunei darussalam, suspected cases of coronavirus disease 2019 (covid-19) were quarantined either at home or at designated centres and were tested immediately for severe acute respiratory syndrome coronavirus 2. we report on 10 cases of covid-19 that initially tested negative for covid-19 and were positive on re-testing after becoming symptomatic. these cases comprised 3.8% of the 266 total confirmed covid-19 cases in brunei darussalam as of 9 july 2021, when this study was conducted. all the cases were in quarantine at home and were tested early during their quarantine period. since then, home quarantine has been replaced by quarantine at designated centres only, with testing on the 12th day of quarantine. t he pandemic of coronavirus disease 2019 (covid-19) caused by severe acute respiratory syndrome coronavirus 2 (sars-cov-2) continues, and, as of 2 november 2021, the cumulative number of cases reported globally was over 246 million and the cumulative number of deaths nearly 5 million.1 in any infectious disease outbreak, early diagnosis, contact tracing and effective quarantine and isolation are central to disease containment.2–4 the reverse transcription polymerase chain reaction (rt-pcr) assay is currently the most reliable test for diagnosis of covid-19 during the symptomatic phase;4 however, testing a patient too early after infection can lead to false-negative results.5,6 on 9 july 2021, when this study was conducted, there were 266 confirmed covid-19 cases in brunei darussalam: 8 patients remained in the national isolation centre, 255 patients recovered and 3 died.7 according to the world health organization (who), brunei darussalam remained at national transmission assessment stage 1, with only imported cases, from 6 may 2020 to 7 august 2021, when locally transmitted cases again began to be reported.7,8 suspected cases were defined according to the who definition,9 and incoming travellers were placed in quarantine, either at home or at designated quarantine centres. testing was conducted only with rt-pcr immediately upon commencement of quarantine. we report 10 confirmed covid-19 cases that initially tested negative in quarantine and the impact of this finding on our protocols during the first month of the covid-19 outbreak in brunei darussalam. methods a descriptive study was conducted of data retrieved from a prospectively maintained excel® database that was created to monitor covid-19 patients. covid-19 cases (n=12) with initial negative tests within 14 days (the maximum incubation period of sars-cov-2) of diagnosis of covid-19 were included. two patients were excluded, as the initial negative tests were performed >14 days (24 and 36 days) before the day of diagnosis. the data extracted for analyses were age, sex, number and dates of rt-pcr tests before admission, covid-19 patients with negative results on initial screening: experience of brunei darussalam vui heng chong,a,b,c justin wong,d muhammad syafiq abdullah,a,c rosmonaliza asli,a riamiza natalie momin,a siti nabilah ahmed,a norhasyimah tamin,a babu ivan manib and pui lin chonga correspondence to vui heng chong (email: chongvuih@yahoo.com.uk) wpsar vol 13, no 1, 2022 | doi: 10.5365/wpsar.2022.13.1.772 https://ojs.wpro.who.int/2 chong et alcovid-19 patients with negative results on initial screening league. two days after an initial negative test, case 10 was retested because of persistent symptoms and tested positive. all the cases except case 3 were categorized as mild. two cases (cases 8 and 9) were hospitalized twice when they retested positive after discharge. impact on protocols two notable changes were made to the covid-19 protocols in brunei darussalam during this period. first, home quarantine was abolished for incoming travellers within 1 month of the outbreak on 20 march 2020. second, the testing schedule during quarantine was revised for local suspected cases from immediate testing only to testing on the 4th day of quarantine. discussion in our study, 3.8% of covid-19 cases in brunei darussalam as of 9 july 2021 initially tested negative. initial negatives or delayed positives are a concern if they are missed cases that become vehicles for continued covid-19 spread.10 fortunately, these 10 cases were under the mandatory 14-day quarantine and had repeat tests, usually because of development of symptoms. no additional transmission was linked to these 10 cases. our experience confirms that testing early, especially during the pre-symptomatic phase, can lead to false-negative results.11,12 therefore, our testing protocol was revised several times, from immediate testing of cases with initial negative results to the current (as of december 2020) testing on the 12th day of quarantine. cases are still tested if they become symptomatic or if symptoms persist. incoming travellers are tested according to a schedule based on the countries to which they had travelled (travel passes a, b and c). testing can be done immediately or 1 day after arrival from countries listed for travel pass a under certain conditions (pre-travel approved entry permit, covid-19 testing within 72 hours of arrival, payment for post-arrival rt-pcr and a health tracking application installed on mobile phone), on the 5th day of quarantine for travel pass b and on the 12th day of quarantine for travel pass c. home quarantine for returned travellers presented some difficulty in monitoring without personnel on site or a remote monitoring system. all patients were given symptoms, disease category, outcomes and possible source of infection. ethics statement this study was conducted in accordance with the provisions of the declaration of helsinki. results cases ten (3.8%) suspected cases (median age, 41.5 years; range, 28–72; 4 males and 6 females) had a negative covid-19 test before testing positive (table 1), with a median of 5 days (range, 1–10) between the negative and positive tests (table 1). all 10 cases were initially tested because they were contacts of confirmed covid-19 cases, and all were quarantining at home. cases 1–7 were in a family cluster (cluster a) of 15 confirmed covid-19 cases. three cases within this cluster had returned from vacations on three separate flights, two flights arriving 5 and 16 days after the first flight. the index case in this cluster was the spouse of case 5, who returned home on the first flight and developed symptoms soon after arrival. she had been symptomatic for 3 days before being tested and was confirmed positive for sars-cov-2. all the subsequent cases that tested negative before testing positive, except case 5, developed symptoms during home quarantine after an initial negative test. case 5 was retested at the request of the family, and, although remaining asymptomatic, also retested positive. case 7 (spouse of case 6) had two negative tests: initially as a contact of the index case and then when case 6 retested positive. she tested positive on the third test, conducted after the onset of symptoms. case 8 (cluster b, 25 cases) was a contact of her spouse and daughter, who had tested positive for sarscov-2 earlier. she later developed symptoms and retested positive 7 days after her initial negative test. her spouse had contracted the infection from a friend. case 9 (cluster c, 7 cases) was a contact of a sibling who had returned from travel. the second test was conducted because of persistent symptoms. case 10 (cluster d, 14 cases) was a contact of her spouse, who contracted the infection from a work colwpsar vol 13, no 1, 2022 | doi: 10.5365/wpsar.2022.13.1.772https://ojs.wpro.who.int/ 3 covid-19 patients with negative results on initial screeningchong et al and we have continued to maintain all preventive and monitoring measures while simultaneously adjusting our protocols and processes. our findings can be generalized to other settings, especially those in which containment is still possible. in conclusion, our experience highlights the importance of monitoring people in quarantine and revising protocols to control outbreak situations. undetected and missed cases can lead to continued disease transmission. since home quarantine was abolished and testing of those in quarantine was delayed to later in the quarantine period, we have not registered any further covid-19 cases with initial negative tests. the lessons learnt can be applied in other countries and to outbreaks of other infectious diseases. conflicts of interest none. funding none. an information leaflet and a designated number to call if required, for example if they developed symptoms. it is possible that some patients may not call the number, because of unawareness, having misplaced the information leaflet or choosing not to inform the authorities of the progress of their illness. there were also logistical issues for those who required retesting, because of lack of personnel for testing in home quarantine. quarantine in designated centres was found to be preferable, as covid-19 is easier to monitor in known locations, of which there are only a few. in home quarantine, quarantine regulations may not be adhered to strictly, and continued transmission can occur. our findings show that the pandemic situation is fluid and that protocols and processes must therefore be revised continually. this is particularly important as the pandemic is complicated by sars-cov-2 variants of concern. missed cases are the driver of continued disease transmission. at the time this study was conducted, brunei darussalam had remained at who stage 1 of transmission (imported cases only) for over one year,7,8 case (cluster) age/ sex number of initial negative tests for sarscov-2 number of days between index positive confirmation and testing number of days between negative test and positive test indication for repeat testing (days after initial test) disease severity possible source of infection 1 (a) 45/f 1 1 3 symptoms (3) mild all cases were contacts of the index case (spouse of case 5) who had returned from an overseas trip 2 (a) 33/m 1 1 4 symptoms (3) mild 3 (a) 50/f 1 1 4 symptoms (4) moderate 4 (a) 51/f 1 1 4 symptoms (4) mild 5 (a) 72/m 1 0 6 asymptomatic, family request mild 6 (a) 43/m 1 0 6 symptoms (5) mild 7 (a) 36/f 2 1 7 10 spouse (case 6) tested positive symptoms (7) mild 8 (b) 40/f 1 0 7 symptoms (7) mild contact of two confirmed cases: spouse (admitted 7 days earlier) and daughter (admitted 5 days earlier) 9 (c) 28/m 1 0 8 symptoms (4) mild sibling was a confirmed case 10 (d) 39/f 1 2 1 persistent symptoms (1) mild contact of two confirmed cases: spouse (admitted 3 days earlier) and son (admitted 2 days earlier) table 1. characteristics and outcomes of cases with initial negative tests before testing positive for covid-19 wpsar vol 13, no 1, 2022 | doi: 10.5365/wpsar.2022.13.1.772 https://ojs.wpro.who.int/4 chong et alcovid-19 patients with negative results on initial screening 7. press release on the current situation of covid-19 infection in brunei darussalam. bandar seri begawan: ministry of health; 2021 (http://www.moh.gov.bn/lists/latest%20news/newdispform. aspx?id=943, accessed 15 july 2021). 8. covid-19 in brunei darussalam (situation report 32). selangor: who representative office for malaysia, brunei darussalam and singapore; 2021 (https://www.who.int/brunei/internal-publications-detail/covid-19-in-brunei-darussalam-situation-report-32, accessed 1 october 2021). 9. who covid-19 case definition. geneva: world health organization; 2020 (https://www.who.int/publications/i/item/who2019-ncov-surveillance_case_definition-2020.2, accessed 15 july 2021). 10. zhang j, tian s, lou j, chen y. familial cluster of covid-19 infection from an asymptomatic. crit care. 2020;24(1):119. doi:10.1186/ s13054-020-2817-7 pmid:32220236 11. kimball a, hatfield km, arons m, james a, taylor j, spicer k, et al. asymptomatic and presymptomatic sars-cov-2 infections in residents of a long-term care skilled nursing facility – king county, washington, march 2020. mmwr morb mortal wkly rep. 2020;69(13):377–81. doi:10.15585/mmwr.mm6913e1 pmid:32240128 12. tong zd, tang a, li kf, li p, wang hl, yi jp, et al. potential presymptomatic transmission of sars-cov-2, zhejiang province, china, 2020. emerg infect dis. 2020;26(5):1052–4. doi:10.3201/ eid2605.200198 pmid:32091386 references 1. weekly epidemiological update on covid-19 – 2 november 2021. geneva: world health organization; 2021 (https://www.who.int/ publications/m/item/weekly-epidemiological-update-on-covid19---2-november-2021, accessed 5 november 2021). 2. salathé m, althaus cl, neher r, stringhini s, hodcroft e, fellay j, et al. covid-19 epidemic in switzerland: on the importance of testing, contact tracing and isolation. swiss med wkly. 2020;150:w20225. doi:10.4414/smw.2020.20225 pmid:32191813 3. hellewell j, abbott s, gimma a, bosse ni, jarvis ci, russell tw, et al. feasibility of controlling covid-19 outbreaks by isolation of cases and contacts. lancet glob health. 2020;8:e488–96. doi:10.1016/s2214-109x(20)30074-7 pmid:32119825 4. cheng mp, papenburg j, desjardins m, kanjilal s, quach c, libman m, et al. diagnostic testing for severe acute respiratory syndrome-related coronavirus-2: a narrative review. ann intern med. 2020;172(11):726–34. doi:10.7326/m20-1301 pmid:32282894 5. kelly jc, dombrowksi m, o’neil-callahan m, kernberg as, frolova ai, stout mj. false-negative testing for severe acute respiratory syndrome coronavirus 2: considerations in obstetrical care. am j obstet gynecol mfm. 2020;2(3):100130. doi:10.1016/j.ajogmf.2020.100130 pmid:32346672 6. xiao at, tong yx, zhang s. false negative of rt-pcr and prolonged nucleic acid conversion in covid-19: rather than recurrence. j med virol. 2020;92(10):1755–6. doi:10.1002/jmv.25855 pmid:32270882 https://ojs.wpro.who.int/ 1wpsar vol 11, no 4, 2020 | doi: 10.5365/wpsar.2020.11.3.003 regional analysis a end tb and leprosy unit, world health organization regional office for the western pacific, manila, philippines. b department of global health and development, london school of hygiene and tropical medicine, london, united kingdom of great britain and northern ireland. published: 28 december 2020 doi: 10.5365/wpsar.2020.11.3.003 t uberculosis (tb) remains a major public health issue globally. in 2018, worldwide, an estimated 10 million people contracted tb and 1.5 million died from the disease.1 since 2015, the who end tb strategy has guided national tb responses by providing principles and essential programme components in three fundamental pillars.2 the strategy set ambitious targets for ending tb: reducing the incidence by 90% and deaths by 95% in 2035, as compared with 2015, and eliminating catastrophic costs for tbaffected households.2 to reach these targets, new tools and strategies must be developed and introduced, with universal access to and better use of existing technologies.3 the third pillar of the strategy, “intensified research and innovation”, thus promotes intensification of research on tb at all levels and empowerment of a strong, self-sustained tb research community in low and middle-income countries with high tb burdens.4 the moscow declaration to end tb (2017) and the political declaration of the united nations high-level meeting on tb (2018) also made bold commitments for action on tb research and innovation.3 in 2020, who member states adopted the global strategy for tb research and innovation for action to meet these commitments.3 intensified tb research, unlike routine tb surveillance and programme activities, is difficult to monitor and evaluate quantitatively. research varies in type, end-point and outcome, from basic scientific research to operational research. moreover, research is conducted by the entire scientific community, which includes academia and research institutions that are not necessarily linked to national tb programmes. bibliometric analysis is widely used in the health sciences and public health5,6 to measure scientific productivity and to assess trends and patterns in research output.7,8 bibliometric analyses of research on tb have been reported in several publications, with various objectives.9–11 ramos et al.10 showed increasing research activity in the field of tb during the period 1997–2006 and reported that less research was conducted in countries with the highest estimated numbers of tb cases. most recently, nafade et al.9 found that the annual growth rate of tb publications between 2007 and 2016 was 7.3% globally, with the highest rate (13.1%) in brazil, the russian “intensified tb research and innovation” is one of the three pillars of the end tb strategy. to assess achievements and gaps in tuberculosis (tb) research productivity in countries and areas of the western pacific region quantitatively, a bibliometric analysis was carried out by examining trends in the numbers of publications on tb indexed in pubmed between 2000 and 2019 and by comparing them with trends in publications on other selected major infectious diseases for the same period. the number of publications on tb in the region increased by 3.2 times during the period, from 534 in 2000–2004 to 1714 in 2015–2019, as compared with 2.9 times each for hiv, hepatitis and malaria. the number increased by 46% in 2005–2009, 79% in 2010–2014 and 23% in 2015–2019, as compared with each previous 5-year period. the average annual growth rate between 2000 and 2018 was 8.8%. china accounted for 34.8% of the total number of publications on tb in the region. increases in tb research were observed in most countries and areas in the region, particularly in those with a high tb burden. the number of publications on tb remained low, however, in the lao people’s democratic republic, mongolia and pacific island countries. countries are encouraged to implement the set of actions proposed in the global strategy for tb research and innovation to accelerate progress towards ending tb. intensified research on tuberculosis in the western pacific region: a bibliometric analysis, 2000–2019 fukushi morishita,a takuya yamanaka,a,b and tauhid islama correspondence to fukushi morishita (email: morishitaf@who.int) wpsar vol 11, no 4, 2020 | doi: 10.5365/wpsar.2020.11.3.003 https://ojs.wpro.who.int/2 morishita et alintensified research on tuberculosis in the western pacific region, 2000-2019 areas for which mesh terms were not available, which were cook islands, kiribati, marshall islands, nauru, niue, commonwealth of the northern mariana islands, solomon islands, tokelau, tuvalu and wallis and futuna. the numbers of publications from pacific island countries and areas were aggregated in the results because of the small number of publications. duplicates of publications were removed from the regional aggregate counts. in this paper, the numbers of publications from china excluded those from hong kong sar (china), macao sar (china) and taiwan (china) as they were separately-defined geographical mesh terms. we examined trends in the numbers of publications on the four major infectious diseases at regional level over 5-year periods between 2000 and 2019 and computed the percentage increase from the level in 2000–2004, growth rates in each 5-year period and average annual growth rates for the period 2000–2018 (the year 2019 was removed because of the time required to indexing16). we further examined trends in the numbers of publications on tb in countries over the 5-year periods between 2000 and 2019 and computed the percentage changes from the level in 2000–2004 and average 5-year growth rates. the proportions of publications on tb from china, other regional highburden countries and non-high-burden countries were also investigated for the same periods. ethics statements ethical clearance was not required as this was an analysis of available published research. results the number of publications indexed in pubmed on the four major infectious diseases in countries and areas in the who western pacific region has increased by 3.0 times over the past two decades (fig. 1), from 2609 in 2000–2004 to 7770 in 2015–2019 (table 1). during the 5-year periods between 2000 and 2019, articles on hiv were published most often, followed by publications on hepatitis, tb and malaria. in the period 2000–2019, publications on tb accounted for 21% of all publications on the four diseases in the region, which was less than for hiv (36%) and hepatitis (32%) and more than for malaria (11%) (fig. 2). the proportion of publications on tb varied by country and area, from ≤10% for papua federation, india, china and south africa (brics). no studies are available, however, of regional productivity of research on tb. the who western pacific region (wpr) consists of 37 countries and areas, with a total population of 1.9 billion. the region is diverse, including only one country with populations of more than 1 billion and small pacific island countries with a few thousand residents and also countries with high and intermediate tb burdens and others in the pre-elimination stage. the region accounted for 18% of global tb incidence in 2018.1 the regional framework for action on implementation of the end tb strategy in the western pacific 2016–2020,12 in line with the end tb strategy, also emphasized the importance of increasing capacity for research on tb for the development, uptake and optimum use of new interventions and proposed actions such as expanding national tb research networks, developing national tb research plans and priorities, building capacity for tb research and increasing tb research funding. the aims of this analysis were to: (i) examine regional trends in the numbers of publications on tb indexed in pubmed in the past two decades; (ii) to compare the trends with those for other, selected major infectious diseases; and (iii) to assess intensified tb research activity in countries and areas in the region quantitatively. methods a bibliometric analysis was performed with the rismed package13 in r (cran: comprehensive r archive network at https://cran.r-project.org/), which permits extraction of bibliographic content from the united states national center for biotechnology information databases, including pubmed. we extracted metadata from scientific publications indexed in pubmed with a combination of medical subject headings (mesh) terms for four major infectious diseases, “tuberculosis”, “hiv infection”, “hepatitis” and “malaria”, and the names of countries and areas in the western pacific region. we then constructed a regional database of the number of publications per year during the period 2000–2019 at 13 september 2020. the four diseases were selected on the basis of the global burden of each as a single infectious disease14 and regional priorities in “reaching the unreached”.15 we did not include countries and wpsar vol 11, no 4, 2020 | doi: 10.5365/wpsar.2020.11.3.003https://ojs.wpro.who.int/ 3 intensified research on tuberculosis in the western pacific region, 2000-2019morishita et al in 2015–2019 compared to the previous 5-year period. the average annual growth rate in the number of publications on tb between 2000 and 2018 was 8.8%. between 2000 and 2019, there were 4425 publications on tb in the region (table 2). china accounted for the largest proportion (34.8%), followed by japan (15.5%), taiwan (china) (10.7%), the republic of korea (7.5%), australia (6.5%) and viet nam (5.5%). these six countries and areas accounted for >80% of all publications on tb in the region; pacific island countries accounted for only 1%. the number of publications on new guinea and the lao people’s democratic republic to ≥30% for japan, new zealand, the philippines and the republic of korea, excluding brunei darussalam and macao sar (china), which had fewer than 10 publications (fig. 2). the number of publications on tb from the region increased by 3.2 times, from 534 in 2000–2004 to 1714 in 2015–2019 (2.9 times each for hiv, hepatitis and malaria). table 1 shows the growth rate in the number of publications on tb in the region increased by 46% in 2005–2009, 79% in 2010–2014 and 23% fig. 1. numbers of publications on major infectious diseases from the who western pacific region indexed in pubmed over 5-year periods, 2000–2019 table 1. numbers and growth rates of publications from the who western pacific region indexed in pubmed on major infectious diseases over 5-year periods, 2000–2019 number of publications % increase, compared to the 2000–2004 level growth rate compared to the previous 5-year period average annual growth rate for 2000–20182000– 2004 2005– 2009 2010– 2014 2015– 2019 2005– 2009 2010– 2014 2015– 2019 2005– 2009 2010– 2014 2015– 2019 hiv 881 1644 2557 2691 187% 290% 297% 87% 56% 2% 10.5% hepatitis 883 1254 2035 2530 142% 230% 287% 42% 62% 24% 9.1% tuberculosis 534 781 1396 1714 146% 261% 321% 46% 79% 23% 8.8% malaria 311 369 714 907 119% 230% 292% 19% 93% 27% 15.6% total 2609 4048 6702 7770 155% 257% 298% 55% 66% 16% 9.3% wpsar vol 11, no 4, 2020 | doi: 10.5365/wpsar.2020.11.3.003 https://ojs.wpro.who.int/4 morishita et alintensified research on tuberculosis in the western pacific region, 2000-2019 pdr, people’s democratic republic; sar, special administrative region. n/a = not applicable fig. 2. proportions of publications on tb, hiv, hepatitis and malaria from countries and areas in the western pacific region indexed in pubmed, 2000–2019 table 2. numbers of publications on tb from countries and areas in the western pacific region indexed in pubmed over 5-year periods, 2000–2019 country and area number of publications % change from 2000–2004 to 2015–2019 growth rate between 2010–2014 and 2015–20192000–2004 2005–2009 2010–2014 2015–2019 total (n/%) australia 46 57 94 91 288 (6.5%) 198% -3% brunei darussalam 0 4 0 0 4 (0.1%) n/a n/a cambodia 14 28 44 31 117 (2.6%) 221% -30% china 94 189 477 782 1542 (34.8%) 832% 64% china, hong kong sar 42 43 29 23 137 (3.1%) 55% -21% china, macao sar 0 1 0 1 2 (0.05%) n/a n/a china, taiwan 41 99 177 157 474 (10.7%) 383% -11% japan 166 174 195 153 688 (15.5%) 92% -22% lao pdr 2 3 8 6 19 (0.4%) 300% -25% malaysia 18 20 27 28 93 (2.1%) 156% 4% mongolia 2 7 4 9 22 (0.5%) 450% 125% new zealand 25 41 50 36 152 (3.4%) 144% -28% papua new guinea 0 7 18 22 47 (1.1%) n/a 22% philippines 24 24 39 50 137 (3.1%) 208% 28% republic of korea 0 13 123 198 334 (7.5%) n/a 61% singapore 18 16 18 25 77 (1.7%) 139% 39% viet nam 38 53 70 84 245 (5.5%) 221% 20% pacific island countries 4 2 23 18 47 (1.1%) 450% -22% western pacific region 534 781 1396 1714 4425 (100%) 321% 23% pics, pacific island countries; pdr, people’s democratic republic; sar, special administrative region; wpr, western pacific region. wpsar vol 11, no 4, 2020 | doi: 10.5365/wpsar.2020.11.3.003https://ojs.wpro.who.int/ 5 intensified research on tuberculosis in the western pacific region, 2000-2019morishita et al discussion our analysis demonstrates increasing research on the four major infectious diseases, including tb, in the western pacific region over the past two decades. the importance of intensifying research has been stressed in global and regional strategies, not only for tb2,12 but also for other communicable disease programmes, including hiv,17 hepatitis18 and malaria.19 it is anticipated that increasing trends in the number of publications reflect accelerated research and innovations to better control and eliminate the diseases. tb has tended to increase in most countries and areas in the region in the past two decades, including in cambodia, papua new guinea, the philippines and viet nam, with the highest percentage increase in china (832%) (fig. 3). the number of publications on tb over the 5-year periods remained at <10 in the lao people’s democratic republic and mongolia, although increasing trends are observed. the percentage of publications on tb from china out of the total number from the region increased from 17.6% in 2000–2004 to 45.6% in 2015–2019, while those of other high-tb burden countries and of other countries have shrunk (fig. 4). pics, pacific island countries; pdr, people’s democratic republic; sar, special administrative region; wpr, who western pacific region. fig. 3. number of publications on tb from countries and areas in the western pacific region indexed in pubmed over 5-year periods, 2000–2019 wpsar vol 11, no 4, 2020 | doi: 10.5365/wpsar.2020.11.3.003 https://ojs.wpro.who.int/6 morishita et alintensified research on tuberculosis in the western pacific region, 2000-2019 ing domestic research capacity.9,22 ongoing initiatives to intensify collaboration in research on tb within the brics tb research network23 may accelerate this trend in coming years. developing national tb research agendas and strategic plans and establishing national tb research networks creates an environment for high-quality tb research and innovation.3,12 in viet nam, where the number of publications on tb has increased continuously over the past two decades, the national tb research agenda is explicitly defined in the national tb strategic plan 2015–2020.24 furthermore, in 2015, the ministry of health formed the viet nam integrated centre for tb and lung disease research (victory) under the management of the national lung hospital and national tuberculosis programme, to lead in implementing and coordinating research on tb and other lung diseases and to establish a research network.12,25 this has fostered collaboration on tb research within and outside the country and also led to institutionalized research within programmes to ensure that research outputs inform policy and practice and improve programme performance.25,26 effective bilateral and multilateral north–south and south–south collaborations among researchers and research institutions in highand in lowand middleincome countries are essential to promote relevant after 2015, when the end tb strategy was introduced, the 5-year trend in the number of publications on tb continued to grow, demonstrating successful implementation of the third pillar of the strategy in the region. the increasing trends observed in lowand middle-income countries with high burdens of tb, such as cambodia, china, papua new guinea, the philippines and viet nam, may be considered to reflect empowered research communities and enhanced research collaboration on tb in these countries. the annual regional growth rate in the number of publications on tb in 2000–2018 was 8.8%, which was slightly higher than the global annual growth rate of 7.3% for 2006–2017.9 government commitment and leadership play pivotal roles in advancing research and innovation for tb, and increasing financial investments is critical. our analysis showed that china’s contribution to regional tb research productivity was remarkable, especially in 2015–2019. china’s national tb strategic plan 2016–2020 emphasizes the importance of intensified national research and development on tb prevention and care and of promoting international cooperation.20 accordingly, the national annual budget allocated for research and surveys on tb in china increased dramatically between 2015 and 2019, by six times, from us$ 5.7 million to us$ 34.3 million.21 this may be one reason for the substantial increase in the number of publications, with rapid economic development enhancfig. 4. proportions of publications on tb from china, other high-burden countries and non-high-burden countries/areas in the western pacific region indexed in pubmed over 5-year periods, 2000–2019 hbc, high-burden country. other hbcs: cambodia, the lao people’s democratic republic, mongolia, papua new guinea, the philippines, viet nam. non-hbcs: other countries and areas included in the analysis. wpsar vol 11, no 4, 2020 | doi: 10.5365/wpsar.2020.11.3.003https://ojs.wpro.who.int/ 7 intensified research on tuberculosis in the western pacific region, 2000-2019morishita et al published articles, which could reveal gaps in evidence for the regional tb response. this was beyond the scope of the present analysis but should be addressed in future studies. despite these limitations, the results of our bibliometric analysis indicate contemporary trends in tb research productivity in countries and areas in the region and highlight achievements and gaps in implementing the third pillar of the end tb strategy. countries are encouraged to implement the actions proposed in the global strategy for tb research and innovation to accelerate progress towards ending tb.3 the who regional office for the western pacific will continue to play a catalytic role in fostering regional tb research collaboration and providing technical assistance to build research capacity in national tb programmes in the region. acknowledgements none. conflicts of interest none. funding none. references 1. global tuberculosis report 2019. geneva: world health organization; 2019. available from: https://apps.who.int/iris/bitstream/han dle/10665/329368/9789241565714-eng.pdf. 2. sixty-seventh world health assembly. global strategy and targets for tuberculosis prevention, care and control after 2015. geneva: world health organization; 2014. available from: https://apps.who.int/gb/ ebwha/pdf_files/wha67-rec1/a67_2014_rec1-en.pdf. 3. global strategy for tuberculosis research and innovation. geneva: world health organization; 2020. available from: https://apps. who.int/gb/ebwha/pdf_files/eb146/b146_r7-en.pdf. 4. a global action framework for tb research in support of the third pillar of who’s end tb strategy. geneva: world health organization; 2015. available from: https://apps.who.int/iris/bitstream/ handle/10665/195772/9789241509756_eng.pdf;jsessionid=cc 70274c418150d32845be57b2e77a74?sequence=1. 5. clarke a, gatineau m, grimaud o, royer-devaux s, wyn-roberts n, le bis i, et al. a bibliometric overview of public health research in europe. eur j public health. 2007;17(suppl 1):43–9. doi:10.1093/eurpub/ckm063 research and to cross-fertilize research capacity.3 several tb research networks are active in the who western pacific region, including the centre for research excellence in tuberculosis control in australia27 and the asian tuberculosis research and clinical trials integrated organizational network among members of the asia–pacific economic cooperation.28 national tb research institutions, such as the research institute of tuberculosis in japan and the korean institute of tuberculosis in republic of korea, have long contributed to international research on tb and to capacity-building in the region. molton et al.,29 however, reported less intra-asian tb research collaboration than in other regions, which they considered a missed opportunity to optimize regional research funding, capacity-building and a region-specific research agenda. further enhancement of tb research collaboration is desirable in the region, building on existing networks and initiatives. although there is increasing tb research collaboration and productivity in the region, our analysis indicates that the output remains relatively low in several countries with higher burdens of tb such as lao people’s democratic republic and mongolia as well as in pacific island countries, where tb incidence per capita can be high. operational, implementation, health system and social science research on tb to generate contextspecific evidence to improve programme performance3 could be prioritized in those countries, coordinated by national programmes, to gain the immediate benefits of research. our study has several limitations. first, we included publications only from the pubmed database and only those found with mesh terms for both diseases and country names. we thus excluded relevant publications in other databases or not indexed as mesh terms, regional publications from asia and oceania with no country-specific indexing and several pacific island countries for which mesh terms were not available. second, the time required for indexing might have affected the completeness of indexing, especially for 2019, although we ensured that sufficient time (257 days) had elapsed between the end date of 2019 and the date of data extraction. these limitations may have resulted in an underestimate of the number of publications. lastly, we did not investigate regional trends and patterns by research type and programmatic areas in wpsar vol 11, no 4, 2020 | doi: 10.5365/wpsar.2020.11.3.003 https://ojs.wpro.who.int/8 morishita et alintensified research on tuberculosis in the western pacific region, 2000-2019 18. regional action plan for viral hepatitis in the western pacific 2016–2020. manila: world health organization regional office for the western pacific; 2016. available from: https://iris.wpro. who.int/bitstream/handle/10665.1/13141/97892906177617_ eng.pdf. 19. regional action framework for malaria control and elimination in the western pacific (2016–2020). manila: world health organization regional office for the western pacific; 2017. available from: https://iris.wpro.who.int/handle/10665.1/13578. 20. 13th five-year national tb prevention and treatment plan. beijing: general office of the state council of the people’s republic of china; 2017. 21. global tuberculosis database [internet]. geneva: world health organization; 2020. available from: https://www.who.int/tb/country/ data/download/en/. 22. bai j, li w, huang ym, guo y. bibliometric study of research and development for neglected diseases in the brics. infect dis poverty. 2016;5(1):89. doi:10.1186/s40249-016-0182-1 23. castor k, mota fb, da silva rm, cabral bp, maciel el, de almeida in, et al. mapping the tuberculosis scientific landscape among brics countries: a bibliometric and network analysis. mem inst oswaldo cruz. 2020;115(1):e190342. doi:10.1590/007402760190342 24. national strategic plan for tuberculosis control for the period 2015–2020. hanoi: national tuberculosis control programme viet nam; 2014. 25. hoa nb, nhung nv, kumar amv, harries ad. the effects of placing an operational research fellow within the viet nam national tuberculosis programme. public health action. 2016;6(4):273– 6. doi:10.5588/pha.16.0044 26. hoa nb, nhung nv. national tuberculosis patients cost survey: research findings lead to change in policy and practice, viet nam. public health action. 2019;9(2):50–2. doi:10.5588/ pha.16.0044 27. centre of research excellence in tuberculosis control. available from: https://www.tbcre.org.au/, accessed 7 september 2020. 28. the apec health working group’s work plan for 2019. asia– pacific economic cooperation; 2019. available from: https:// www.google.com/url?sa=t&rct=j&q=&esrc=s&source=web&c d=&ved=2ahukewiqo7oz_dxrahvqqd4khb9wbjwqfjabeg qiarab&url=http%3a%2f%2fapec.org%2f-%2fmedia%2ff iles%2fgroups%2fhrd%2fendorsed-2019-hwg-work-plan. docx&usg=aovvaw2lzqdymkv-a17vsvic6ulp. 29. molton js, singh s, chen lj, paton ni. international tuberculosis research collaborations within asia. bmc res notes. 2017;10(1):462. doi:10.1186/s13104-017-2769-4 6. sweileh wm, wickramage k, pottie k, hui c, roberts b, sawalha af, et al. bibliometric analysis of global migration health research in peer-reviewed literature (2000-2016). bmc public health. 2018 jun 20;18(1):777. doi:10.1186/s12889-018-5689-x pmid:29925353 7. thompson df, walker ck. a descriptive and historical review of bibliometrics with applications to medical sciences. pharmacotherapy. 2015;35(6):551–9. doi:10.1002/phar.1586 8. xu z, yu d. a bibliometrics analysis on big data research (2009– 2018). j data inf manag. 2019;1:3–15. doi:10.1007/s42488019-00001-2 9. nafade v, nash m, huddart s, pande t, gebreselassie n, lienhardt c, et al. a bibliometric analysis of tuberculosis research, 2007–2016. plos one. 2018;13(6):e0199706. doi:10.1371/ journal.pone.0199706 10. ramos jm, padilla s, masiá m, gutiérrez f. a bibliometric analysis of tuberculosis research indexed in pubmed, 1997–2006. int j tuberc lung dis. 2008;12(12):1461–8. 11. sweileh wm, abutaha as, sawalha af, al-khalil s, al-jabi sw, zyoud sh. bibliometric analysis of worldwide publications on multi-, extensively, and totally drug-resistant tuberculosis (2006–2015). multidiscip respir med. 2016;11:45. doi:10.1186/s40248-016-0081-0 12. regional framework for action on implementation of the end tb strategy in the western pacific, 2016–2020. manila: world health organization regional office for the western pacific; 2016. available from: https://iris.wpro.who.int/bitstream/handle/10665.1/13131/9789290617556_eng.pdf. 13. kovalchik s. cran – package rismed [internet]. bethesda (md): national center for biotechnology information; 2017. available from: https://cran.r-project.org/web/packages/rismed/rismed.pdf. 14. james sl, abate d, abate kh, abay sm, abbafati c, abbasi n, et al. gbd 2017 global, regional, and national incidence, prevalence, and years lived with disability for 354 diseases and injuries for 195 countries and territories, 1990–2017: a systematic analysis for the global burden of disease study 2017. lancet. 2018;392(10159):1789–858. 15. for the future towards the healthiest and safest region. a vision for who work with member states and partners in the western pacific. manila: world health organization regional office for the western pacific; 2020. available from: https://iris.wpro.who.int/ handle/10665.1/14476. 16. irwin an, rackham d. comparison of the time-to-indexing in pubmed between biomedical journals according to impact factor, discipline, and focus. res social admin pharm. 2017;13(2):389–93. 17. global health sector strategy on hiv 2016–2021, toward ending aids. geneva: world health organization; 2016. available from: https://www.who.int/hiv/strategy2016-2021/ghss-hiv/en/. delay in health-care-seeking treatment among tuberculosis patients in japan: what are the implications for control in the era of universal health coverage? original research reina yoshikawa,a lisa kawatsu,b kazuhiro uchimura,b and akihiro ohkadob,c a department of general internal medicine, rakuwakai marutamachi hospital, kyoto, japan. b department of epidemiology and clinical research, the research institute of tuberculosis, japan anti-tuberculosis association, tokyo, japan. c nagasaki university graduate school of biomedical sciences, nagasaki, japan. correspondence to reina yoshikawa (email: reinamimi@gmail.com). to cite this article: yoshikawa r, kawatsu l, uchimura k, ohkado a. delay in health-care-seeking treatment among tuberculosis patients in japan: what are the implications for control in the era of universal health coverage? western pac surveill response j. 2020 sep;11(2). doi:10.5365/wpsar.2019.10.1.010 objectives: to study the trends in and risk factors for patient delay (the time from the onset of symptoms to the initial doctor visit) in pulmonary tuberculosis (ptb) using three temporal categories − short (2 weeks to methods: a descriptive cross-sectional study was conducted by analysing japanese tb surveillance data from patients with symptomatic ptb registered between 2007 and 2017 (n = 88 351). results: while the proportion of patients with short delay has decreased significantly (p p = 0.0015 and p p p discussion: despite the implementation of universal health coverage decades ago, patient delay remains a challenge in japan. our study identified various risk factors, many of which could have been resolved if appropriate social protection measures were in place, indicating shortcomings in universal health coverage in japan and the need for continued effort to ensure that no one is left behind. tuberculosis (tb) continues to be a major global health issue, with 10 million people having newly diagnosed disease and 1.2 million dying from it in 2018.1 the world health organization (who) developed the end tb strategy in 2014, with three major targets to be achieved by 2035: a 90% reduction in tb incidence compared with 2015, a 95% reduction in tb deaths compared with 2015, and no affected families facing catastrophic financial losses from tb.2 early case detection is one of the key components of this strategy, not only to allow for early diagnosis and treatment, and thus better treatment outcomes for patients, but also to terminate the chain of transmission.3 yet previous studies have shown that delays on the part of the patient and the health system have continued to be unacceptably high, with factors such as unemployment and poverty playing major roles in affecting a delay in diagnosis.4,5 increasingly, it is recognized that policy efforts are needed to address these socioeconomic factors in line with the overarching framework for achieving universal health coverage (uhc).6 japan introduced the first national policy for social health insurance in 1922. later, in response to the call for welfare policies to mitigate social instability after second world war, uhc was achieved in 1961 through the co-existence of different public health insurance schemes.7 additionally, japan has maintained cost equality across schemes by regulating fee schedules and co-payment rates, with charges for elderly people and children being one third of those for other adults.7 uhc ensures free access to any medical institution, and community-based health services are available at municipal public health centres, including tb screening for high-risk groups in the community. today, japanese people have access to one of the most affordable, high-quality and egalitarian health systems in the world.8 yet, the rate of decrease in japan’s tb notification rate has stagnated since the 1990s, reaching 13.3 cases/100 000 population in 2017, and the prospect of achieving the national target of less than 10 cases/100 000 by 2020 seems unlikely.9 one of the possible issues lies with the time from the onset of symptoms of tb to the initial doctor visit, which is known as patient delay; while the proportion of patients with tb experiencing doctor delay, the time from the initial doctor visit to diagnosis, has remained relatively constant, the proportion with patient delay has been increasing during the past 20 years.9 in 2017, the proportion of patients with symptomatic pulmonary tb (ptb) who took more than 2 months to access medical services after the onset of symptoms was as high as 20.0%.9 the objectives of this study were to conduct a detailed analysis of patient delay in japan, investigate the risk factors for patient delay and discuss implications for social protection measures for tb patients, especially in a country where uhc was achieved decades ago. methods we conducted a cross-sectional study of symptomatic ptb patients, newly notified to the nationwide tb surveillance system, japan tuberculosis surveillance (jtbs), between 1 january 2007 and 31 december 2017. in the current jtbs system, providing information regarding symptoms for all patients notified as having ptb is mandatory. a symptomatic ptb patient is defined as someone who has complained not only of respiratory but also of any other general symptoms. japan tuberculosis surveillance system japan introduced its first nationwide computerized tb surveillance system in 1987. tb is a notifiable disease, and public health centres are responsible for collecting and entering data about notified patients into the system. data items included in the jtbs system are sex, age, nationality, occupation, whether the patient has health insurance and what type, history of homelessness, history of treatment, symptoms, sputum smear result, presence of diabetes mellitus (dm), and delay information, including date of symptom onset and date of initial doctor visit. the data are summarized monthly and annually and are available online. mechanisms to ensure data quality include the system’s automatic verification programme, as well as regular meetings attended by staff from hospitals and public health centres. periodic refresher trainings on data entry are also provided to staff at public health centres across the nation. definition of patient delay patient delay is defined in the jtbs system as the time between the date of symptoms onset and the initial doctor visit, and it is automatically calculated and categorized as 2 months between the onset of symptoms and the initial doctor visit and no delay defined as 9–11 we first extracted data from all ptb patients who were registered as having symptoms, then re-categorized them into four definitions of delay: no delay, short delay (≥2 weeks to data analysis and ethics the numbers and proportions of symptomatic ptb patients in the three categories of delay were summarized, and trends were tested using the cochran−armitage test. the trends in the proportion of those in each delay category were also calculated by country of birth. more than 60% of japan-born patients are elderly and they tend to present after a shorter delay, while the majority of younger patients are foreign born and they tend to present after a longer delay.9 due to this heterogeneity in age variance by country of birth, comparisons were made for all age groups combined and then repeated for those who were younger than 65 years. characteristics of patients with and without patient delay were summarized and proportions were compared; multinomial logistic regression analysis was conducted to identify possible risk factors for the three categories of patient delay. risk factor variables were selected based on the associated factors identified in previous studies.8–11 r version 3.1.3 (r development core team, vienna, austria) was used for all statistical analyses. ethics statement the study protocol was approved by the institutional review board of the research institute of tuberculosis, japan anti-tuberculosis association (reference no. rit/irb 30–9). informed consent was deemed not necessary by the review board, as the surveillance data do not contain personal identifiers. results between 2007 and 2017, a cumulative total of 134 869 symptomatic ptb patients were newly notified, of whom 88 351 (65.5%) had information regarding patient delay. annual trends by duration of patient delay the annual number of symptomatic ptb patients with any delay decreased from 5242 in 2007 to 3093 in 2017 (fig. 1). the proportion of tb patients with a short delay decreased from 32.5% (3371/10 368) in 2007 to 28.3% (1781/6295) in 2017 (p p = 0.0015) for those with a medium delay and from 3.7% (386/10 368) to 3.8% (241/6295) for those with a long delay (p fig. 2. fig. 1. number and proportion of patients with symptomatic pulmonary tuberculosis categorized by length of delay in seeking care, japan, 2007–2017* click to download figure 1. jpg, 293kb fig. 2. annual trends in the proportion of patients with pulmonary tuberculosis and (a) short delay (≥2 weeks to click to download figure 2. jpg, 421kb characteristics of patients with delay the characteristics of ptb patients with and without delay are summarized in table 1. compared with patients who did not delay seeking treatment, the proportions of men, patients aged 25–54 years, and foreign-born patients were higher in those who delayed seeking treatment. similarly, the proportions of those receiving public assistance and those without insurance were higher among those with patient delay, and they were higher among those with long delay compared with those with short or medium delay. the proportions of those receiving public assistance among the different types of health insurance status were 11.1% for those with long delay, 8.9% for those with medium delay, and 8.1% for those with short delay. for those who had no insurance among the different types of health insurance status the proportions were 3.1% for those with long delay, 2.4% for those with medium delay, and 1.1% for those with short delay. the proportions of full-time workers (those employed full-time on a midto long-term contract), temporary workers (those employed part-time or on a short-term contract) and those with a history of homelessness (those who had been homeless within 1 year of diagnosis) were also higher in those with delay than in those without delay. table 1. characteristics of patients with symptomatic pulmonary tuberculosis with and without delay in seeking care, by length of delay, japan, 2007–2017 (n = 88 351) click to download table 1. jpg, 654kb risk factors for patient delay the results of the multinomial regression analysis are summarized in table 2. male sex was a significant risk factor for long delay (adjusted odds ratio [aor] = 1.17, p p p p p table 2. results of the multinomial regression analysis for odds ratio (95% confidence interval [ci]) for delays in seeking care among patients with pulmonary tuberculosis, japan, 2007–2017 click to download table 2. jpg, 507kb not having health insurance was a risk factor for all types of delay (aor = 1.63, p p p p p p p p reporting respiratory symptoms and dm were identified as risk factors for delay. in contrast, being aged ≥65 years was a protective factor against all categories of patient delay (aor = 0.75, p p p patient delay by health insurance status the proportions of patients in each delay category by health insurance status are shown in fig. 3. for all types of health insurance status, the proportions of patients with a short delay were all approximately 30%. however, the proportions of patients who had medium delay or long delay were greater among those without health insurance (32.9% and 9.9%, respectively). fig. 3. proportions of patients with pulmonary tuberculosis with delays in seeking care, by health insurance status, japan, 2007–2017a click to download figure 3. jpg, 228kb discussion in the absence of a universal definition of patient delay, some international guidelines have stated that all patients with unexplained cough lasting 2 to 3 weeks or longer should be evaluated for tb.10 in fact, definitions of patient delay have varied from 7 to 60 days in previous studies.5,11,12 our study is unique in that it is the first detailed study of the trends in and risk factors for patient delay in japan to use three categories, namely short, medium and long. we found that the proportions of those with short delay steadily declined during the study period (p although the proportions of those with any delay tended to be higher among foreign-born patients for all age groups and higher for medium or long delay among japan-born patients younger than 65 years, country of birth was not a significant factor in the multinomial regression analysis. however, our study identified not having health insurance as one of the key risk factors for patient delay. previous studies have not agreed on the influence of health insurance, with some suggesting that a lack of health insurance affects patient delay,13 while others have not found this.14 to a certain extent, the inconsistency may reflect country-level differences in health insurance systems and patient eligibility. in japan, under uhc all residents, including foreign-born persons, are expected to be covered by national health insurance schemes. however, the number of those who are unable or unwilling to pay their premiums has been increasing recently, leading to widening health disparities among people in japan.15 those who fail to pay the premium for more than 18 months are disqualified from receiving health insurance benefits; in the event of disqualification, they must pay the full cost of medical services after each visit to a medical facility.16 according to a report from the japan medical practitioner’s association, the frequency of outpatient clinic utilization was significantly lower among those without health insurance – that is, it was one seventieth of those with health insurance.17 such a study strongly indicates that not having health insurance is a serious barrier to accessing health care; our study found that tb patients are not an exception. receiving public assistance was another risk factor for patient delay. in japan, public assistance is available to low-income households that are not capable of paying health insurance premiums − such as households in which people have a long-term illness or disability or are headed by a single parent – and those receiving social welfare are totally exempt from health insurance premiums as well as out-of-pocket payments. indeed, a recent report by a governmental working group on social welfare described a higher frequency of hospital visits among those receiving public assistance compared with those covered under other health insurance schemes.18 in contrast, several studies have suggested that those receiving public assistance had a low participation rate in community health screenings19 and a higher smoking rate.20,21 as smoking is often perceived as being associated with non-specific “smoker’s cough,” it has been identified by several studies as a risk factor for patient delay among tb patients.22,23 in other words, there may be confounding effects between smoking and receiving public assistance. another study has suggested that even among those receiving public assistance, participation rates in community health checks were lower among those who had been receiving public assistance for longer than 5 years and among those who had not had any health insurance before receiving public assistance.24 further studies are necessary to explore the health-seeking behaviour of tb patients who are receiving public assistance. our results also indicated that being a temporary worker and having a history of homelessness are risk factors for patient delay, consistent with previous studies from japan.25–27 in fact, the populations of temporary laborers and homeless people overlap, as temporary laborers may lack permanent addresses and, thus, may be classified as homeless, and people who are truly homeless often earn income from ad hoc jobs, such as construction and cleaning. the fear of losing income or a job as a result of taking time off from work to seek health care or being diagnosed with an illness are major barriers to seeking health care among people with precarious job situations.26 tb control activities specifically targeting homeless people have been in place in several urban areas in japan, including mobile screening by chest x-ray, free screening at accommodation for people seeking asylum and screening upon moving into affordable housing.28,29 yet various studies continue to indicate that homeless people have limited access to health care for a variety of sociopsychological and economic reasons.30,31 one of the major issues in tb control among homeless people is the increasing diversification of the profile of so-called homeless people, a label that can include elderly people without night-time shelter, middle-aged men living on day-to-day jobs and sleeping in internet cafes, and teenagers who cannot live with their parents and so move from one friend’s house to another.32 traditional outreach services, such as mobile screening on streets and in shelters, may not reach a significant proportion of people who are classified as homeless. two distinct factors were associated with long delays, namely being male and being a full-time worker. a study from osaka city, japan, similarly reported that tb patients with a job were more likely to delay seeking care compared with those without a job.26 in the same study, the authors compared the reasons for not seeking care promptly among those who delayed seeking care and those who did not and revealed that the proportion of those who had been too busy with work and were unable to take time off was significantly higher among those who delayed seeking care. in another study that examined participation rates for general medical check-ups, the authors similarly reported that compared with those without jobs, a higher proportion of those with jobs did not participate in medical check-ups.33 in our study, being male was an independent risk factor for long delay. however, contrary to our findings, a systematic review of delay among tb patients in asia reported that being male was significantly associated with shorter patient delay.34 tb prevalence is generally higher among men, possibly leading to a greater awareness of tb and subsequent health-care-seeking behaviour among men compared with women; women also may face greater financial and cultural barriers to seeking care. however, a different study concluded that the higher prevalence of tb among men was precisely due to a longer delay before diagnosis.35 further analyses should explore the inconsistencies in these findings; however, several studies on health-seeking behaviour in japan have shown that men are generally less motivated to participate in medical check-ups36 and community screening opportunities.37 being diagnosed with tb for the first time (i.e. being a new case), having respiratory symptoms and having dm as a co-morbid condition were also identified as risk factors for patient delay. a new case may be considered to be a proxy for a lack of or limited knowledge of tb, which has been reported to hinder patients from accessing care; several studies have shown that individuals with a previous history of tb were more likely to seek care earlier because of their previous exposure to the disease and tb-related services and also, potentially, their increased knowledge.38,39 conclusions from previous studies on the association between patient delay and symptoms have been contradictory: while some have shown that patients with symptoms tended to seek care early,40,41 others have found the opposite, which was attributed to the possibility that patients did not consider their symptoms serious enough to need health care.42 in our study, a similar explanation may be possible. because our definition of respiratory symptoms included non-severe and general symptoms, such as cough, it is possible that patients misjudged their illness. as for dm, a previous study in japan on dm among patients with ptb also similarly reported a longer delay among those with dm.43 it has been previously reported that, in general, patients with dm are less willing to seek medical care,44 and the authors suggested that this may have also affected delays in seeking tb care. finally, being aged 65 years or older was identified as a protective factor against patient delay. similar results have been reported from other countries, including norway45 and italy.46 it has been suggested that elderly patients often have coexisting illnesses and thus routinely visit hospitals, thereby increasing the likelihood of seeking care when they have tb-related symptoms. our study has several limitations. first, patients for whom there was no information regarding their delay in seeking care were excluded from our analyses. some of these patients eventually died as a result of an extremely long delay, but because the patients were already too sick at the time of diagnosis, public health nurses were unable to interview them and collect the data that allow us to calculate the length of delay. in the surveillance data, approximately one third of patients had no information on delay, and, as such, it is possible that our results may underestimate the real magnitude of patient delay. second, because we analysed data from the jtbs system, other potential risk factors, such as smoking, could not be considered. the results of our study should be interpreted along with results from local studies that have used local data held by public health centres. last, as the onset date of symptoms was self-reported by patients, it could have been affected by recall bias. interventions to prevent patient delay should be designed to address specific risk factors. providing waivers for out-of-pocket expenses under certain conditions, especially for those without health insurance, and providing a sickness allowance for those with precarious work situations would potentially improve access. furthermore, it is equally important to implement more general interventions to improve the working environment to allow workers to take leave to seek medical services without feeling ashamed or guilty. actions taken within the health sector alone cannot achieve and maintain uhc, and increasing effort is required to build the capacity for multisectoral approaches. community health screening tailored to those who do not have health insurance or are receiving social welfare could help early case detection, especially if undertaken in collaboration with municipal health authorities. activities to increase the awareness of tb symptoms should also be strengthened, especially among groups likely to have longer delays seeking care, particularly men and full-time workers. conclusions in spite of the implementation of uhc decades ago in japan, a detailed analysis of surveillance data has revealed that patient-led delays in tb diagnosis are still a major challenge. this study’s results identified various risk factors, many of which could be mitigated by implementing appropriate social protection measures, indicating the shortcomings of uhc in japan and the need for continued effort to ensure that no one is left behind. acknowledgements the authors acknowledge all those who contributed information on tb cases in japan, including physicians, public health nurses, microbiologists and administrative staff. conflicts of interest none declared. references global tuberculosis report 2019. geneva: world health organization; 2019. available from: https://apps.who.int/iris/handle/10665/329368, accessed 15 february 2020. global strategy and targets for tuberculosis prevention, care and control after 2015. geneva: world health organization; 2014. available from: http://apps.who.int/gb/ebwha/pdf_files/wha67/a67_r1-en.pdf, accessed 7 february 2020. ward ha, marciniuk dd, pahwa p, hoeppner vh. extent of pulmonary tuberculosis in patients diagnosed by active compared to passive case finding. int j tuberc lung dis. 2004;8(5):593–7. pmid:15137536 storla dg, yimer s, bjune ga. a systematic review of delay in the diagnosis and treatment of tuberculosis. bmc public health. 2008;8:15. doi:10.1186/1471-2458-8-15 pmid:18194573 cai j, wang x, ma a, wang q, han x, li y. factors associated with patient and provider delays for tuberculosis diagnosis and treatment in asia: a systematic review and meta-analysis. plos one. 2015;10(3):e0120088. doi:10.1371/journal.pone.0120088 pmid:25807385 implementing the end tb strategy: the essentials. geneva: world health organization; 2015. available from: https://apps.who.int/iris/handle/10665/206499, accessed 8 march 2020. ikegami n, yoo bk, hashimoto h, matsumoto m, ogata h, babazono a, et al. japanese universal health coverage: evolution, achievements, and challenges. lancet. 2011;378(9796):1106–15. doi:10.1016/s0140-6736(11)60828-3 pmid:21885107 uhc and sdg country profile 2018: japan. manila: world health organization, regional office for the western pacific; 2018. available from: https://iris.wpro.who.int/bitstream/handle/10665.1/14046/wpr-2018-dhs-007-jpn-eng.pdf, accessed 15 february 2020. tuberculosis in japan: annual report 2018. tokyo: tuberculosis surveillance center-rit/jata; 2018. available from: http://www.jata.or.jp/rit/ekigaku/en/statistics-of-tb/, accessed 15 february 2019. hopewell pc, pai m, maher d, uplekar m, raviglione mc. international standards for tuberculosis care. lancet infect dis. 2006;6(11):710–25. doi:10.1016/s1473-3099(06)70628-4 pmid:17067920 getnet f, demissie m, assefa n, mengistie b, worku a. delay in diagnosis of pulmonary tuberculosis in lowand middle-income settings: systematic review and meta-analysis. bmc pulm med. 2017;17(1):202. doi:10.1186/s12890-017-0551-y pmid:29237451 li y, ehiri j, tang s, li d, bian y, lin h, et al. factors associated with patient, and diagnostic delays in chinese tb patients: a systematic review and meta-analysis. bmc med. 2013;11(1):156. doi:10.1186/1741-7015-11-156 pmid:23819847 tattevin p, che d, fraisse p, gatey c, guichard c, antoine d, et al. factors associated with patient and health care system delay in the diagnosis of tuberculosis in france. int j tuberc lung dis. 2012;16(4):510–5. doi:10.5588/ijtld.11.0420 pmid:22325560 rojpibulstit m, kanjanakiritamrong j, chongsuvivatwong v. patient and health system delays in the diagnosis of tuberculosis in southern thailand after health care reform. int j tuberc lung dis. 2006;10(4):422–8. pmid:16602407 ikegami n, yoo bk, hashimoto h, matsumoto m, ogata h, babazono a, et al. japanese universal health coverage: evolution, achievements, and challenges. lancet. 2011;378(9796):1106–15. doi:10.1016/s0140-6736(11)60828-3 pmid:21885107 japan youth statement. universal health coverage: a chance for all.tokyo: uhc youth japan; 2017. available from: http://uhcday.jp/wordpress/wp-content/uploads/2017/12/japan-youth-statement-uhc_r1-english.pdf, accessed 15 february 2019. reports on frequency of outpatient clinic utilization among people not having health insurance. tokyo: japan medical practitioner’s association; 2010. available from: https://hodanren.doc-net.or.jp/news/tyousa/101129kokuho/kekka.pdf, accessed 15 february 2019. current situation of general health care among people receiving social welfare. tokyo: ministry of health, labour, and welfare; 2017. available from: https://www.mhlw.go.jp/file/05-shingikai-12601000-seisakutoukatsukan-sanjikanshitsu_shakaihoshoutantou/0000169132_5.pdf, accessed 15 february 2019. current situation of general health care among people receiving social welfare. tokyo: ministry of health, labour, and welfare; 2017. available from: https://www.mhlw.go.jp/file/05-shingikai-12201000-shakaiengokyokushougaihokenfukushibu-kikakuka/sankoushiryou1.pdf, accessed 15 february 2019. matsunami y, kawai a. [smoking among recipients of public assistance benefits from n city, and their recognition of smoking cessation therapy. j jpn soc tob control. 2015;10:51–8 (in japanese). tomita s, santoku k. health behaviours of middle-aged public assistance recipients: problems and challenges. kawasaki med welf j. 2011;21(1):145–50 (in japanese). leung ec, leung cc, tam cm. delayed presentation and treatment of newly diagnosed pulmonary tuberculosis patients in hong kong. hong kong med j. 2007 jun;13(3):221–7. pmid:17548911 basnet r, hinderaker sg, enarson d, malla p, mørkve o. delay in the diagnosis of tuberculosis in nepal. bmc public health. 2009;9(9):236. doi:10.1186/1471-2458-9-236 pmid:19602255 saito j, kondo k, takaki t. analysis of factors affecting participation in health checks among people receiving social welfare. j health welf stat. 2018;65(5):15–20 (in japanese). ohmori m, ozasa k, mori t, wada m, yoshiyama t, aoki m, et al. trends of delays in tuberculosis case finding in japan and associated factors. int j tuberc lung dis. 2005;9(9):999–1005. pmid:16158892 matsumoto k, fukunaga y, monbayashi j, arima k, shimouchi a. investigation on “patient’s delay” in tb detection. kekkaku. 2009;84(7):523–9 (in japanese). pmid:19670799 oki n, higashiyama k, tanaka h. factors associated with patient and doctor delay among pulmonary tuberculosis patients. hyogo, japan: prefectural institute of public health science; 2001 (in japanese). takatorige t, ohsaka t, yamamoto s, nishimori t, fujikawa t, kuroda k, et al. tuberculosis and its control measures for homeless people: implementation of chest x-ray examination for three successive years. kekkaku. 2007;82(1):19–25 (in japanese). pmid:17310778 kaguraoka s, ohmori m, takao y, yamada m, muroi m, nagamine m, et al. tuberculosis control in shinjuku ward, tokyo–promoting the dots program and its outcome. kekkaku. 2008;83(9):611–20 (in japanese). pmid:18979995 hwang j, kihara m, kihara m. a qualitative study on the factors affecting tb care seeking behavior among homeless people. nippon koshu eisei zasshi. 2017;64:547 (in japanese). koyanagi j, sato n, matsuura m, shima a, fukuuchi k. a situational analysis of people attending homeless tb screening. nippon koshu eisei zasshi. 2011;58(10):398 (in japanese). iijima y, sano m, editors. a report on young homeless people. tokyo: the big issue japan foundation: npo big issue foundation; 2010. available from: https://bigissue.or.jp/wp-content/uploads/2018/09/younghomeless.pdf, accessed 16 february 2019. wakui s, nagashima m, hagi y, higasionna a, yoshitake y. the relationship between the specific medical check-up and the physical activity-related factors among national health insurance subscribers. j jpn soc lifelong sports. 2014;10:11–20 (in japanese). cai j, wang x, ma a, wang q, han x, li y. factors associated with patient and provider delays for tuberculosis diagnosis and treatment in asia: a systematic review and meta-analysis. plos one. 2015;10(3):e0120088. doi:10.1371/journal.pone.0120088 pmid:25807385 horton kc, sumner t, houben rmgj, corbett el, white rg. a bayesian approach to understanding sex differences in tuberculosis disease burden. am j epidemiol. 2018;187(11):2431–8. doi:10.1093/aje/kwy131 pmid:29955827 oohashi y, watai i, murashima s. a study on attitudes and motivation towards attending a medical check-up among middle-aged persons in japan. jpn acad community nurs. 2012;15:64–72 (in japanese). katoh k, kanno s. factors associated with cancer screening participation rates: results from tadami town health survey 2003. bull fukushima sch nurs. 2009;11:29–37 (in japanese). bojovic o, medenica m, zivkovic d, rakocevic b, trajkovic g, kisic-tepavcevic d, et al. factors associated with patient and health system delays in diagnosis and treatment of tuberculosis in montenegro, 2015-2016. plos one. 2018;13(3):e0193997. doi:10.1371/journal.pone.0193997 pmid:29522545 yirgu r, lemessa f, hirpa s, alemayehu a, klinkenberg e. determinants of delayed care seeking for tb suggestive symptoms in seru district, oromiya region, ethiopia: a community based unmatched case-control study. bmc infect dis. 2017;17(1):292. doi:10.1186/s12879-017-2407-8 pmid:28427367 leung ec, leung cc, tam cm. delayed presentation and treatment of newly diagnosed pulmonary tuberculosis patients in hong kong. hong kong med j. 2007 jun;13(3):221–7. pmid:17548911 wang w, jiang q, abdullah as, xu b. barriers in accessing to tuberculosis care among non-residents in shanghai: a descriptive study of delays in diagnosis. eur j public health. 2007;17(5):419–23. doi:10.1093/eurpub/ckm029 pmid:17412714 lin y, enarson da, chiang cy, rusen id, qiu lx, kan xh, et al. patient delay in the diagnosis and treatment of tuberculosis in china: findings of case detection projects. public health action. 2015;5(1):65–9. doi:10.5588/pha.14.0066 pmid:26400603 fujiawara a, hara s. a qualitative study on the reasons why patients suspected of having diabetes do not seek medical care. bull shimane univ fac med. 2016;38:45–53 (in japanese). kawatsu l, uchimura k, ohkado a, izumi k. overview of diabetes mellitus among japanese patients with pulmonary tuberculosis: an analysis of the tuberculosis surveillance data. jpn diabetes society. 2016;59(11):759–67 (in japanese). farah mg, rygh jh, steen tw, selmer r, heldal e, bjune g. patient and health care system delays in the start of tuberculosis treatment in norway. bmc infect dis. 2006;6(1):33. doi:10.1186/1471-2334-6-33 pmid:16504113 gagliotti c, resi d, moro ml. delay in the treatment of pulmonary tb in a changing demographic scenario. int j tuberc lung dis. 2006;10(3):305–9. pmid:16562711 hepatitis a outbreak in ba subdivision, fiji, october–december 2013 outbreak investigation report aneley getahun,a eric rafai,b maria ximena tolosa,c akanisi dawainavesi,d anaseini maisema tabuae and josefa tabuae a school of public health and primary care, college of medicine, nursing and health sciences, fiji national university, suva, fiji. b fiji ministry of health, suva, fiji. c australian volunteer for international development, suva, fiji. d fiji centre communicable diseases control, ministry of health, suva, fiji. e ba medical subdivision, western health services, suva, fiji. correspondence to aneley getahun (e-mail: aneley.getahun@fnu.ac.fj). to cite this article: getahun a et al. hepatitis a outbreak in ba subdivision, fiji, october–december 2013. western pacific surveillance and response journal, 2015, 6(2):32–36. doi:10.5365/wpsar.2014.5.4.006 abstract objective: a cluster of suspected hepatitis a cases was notified to the fiji ministry of health on 22 october 2013. an outbreak investigation team was mobilized to confirm the existence of an outbreak of hepatitis a and advise appropriate public health interventions. methods: a case definition for the outbreak investigation was established, and standardized data collection tools were used to collect information on clinical presentation and risk factors. an environmental assessment was also conducted. results: there were 160 clinical cases of hepatitis a of which 15 were laboratory-confirmed. the attack rate was 349 per 10 000 population in the nukuloa nursing zone; there were no reported deaths. residents of the nukuloa settlement were 6.6 times more likely to present with symptomatic hepatitis a infection (95% confidence interval: 3.8–12.6) compared with residents of another village with a different water supply. discussion: this is the first significant hepatitis a outbreak documented in ba subdivision and possibly in fiji. enhanced surveillance of hepatitis a may reveal other clusters in the country. improving the primary water source dramatically reduced the occurance of disease in the affected community and adjacent areas. introduction fiji is an archipelago in the south pacific consisting of over 300 islands with an estimated population of 837 000 comprised of 58% indigenous fijians and 35% fijians of indian descent.1 there is a paucity of information on the epidemiology of hepatitis a virus (hav) in fiji. the only published study on hav seroprevalence was reported in 1976–1978 when about 84% of samples were positive for hav-specific antibodies. the age-specific prevalence of anti-hav was 13% in children under 5 years, 60% among 6–10 year olds and 90% by the age of 20.2 there have been a few anecdotal or unpublished reports of hepatitis a in fiji but no reported community outbreaks of significance.3,4 hepatitis a cases have been associated with kava (a plant-based sedative) drinking among tourists returned from fiji.5 hepatitis a is one of the communicable diseases under routine surveillance in fiji; it is also mandatory for an outbreak or cluster of suspected cases to be reported within 24 hours to the ministry of health and the fiji centre for communicable diseases control (fccdc).6 the study area for this investigation is ba subdivision, an agricultural centre situated on the north-western side of viti levu, fiji’s main island. according to the ba hospital, the estimated population of ba subdivision is 55 805 with fijians of indian descent (72%) making up the largest proportion. the ba subdivision has three health centres: ba town, balevuto and nailaga. the balevuto medical area consists of two nursing zones: nukuloa and moto, and the hospital estimated a population of 6255 of which 68% are fijians of indian descent. on 22 october 2013, a cluster of eight cases of jaundice and fever was reported to fccdc from the balevuto medical area. a joint team from fccdc and the fiji national university conducted an investigation and recommended public health measures to control the outbreak and prevent further spread. methods the outbreak investigation followed fccdc outbreak response guidelines.6 the investigation team was mobilized within 24 hours after the report of the jaundiced cases. a suspected case of hepatitis a was defined as a patient presenting with an acute illness with two or more of the following symptoms: fever, headache, malaise, anorexia, nausea, vomiting, diarrhoea, abdominal pain and either jaundice or elevated serum aminotransferase between 8 october and 2 december 2013. a confirmed case was a suspected case with positive anti-hav igm or an epidemiological link with a laboratory-confirmed case.7 a line list of patients who presented with jaundice and other related symptoms was obtained from the ba subdivisional hospital and the balevuto health centre, and the team conducted house-to-house visits for active case finding and health promotion activities. a structured questionnaire that included demographics, clinical presentation, food, water, other risk factors and exposure history for the two to six weeks before onset was used. risk and exposure factors collected as part of the outbreak investigation included history of eating raw/undercooked shell fish, contact with a jaundice patient or a confirmed hepatitis a patient, history of travel, and attending public/private gatherings two to six weeks before the onset of illness. blood samples were collected for biochemistry (liver function and renal function tests), full blood counts, dengue and leptospirosis serology testing; 14 serum samples were sent to suva private hospital for anti-hav igm testing using the elecsysanti-hav igm test (roche diagnostics, germany). an environmental assessment was conducted to determine potential sources of infection. drinking-water samples were collected from the main water source and from selected households for analysis at the fccdc public health laboratory. coliform and escherichia coli counts by the most probable number per 100 ml of sample were conducted to determine the level of contamination. data were entered and analysed using microsoft office excel 2007. an epidemic curve used the date of onset of illness; if this was unknown, the date of blood sample collection. attack rates and relative risk for exposure variables were calculated by medical areas. a spot map was used to assess cases by geographical areas. results demographic profile of cases there were 160 suspected cases of hepatitis a of whom 18 were confirmed (15 by serology and 3 by epidemiological link). the majority of cases were men (66%), and fijians of indian descent accounted for 93%. the mean age was 31 years with 46% aged between 10 and 29 years (range: 3–80 years). the attack rates were 246, 5 and 0.3 per 10 000 population in balevuto, nailaga and ba medical areas, respectively. within the balevuto medical area, the attack rate for nukuloa was 349 per 10 000 population, and 52 per 10 000 population in moto. clinical presentation common symptoms included fever (86%), jaundice (85%), anorexia (69%), malaise and/or nausea (65%), abdominal pain (63%) and vomiting (53%). other less common symptoms included headache, body pain and dark urine. the mean serum aspartate transaminase (ast) and alanine transaminase (alt) were 1165 and 1575 μ/l, respectively. there were no deaths. the epidemic curve shows that about 30% (n = 48) of cases were reported within four days between 18 and 21 october (figure 1). the index case was a 59-year-old female resident of the nukuloa settlement area whose illness began on 24 september. her initial symptoms included fever, vomiting and nausea followed by yellowish discoloration of the eyes. her serum sample was insufficient for hav serology test; her liver function had an ast of 2550 μ/l and alt of 2610 μ/l. she had no history of travel outside of ba or contact with a jaundiced patient. figure 1. the epidemic curve of hepatitis a outbreak in ba subdivision, fiji (n = 160) click to download figure 1. jpg, 429kb fccdc, fiji centre for communicable diseases control; moh, ministry of health. exposure and environmental assessment data on exposures and risk factors were collected from 50 cases. a total of 18 cases (36%) reported a history of contact with jaundiced patients, mainly another family member. approximately one quarter (24%) of cases attended social gatherings, public functions or family gatherings where food was served. all visited houses had toilets and there was no report of open defecation. ba town has access to a treated reticulated water supply provided by the water authorities of fiji (waf). however, most of the affected community of the nukuloa settlement used the privately owned waica dam (dayal) (figure 2), which was inspected by the outbreak investigation team. the waica dam does not have a reservoir for treatment purposes and draws water directly from the river. at the time of the assessment, the water source had no surrounding barrier to prevent human or animal access to the dam. water samples collected from the dam showed a high level of contamination with human or animal excreta (coliform: 43–153; e. coli: 5–43/100 ml) compared to samples taken from waf water supply (coliform: e. coli: nil). the relative risk of hav infection for nukuloa residents was 6.6 times more than those who reside in moto who have a different water source (surface water) (95% confidence interval: 3.8–12.5). figure 2. the dayal water distribution areas and reported cases of symptomatic hepatitis a cases in ba subdivision, fiji, october–december 2013 click to download figure 2. jpg, 974kb legend: yellow shaded area – dayal water distribution area; red line – old piping system that have been removed; and blue line – new water supply piping systems. source: map courtesy of water authority of fiji. outbreak control measures a taskforce was established to coordinate the outbreak response in ba subdivision. initial outbreak control measures included health promotion activities through mass media and community visits (schools, settlements and villages) with emphasis on boiling water, hand washing with soap, personal hygiene and food and water safety. water purification tablets, water filters and hand sanitizers were also distributed to households in the nukuloa settlement and schools. a health education pamphlet on hepatitis a was developed by the ministry of health and widely distributed to the affected areas. outbreak-related information was posted on pacnet listserv in weeks 43 and 45.8 case management health facilities in the affected areas were provided with additional medical supplies for supportive management of patients with hepatitis a. outpatient department nurses conducted active triage to identify suspected cases for prompt review and management. environmental health interventions the taskforce continued with the recommended community interventions and actively lobbied with landowners and government administration to ensure safe drinking-water was supplied to affected households. as a result, on 9 november 2013, the waica dam was temporarily closed while waf undertook major upgrading work to the dam and water system. this later included a chlorination treatment plant and replacement of the old water piping system thus providing clean treated water to 600 households in the area.9 discussion this is the first documented community outbreak of hepatitis a to occur in ba, fiji. the outbreak was most likely associated with a supply of untreated water to the nukuloa settlement. there was geographic clustering of cases to areas that receive water from the waica dam. significant contamination of water (e. coli and coliform) taken from the dam on two occasions and the epidemic curve revealed a continuous source outbreak where cases increased over an extended period of time, approximately two weeks from 12 to 26 october. although about 30% of cases presented in four days, the epidemic curve does not exhibit the classic point source outbreak with significant clustering of cases in a short period of time. this is more compatible with a continuous source outbreak which could be attributed to prolonged common source exposure such as contaminated water. community-based hepatitis a outbreaks from contaminated water have been reported in china and india.10,11 the propagated nature of the outbreak indicates person-to-person transmission which is likely to have contributed to sustaining the outbreak as well as spreading the infection to other parts of the subdivision, resulting in sporadic cases observed in the two adjacent medical areas. the significant majority (93%) of hepatitis a cases were fijians of indian descent. the occurrence of symptomatic infection with hav in older age groups in this outbreak suggests no prior exposure to the virus. the prevalence studies in the 1970s estimated the majority of infections were acquired at an early age, and disease prevalence was found to be equal among the two main ethnic groups.2 the findings from this outbreak investigation may indicate a change in the epidemiology of hav in this subpopulation in fiji. this report is the first to document a hepatitis a outbreak at the community level in fiji; however, it is limited in scope. it does not extensively examine the exposure and risk factors among the various communities, nor does it explain the difference in attack rates between the two ethnic groups. detailed information on food eaten was not collected because of a long incubation period and recall bias concerns. therefore, a foodborne cause cannot be ruled out. hav surveillance in fiji is from the passive detection of symptomatic patients mainly by public health facilities and does not include all patients treated in private health facilities or outside the ba region. this may have underestimated the magnitude of the outbreak. conclusion this is the first significant hepatitis a outbreak documented in ba subdivision and possibly in fiji. improving surveillance for hepatitis a may reveal other clusters in the island. after improving the primary water source there was a reduction in cases in the affected community and adjacent areas. conflicts of interest none declared. funding none. acknowledgements the authors would like to thank all the medical officers, nurses, laboratory staff and health inspectors in ba subdivision for their support throughout the outbreak investigation process. we would like to thank the fccdc team for their technical and laboratory support. references fiji bureau of statistics. suva, 2015. available from: http://www.statsfiji.gov.fj/ index.php/2007-census-of-population [accessed 26 march 2014]. gust id, lehmann ni, dimitrakakis m. a seroepidemiologic study of infection with hav and hbv in five pacific islands. american journal of epidemiology, 1979, 110:237–242. pmid:224697 patient information system 2004–2007 (unpublished data). suva, fiji ministry of health, 2008. fiji: country health information profile, 2011. manila, world health organization regional office for the western pacific, 2011. available from: http://www.wpro.who.int/countries/fji/7fijtab2011_finaldraft.pdf [accessed 21 april 2015]. parker ja, kurien tt, huppatz c. hepatitis a outbreak associated with kava drinking. communicable diseases intelligence quarterly report, 2014, 38:e26–28. pmid:25409352 national communicable diseases surveillance and outbreak response guidelines. suva, fiji ministry of health, 2010. available from: http://www.health.gov.fj/ pdfs/cd%20guidelines.pdf [accessed 21 april 2015]. national notifiable diseases surveillance system. hepatitis a (acute), 2012 case definition. atlanta, united states centers for disease control and prevention, 2015. avaialable from: http://wwwn.cdc.gov/nndss/script/casedef.aspx?condyrid=703&datepub=1/1/2012 [accessed 21 april 2015]. weekly pacific syndromic surveillance report – weeks 43 and 45. suva, world health organization, division of pacific technical support, 2013. nasiko r. families to receive piped water. the fiji times, 8 april 2014. available from: http://www.fijitimes.com/story.aspx?id=265012 [accessed on 21 april 2015]. thuppal v et al. investigation of a hepatitis a outbreak in children in an urban slum in vellore,tamil nadu, using geographic information systems. indian journal of medicine, 2008, 128:32–37. ye-qing x et al. an outbreak of hepatitis a associated with a contaminated well in a middle school, guangxi, china. western pacific surveillance and response journal, 2012, 3:44–47. doi:10.5365/wpsar.2012.3.4.014 pmid:23908939 seroprevalence of middle east respiratory syndrome coronavirus (mers-cov) in public health workers responding to a mers outbreak in seoul, republic of korea, in 2015 brief report boyeong ryu,a,b sung-il cho,a,b myoung-don oh,a,c jong-koo lee,a,d jaein lee,e young-ok hwang,e jeong-sun yang,f sung soon kimf and ji hwan banga,g a seoul center for infectious disease control and prevention, seoul, republic of korea. b department of epidemiology, seoul national university school of public health, seoul, republic of korea. c department of internal medicine, seoul national university college of medicine, seoul, republic of korea. d department of family medicine, seoul national university college of medicine, seoul, republic of korea. e seoul metropolitan government research institute of public health and environment, seoul, republic of korea. f korea centers for disease control and prevention, cheongju, republic of korea. g division of infectious diseases, seoul metropolitan government-seoul national university boramae medical center, seoul, republic of korea. correspondence to ji hwan bang (email: roundbirch@gmail.com). to cite this article: ryu b, cho s, oh m, lee j, lee j, hwang y, et al. seroprevalence of middle east respiratory syndrome coronavirus (mers-cov) in public health workers responding to a mers outbreak in seoul, republic of korea, in 2015. western pac surveill response j. 2019 jun;10(2). doi:10.5365/wpsar.2017.8.1.008 the first case of middle east respiratory syndrome coronavirus (mers-cov) in the republic of korea was confirmed in may 2015 after a traveller returned from the middle east.1 there were 186 cases, including 38 deaths, within two months.1 the potential of a single mers-confirmed patient to result in such a large mers outbreak constitutes a serious global health concern.2 during this mers outbreak, massive public health containment measures were enacted at various levels; these included epidemiological investigations, isolation of suspected and confirmed cases, contact tracing and home quarantine of contacts. local public health centre (lphc) and emergency medical services (ems) personnel responded to the outbreak by conducting initial interviews with suspected cases, transporting patients and specimens and managing contacts. responders in contact with patients used different levels of personal protective equipment (ppe). full-protection ppe includes a gown, n95 respirator, gloves and goggles. as the transmissibility of mers is unclear,3 it is possible that responders were infected by being exposed to mers patients. we conducted a cross-sectional study in january 2016 to assess whether lphc and ems workers were infected and to determine their degree of exposure. the participants had contact with mers-confirmed patients or their specimens during the outbreak and volunteered to participate in this study. the survey, which was a face-to-face interview, examined subjects’ general characteristics, professional responsibilities, contact history, symptoms after exposure and use of ppe. contact was defined as meeting at least one of the following four criteria:4 being within 2m of a confirmed patient, staying in the same space as a confirmed patient for over 5 minutes, contact with a patient’s respiratory or digestive secretions and contact with specimens from confirmed patients before the sample was packaged. contact within the same space was graded into four levels according to distance of contact and wearing of ppe. without full ppe protection: grade 1 was defined as contact within 2m, and grade 2 was defined as contact at over 2m. with full ppe protection: grade 3 was defined as contact within 2m, and grade 4 was defined as contact at over 2m. serum collected from all participants was screened for the presence of mers-cov igg using enzyme-linked immunosorbent assays (elisas). one sample with borderline results and five samples with negative elisa results were retested using indirect immunofluorescence (iift) and plaque reduction neutralization (prnt) tests for confirmation. the indirect elisa and mers-cov iift used commercial mers-cov iift slides (euroimmun, lübeck, germany) and followed the manufacturer’s protocol. analysis was performed using a de/axio imager m1 immunofluorescence microscope (zeiss, jena, germany). the prnt was performed as previously described.5 the number of plaques per well were counted; reductions in plaque counts of 50% (prnt50) and 90% (prnt90) were calculated using the spearman-kärber formula.5 thirty-four workers participated in the study (table 1): 31 from 11 lphcs and three from two ems units. twenty (58.8%) responders were male; their mean age was 44 (34–56.7) years. twenty-five participants (73.5%) occupied health-related positions: 11 (32.4%) general health-care staff, 6 (17.6%) nurses, 4 (11.8%) doctors, 3 (8.8%) paramedics and 1 medical laboratory technologist (2.6%). nine participants (26.5%) were non-health-related workers: 5 (14.7%) technicians, 2 (5.9%) administrators, 1 (2.9%) agricultural worker and 1 (2.9%) unknown. table 1. exposure to mers-confirmed patients (n = 34) click to download table 1. jpg, 298kb based on the highest risk contact for each participant, seven (20.6%) of the responders were classified as grade 1; they were partially protected with at least gloves and an n95 respirator (table 1). they contacted asymptomatic or symptomatic patients, and symptomatic patients wore surgical masks. after mers-cov had been confirmed in a patient, all staff were fully protected when in contact with the patient. the closest contact occurred when touching and holding patients during transport. one responder wearing full ppe had a mild fever (37.5 °c) after contact with a symptomatic patient who was later confirmed as infected. since the response system had not expanded in the early days of the outbreak, she was not tested but was isolated with self-monitoring. serum samples were obtained from all 34 participants at an average of 7.3 months (range: 6.7–8.1 months) after exposure. on elisa, there were 33 (97.1%) negative results and one borderline result. the results of six samples, including one with borderline elisa results, were negative in the iift and prnt. in our study, we could not find evidence of mers infection in the public health providers after direct contact with confirmed patients. this may be because there was a lower risk of transmission when participants were transporting or counselling patients outside of the hospital compared to providing medical assistance within the hospital. in other mers outbreaks, secondary infections were related to health-care settings.1,6 although the exact route of infection transmission is unknown, aerosolizing procedures in crowded rooms with inadequate infection prevention and control measures were observed in health-care settings.7 in the 2015 republic of korea outbreak, some health-care workers without proper ppe were infected in tertiary hospitals, thus emphasizing the optimal use of ppe to prevent mers infection.8 moreover, since the participants did not contact any spreaders except one participant who contacted a patient that caused two secondary infections, the risk of transmission from the contacted patients was likely low. this study had several limitations. first, the survey was conducted 7.3 months after the mers outbreak, making recall bias possible. second, it is possible that we missed some mild or asymptomatic cases. furthermore, because the serological tests were performed several months post-exposure, pre-existing mers antibodies may have decreased or disappeared in the interval, potentially leading to underestimation. while asymptomatic mers infection had been detected using rt–pcr testing at the time of outbreak,9 a saudi arabian study showed the longevity of mers-cov antibodies in mers patients varied in the severity of illness. for example, antibodies in severely infected patients persisted after 18 months, but milder and subclinical cases detected no antibodies even early on in the disease.10 third, the number of participants was relatively small and may not be representative or generalizable. despite these limitations, this study suggests that the risk of mers transmission to public health professionals responding to mers outside the hospital setting (i.e. patients’ homes) was low, particularly for those who wore some level of ppe such as masks and gloves. further study is needed to prospectively survey public health responders including symptomatic or asymptomatic cases to conduct genetic test and serologic test during an outbreak. in conclusion, the public health providers in our study did not have evidence of mers transmission after direct contact with confirmed patients when ppe was used properly. ethics ethical approval for the study was obtained from the institutional review board of seoul national university hospital in seoul (irb no. c-1512–049–727). acknowledgements we would like to thank the study participants and the division of life and health of the seoul metropolitan government for assistance with the research. funding this study was supported by the seoul metropolitan government and a fund (#4834-300-210-13) of korea centers for disease control and prevention, chungcheongbuk-do, republic of korea. conflicts of interest none. references oh md, park wb, park s-w, choe pg, bang jh, song k-h, et al. middle east respiratory syndrome: what we learned from the 2015 outbreak in the republic of korea. korean j intern med (korean assoc intern med). 2018 mar;33(2):233–46. doi:10.3904/kjim.2018.031 pmid:29506344 petersen e, hui ds, perlman s, zumla a. middle east respiratory syndrome advancing the public health and research agenda on mers lessons from the south korea outbreak. int j infect dis. 2015 jul;36:54–5. doi:10.1016/j.ijid.2015.06.004 pmid:26072036 zumla a, hui ds, perlman s. middle east respiratory syndrome. lancet. 2015 sep 5;386(9997):995–1007. doi:10.1016/s0140-6736(15)60454-8 pmid:26049252 interim us guidance for monitoring and movement of persons with potential middle east respiratory syndrome coronavirus (mers-cov) exposure. atlanta, ga: centers for disease control and prevention; 8 april 2018 (https://www.cdc.gov/coronavirus/mers/hcp/monitoring-movement-guidance.html). cohen bj, audet s, andrews n, beeler j; who working group on measles plaque reduction neutralization test. plaque reduction neutralization test for measles antibodies: description of a standardised laboratory method for use in immunogenicity studies of aerosol vaccination. vaccine. 2007 dec 21;26(1):59–66. doi:10.1016/j.vaccine.2007.10.046 pmid:18063236 assiri a, mcgeer a, perl tm, price cs, al rabeeah aa, cummings da, et al.; ksa mers-cov investigation team. hospital outbreak of middle east respiratory syndrome coronavirus. n engl j med. 2013 aug 1;369(5):407–16. doi:10.1056/nejmoa1306742 pmid:237821617 who mers-cov global summary and assessment of risk 2018. geneva: world health organization; 2018 (https://www.who.int/csr/disease/coronavirus_infections/risk-assessment-august-2018.pdf). kim cj, choi ws, jung y, kiem s, seol hy, woo hj, et al. surveillance of the middle east respiratory syndrome (mers) coronavirus (cov) infection in healthcare workers after contact with confirmed mers patients: incidence and risk factors of mers-cov seropositivity. clin microbiol infect. 2016 oct;22(10):880–6. doi:10.1016/j.cmi.2016.07.017 pmid:27475739 oboho ik, tomczyk sm, al-asmari am, banjar aa, al-mugti h, aloraini ms, et al. 2014 mers-cov outbreak in jeddah–a link to health care facilities. n engl j med. 2015 feb 26;372(9):846–54. doi:10.1056/nejmoa1408636 pmid:25714162 alshukairi an, khalid i, ahmed wa, dada am, bayumi dt, malic ls, et al. antibody response and disease severity in healthcare worker mers survivors. emerg infect dis. 2016;22(6):1113. pmid:27192543 www.wpro.who.int/wpsar 1wpsar vol 12, no 2, 2021 | doi: 10.5365/wpsar.2020.11.1.006 original research a antimicrobial resistance surveillance reference laboratory, research institute for tropical medicine, muntinlupa, philippines. b centre for genomic pathogen surveillance, wellcome genome campus, hinxton, england, united kingdom of great britain and northern ireland. c brigham and women’s hospital, boston (ma), usa. d university of st andrews school of medicine, st andrews, scotland, united kingdom of great britain and northern ireland. e centre for genomic pathogen surveillance, big data institute, university of oxford, oxford, england, united kingdom of great britain and northern ireland. † these authors contributed equally to this work. * these authors contributed equally to this work. published: 28 april 2021 doi: 10.5365/wpsar.2020.11.1.006 p seudomonas aeruginosa is an opportunistic pathogen that often causes nosocomial infections (e.g. pneumonia, bacteraemia and urinary tract infections), particularly in immunocompromised patients.1 eight asian countries reported frequencies of isolation of pseudomonas spp. of above 15% from hospital-acquired (ha) pneumonia cases, with the philippines reporting p. aeruginosa as the most common etiological agent.2 also, pseudomonas spp. were the second most common pathogen isolated from deviceassociated ha infections in a study of intensive care units in philippine hospitals.3 p. aeruginosa infections are often resistant to treatment,4 and carbapenem use has been strongly associated with resistance.1 however, a study evaluating carbapenem restriction practices at a hospital in manila found that 37% of the carbapenem prescriptions were non-compliant, highlighting challenges in antimicrobial stewardship.5 between 2010 and 2014, the philippine antimicrobial resistance surveillance program (arsp) reported increasing rates of resistance to antibiotics used to treat p. aeruginosa infections, such as carbapenems and extended-spectrum cephalosporins (fig. 1a-b). in contrast, resistance to aminoglycosides and fluoroquigenomic surveillance of pseudomonas aeruginosa in the philippines, 2013–2014 jeremiah chilam,a,† silvia argimón,b,† marilyn t. limas,a melissa l. masim,a june m. gayeta,a marietta l. lagrada,a agnettah m. olorosa,a victoria cohen,b lara t. hernandez,a benjamin jeffrey,b khalil abudahab,b charmian m. hufano,a sonia b. sia,a matthew t.g. holden,d john stelling,c david m. aanensen,b,e,* and celia c. carlos,a,* on behalf of the philippines antimicrobial resistance surveillance program correspondence to celia carlos (email: ccarlosphl@gmail.com) and david m. aanensen (email: david.aanensen@bdi.ox.ac.uk) pseudomonas aeruginosa is an opportunistic pathogen that often causes nosocomial infections resistant to treatment. rates of antimicrobial resistance (amr) are increasing, as are rates of multidrug-resistant (mdr) and possible extensively drug-resistant (xdr) infections. our objective was to characterize the molecular epidemiology and amr mechanisms of this pathogen. we sequenced the whole genome for each of 176 p. aeruginosa isolates collected in the philippines in 2013–2014; derived the multilocus sequence type (mlst), presence of amr determinants and relatedness between isolates; and determined concordance between phenotypic and genotypic resistance. carbapenem resistance was associated with loss of function of the oprd porin and acquisition of the metallo-β-lactamase (mbl) gene blavim. concordance between phenotypic and genotypic resistance was 93.27% overall for six antibiotics in three classes, but varied among aminoglycosides. the population of p. aeruginosa was diverse, with clonal expansions of xdr genomes belonging to mlsts st235, st244, st309 and st773. we found evidence of persistence or reintroduction of the predominant clone st235 in one hospital, and of transfer between hospitals. most of the st235 genomes formed a distinct lineage from global genomes, thus raising the possibility that they may be unique to the philippines. in addition, long-read sequencing of one representative xdr st235 isolate identified an integron carrying multiple resistance genes (including blavim-2), with differences in gene composition and synteny from the p. aeruginosa class 1 integrons described previously. the survey bridges the gap in genomic data from the western pacific region and will be useful for ongoing surveillance; it also highlights the importance of curtailing the spread of st235 within the philippines. wpsar vol 12, no 2, 2021 | doi: 10.5365/wpsar. 2020.11.1.006 www.wpro.who.int/wpsar2 chilam et alp. aeruginosa surveillance in the philippines ment options. these reports coincide with multi-locus sequence type (mlst) st235,9–11 the predominant global epidemic clone. the metallo-β-lactamase (mbl) genes blavim and blaimp – usually associated with integrons carrying multiple resistance determinants – have been identified in st235 p. aeruginosa isolates from asian countries.12–14 while the resistance rates and profiles of p. aeruginosa in the philippines have been well characterized,15,16 the molecular epidemiology and amr mechanisms of this pathogen remain largely unknown. whole-genome sequencing (wgs) can identify transmission patterns, amr mechanisms and the source of ha infections.17 in this study, we characterized the clonal relatedness and resistance determinants of p. aeruginosa isolates from the arsp using wgs. methods bacterial isolates a total of 7877 p. aeruginosa isolates were collected and tested for resistance by the arsp from january 2013 to december 2014. of the 443 and 283 isolates referred to the antimicrobial resistance surveillance reference laboratory (arsrl) for confirmation in 2013 and 2014, respectively, 179 isolates from 17 sentinel sites were selected for wgs, as previously described.18 briefly, 113 isolates of carbapenemase-producing p. aeruginosa were selected; also included were 66 available isolates that were susceptible to all antibiotics tested. we used a proxy definition for “infection origin”, whereby initial infection isolates collected in the community or on either of the first 2 days of hospitalization were categorized as communityacquired (ca), and isolates collected on hospital day 3 or later were categorized as hospital-acquired (ha).19 antimicrobial susceptibility testing (ast) all p. aeruginosa isolates from this study were tested for susceptibility to nine antibiotics representing five classes: amikacin (amk), ceftazidime (caz), ciprofloxacin (cip), cefepime (fep), gentamicin (gen), imipenem (ipm), meropenem (mem), tobramycin (tob), and piperacillintazobactam (tzp) (table 1). antimicrobial susceptibility of the isolates was determined at arsrl using the kirbybauer disk diffusion method, and gradient methods such as e-test (biomérieux, marcy-l’étoile, france) and vitek 2 nolones remained relatively stable or decreased slightly in the same period (fig. 1c). the arsp has also reported multidrug-resistant (mdr) rates of 21–23% and possible extensively drug-resistant (xdr) rates of 13–18% in recent years.6–8 the emergence of mdr p. aeruginosa with resistance to carbapenems, aminoglycosides and fluoroquinolones was followed by reports of isolates sensitive only to colistin9 and, more recently, of colistin resistance in carbapenem non-susceptible isolates,10 leaving few treatfig. 1a-c. annual resistance rates to nine antibiotics of p. aeruginosa isolates referred to the arsp, 2005–2014 amk: amikacin; caz: ceftazidime; cip: ciprofloxacin; fep: cefepime; gen: gentamicin; ipm: imipenem; lvx: levofloxacin; mem: meropenem; tzp: piperacillin-tazobactam. wpsar vol 12, no 2, 2021 | doi: 10.5365/wpsar.2020.11.1.006www.wpro.who.int/wpsar 3 p. aeruginosa surveillance in the philippineschilam et al * amk: amikacin; amr: antimicrobial resistance; arsp: antimicrobial resistance surveillance program; arsrl: antimicrobial resistance surveillance reference laboratory; caz: ceftazidime; cip: ciprofloxacin; fep: cefepime; gen: gentamicin; ipm: imipenem; mem: meropenem; tob: tobramycin; tzp: piperacillin-tazobactam; xdr: extensively drug resistant; wgs: whole-genome sequencing. ** bgh: baguio general hospital and medical center; brh: batangas medical center; cmc: cotabato regional and medical center; cvm: cagayan valley medical center; dmc: southern philippines medical center; evr: eastern visayas regional medical center; feu: far eastern university nicanor reyes medical foundation; gmh: governor celestino gallares memorial hospital; jlm: jose b. lingad memorial regional hospital; mmh: corazon locsin montelibano memorial regional hospital; nki: national kidney and transplant institute; nmc: northern mindanao medical center; rmc: rizal medical center; slh: san lazaro hospital; stu: university of santo tomas hospital; vsm: vicente sotto memorial medical center. table 1. total number of p. aeruginosa isolates analysed by the arsp and referred to the arsrl during 2013 and 2014, isolates submitted for wgs, and high-quality p. aeruginosa genomes obtained, discriminated by sentinel site and amr profile number of isolates 2013 2014 total total arsp 3591 4286 7877 referred to arsrl 443 283 726 submitted for wgs 89 90 179 high-quality genomes 87 89 176 by sentinel site * bgh 2 4 6 brh 0 5 5 cmc 0 1 1 cvm 2 3 5 dmc 5 2 7 evr 2 2 4 feu 2 2 4 gmh 4 4 8 jlm 2 5 7 mmh 3 5 8 nki 10 16 26 nmc 3 8 11 rmc 2 0 2 slh 0 1 1 stu 5 4 9 vsm 32 16 48 by amr profile ** susceptible 36 30 66 caz fep ipm mem tzp gen tob amk cip [xdr] 30 29 59 ipm mem 7 9 16 caz fep ipm mem tzp gen tob cip [xdr] 4 7 11 caz fep ipm mem tzp gen tob amk 1 4 5 cip 3 2 5 caz fep ipm mem tzp 1 2 3 ipm mem tzp cip 0 1 1 gen tob cip 1 0 1 fep tzp tob cip 0 1 1 caz fep ipm mem gen tob 1 0 1 ipm 1 0 1 caz fep ipm mem gen tob cip 1 0 1 ipm mem cip 1 0 1 caz fep gen tob amk cip 0 1 1 fep ipm mem gen tob cip 0 1 1 caz 0 1 1 caz fep tzp 0 1 1 wpsar vol 12, no 2, 2021 | doi: 10.5365/wpsar. 2020.11.1.006 www.wpro.who.int/wpsar4 chilam et alp. aeruginosa surveillance in the philippines compact automated system (biomérieux). to determine the resistance profile of the isolates, the zone of inhibition and minimum inhibitory concentration of antibiotics were interpreted according to guidelines from the clinical and laboratory standard institute (clsi).20 mdr phenotypes were classified according to standard definitions.21 dna extraction and wgs a total of 179 p. aeruginosa isolates were shipped to the wellcome trust sanger institute for wgs. dna was extracted from a single colony of each isolate with the qiaamp 96 dna qiacube ht kit and a qiacube ht (qiagen, hilden, germany). dna extracts were multiplexed and sequenced on the illumina hiseq platform (illumina, ca, usa) with 100-bp paired-end reads. isolate 13arsvsm740 was also sequenced with the pacbio rsii platform (pacific biosciences). raw sequence data were deposited in the european nucleotide archive (ena) under the study accession prjeb17615. run accessions for illumina data are provided on the microreact projects. the pacbio data were deposited under run accession err3284501. bioinformatics analysis genome quality was evaluated based on metrics generated from assemblies, annotation files and the alignment of the isolates to the reference genome of p. aeruginosa strain lesb58 (accession fm209186), as previously described.18 assemblies were produced from short-read illumina data18 and from long-read pacbio data with the hgap v4 pipeline (pacific biosciences). a total of 176 isolates yielded high-quality p. aeruginosa genomes and were included in this study. we derived the mlst of the isolates from the whole genome sequences. the sequence types (st) were determined from assemblies with pathogenwatch (https:// pathogen.watch/) and with mlstcheck v1.007001, and from sequence reads with ariba22 and the p. aeruginosa database hosted at pubmlst.23 the mlst calls were curated, as previously described.18 integrons were detected in the genome assemblies with integronfinder.24 evolutionary relationships between the 176 isolates were inferred from core single-nucleotide polymorphism (snp). a core gene alignment was performed with roary v3.11.3, using the mafft aligner option and minimum percentage identity for blastp of 90%. evolutionary relationships between 169 isolates from groups 1 and 2 were inferred from snps by mapping the paired-end reads to the reference genomes of p. aeruginosa strains lesb58 (st146, fm209186) or ncgm2_s1 (st235, ap012280.1).18 mobile genetic elements (mges) were masked in the alignment of pseudogenomes with a script available at https://github.com/sanger-pathogens/ remove_blocks_from_aln. for the phylogenetic analysis of st235 genomes, recombination regions detected with gubbins25 were also removed. alignments of snps were inferred with snp-sites v2.4.1,26 and were used to compute pairwise snp differences between isolates from different patients (minimum n = 3) belonging to the same or to different hospitals, using a script from https:// github.com/simonrharris/pairwise_difference_count. maximum likelihood phylogenetic trees were generated with raxml,27 based on the generalized time reversible (gtr) model with gamma method of correction for among-site rate variation and 100 bootstrap replications. to contextualize the philippine genomes, we downloaded, assembled and quality controlled global p. aeruginosa genomes with linked geographical and temporal information, collected mainly between 2007 and 2017, for which raw illumina paired-end sequence data were available at the ena. a tree of 904 genomes was inferred with fasttree28 from an alignment of 549 126 snp positions, obtained after mapping the reads to the complete genome of strain lesb58 and masking regions with mges. a tree of 96 global st235 genomes was inferred with raxml from an alignment of 1993 snp sites obtained after mapping the genomes to the complete genome of strain ncgm2-s1, and masking mges and recombination regions. known amr determinants were identified with ariba22 and a curated database of known resistance genes and mutations,29 the comprehensive antibiotic resistance database,30 and a custom database of mutations in the quinolone resistance-determining region of the gyra/b and parc/e genes described for p. aeruginosa.4 the output for the porin gene oprd was inspected to detect loss-of-function mutations. the oprd sequences were extracted from the whole-genome draft assemblies with blastn, using the oprd sequence from strain pao1 (accession nc_002516.2, genome positions 1043982–1045314) as a query, then translated in silico to inspect the integrity of the coding frames. a 444 or https://pathogen.watch/ https://pathogen.watch/ https://github.com/sanger-pathogens/ https://github.com/simonrharris/pairwise_difference_count https://github.com/simonrharris/pairwise_difference_count wpsar vol 12, no 2, 2021 | doi: 10.5365/wpsar.2020.11.1.006www.wpro.who.int/wpsar 5 p. aeruginosa surveillance in the philippineschilam et al 442 amino-acid protein that included a start and a stop codon was considered functional. the genomic predictions of amr derived from the presence of known amr genes and mutations (test) were compared with the phenotypic results (reference), and concordance was computed for each of six antibiotics (1056 total comparisons). isolates with either a resistant or an intermediate phenotype were considered non-susceptible. an isolate with the same outcome for both the test and reference (i.e. both susceptible or both non-susceptible) was counted as a concordant isolate. concordance was the number of concordant isolates as a percentage of the total number of isolates assessed. all project data, including inferred phylogenies, amr predictions and metadata were made available through microreact. ethics statement ethical approval is not applicable. this study uses archived bacterial samples processed by the arsp. no identifiable data were used in this study. results demographic and clinical characteristics of the p. aeruginosa isolates of the 179 p. aeruginosa isolates submitted for wgs, 176 passed quality control and were confirmed in silico as p. aeruginosa (table 2). patients were aged from under 1 to 96 years, with 27% (n = 47) of the isolates from patients aged 65 years or older. fifty-eight per cent (n = 102) of the isolates were from ha infections. in terms of specimen type, 53% (n = 94) of isolates were from respiratory samples (tracheal aspirates and sputum). concordance between phenotypic and genotypic amr isolates were tested for susceptibility to nine antibiotics representing five classes (fig. 1a-c, table 3). most isolates were non-susceptible to carbapenems (n = 100), 10 isolates were susceptible to carbapenems but resistant to other antibiotics, and 66 isolates were susceptible to all nine antibiotics (table 1). ca infections table 2. demographic and clinical characteristics of 176 p. aeruginosa isolatesa characteristic no. isolates sex male 119 female 57 age (in years) < 1 12 1–4 6 5–14 7 15–24 14 25–34 5 35–44 17 45–54 29 55–64 34 65–80 36 ≥ 81 11 age unknown 5 patient type inpatient 159 outpatient 17 specimen origin community-acquired 74 hospital-acquired 102 submitted as carbapenem non-susceptible 100 resistant to at least 1 antibiotic other than carbapenems 10 susceptible 66 specimen type abdominal fluid* 1 abscess 1 blood* 21 bronchial 1 catheter 2 cerebrospinal fluid* 3 cornea 2 dialysis fluid* 1 drainage 1 fluid 3 inguinal 1 other 1 pleural fluid* 1 sputum 31 tissue 5 tracheal 1 tracheal aspirate 63 urine 12 wound 25 a invasive isolates were considered as those obtained from specimen types marked with an asterisk (*). wpsar vol 12, no 2, 2021 | doi: 10.5365/wpsar. 2020.11.1.006 www.wpro.who.int/wpsar6 chilam et alp. aeruginosa surveillance in the philippines were more frequently associated with susceptible isolates and ha infections with resistant isolates (fig. 1d, twotailed fisher’s exact test p = 0.000002). of the 18 isolates resistant to imipenem and meropenem but not to other β-lactam antibiotics, 17 carried both loss-of-function disruptions in the oprd porin, and disruptions or known non-synonymous mutations in the nalc (a186t, g71e, s209r) and/or nald (s32n) regulafig. 1e. mechanisms of resistance to carbapenems and other β-lactam antibiotics identified in the genomes of 176 isolates grouped by their resistance profilea fig. 1d. association between resistance and the origin of infection for 176 p. aeruginosa isolates sequenced in this study ca: community-acquired; ha: hospital-acquired; resistant: resistant to at least one antibiotic tested; susceptible: susceptible to all nine antibiotics tested. tors of the mexab-oprm multidrug efflux pump, suggesting that their resistance is due to a combination of reduced influx and increased efflux of the carbapenem antibiotics (fig. 1e). among the 81 carbapenem-resistant isolates that were also resistant to third-generation cephalosporin ceftazidime and/or fourth-generation cephalosporin cefepime, 67 isolates carried acquired mbl genes blavim-2 (n = 61 genomes), blavim-6 (n = 1), blaimp-26 (n = 4) or blandm-1 (n = 1), while five carried disrupted oprd genes plus acquired extended-spectrum β-lactamase (esbl) genes blaper-1 (n = 3), blactx-m-15 (n = 1) or ampc-like gene bladha-1 (n = 1). the remaining eight isolates harboured other β-lactamase genes, but their carbapenemresistance mechanisms remain uncharacterized. of the 76 isolates susceptible to carbapenems, 75 carried either a full-length oprd porin (444 amino acids) without any known mutations, or a 442 amino acid-long oprd protein with an intact reading frame, while one isolate was missing the stop codon in the oprd gene. the overall phenotypic and genotypic concordance was 93.27% for the six antibiotics analysed (table 3). the concordance was above 96% for carbapenems. a for simplicity, only the main mechanism is indicated. amk: amikacin; caz: ceftazidime; cip: ciprofloxacin; fep: cefepime; gen: gentamicin; ipm: imipenem; mem: meropenem; tob: tobramycin; tzp: piperacillin-tazobactam. wpsar vol 12, no 2, 2021 | doi: 10.5365/wpsar.2020.11.1.006www.wpro.who.int/wpsar 7 p. aeruginosa surveillance in the philippineschilam et al genotypic findings in silico genotyping a total of 79 sts were identified (table 4), with 27.8% (n = 49) belonging to st235, followed by st309 (5.7%, n = 10), st244 and st773 (5.1% each, n = 9). the majority of the sts (79.7%, n = 63) were singletons (represented by only one genome), most of which (n = 42) were contributed by the susceptible isolates. indeed, the resistant isolates (36 sts, n = 110) exhibited less clonal diversity than the susceptible isolates (56 sts, n = 66). st235 represented 43.6% (n = 48) of the resistant isolates but only 1.5% (n = 1) of the susceptible isolates, and was predominantly a nosocomial clone in the philippines (36 ha vs 13 ca isolates), spread across 13 hospitals. population structure of p. aeruginosa in the philippines the phylogenetic tree of 176 genomes from the philippines comprises three major groups,31 group 1 (n = 64) including pa14, group 2 (n = 105) including pao1 and the more distantly related group 3 (n = 7) including pa7 (fig. 2a). all three groups included carbapenemresistant isolates and susceptible isolates, though most isolates in group 2 were susceptible (n = 39, 60.9%) and most in group 1 were resistant (n = 75, 71.4%, fig. 2b). the population of p. aeruginosa comprises a limited number of widespread clones selected from a diverse pool of rare, unrelated genotypes that recombine at high frequency.32 a phylogenetic tree of 169 genomes from groups 1 and 2 showed that the clonal expansions were mostly within the major group 1 – represented by st235, st309, st773 and st313 (fig. 2b) – found across multiple hospitals and resistant to multiple antibiotics. most of the xdr isolates (n = 61, 87%) were found in st235, st244, st309 and st773, and most (n = 44, 62.8%) carried blavim (an mbl that can degrade all anti-pseudomonal β-lactamases except for aztreonam),1 aac(6’)-ib (an aminoglycoside acetyltransferase conferring resistance to tobramycin and amikacin), and the non-synonymous mutation t83i on gyra associated with resistance to fluoroquinolones. the higher prevalence of st235 prompted us to look further at this clone. the phylogenetic tree of 49 st235 isolates comprised two distinct clades with different geographic distribution (fig. 2c). clade i (n = 10) was represented in five hospitals in the luzon (north) and visayas (central) island groups, while clade ii (n = 39) was represented in 10 hospitals from north to south of the country. the phylogeographic structure of the tree and the relatedness between genomes showed evidence of dissemination of st235 between hospitals. within clade ib (fig. 2c), one genome from hospital nki differed from two genomes from hospital brh by seven and eight snps, respectively. within clade iib (fig. 2c), the genetic differences between isolates from the same hospital (mean pairwise snp differences 36.41 ± 20.84, range 0–64) were not significantly different to those between isolates from different hospitals (mean 45.36 ± 8.12, range 29–61, mann–whitney u test z-score = –1.49145, p = 0.13622). the close relationships and the common repertoire of resistance genes between isolates from different hospitals support inter-hospital transmission. the genomes from the hospital vsm (n = 24) formed at least three clusters within clade iib, two of which exhibited discrete temporal distribution (vsm-2 and vsm-3, fig. 2c), suggesting that they could represent hospital outbreaks. in agreement with this, the genomes from different patients within clade vsm-3 differed by an average of 11.55 pairwise snps (range 0–24). we also identified isolates within vsm-3 that were collected nine or more months apart (fig. 2c), suggesting that st235 can either persist in or be reintroduced to the hospital environment. the distribution of acquired resistance genes and mutations showed that resistance determinants differed between clades i and ii, with patterns that were consistent with the acquisition of multiple genes simultaneously by mobile genetic elements. long-read sequencing of isolate 14ars-vsm0870, representative of the xdr resistant profile caz fep ipm mem tzp gen tob amk cip (marked with an asterisk on fig. 2c), revealed the acquisition of blavim-2, blaoxa-10, catb3, aada1 (ant(3”)-ia) and acc(6’)-ib within a class 1 integron integrated in the chromosome at position 977 774 (fig. 2d). the ciprofloxacin resistance gene wpsar vol 12, no 2, 2021 | doi: 10.5365/wpsar. 2020.11.1.006 www.wpro.who.int/wpsar8 chilam et alp. aeruginosa surveillance in the philippines fig. 2. genomic surveillance of p. aeruginosa from the philippines, 2013–2014 d blavim-2 inti1inti1 aada1 catb3sul1 ltra 977774967379 qace ∆ aac(6’)-ibblaoxa-10 3’cs 5’cs 1 kb gr ou p 1 gro up 2 st235s t30 9 st 77 3 st313 st24 4 caz fep ipm mem gen tob caz fep ipm mem gen tob cip caz fep ipm mem tzp caz fep ipm mem tzp gen tob amk caz fep ipm mem tzp gen tob amk cip caz fep ipm mem tzp gen tob cip fep ipm mem gen tob cip ipm ipm mem ipm mem cip ipm mem tzp cip susceptible to carbapenems present absent inner circle: resistance profile outer circles: blavim, blaimp, blandm b a group 3 (n=7) pao1 lesb58 pak ubcpp-pa14 ncgm-1984 ncgm-1900 ncgm2-s1 group 1 (n=64) group 2 (n=105) pa7 c vsm-2 vsm-3 vsm-3 i ii ib vsm-1 vsm-2 vsm-3 * iib a p h (6 ’)id a p h (3 ’)ib a p h (3 ’)v i a p h (3 ’)ia a p h (3 ’)iib a n t( 3’ ’)ia a n t( 2’ ’)ia a a c (6 ’)il a a c (6 ’)ib a a c (6 ’)iia a a c (6 ’)31 a a c (3 )iie ar r2 st rb st ra m sr e m ph e df ra 14 su l1 cm la 1 gy ra _t 83 i qn rv c qn rd na lc d l of op rd l of bl at em -1 bl ap er -1 bl ad h a -1 bl ao x a -4 15 bl ao x a -1 0 bl ao x a -1 bl ac tx -m -1 5 bl av im r es is ta nc e p ro fil e fig. 2a. phylogenetic tree of 176 isolates from the philippines and eight reference genomes, inferred with raxml from an alignment of 396 194 core snp sites. the reference genomes are indicated by grey nodes. fig. 2b. phylogenetic tree of 169 isolates from groups 1 and 2 inferred with raxml from an alignment of 305 220 snp sites obtained after mapping the genomes to the complete genome of strain lesb58 and masking mobile genetic elements from the alignment. the tree leaves are coloured by sentinel site and indicated on the map (left panels, top: philippines, bottom: detail of the national capital region). tree rings indicate (from inner to outer) the distribution of the carbapenem-resistant profiles and of carbapenemase genes blavim, blaimp and blandm. the data, including the full distribution of resistance determinants, are available at https://microreact.org/project/arsp_169pae_2013–2014. fig. 2c. phylogenetic tree of 49 st235 genomes inferred from an alignment of 1066 snp sites obtained after mapping the genomes to the complete genome of strain ncgm2-s1 (st235) and masking mobile genetic elements and recombination regions. the tree leaves are coloured by sentinel site as indicated on the map from fig. 2b. the tree blocks represent the distribution of the carbapenem-resistant profiles and of acquired resistance genes and mutations. the representative isolate sequenced with long reads is shown with an asterisk. the full data are available at https://microreact.org/project/arsp_pae_st235_2013–14. the scale bars represent the number of snps per variable site. fig. 2d. resistance genes acquired en bloc within a class 1 integron in p. aeruginosa strain 14ars-vsm0870. arrows indicate genes conferring resistance to β-lactamases (orange), aminoglycosides (yellow), chloramphenicol (green) and sulphonamides (blue), or related to dna mobilization/integration (grey). 3’cs and 5’cs: conserved segments. https://microreact.org/project/arsp_169pae_2013-2014 wpsar vol 12, no 2, 2021 | doi: 10.5365/wpsar.2020.11.1.006www.wpro.who.int/wpsar 9 p. aeruginosa surveillance in the philippineschilam et al qnrvc and the rifampin-resistance gene arr-2 were located on a different class 1 integron elsewhere in the genome. p. aeruginosa from the philippines in the global context we placed the genomes from our retrospective collection in the global context of 904 contemporary p. aeruginosa public genomes. this collection of public genomes represented 17 countries and 178 sts, with more than 60% of the genomes being from europe (n = 373) and the united states of america (usa) (n = 205). the philippine genomes were found throughout the tree, indicating that the p. aeruginosa population captured in our survey largely represents the global diversity of this pathogen. notably absent were the epidemic clones st111 and st175 (fig. 3a), which, together with st235, are responsible for mdr and xdr nosocomial infections worldwide. a more detailed tree of 96 st235 genomes of global distribution showed three major clades: clade 1 was represented by isolates from japan, the philippines, poland and thailand (n = 2); clade 2 showed the broadest geographic distribution across four continents and also included isolates from this study (n = 3); clade 3 comprised exclusively isolates from the philippines (n = 44, fig. 3b), which raises the possibility that this lineage of st235 is characteristic to the philippines; however, introductions from the other globally dispersed lineages may also occur, as shown in clades 1 and 2. discussion in this study, we combined wgs and laboratory-based surveillance to characterize susceptible and resistant p. aeruginosa circulating in the philippines in 2013 and 2014, with a particular emphasis on resistance to carbapenems, which increased in the years preceding this survey. drug-resistant p. aeruginosa infections are difficult to treat, resulting in poor patient outcomes. in a tertiary hospital in manila, severity of illness and mortality rates were significantly higher among patients infected with drug-resistant p. aeruginosa than among those infected with susceptible isolates, while median duration of hospital stay was significantly longer.33 p. aeruginosa strains exhibit a complex interplay between resistance mechanisms, both intrinsic and acquired.34 the current gaps in understanding of some of these mechanisms were reflected in the variable concordance between phenotypic and genotypic resistance for the different antibiotics, even for those antibiotics belonging to the same class (aminoglycosides). our characterization of the carbapenem resistance showed a combination of diverse known mechanisms, from inhibition of antibiotic influx into the cell, to upregulation of antibiotic efflux out of the cell and carbapenemase enzymes. the concordance between phenotypic and genotypic predictions of amr was high for the carbapenems, but it required a degree of curation of results that is not practical within public health settings. there are clear limitations in the genomic predictions of amr for p. aeruginosa. first, publicly available, curated databases are not comprehensive of all the known mechanisms. we found no mutations leading to upregulation of the chromosomal cephalosporinase ampc (blapao), but an exhaustive search would require additional analyses. second, the regulatory pathways of some mechanisms are not fully understood, such as those that regulate ampc.34,35 third, extensive manual curation of some of the predictions is needed to ensure accuracy, for example of the loss-of-function mutations in the oprd gene. the most prevalent clone in our data set was st235 (27.8% of the isolates, n = 49), found throughout the philippines. st235 is a well-characterized international epidemic clone causing drug-resistant nosocomial outbreaks.32 isolates carrying blavim-2 and belonging to st235 were reported from malaysia, the republic of korea and thailand.13 using wgs, we showed evidence of potential localized hospital outbreaks of st235, as well as of persistence or reintroduction of this clone within one hospital. the number of snp differences between genomes of isolates from different patients (0–24) were consistent with those reported for a persistent outbreak of p. aeruginosa in a hospital in the united kingdom of great britain and northern ireland.36 we also showed evidence of transfer of st235 between hospitals, with isolates from different hospitals separated by as few as seven snps. patient transfer between hospitals is not common in the philippines, but the sampling for this wpsar vol 12, no 2, 2021 | doi: 10.5365/wpsar. 2020.11.1.006 www.wpro.who.int/wpsar10 chilam et alp. aeruginosa surveillance in the philippines fig. 3. p. aeruginosa from the philippines in the global context a st244 st755 st968 st233 st308 st1971 st773 st235 st253 st146 st175 st111 b 123 fig. 3a. phylogenetic tree of 904 p. aeruginosa isolates from the philippines (n = 176, this study) and from 57 other countries inferred from 549 126 snp positions. the yellow tree nodes indicate the genomes from this study. the major lineages (sts) are labelled in black if represented by genomes of this study, or in brown if they are not. the data are available at https://microreact.org/project/arsp_pae_global. fig. 3b. phylogenetic tree of 96 st235 isolates inferred from an alignment of 1993 snp positions. the tree leaves are coloured by country as indicated on the map. the tree is annotated with the distribution of blavim and blaimp genes (red: present, grey: absent). the data are available at https://microreact.org/project/ arsp_pae_st235_global. the scale bars represent the number of snps per variable site. https://microreact.org/project/arsp_pae_global https://microreact.org/project/arsp_pae_st235_global https://microreact.org/project/arsp_pae_st235_global wpsar vol 12, no 2, 2021 | doi: 10.5365/wpsar.2020.11.1.006www.wpro.who.int/wpsar 11 p. aeruginosa surveillance in the philippineschilam et al table 3. comparison of genomic predictions of antibiotic resistance with laboratory susceptibility testing at the arsrl ast: antimicrobial susceptibility testing. wpsar vol 12, no 1, 2021 | doi: 10.5365/wpsar. 2020.11.1.006 www.wpro.who.int/wpsar10 chilam et alsee and sequence p. aeruginosa of p. aeruginosa in a hospital in the united kingdom.36 we also showed evidence of transfer of st235 between hospitals (fig. 2c), with isolates from different hospitals separated by as few as seven snps. patient transfer between hospitals is not common in the philippines, but the sampling for this study only allows us to hypothesize about a possible role of the community, animals or the environment in the spread of this clone. it was previously proposed that st235 emerged in europe in about 1984, coinciding with the introduction of fluoroquinolones, and then disseminated to other regions via two independent lineages, acquiring resistance determinants to aminoglycosides and β-lactams locally.14 simultaneous acquisition of resistance to multiple antibiotics via integrons, transposons and integrative conjugative elements is well described in p. aeruginosa, (36) and is apparent in the distribution of resistance genes in our genomes (fig. 2c). we have shown an example of a class i integron carrying six resistance genes in the genetic background of st235 (fig. 2c-d). while this integron shared some features with others previously described in p. aeruginosa,13,32 such as the 5’ and 3’ conserved curated databases are not comprehensive of all the known mechanisms. we found no mutations leading to upregulation of the chromosomal cephalosporinase ampc (blapao), but an exhaustive search would require additional analyses. second, the regulatory pathways of some mechanisms are not fully understood, such as those that regulate ampc.34,35 third, extensive manual curation of some of the predictions is needed to ensure accuracy, for example of the loss-of-function mutations in the oprd gene. the most prevalent clone in our data set was st235 (27.8% of the isolates, n = 49), found throughout the philippines. st235 is a well characterized international epidemic clone causing drug-resistant nosocomial outbreaks.32 isolates carrying blavim-2 and belonging to st235 were reported from south korea, malaysia and thailand.13 using wgs, we showed evidence of potential localized hospital outbreaks of st235, as well as of persistence or reintroduction of this clone within one hospital. the number of snp differences between genomes of isolates from different patients (0–24) were consistent with those reported for a persistent outbreak table 3. comparison of genomic predictions of antibiotic resistance with laboratory susceptibility testing at the arsrl antibiotic class antibiotic isolates tested resistant isolates (ast) false positive false negative concordance (%) acquired resistance mechanisms carbapenem imipenem 176 100 1 4 97.16 blavim-2, blavim-6, blandm-1, blaimp-26, oprd loss-of-function (oprd interrupted, fragmented, or missing, presence of premature stop, start codon missing), nalc/d lossof-function (nalc missing, nalc_g71e, s209r, a186t, nald_s32n) meropenem 176 99 2 4 96.59 aminoglycoside gentamicin 176 77 0 34 80.68 aac(3)-iie, aac(6’)-31, aac(6’)-iia, ant(2”)-ia tobramycin 176 78 2 3 97.16 aac(3)-iie, aac(6’)-31, aac(6’)-ib, aac(6’)-ib-cr, aac(6’)-iia, ant(2”)-ia amikacin 176 61 14 4 89.77 aac(6’)-31, aac(6’)-ib, aac(6’)-iia, aph(3’)-vi fluoroquinolone ciprofloxacin 176 82 5 12 93.75 qnrd, qnrvc, aac(6')-ib-cr, gyra_d87n, d87y, t83i, gyrb_e468d, s466f, parc_s87l study only allows us to hypothesize about a possible role of the community, animals or the environment in the spread of this clone. it was previously proposed that st235 emerged in europe around 1984, coinciding with the introduction of fluoroquinolones, and then disseminated to other regions via two independent lineages, acquiring resistance determinants to aminoglycosides and β-lactams locally.14 simultaneous acquisition of resistance to multiple antibiotics via integrons, transposons and integrative conjugative elements is well described in p. aeruginosa,36 and is apparent in the distribution of resistance genes in our genomes. we have shown an example of a class 1 integron carrying six resistance genes in the genetic background of st235. while this integron shared some features with others previously described in p. aeruginosa,13,32 such as the 5’ and 3’ conserved segments,37 the gene composition and synteny was different, supporting the hypothesis of local acquisition of resistance. country-specific st235 lineages have been reported previously,11,14 confirming that country-wide clonal expansions may occur in the context of the global circulation of this clone. a previous longitudinal study showed vim-2-positive st235 spreading throughout belarus, kazakhstan and the russian federation, albeit without the resolution of whole genome data.38 the contextualization of our genomes with international st235 genomes showed a distinct cluster of philippine genomes with limited genetic variability, suggesting the clonal expansion and geographic dissemination of this lineage across the philippines. alternatively, this could be explained by the limited representation of the western pacific region in the collection of global genomes, highlighting the need for public genome data with more even geographical coverage. our retrospective survey contributed to bridging this gap by making raw sequence data available on public archives. in conclusion, our detailed description of the epidemiology and resistance mechanisms of st235 in the philippines suggests that the burden of xdr p. aeruginosa infections in the philippines may be largely driven by a local lineage of the international epidemic clone st235. a recent study in a hospital in jakarta, indonesia analysed the population composition of p. aeruginosa before and after a multifaceted infection control intervention, with the relative abundance of st235 wpsar vol 12, no 2, 2021 | doi: 10.5365/wpsar. 2020.11.1.006 www.wpro.who.int/wpsar12 chilam et alp. aeruginosa surveillance in the philippines table 4. distribution of isolates, sequence types (sts), resistance profiles and acquired resistance mechanisms across the 17 sentinel sitesa wpsar vol 12, no 1, 2021 | doi: 10.5365/wpsar.2020.11.1.006www.wpro.who.int/wpsar 11 see and sequence p. aeruginosachilam et al table 4. distribution of isolates, sequence types (sts), resistance profiles and acquired resistance mechanisms across the 17 sentinel sites. only genes and mutations associated with the antibiotic classes tested are shown (β-lactamases, aminoglycosides, and fluoroquinolones). the full complement can be found in https://microreact.org/project/arsp_176pae_2013–2014. laboratory no. of isolates no. of sts prevalent st (no. of isolates) resistance profiles acquired resistance determinants bgh 6 5 309 (2) susceptible (2) caz fep ipm mem tzp gen tob cip (2) caz fep ipm mem tzp gen tob amk cip (1) ipm mem (1) nalc/d lof (2) imp-26, aac(6’)-ib, qnrvc1, oprd lof, nalc/d lof (1) vim-2, aac(6’)-ib4, ant(3”)-ia, gyra.d87y, oprd lof, nalc/d lof (1) vim-2, aac(6’)-ib4, ant(3”)-ia, qnrvc1, gyra.t83i, oprd lof, nalc/d lof (1) oprd lof, nalc/d lof (1) brh 5 3 235 (2) caz fep ipm mem tzp gen tob amk cip (3) susceptible (2) aac(6’)-31, aac(6’)-il, ant(3”)-ia, aph(3’)-vi, gyra. t83i, parc.s87l, oprd lof, nalc/d lof (2) vim-2, aac(6’)-ib4, aph(3’)-ia, qnrvc1, nalc/d lof (1) nalc/d lof (2) cmc 1 1 1121 caz fep ipm mem tzp gen tob amk cip (1) ant(2”)-ia, ant(3”)-ia, qnrvc1, nalc/d lof (1) cvm 5 3 235 (3) caz fep ipm mem tzp gen tob amk cip (2) susceptible (2) caz fep ipm mem tzp gen tob cip (1) vim-2, aac(6’)-ib4, ant(2”)-ia, ant(3”)-ia, gyra.t83i, parc.s87l, oprd lof, nalc/d lof (2) nalc/d lof (2) vim-2, aac(6’)-ib4, ant(2”)-ia, ant(3”)-ia, gyra.t83i, parc.s87l, oprd lof, nalc/d lof (1) dmc 7 7 9, 463, 381, 244, 639, 303, 357 (1) susceptible (3) caz fep ipm mem tzp gen tob amk cip (2) ipm mem (2) nalc/d lof (2) none (1) ant(2”)-ia, ant(3”)-ia, aph(3’)-vi, qnrvc1, gyrb. s466f, oprd lof, nalc/d lof (1) imp-26, aac(6’)-ib4, ant(2”)-ia, ant(3”)-ia, qnrvc1, oprd lof, nalc/d lof (1) oprd lof, nalc/d lof (2) evr 4 4 1966~, 1978, 235, 1 823 (1) susceptible (2) cip (1) caz fep ipm mem tzp gen tob cip (1) nalc/d lof (2) nalc/d lof (1) vim-2, aac(6’)-ib4, aph(3’)-ia, nalc/d lof (1) feu 4 2 235 (3) caz fep ipm mem tzp gen tob amk cip (2) ipm mem cip (1) susceptible (1) vim-2, aac(6’)-ib4, ant(3”)-ia, gyra.t83i, parc.s87l, oprd lof, nalc/d lof (2) gyra.t83i, parc.s87l, oprd lof, nalc/d lof (1) nalc/d lof (1) gmh 8 3 313(4) caz fep ipm mem tzp gen tob amk (4) caz fep ipm mem tzp gen tob amk cip (4) vim-2, aac(6’)-ib4, nalc/d lof (4) vim-2, aac(6’)-ib4, ant(2”)-ia, ant(3”)-ia, gyra.t83i, parc.s87l, oprd lof, nalc/d lof (2) vim-2, aac(6’)-ib4, ant(2”)-ia, ant(3”)-ia, gyra.t83i, parc.s87l, nalc/d lof (1) vim-6, aac(6’)-ib4, gyra.t83i, parc.s87l, nalc/d lof (1) jlm 7 7 244, 1 597, 381, 261, 2 330, 309, 316 (1) susceptible (6) fep tzp tob cip (1) nalc/d lof (5) none (1) aac(6’)-ib-cr, gyra.t83i, parc.s87l, nalc/d lof (1) mar 24 20 357 (3) susceptible (14) ipm mem (6) caz fep ipm mem tzp (2) caz fep ipm mem tzp gen tob cip (1) gen tob cip (1) nalc/d lof (14) oprd lof, nalc/d lof (4) aac(6’)-ib, oprd lof, nalc/d lof (1) gyrb.e468d, oprd lof, nalc/d lof (1) oprd lof, nalc/d lof (2) ant(2”)-ia, ant(3”)-ia, gyra.t83i, parc.s87l, nalc/d lof (1) qnrvc1, nalc/d lof (1) mmh 8 5 272~(3) caz fep ipm mem tzp gen tob amk cip (2) caz fep ipm mem gen tob (1) caz fep ipm mem gen tob cip (1) caz fep ipm mem tzp (1) caz fep ipm mem tzp gen tob amk (1) caz fep ipm mem tzp gen tob cip (1) ipm mem tzp cip (1) vim-2, aac(3)-iie, aph(3’)-ia, aph(3’)-vi, oprd lof, nalc/d lof (2) imp-26, aac(6’)-ib4, aph(3’)-ia, aph(3’)-vi, nalc/d lof (1) imp-26, aac(6’)-ib4, aph(3’)-ia, aph(3’)-vi, nalc/d lof (1) ndm-1, ant(3”)-ia, aph(3’)-vi, oprd lof, nalc/d lof (1) vim-2, aac(3)-iie, aph(3’)-ia, aph(3’)-vi, nalc/d lof (1) aac(3)-iie, aac(6’)-ib4, ant(3”)-ia, aph(3’)-ia, gyra. t83i, parc.s87l, oprd lof, nalc/d lof (1) gyrb.e468d, oprd lof, nalc/d lof (1) wpsar vol 12, no 2, 2021 | doi: 10.5365/wpsar.2020.11.1.006www.wpro.who.int/wpsar 13 p. aeruginosa surveillance in the philippineschilam et al wpsar vol 12, no 1, 2021 | doi: 10.5365/wpsar. 2020.11.1.006 www.wpro.who.int/wpsar12 chilam et alsee and sequence p. aeruginosa textualization of our genomes with international st235 genomes showed a distinct cluster of philippine genomes (fig. 3b) with limited genetic variability (fig. 2c), suggesting the clonal expansion and geographic dissemination of this lineage across the philippines. alternatively, this could be explained by the limited representation of the western pacific region in the collection of global genomes, highlighting the need for public genome data with more even geographical coverage. our retrospective survey contributed to bridging this gap by making raw sequence data available on public archives. segments,37 the gene composition and synteny was different, supporting the hypothesis of local acquisition of resistance. country-specific st235 lineages have been reported previously,11,14 confirming that country-wide clonal expansions may occur in the context of the global circulation of this clone. a previous longitudinal study showed vim-2 positive st235 spreading throughout belarus, kazakhstan and the russian federation, albeit without the resolution of whole genome data.38 the conlaboratory no. of isolates no. of sts prevalent st (no. of isolates) resistance profiles acquired resistance determinants nki 26 21 235 (5) susceptible (15) caz fep ipm mem tzp gen tob amk cip (3) cip (3) caz fep gen tob amk cip (1) caz fep tzp (1) fep ipm mem gen tob cip (1) ipm (1) ipm mem (1) nalc/d lof (14) none (1) aac(6’)-31, aac(6’)-il, ant(3”)-ia, aph(3’)-vi, gyra. t83i, parc.s87l, oprd lof, nalc/d lof (1) vim-2, aac(6’)-ib4, ant(2”)-ia, ant(3”)-ia, gyra.t83i, vim-2, aac(6’)-ib4, ant(3”)-ia, qnrvc1, nalc/d lof (1) gyra.d87n, oprd lof, nalc/d lof (1) nalc/d lof (1) qnrvc1, nalc/d lof (1) gyra.t83i, parc.s87l, nalc/d lof (1) nalc/d lof (1) ant(2”)-ia, ant(3”)-ia, gyra.t83i, parc.s87l, oprd lof, nalc/d lof (1) oprd lof, nalc/d lof (1) ant(3”)-ia, oprd lof, nalc/d lof (1) nmc 11 6 244 (6) caz fep ipm mem tzp gen tob amk cip (6) susceptible (5) vim-2, aac(6’)-ib4, ant(3”)-ia, gyra.t83i, parc.s87l, oprd lof, nalc/d lof (4) aac(6’)-iia, ant(2”)-ia, ant(3”)-ia, gyra.t83i, parc. s87l, oprd lof, nalc/d lof (1) vim-2, aac(6’)-ib4, qnrvc1, gyra.t83i, parc.s87l, oprd lof, nalc/d lof (1) nalc/d lof (4) none (1) rmc 2 2 1632, 235 (1) cip (1) susceptible (1) gyra.t83i, parc.s87l, nalc/d lof (1) nalc/d lof (1) slh 1 1 235 caz fep ipm mem tzp gen tob cip (1) aac(6')-ib4, ant(3”)-ia, aph(3’)-ia, gyra.t83i, parc. s87l, oprd lof, nalc/d lof (1) stu 9 6 309 (3) caz fep ipm mem tzp gen tob amk cip (3) ipm mem (3) caz fep ipm mem tzp gen tob cip (2) susceptible (1) vim-2, aac(6’)-ib4, ant(3”)-ia, qnrvc1, gyra.t83i, oprd lof, nalc/d lof (3) oprd lof, nalc/d lof (2) nalc/d lof (1) vim-2, aac(6’)-ib4, ant(2”)-ia, ant(3”)-ia, gyra.t83i, parc.s87l, nalc/d lof (1) vim-2, aac(6’)-ib4, ant(2”)-ia, ant(3”)-ia, gyra.t83i, parc.s87l, oprd lof, nalc/d lof (1) none (1) vsm 48 16 235 (24) caz fep ipm mem tzp gen tob amk cip (30) susceptible (12) ipm mem (3) caz fep ipm mem tzp gen tob cip (2) caz (1) vim-2, aac(6’)-ib4, ant(2”)-ia, ant(3”)-ia, gyra.t83i, parc.s87l, oprd lof, nalc/d lof (9) vim-2, aac(6’)-ib4, ant(2”)-ia, ant(3”)-ia, qnrvc1, gyra.t83i, parc.s87l, oprd lof, nalc/d lof (8) vim-2, aac(6’)-ib4, ant(2”)-ia, ant(3”)-ia, qnrvc1, gyra.t83i, parc.s87l, nalc/d lof (3) vim-2, aac(6’)-ib4, aph(3’)-ia, qnrvc1, nalc/d lof (3) vim-2, aac(6’)-ib4, oprd lof, nalc/d lof (3) vim-2, aac(6’)-ib4, ant(2”)-ia, ant(3”)-ia, gyra.t83i, parc.s87l, nalc/d lof (2) vim-2, aac(6’)-ib4, qnrvc1, oprd lof, nalc/d lof (1) gyrb.s466f, oprd lof, nalc/d lof (1) nalc/d lof (12) oprd lof, nalc/d lof (3) vim-2, aac(6’)-ib4, ant(2”)-ia, ant(3”)-ia, qnrvc1, gyra.t83i, parc.s87l, nalc/d lof (1) ant(3”)-ia, gyra.t83i, parc.s87l, nalc/d lof (1) ant(3”)-ia, nalc/d lof lof: loss-of-functiona only genes and mutations associated with the antibiotic classes tested are shown (β-lactamases, aminoglycosides, and fluoroquinolones). the full complement can be found in https://microreact.org/project/arsp_176pae_2013–2014. lof: loss-of-function. almost halved in the 10 months post-intervention.39 this highlights the importance of hospital infection control and of preventive measures to contain the spread of this high-risk clone. acknowledgements none. funding this work was supported by a newton fund award from the medical research council (united kingdom) mr/n019296/1 and the philippine council for health research and development. additional support was provided by the national institute for health research (united kingdom) global health research unit on wpsar vol 12, no 2, 2021 | doi: 10.5365/wpsar. 2020.11.1.006 www.wpro.who.int/wpsar14 chilam et alp. aeruginosa surveillance in the philippines 11. miyoshi-akiyama t, tada t, ohmagari n, viet hung n, tharavichitkul p, pokhrel bm, et al. emergence and spread of epidemic multidrug-resistant pseudomonas aeruginosa. genome biol evol. 2017 dec 1;9(12):3238–45. doi:10.1093/gbe/evx243 pmid:29202180 12. castanheira m, bell jm, turnidge jd, mendes re, jones rn. dissemination and genetic context analysis of bla(vim-6) among pseudomonas aeruginosa isolates in asian-pacific nations. clin microbiol infect. 2010 feb;16(2):186–9. doi:10.1111/j.1469– 0691.2009.02903.x pmid:19673963 13. kim mj, bae ik, jeong sh, kim sh, song jh, choi jy, et al. dissemination of metallo-β-lactamase-producing pseudomonas aeruginosa of sequence type 235 in asian countries. j antimicrob chemother. 2013 dec;68(12):2820–4. doi:10.1093/jac/dkt269 pmid:23843299 14. treepong p, kos vn, guyeux c, blanc ds, bertrand x, valot b, et al. global emergence of the widespread pseudomonas aeruginosa st235 clone. clin microbiol infect. 2018 mar;24(3):258–66. doi:10.1016/j.cmi.2017.06.018 pmid:28648860 15. juayang ac, lim jpt, bonifacio afv, lambot avl, millan sm, sevilla v, et al. five-year antimicrobial susceptibility of pseudomonas aeruginosa from a local tertiary hospital in bacolod city, philippines. trop med infect dis. 2017;2(3): 28. doi:10.3390%2ftropi calmed2030028 pmid: 30270886 16. litzow jm, gill cj, mantaring jb, fox mp, macleod wb, mendoza m, et al. high frequency of multidrug-resistant gram-negative rods in 2 neonatal intensive care units in the philippines. infect control hosp epidemiol. 2009 jun;30(6):543–9. doi:10.1086/597512 pmid:19435448 17. quick j, cumley n, wearn cm, niebel m, constantinidou c, thomas cm, et al. seeking the source of pseudomonas aeruginosa infections in a recently opened hospital: an observational study using whole-genome sequencing. bmj open. 2014 nov 4;4(11):e006278. doi:10.1136/bmjopen-2014–006278 pmid:25371418 18. argimón s, masim mal, gayeta jm, lagrada ml, macaranas pkv, cohen v, et al. integrating whole-genome sequencing within the national antimicrobial resistance surveillance program in the philippines. nat commun. 2020 jun 1;11(1):2719. doi:10.1038/ s41467–020–16322–5 pmid:32483195 19. global antimicrobial resistance surveillance system (glass) report: early implementation 2016–2017. geneva: world health organization; 2017. 20. m100s performance standards for antimicrobial susceptibility testing. 26th ed. pennsylvania: clinical and laboratory standards institute; 2016. 21. magiorakos ap, srinivasan a, carey rb, carmeli y, falagas me, giske cg, et al. multidrug-resistant, extensively drug-resistant and pandrug-resistant bacteria: an international expert proposal for interim standard definitions for acquired resistance. clin microbiol infect. 2012 mar;18(3):268–81. doi:10.1111/j.1469– 0691.2011.03570.x pmid:21793988 22. hunt m, mather ae, sánchez-busó l, page aj, parkhill j, keane ja, et al. ariba: rapid antimicrobial resistance genotyping directly from sequencing reads. microb genom. 2017 sep 4;3(10):e000131. doi:10.1099/mgen.0.000131 pmid:29177089 genomic surveillance of amr (16/136/111) and by a research grant u01ca207167 from the national institutes of health (usa). conflicts of interest the authors declare no conflicts of interest. references 1. rossolini gm, mantengoli e. treatment and control of severe infections caused by multiresistant pseudomonas aeruginosa. clin microbiol infect. 2005 jul;11 suppl 4:17–32. doi:10.1111/j.1469– 0691.2005.01161.x pmid:15953020 2. chawla r. epidemiology, etiology, and diagnosis of hospital-acquired pneumonia and ventilator-associated pneumonia in asian countries. am j infect control. 2008 may;36(4) suppl:s93–100. doi:10.1016/j.ajic.2007.05.011 pmid:18468551 3. navoa-ng ja, berba r, arreza galapia y, rosenthal vd, villanueva vd, tolentino mcv, et al. device-associated infections rates in adult, pediatric, and neonatal intensive care units of hospitals in the philippines: international nosocomial infection control consortium (inicc) findings. am j infect control. 2011;39(7):548–54. 4. lópez-causapé c, cabot g, del barrio-tofiño e, oliver a. the versatile mutational resistome of pseudomonas aeruginosa. front microbiol. 2018 04 6;9:685. doi:10.3389/fmicb.2018.00685 pmid:29681898 5. mitchell kf, safdar n, abad cl. evaluating carbapenem restriction practices at a private hospital in manila, philippines as a strategy for antimicrobial stewardship. arch public health. 2019 jul 4;77(1):31. doi:10.1186/s13690–019–0358–9 pmid:31312447 6. antimicrobial resistance surveillance program 2013 annual report. manila: antimicrobial resistance surveillance reference laboratory; 2014. available from: https://arsp.com.ph/publications, accessed 1 march 2020. 7. antimicrobial resistance surveillance program 2014 annual report. manila: antimicrobial resistance surveillance reference laboratory; 2015. available from: https://arsp.com.ph/publications, accessed 1 march 2020. 8. antimicrobial resistance surveillance program 2018 annual report. manila: antimicrobial resistance surveillance reference laboratory; 2019. available from: https://arsp.com.ph/publications, accessed 1 march 2020. 9. viedma e, juan c, acosta j, zamorano l, otero jr, sanz f, et al. nosocomial spread of colistin-only-sensitive sequence type 235 pseudomonas aeruginosa isolates producing the extendedspectrum beta-lactamases ges-1 and ges-5 in spain. antimicrob agents chemother. 2009 nov;53(11):4930–3. doi:10.1128/ aac.00900–09 pmid:19738007 10. wi ym, choi jy, lee jy, kang ci, chung dr, peck kr, et al. emergence of colistin resistance in pseudomonas aeruginosa st235 clone in south korea. int j antimicrob agents. 2017 jun;49(6):767–9. doi:10.1016/j.ijantimicag.2017.01.023 pmid:28392440 wpsar vol 12, no 2, 2021 | doi: 10.5365/wpsar.2020.11.1.006www.wpro.who.int/wpsar 15 p. aeruginosa surveillance in the philippineschilam et al 32. oliver a, mulet x, lópez-causapé c, juan c. the increasing threat of pseudomonas aeruginosa high-risk clones. drug resist updat. 2015 jul-aug;21–22:41–59. doi:10.1016/j.drup.2015.08.002 pmid:26304792 33. dimatatac el, alejandria mm, montalban c, pineda c, ang c, delino r. clinical outcomes and costs of care of antibiotic resistant pseudomonas aeruginosa infections. philipp j microbiol infect dis. 2003;31(4):159–67. 34. lister pd, wolter dj, hanson nd. antibacterial-resistant pseudomonas aeruginosa: clinical impact and complex regulation of chromosomally encoded resistance mechanisms. clin microbiol rev. 2009 oct;22(4):582–610. doi:10.1128/cmr.00040–09 pmid:19822890 35. juan c, torrens g, gonzález-nicolau m, oliver a. diversity and regulation of intrinsic β-lactamases from non-fermenting and other gram-negative opportunistic pathogens. fems microbiol rev. 2017 nov 1;41(6):781–815. doi:10.1093/femsre/fux043 pmid:29029112 36. snyder la, loman nj, faraj la, levi k, weinstock g, boswell tc, et al. epidemiological investigation of pseudomonas aeruginosa isolates from a six-year-long hospital outbreak using high-throughput whole genome sequencing. euro surveill. 2013 oct 17;18(42):20611. doi:10.2807/1560–7917. es2013.18.42.20611 pmid:24176582 37. kung vl, ozer ea, hauser ar. the accessory genome of pseudomonas aeruginosa. microbiol mol biol rev. 2010 dec;74(4):621– 41. doi:10.1128/mmbr.00027–10 pmid:21119020 38. edelstein mv, skleenova en, shevchenko ov, d’souza jw, tapalski dv, azizov is, et al. spread of extensively resistant vim2-positive st235 pseudomonas aeruginosa in belarus, kazakhstan, and russia: a longitudinal epidemiological and clinical study. lancet infect dis. 2013 oct;13(10):867–76. doi:10.1016/s1473– 3099(13)70168–3 pmid:23845533 39. pelegrin ac, saharman yr, griffon a, palmieri m, mirande c, karuniawati a, et al. high-risk international clones of carbapenem-nonsusceptible pseudomonas aeruginosa endemic to indonesian intensive care units: impact of a multifaceted infection control intervention analyzed at the genomic level. mbio. 2019 nov 12;10(6):e02384–19. doi:10.1128/mbio.02384–19 pmid:31719179 23. jolley ka, maiden mc. bigsdb: scalable analysis of bacterial genome variation at the population level. bmc bioinformatics. 2010 dec 10;11(1):595. doi:10.1186/1471–2105–11–595 pmid:21143983 24. cury j, jové t, touchon m, néron b, rocha ep. identification and analysis of integrons and cassette arrays in bacterial genomes. nucleic acids res. 2016 jun 2;44(10):4539–50. doi:10.1093/ nar/gkw319 pmid:27130947 25. croucher nj, page aj, connor tr, delaney aj, keane ja, bentley sd, et al. rapid phylogenetic analysis of large samples of recombinant bacterial whole genome sequences using gubbins. nucleic acids res. 2015 feb 18;43(3):e15. doi:10.1093/nar/gku1196 pmid:25414349 26. page aj, taylor b, delaney aj, soares j, seemann t, keane ja, et al. snp-sites: rapid efficient extraction of snps from multifasta alignments. microb genom. 2016 apr 29;2(4):e000056. doi:10.1099/mgen.0.000056 pmid:28348851 27. stamatakis a. raxml version 8: a tool for phylogenetic analysis and post-analysis of large phylogenies. bioinformatics. 2014 may 1;30(9):1312–3. doi:10.1093/bioinformatics/btu033 pmid:24451623 28. price mn, dehal ps, arkin ap. fasttree 2–approximately maximum-likelihood trees for large alignments. plos one. 2010 mar 10;5(3):e9490. doi:10.1371/journal.pone.0009490 pmid:20224823 29. david s, reuter s, harris sr, glasner c, feltwell t, argimon s, et al.; euscape working group; esgem study group. epidemic of carbapenem-resistant klebsiella pneumoniae in europe is driven by nosocomial spread. nat microbiol. 2019 nov;4(11):1919–29. doi:10.1038/s41564–019–0492–8 pmid:31358985 30. mcarthur ag, waglechner n, nizam f, yan a, azad ma, baylay aj, et al. the comprehensive antibiotic resistance database. antimicrob agents chemother. 2013 jul;57(7):3348–57. doi:10.1128/ aac.00419–13 pmid:23650175 31. freschi l, jeukens j, kukavica-ibrulj i, boyle b, dupont mj, laroche j, et al. clinical utilization of genomics data produced by the international pseudomonas aeruginosa consortium. front microbiol. 2015 sep 29;6:1036. doi:10.3389/fmicb.2015.01036 pmid:26483767 wpsar vol 12, no 2, 2021 | doi: 10.5365/wpsar. 2020.11.1.006 www.wpro.who.int/wpsar16 chilam et alp. aeruginosa surveillance in the philippines lessons learnt from a three-year pilot field epidemiology training programme lessons from the field damian hoy,a,b a mark durand,c thane hancock,d haley l cash,c kate hardie,e beverley paterson,e yvette paulino,f paul white,g tony merritt,h dawn fitzgibbons,i sameer vali gopalani,a james flint,h onofre edwin a merilles jr,a mina kashiwabara,j viema biaukula,k christelle lepers,a yvan souares,a eric nilles,k anaseini batikawai,l sevil huseynova,m mahomed patel,n salanieta t saketa,a david durrheim,e alden hendersono and adam rotha,p,q a pacific community, noumea, new caledonia. b university of sydney, sydney, australia. c pacific islands health officers' association, honolulu, usa. d united states centres for disease control and prevention, guam. e university of newcastle, newcastle, australia. f university of guam, guam. g epidemiology and laboratory capacity program, commonwealth of the northern mariana islands. h hunter new england health, newcastle, australia. i ministry of health, republic of palau. j world health organization, manila, philippines. k world health organization, suva, fiji. l fiji national university, suva, fiji. m world health organization, honiara, solomon islands. n australian national university, canberra, australia. o university of hawaii, honolulu, usa. p department of monitoring and evaluation, public health agency of sweden, solna, sweden. q department of translational medicine, lund university, malmö, sweden. correspondence to damian hoy (email:damehoy@yahoo.com.au). to cite this article: hoy d, durand am, hancock t, cash hl, hardie k, paterson b, et al. lessons learnt from a three-year pilot field epidemiology training programme. western pac surveill response j. 2017 sep;8(3). doi:10.5365/wpsar.2016.7.4.005. abstract problem: the pacific region has widely dispersed populations, limited financial and human resources and a high burden of disease. there is an urgent need to improve the availability, reliability and timeliness of useable health data. context: the purpose of this paper is to share lessons learnt from a three-year pilot field epidemiology training programme that was designed to respond to these pacific health challenges. the pilot programme built on and further developed an existing field epidemiology training programme for pacific health staff. action: the programme was delivered in country by epidemiologists working for pacific public health surveillance network partners. the programme consisted of five courses: four one-week classroom-based courses and one field epidemiology project. sessions were structured so that theoretical understanding was achieved through interaction and reinforced through practical hands-on group activities, case studies and other interactive practical learning methods. outcome: as of september 2016, 258 students had commenced the programme. twenty-six course workshops were delivered and one cohort of students had completed the full five-course programme. the programme proved popular and gained a high level of student engagement. discussion: face-to-face delivery, a low student-to-facilitator ratio, substantial group work and practical exercises were identified as key factors that contributed to the students developing skills and confidence. close engagement of leaders and the need to quickly evaluate and adapt the curriculum were important lessons, and the collaboration between external partners was considered important for promoting a harmonized approach to health needs in the pacific. introduction the pacific island countries and areas in the who western pacific region (the pacific) are american samoa, cook islands, fiji, french polynesia, guam, kiribati, marshall islands, federated states of micronesia, nauru, new caledonia, niue, commonwealth of the northern mariana islands, palau, papua new guinea, pitcairn islands, samoa, solomon islands, tokelau, tonga, tuvalu, vanuatu, and wallis and futuna. the pacific has widely dispersed populations as well as limited financial and human resources. health systems are highly reliant on donor funding and are influenced by the development partners' regional and global health priorities. despite efforts by different programmes, average life expectancy is generally low1 and has not significantly improved over the past two decades.2 the global burden of disease 2015 study estimated that lower respiratory infections, ischaemic heart disease, and diabetes cause the greatest disease burden in the pacific;3 however, due to a scarcity of good-quality useable data, global burden of disease estimates for the pacific are largely derived from models.4 there is an urgent need to improve the availability, reliability and timeliness of useable data to better inform, monitor and evaluate actions for halting this triple burden of disease in the pacific. substantial amounts of data are often collected in the pacific, but very little of these are analysed and made available for policy and planning in a timely manner.4 the data that are available show that the pacific is facing recurrent epidemics of communicable diseases, extremely high rates of noncommunicable diseases (ncds)2,5 and accelerating effects of climate change on health.2 the purpose of this paper is to share lessons learnt from a pilot field epidemiology training programme, officially known as the pacific data for decision making (ddm) programme, or simply, programme, which was designed to foster informed and appropriate responses to these pacific health challenges. context the need for a coordinated and sustainable public health surveillance training programme and the identification of opportunities for field training has been advocated in the pacific over the past two decades.6,7 the pacific public health surveillance network (pphsn) partners, including (in alphabetical order) the centers for disease control and prevention (cdc), fiji national university (fnu), pacific community (spc), pacific island health officers association (pihoa) and world health organization (who), have been building capacity in surveillance and response across the pacific for many years.8,9 several efforts have been previously initiated to address the gap in pacific epidemiological capacity, including sending pacific health staff to field epidemiology training programmes (fetps) overseas; however, it was not until 2004 that a harmonized approach to epidemiology training was established in the pacific itself, as we describe below. since 2012, one pacific country, papua new guinea, has also established its own successful fetp (bieb s, et al., unpublished, 2017). in 2004, the curriculum of the ddm programme10 of the fiji school of medicine and cdc was adapted to the pacific and delivered in several areas and countries by pphsn partners between 2004 and 2011. the goal of the ddm programme was to build capacity in field epidemiology for pacific health staff whose jobs require them to have a basic understanding of the area but whose skill level needed to be enhanced to perform their responsibilities effectively. the curriculum was focused on surveillance and response to outbreak-prone diseases. academic accreditation was achieved in 2010 with the establishment of the post-graduate certificate in field epidemiology by the fiji school of medicine, which is now the college of medicine, nursing and health sciences of fnu. more recently, meetings of the pacific island health ministers in 2011 and 2013 reinforced the need to further build epidemiology capacity of staff in the pacific. regional development partners were called on once again to assist with training programmes "to address the lack of trained and experienced epidemiologists in the region … [and] development of comprehensive training programmes to develop core competencies in 'data techs', 'epi techs' and epidemiologists".11 further, sound epidemiological capacity was deemed necessary for meeting the obligations of the international health regulations (2005) and the who asia pacific strategy for emerging diseases and public health emergencies.12,13 in response, pphsn partners revamped the existing ddm programme to ensure greater student engagement, improve relevance to current pacific island priorities and needs and adopt a health-system-wide approach applicable to both communicable diseases and ncds. the modified pacific ddm programme, as outlined below, was pilot-tested from 2013 to 2016. action overview of pilot programme the goal of the pacific ddm programme remained unchanged. the main target groups were epi-techs and health workers who must be able to: 1) work with and understand data sets to perform their roles; 2) identify health threats and assure the quality of source data; 3) operate well-designed data and surveillance systems; 4) generate, understand, present and explain high-quality information products from these systems; and 5) perform descriptive and basic analytical data analysis. the pacific ddm programme consisted of five sequential courses: four delivered as one-week classroom-based courses and one field epidemiology project (table 1). the courses are described in appendix i. table 1: courses and number of students completing each course, pacific ddm programme, august 2013 to september 2016 click to download table 1. jpg, 273kb supplementary file: appendices click to download appendices. pdf, 279kb programme entry requirements prior to enrolling in the pacific ddm programme, students were required to have either a bachelor's degree or a minimum of five years' experience in the health sector (demonstrated on their curriculum vitae) with a written and positive reference from a supervisor. teaching methods the pacific ddm programme was delivered in country by epidemiologists working for pphsn partners, including (in alphabetical order) cdc, fnu, pihoa, spc, university of guam, university of newcastle (australia), and who. the original ddm programme was modified to increase the use of participatory learning methods based on adult learning principles. sessions were structured so that theoretical concepts were presented in an interactive way and reinforced through practical hands-on group activities, case studies and other interactive practical learning methods. on average, each course had six facilitators and 25 students. curriculum the curriculum accredited previously by fnu was modified substantially. some objectives were reallocated across the continuum of courses to improve programme flow. most of the existing presentations, exercises and resources were re-developed to ensure the newly acquired knowledge and skills could be applied immediately by students within their health systems. the pacific ddm programme covered both communicable diseases and ncds. students assessed the efficiency and effectiveness of their own surveillance systems and developed a plan for strengthening them. students reviewed and analysed data sets collected at their workplace. in addition, the curriculum was aligned with the health metrics network framework (fig. 1).14 students were required to develop an information product in each course (e.g. own data analysis product, standard operating procedures for their surveillance systems, outbreak situation reports). the changes to the existing fnu-accredited programme were accredited through an fnu programme amendment. fig. 1: curriculum framework for pacific ddm programme aligned with the health metrics network framework, 2013–2016 click to download figure 1. jpg, 240kb student assessment students in each of the first four courses were assessed through both formative and summative assessments. formative assessments consisted of a variety of assessment methods that did not contribute to the final grade and were intended to provide feedback to students. summative assessments comprised both continuous (50%) and final endpoint assessment (50%). continuous assessments consisted of presentation of student products during each classroom-based course. the endpoint assessment was most commonly an exam consisting of multiple choice and short answer questions. monitoring and evaluation after every classroom-based course, facilitators met to review the course and make necessary refinements. for example, if it was felt that students were not understanding a particular topic, greater time was allocated to it the following day as well as in subsequent delivery of the course. at each course, an evaluation was undertaken to assess students' self-reported level of understanding and skill preand post-course and to capture students' feedback on the most/least valuable elements and areas for improvement (see appendix ii). a two-day facilitators' retreat was held at the two-year mark of the pilot phase; focus group discussions were held to review and discuss the pilot phase. the student assessments and standardized course evaluations revealed students' perceptions of how well the course learning objectives were being met in the short term. for areas that students found particularly challenging, teaching methods were modified by using more interactive exercises and greater time was allocated to these topics for subsequent course deliveries. long-term effects on both student competency and their performance in applying the new knowledge and skills in their work setting will require further evaluation. further logistical aspects of the pacific ddm programme are discussed in appendix iii. outcome from august 2013 to september 2016, 258 students entered into the programme. twenty-six course workshops were delivered and one cohort of students completed the full five-course programme. as of september 2016, 17 students had completed all courses, 32 had completed three courses, 28 had completed two courses and 181 had completed one course. plans are currently being made to move those students interested through to completion of all courses. the frequency of course delivery was somewhat constrained by the time spent in re-developing the curriculum and funding limitations. please see appendix ii for qualitative findings. discussion the pilot phase was considered to be highly successful. student engagement and stakeholder collaboration were considered the two greatest outcomes. several opportunities for further improvement were also identified. one of the most significant findings from the pilot phase was the importance of closely engaging pacific health leaders. at times, leaders had not fully appreciated that the pacific ddm programme was a series of sequential courses; consequently, some students were sent to subsequent courses regardless of readiness. some participants did not have the study and mathematical skills needed to succeed in the courses, which detracted from the learning experience of other students. in the future, before commencing delivery, standardized consultations will be held with health department and other leaders (outlined in appendix iv). further, the development of self-study "pre-courses" that can be delivered online will be explored. the facilitators determined that students should begin the field epidemiology project immediately after the first course and be followed up at each of the subsequent courses. this would ensure that the students had more time to complete their project and ensure classroom-based courses were relevant to their projects. facilitators also considered that there needed to be greater clarity of the specific products for each of the courses. the proposed products of each course are: introduction to epidemiology and field epidemiology: a clean data set, data dictionary (to be used at the computing for public health practice course) and data communication brief or infographic; public health surveillance: a planning template for either: (a) cd standard operating procedures (including template for weekly cd surveillance report); (b) an ncd monitoring and surveillance plan (including template for annual ncd reports/dashboard); or (c) standard operating procedures (including report templates) for other routine health information products; outbreak investigations: a report on an outbreak investigation (i.e. a situation report); computing for public health practice: a poster from the data set analysis; and field epidemiology project: (a) cd surveillance standard operating procedures (including weekly cd surveillance reports); (b) ncd disease monitoring and surveillance plan (including annual ncd reports/dashboard); or (c) other routine health information product. delivering each ddm course required substantial logistical work (see appendix iii for more information). sustainability will require a dedicated administrative unit to support ddm delivery. one of the greatest challenges of programme implementation was not having a funding stream dedicated specifically to the pacific ddm programme. this hampered the ability to plan strategically for the programme, forecast how many students could be trained and ensure broad coverage across the pacific. additionally, some facilitator staff were on short-term contracts and had to pursue other employment at the end of their term. this problem needs to be addressed through longer-term facilitator contracts to minimize staff turn-over and loss of institutional knowledge. this will also help to ensure a high level of course coordination, including consolidated storage and real-time analysis and action from course evaluations. further, greater contribution of funding and facilitation from countries will help to ensure sustainability. in recent years, pacific health ministers urged regional development partners to contribute further to training programmes in epidemiology. the three-year pilot pacific ddm programme built on an existing programme and was a direct response to that ministerial request. the pacific ddm programme proved popular and achieved high levels of student engagement. the collaboration between external partners was considered important for promoting a harmonized approach to surveillance in the pacific as was the need for high levels of engagement from pacific health leaders. the programme will continue to evolve and adapt to pacific health needs. conflicts of interest the authors declare that they have no competing interests. funding the pacific ddm programme was funded by a number of partners, including (in alphabetical order) cdc, pihoa, the rapid project (a collaboration between university of newcastle, spc and who), spc, and a number of donors, including australia department of foreign affairs and trade, new zealand ministry of foreign affairs and trade, and the european union. disclaimer the findings and conclusions in this report are those of the authors and do not necessarily represent the official position of the cdc, who or any of the other organizations involved. references national minimum development indicators [online database]. noumea: the pacific community; 2012. taylor r, bampton d, lopez ad. contemporary patterns of pacific island mortality. int j epidemiol. 2005 feb;34(1):207–14. pmid:15465904 doi:10.1093/ije/dyh337 gbd compare. seattle: institute for health metrics and evaluation, university of washington; 2017 (https://vizhub.healthdata.org/gbd-compare/). hoy d, roth a, viney k, souares y, lopez ad. findings and implications of the global burden of disease 2010 study for the pacific islands. prev chronic dis. 2014 05 08;11:e75. pmid:24809361 doi:10.5888/pcd11.130344 improving data for policy: strengthening health information and vital registration systems. apia: world health organization and the pacific community; 15 july 2013 (http://www.wpro.who.int/southpacific/pic_meeting/2013/documents/phmm_pic10_5_his.pdf). kiedrzynski t. regional training in public health surveillance: how far are we? an spc perspective. pac health dialog. 2000 sep;7(2):88–91. pmid:11588935 patel m. service-oriented training in public health: a model for enhancing public health surveillance in the pacific. pac health dialog. 2000 sep;7(2):74–5. pmid:11588930 souarès y. harmonisation of regional health data: requirements in the pacific. public health surveillance in the pacific. noumea: secretariat of the pacific community; 1998. souarès y. pacific public health surveillance network. telehealth and outbreak prevention and control: the foundations and advances of the pacific public health surveillance network. pac health dialog. 2000 sep;7(2):11–28. pmid:11588911 wilkins k, nsubuga p, mendlein j, mercer d, pappaioanou m. the data for decision making project: assessment of surveillance systems in developing countries to improve access to public health information. public health. 2008 sep;122(9):914–22. pmid:18490035 doi:10.1016/j.puhe.2007.11.002 world health organization, the pacific community. honiara outcome: ninth meeting of ministers of health for the pacific island countries. manila: who regional office for the western pacific; 2011. international health regulations, third edition. geneva: world health organization; 2005 (http://www.who.int/ihr/publications/9789241580496/en/). asia pacific strategy for emerging diseases (apsed, 2010). geneva: world health organization; 2010 (http://www.wpro.who.int/emerging_diseases/apsed2010/en/). health metrics network, world health organization. framework and standards for country health information systems, 2nd ed. geneva: world health organization; 2008. comparing age and sex trends of chlamydia, gonorrhoea, hepatitis and syphilis infections in samoa in 2012 and 2017 surveillance report robert carney,a michaela howells,b aaone tanumafili,a athena matalavea,a judith gafa,a leausa toleafoa dr take naseria a samoa ministry of health, apia, samoa. b department of anthropology, university of north carolina, wilmington, north carolina, united states of america. correspondence to robert carney (email: robertc@health.gov.ws). to cite this article: carney r, howells m, tanumafili a, matalavea a, gafa j, leausa toleafoa tn, et al. comparing age and sex trends of chlamydia, gonorrhoea, hepatitis and syphilis infections in samoa in 2012 and 2017. western pac surveill response j. 2020 mar;11(1). doi:10.5365/wpsar.2019.10.2.004 in samoa, the seroprevalence rates of sexually transmitted infections other than hiv have been endemically high over the past decade, despite years of prevention programming. odds ratio and χ2 tests were conducted to compare the rates of positivity of chlamydia, gonorrhoea, hepatitis b and c, and syphilis across age groups from 2012 and 2017 surveillance data in samoa. young people aged 15–19 years were significantly more likely to have a chlamydia infection compared to all other age groups in both 2012 and 2017. hepatitis b infections were more common in males and those aged 30 and above in both 2012 and 2017. hepatitis c had no significant differences in age, but it was more common in males in 2012 and more common in females in 2017. older age groups (aged 45 and above) were more likely to have a positive syphilis test in both 2014 and 2017 when compared to those aged 15–24 years. the results of this analysis confirm previously observed trends in samoa for younger age groups’ prevalence of chlamydia and gonorrhoea, and for older age groups’ prevalence of hepatitis b and c. but the analysis also unexpectedly found that older age groups (aged 45 and above) are more likely to test positive for syphilis (for years 2014 and 2017). further studies are needed to assess behavioural risk factors associated with older populations in order to explain the increase in risk and to design interventions suited to this demographic. sexually transmitted infections (stis) are an ongoing health challenge in samoa and across the pacific. samoa consists of four inhabited islands with a relatively small population of approximately 196 000 people.1 the country’s close-knit community dynamic poses unique social barriers to voluntary testing and treatment, and population coverage remains low.2 samoa has historically reported high rates of chlamydia and gonorrhoea and low rates of hiv and syphilis from cross-sectional antenatal prevalence studies. the first seroprevalence survey in the country, conducted in 2000, found that chlamydia and trichomoniasis infections were common among pregnant women (30.9% and 20.8%, respectively), with a low prevalence of gonorrhoea and syphilis (3.3% and 0.5%, respectively).2 one analysis found that young women aged 3 chlamydia is endemic among women, with those < 25 years having greater positivity than those ≥ 25 years (26.1% compared to 11.9%).3women who are unmarried or are 18–24 years of age were more likely to test positive for chlamydia.4 chlamydia infections are also associated with subfertility in samoan women.5 maternal and congenital syphilis in samoa has increased since 2018.6 untreated maternal syphilis has been associated with fetal loss, neonatal death, premature birth and lower birthweight.7 these results indicate significant health challenges for women of childbearing age. the 2017 national positivity rates for chlamydia, gonorrhoea and syphilis (24.2%, 5.6% and 1.04%, respectively) are similar to previous prevalence rates.8 this suggests a persistently high prevalence of stis, particularly chlamydia, for the past decade. conversely, samoa has previously reported the lowest rate of syphilis worldwide (0%).8 however, syphilis has increased globally among heterosexuals and men who have sex with men.8 in samoa, syphilis cases have steadily increased from 26 reported cases in 2015 to 78 cases in 2017.6 although prevalence estimates were well established in previous studies, more recent data on sex and age are needed to inform intervention design. using national surveillance data, this analysis seeks to update the status of the epidemic by comparing positivity rates among sex and age groups from years 2012 and 2017. methods for a cross-sectional study, the data of all patients in the country who had an sti investigation (routine or suspect) from any provider were analysed for years 2012 (n = 18 804) and 2017 (n = 48 898) to compare trends in the positive diagnosis of chlamydia, gonorrhoea, hepatitis b and c, and syphilis by age and sex. due to the low sample size in 2012, syphilis data were compared for 2014 (n = 3865) and 2017 (n = 11 418). patients with lost or insufficient specimens were excluded from the sample. the hiv and sti surveillance database, which was used to construct the study sample, is managed by the samoa ministry of health in the capital of apia. the most complete full-year data sets (2012, 2014 and 2017) were used. data are comprised of all diagnostic testing (both routine testing and suspect cases in the general population) that was recorded by the national reference laboratory (nrl) of tupua tamasese meaole (ttm) hospital, apia. in 2017, all national diagnostic technologies were centrally housed in the nrl. all specimens collected in the country are processed by the nrl and recorded in the database. the assays used in the national testing algorithm include polymerase chain reaction (pcr) for chlamydia and gonorrhoea, rapid plasma reagin (rpr) and treponema pallidum haemagglutination (tpha) tests for syphilis, hepatitis b surface antigen (hbsag) tests for hepatitis b, the hepatitis c antibody (anti-hcv) test for hepatitis c. clinicians collect and send specimens to nrl or refer the patient directly to the nrl for collection. once specimens are processed, the requesting clinician and relevant authorities are notified, and the reporting is collated into the database. we used epi info software (version 7.2.2.6) to estimate odds ratios and chi-square test (χ2) to analyse trends (extended mantel-haenzsel). odds ratios are suitable estimations of the prevalence of a disease when infections are less than 10%.9,10 samoa’s syphilis positivity rates ranged from 0.13% in 2012 to 1.04% as of july 2018.11 cases were compared based on sex (comparing males to females), age (comparing all other age groups to those aged 15–19 years) and the type of sti. since there were only 10 cases in 2012, data for syphilis were taken from 2014 when there were sufficient cases (n = 18) by age to run the analysis without violating the assumption of the extended mantel-haenzsel tests (80% of cells have more than five cases). additionally, syphilis age groups were adjusted from five-year to 10-year age groups ( 45) for sample size, while other sti age groups are compared to those 30+ years. sample the majority of tests come from routine testing (76.0% in 2012 and 78.7% in 2017, annex). this includes testing of women attending antenatal care services, immigration screening for samoan nationals and blood donation screening. females represent more total tests than males (71.5% compared to 28.5% in 2012, and 56.7% versus 43.3% in 2017, respectively). there were 7861 tests in 2012 and 11 152 in 2017 in individuals < 30. testing increased for individuals age > 30 years (6428 tests in 2012 and 15 145 in 2017). overall, sti positivity has decreased in the youth age group (15–24 years), from 11.9% in 2012 to 3% in 2017, and in antenatal care testing from 9.5% in 2012 to 1.1% in 2017. chlamydia was the most common infection (27.9% in 2012 and 22.9% in 2017), with fewer tests in 2017 compared to 2012 (2207 to 4951, respectively). gonorrhoea is the second most common infection (6.3% in 2012 and 10.0% in 2017), with more tests in recent years (2201 in 2017 compared to 208 in 2012). hepatitis cases are low, with 2.6% positive rate in 2012 and 2.4% in 2017 for hepatitis b, and 1.1% in 2012 and 0.1% positive for hepatitis c. testing for hepatitis b and c was higher in 2017 (9780 tests in 2012 and 22 312 in 2017). in 2014, there were 18 cases of syphilis from 3865 tests, and in 2017 there were 90 cases from 11 418 tests. results positivity for stis varied based on age and sex (table 1). chlamydia and gonorrhoea positivity rates were higher in the age group 15–19 years. in 2012, relative to those aged 15–19 years, those aged 20–24, 25–29 and > 30 years had significantly lower odds of testing positive for chlamydia (unadjusted odds ratio of 0.80, 0.58 and 0.32, respectively). in 2017, relative to those aged 15–19 years, those aged 25–29 years and > 30 years had significantly lower odds of testing positive (unadjusted odds ratio of 0.55 and 0.27, respectively). no significant results were observed for sex in 2012 and 2017. click to download table 1. jpg, 399kb for gonorrhoea, compared with females, males had greater odds of testing positive in both 2012 and 2017 (unadjusted odds ratio of 15.7 and 7.1, respectively). in 2012, positive tests did not differ significantly by age. in 2017, relative to those aged 15–19 years, those aged 20–24 years and those aged > 30 years had significantly lower odds of testing positive for gonorrhoea (unadjusted odds ratio of 0.27 and 0.55, respectively). for hepatitis b, compared with females, males had greater odds of testing positive in both 2012 and 2017 (unadjusted odds ratio of 2.4 and 2.5, respectively). in both 2012 and 2017, relative to those aged 15–19 years, those aged 25–29 and > 30 years had significantly greater odds of testing positive (2012: unadjusted odds ratio of 3.9 and 5.5, respectively; 2017: unadjusted odds ratio of 4.3 and 11.8, respectively). for hepatitis c, compared with females, males had significantly greater odds of testing positive in 2012, but not in 2017 (unadjusted odds ratio in 2012 of 9.3 and in 2017 of 0.67). in 2012, with respect to age, there was no difference in test positivity. for syphilis, compared with females, males had lower odds of testing positive in both 2014 and 2017 (unadjusted odds ratio of 0.28 and 0.63, respectively) (table 2). in 2014, relative to those aged under 45 years, those > 45 years were 50-fold more likely to test positive. in 2017, compared with those under 45 years, those aged > 45 years were 14-fold more likely to test positive. for 2017, there were sufficient data to compare smaller age groups. compared to those aged 15–24 years, all older age groups had greater odds of a positive syphilis test (unadjusted odds ratio of 3.1 for those aged 35–44 years and 25.6 for those aged > 45 years). click to download table 2. jpg, 248kb discussion this analysis finds similar positivity rates to seroprevalence estimations, and it provides gender and age trends in positivity. as expected, young people generally had greater odds of testing positive for chlamydia (high prevalence in both 2012 and 2017) and gonorrhoea, while older age groups were significantly more likely to be positive for hepatitis b and c. this is a common trend as older age groups have longer windows of exposure to viral infections and have had more routine screening over their lifetime, while bacterial infections are more episodic and frequent with young people. older individuals may also have lower vaccine coverage than younger ones for hepatitis b virus and hepatitis c virus. however, older age groups had greater odds of testing positive for syphilis. the high positivity rates for chlamydia in 2012 and 2017, in particular, are of great concern. this is due to: 1) the lack of population interventions to reduce chlamydia prevalence; 2) diminishing prioritization of stis; and 3) the social stigma surrounding sex and stis that deters individuals from seeking health services and makes delivering comprehensive sexual health education to young people difficult. in a small and close-knit population, seeking services anonymously for taboo conditions is almost impossible and can result in social consequences.12 it is also unusual for syphilis to be more common in older age groups. we suggest this anomaly may be due to untreated syphilis cases being detected in late tertiary-stage years after an initial infection, when advanced symptoms resurface. reports indicate a significant increase in infections between 2015 and 2016.11 the odds ratio of syphilis infections was higher in those age > 45 years both in 2014 and 2017. in addition to older generations being diagnosed in late stages, these results could illuminate a health system-level gap in case detection for syphilis. from a cultural perspective, older individuals in samoa are also afforded more social authority, allowing them more agency to freely pursue sexual activity and attend health services. sexual activity in younger individuals, especially those not married, is considered a more serious taboo and is socially discouraged.12 additionally, older generations had comparatively less access to sexual health education and prevention. all of these factors would increase the odds of infection in older populations. in samoa, government-level sti prevention has focused on young people aged 15–24 years as a high-risk group with the largest burden of infection.11 this study confirms such trends for chlamydia and gonorrhoea. however, syphilis interventions may require age-specific strategies for older populations. these results highlight the need to design age-specific interventions for case detection and prevention in older populations. limitations the hiv and sti surveillance database at the ministry of health captures results of all diagnostic tests nationally, with the exception of rapid screening kits. therefore, the data represent all patients (public, private, routine and suspect) in the country accessing clinical services who received a diagnostic test, excluding screened cases not referred for diagnostics and symptomatic cases treated presumptively. there is selection bias from suspect cases referred to testing by clinicians. additional studies are needed to estimate the true population prevalence of populations that do not attend services. information on the stage of infection, exposure and result per assay is not captured. each case in the database represents an episode of sti infection, with the possibility of a single patient having multiple episodes. however, anecdotal observations from the ministry of health indicate that patients often delay seeking testing and care until infections enter an advanced stage. for instance, only 52% of children under age 5 years with a fever were brought to a health facility for care or advice.13 this late attendance suggests it may be unlikely for patients to report to services more than once a year for stis. to obtain a sufficient sample size for syphilis, data were taken from 2014, and age groups were recategorized into 10-year age groups before running the calculations by age and sex, which resulted in larger confidence intervals as the age group categories were less distinct from each other. additionally, the positivity for tpha/rpr may indicate chronic yaws infections in older adults, as opposed to syphilis; however, yaws was declared eliminated in the 1960s.14 conclusion the unexpectedly higher odds of syphilis positivity among adults aged > 45 years compared to 15–24 years, as well as the persistently high rates of chlamydia infections between 2012 and 2017, highlight a need to re-strategize the promotion and delivery of sti testing and care services in samoa. prevention services and strategies should be age-specific, with further assessment of the different barriers for older and younger patients. acknowledgements we would like to thank all national laboratory staff at the national reference laboratory, tupua tamasese meaole (ttm) hospital in upolu, and laboratory services, mt2, savai’i for their testing and data collection over the years that made this analysis possible, especially lupe isaia, laboratory scientist of laboratory services of the ttm hospital in apia, samoa. in addition, we would like to express our appreciation to all rural district health centres and hospitals in upolu and savai’i, whose efforts provided valuable assistance in case reporting. we also would like to thank barbara telfer, visiting epidemiologist, for her feedback in the preparation of this manuscript. finally, we would like to thank serafi moa, senior nurse specialist, and dr sarah brown, specialist physician, of the communicable disease clinic (ttm hospital, apia) for the clinical work and dedication to reaching people with services they have provided over the years. references 2016 census brief no. 1: population snapshot and household highlights. apia: samoa bureau of statistics; 2017. sullivan ea, koro s, tabrizi s, kaldor j, poumerol g, chen s, et al. prevalence of sexually transmitted diseases and human immunodeficiency virus among women attending prenatal services in apia, samoa. int j std aids. 2004 feb;15(2):116–9. doi:10.1258/095646204322764316 cliffe sj, tabrizi s, sullivan ea; pacific islands second generation hiv surveillance group. chlamydia in the pacific region, the silent epidemic. sex transm dis. 2008 sep;35(9):801–6. doi:10.1097/olq.0b013e318175d885 walsh ms, hope e, isaia l, righarts a, niupulusu t, temese sv, et al. prevalence of chlamydia trachomatis infection in samoan women aged 18 to 29 and assessment of possible risk factors: a community-based study. trans r soc trop med hyg. 2015 apr;109(4):245–51. doi:10.1093/trstmh/trv014 menon s, stansfield sh, walsh m, hope e, isaia l, righarts aa, et al. sero-epidemiological assessment of chlamydia trachomatis infection and sub-fertility in samoan women. bmc infect dis. 2016 apr 21;16(1):175. doi:10.1186/s12879-016-1508-0 hiv/sti/tb national programme, samoa. 2018 hiv & sti surveillance report january to december (internal report). apia: ministry of health, samoa; 2018. gomez gb, kamb ml, newman lm, mark j, broutet n, hawkes sj. untreated maternal syphilis and adverse outcomes of pregnancy: a systematic review and meta-analysis. bull world health organ. 2013 mar 1;91(3):217–26. doi:10.2471/blt.12.107623 garcia garcia l, gonzalez-escalada a, ariza megia mc, gil-de-miguel a. syphilis: an epidemiological review. curr women’s health rev. 2012;8(3):231–41. doi:10.2174/157340412803760694 viera aj. odds ratios and risk ratios: what’s the difference and why does it matter? south med j. 2008 jul;101(7):730–4. doi:10.1097/smj.0b013e31817a7ee4 schmidt co, kohlmann t. when to use the odds ratio or the relative risk? int j public health. 2008;53(3):165–7. doi:10.1007/s00038-008-7068-3 ministry of health. samoa global aids monitoring report 2018. apia, samoa. unaids. 1 july, 2018. available from: https://www.unaids.org/sites/default/files/country/documents/wsm_2018_countryreport.pdf howells me, lynn cd, weaver lj, langford-sesepesara m, tufa j. zika virus in american samoa: challenges to prevention in the context of health disparities and non-communicable disease. ann hum biol. 2018 may;45(3):229–38. doi:10.1080/03014460.2018.1465594 samoa bureau of statistics. demographic health survey 2014. government of samoa; 2015. capuano c, ozaki m. yaws in the western pacific region: a review of the literature. j trop med. 2011;2011:642832. doi:10.1155/2011/642832 sexually transmitted infections among transgender people and men who have sex with men in port vila, vanuatu brief report vanessa veronese,a caroline van gemert,a siula bulu,b tamara kwarteng,c isabel bergeri,a steven badman,d alyce vellaa and mark stoovéae a center for population health, burnet institute, melbourne, australia. b wan smolbag theatre, port vila, vanuatu. c center for international health, burnet institute, melbourne, australia. d kirby institute, university of south wales, sydney, australia. e department of epidemiology and preventive medicine, monash university, melbourne, australia. correspondence to mark stoové (e-mail: stoove@burnet.edu.au). to cite this article: veronese v et al. sexually transmitted infections among transgender people and men who have sex with men in port vila, vanuatu. western pacific surveillance and response journal, 2015, 6(1):55–59. doi:10.5365/wpsar.2014.5.1.001 abstract despite high sexually transmitted infection (sti) prevalence in the pacific, there are limited data on stis and risk among men who have sex with men (msm) and transgender people (tg). in 2011, an integrated bio-behavioural survey recruited self-identified msm and tg in port vila, vanuatu. descriptive findings were stratified by sexuality. among 28 (55%) msm and 23 (45%) tg, recent anal sex with male partners was more common among msm (94% vs 71%; p p p p introduction despite a high prevalence of sexually transmitted infections (stis) in pacific island countries and territories,1–4 there are limited data on stis and risk behaviour among men who have sex with men (msm) and transgender people (tg). while culturally defined tg roles for men exist throughout pacific island countries and territories,5 male-to-male sexual contact occurs among men who do not identify as tg or homosexual. in vanuatu, up to 10% of young males reported sex with a male partner.6 stigma and discrimination towards sexual minorities deters disclosure of sexuality and male-to-male sexual behaviour. this can result in low levels of sti testing and diagnosis, underreporting of risk behaviours and limited engagement with prevention and treatment services.5,7–9 the limited data for msm and tg populations in pacific island countries and territories hamper risk reduction among these groups and their sexual partners. in 2011, an integrated bio-behavioural survey of self-identified msm and tg was conducted by the burnet institute in partnership with wan smolbag and the vanuatu ministry of public health in port vila, vanuatu. methods recruitment and data collection respondent-driven sampling (rds) was used to recruit participants between november 2011 and april 2012. biological men, identifying as male or transgender women, and aged over 18 years who reported anal sex with another male in previous year were eligible. seven seeds (initial recruits) were recruited through a local nongovernmental organization and chosen for their close linkages with the study population and for diversity (e.g. gender, age, marital status). seeds were given three coupons to recruit the first wave of participants who were also provided three coupons to recruit the next wave, and so on; willing participants then presented for data collection. three field researchers assessed eligibility and obtained informed verbal consent. interviews were conducted in the local language; the questionnaire included items about socio-demographics, sexual risk behaviours, previous diagnoses of any sti, prior sti symptoms and treatment-seeking behaviour. participants were then referred for pre-test counselling and sti testing. nurses collected 20 millilitres of venous blood for hiv and syphilis testing and rectal swabs for chlamydia and gonorrhoea testing. chlamydia and gonorrhoea tests were performed using bd probetec (becton, dickinson and company, new jersey, usa) nucleic acid amplification testing; tests for active syphilis used rpr screening confirmed through determinetm syphilis tp (inverness medical, bedford, uk). for hiv, a rapid screening test (determinetm) was used with confirmation of reactive samples by two additional rapid tests (insti, biolytical, british columbia, canada and unigold, trinity biotech, carlsbad, usa). analysis most variables were dichotomous or categorical; these were analysed using fisher’s exact test. for numerical variables, the median and interquartile ranges were calculated. due to the small sample size and limited recruitment, the data could not be analysed using methods for rds. analyses were conducted using epiinfo and statase v11. to determine recent sti exposure, participants were asked if they had experienced any of four sti symptoms in the previous 12 months: (1) genital discharge from the vagina; (2) genital ulcer or sore on the vagina; (3) burning or sharp pain on urination; and (4) rash or genital itching. participants were then classified as self-reporting symptoms or not during this time period. consistent condom use was defined as always using a condom with partner during the previous six months. the ministry of health, government of the republic of vanuatu ethics committee and the alfred hospital ethics committee approved this study. no identifying information was collected from participants. results six seeds recruited 45 participants (total n = 51); 23 (45%) identified as tg and 28 (55%) as msm. an additional 20 msm refused to participate, citing fear of disclosure of sexuality or an unwillingness to test for hiv and stis. the most common age group was 20–29 years; 21% of msm and 17% of tg were aged 19 years or under. tg participants reported younger age at sexual debut compared to msm (16 or younger (p p table 1). table 1. socio-demographic and self-reported sexual risk and sti exposure and treatment history by reported gender (n = 51) click to download table 1. jpg, 659kb msm, men who have sex with men; sti, sexually transmitted intection; tg, transgender. * denominator tg = 18; msm = 21 † denominator tg = 17; msm = 20 the majority of participants reported sexual contact with a male partner during the past six months. consistent condom use during anal sex was low across all regular, casual, paying and paid sexual partners (table 1). we also found evidence of multiple and potentially overlapping sexual partnerships; among the eight msm reporting regular partners in the past six months, three also reported paid partners, three reported casual partners, one reported a paying partner and four reported female partners. significantly more msm reported sex with a female partner compared to tg (p table 1). approximately one in five msm and no tg had a history of sti diagnosis (p = 0.03), and one third of msm and one in five tg reported genital symptoms in the past year. msm reported higher levels of genital symptoms across all four types investigated and were also significantly more likely to seek treatment for these symptoms (p = 0.02) (table 1). for the 43 participants that provided a sample, 24% of tg and 35% of msm tested positive for any sti; chlamydia was detected in 19% of samples and gonorrhoea in 9%. of the 39 participants tested for syphilis, 3% were positive (table 1). there were no detected cases of hiv. discussion while acknowledging the limitations in our sample size, these findings nonetheless advance our understanding of the sexual health vulnerabilities for msm and tg in vanuatu, a region characterized by distinctive and culturally defined sexualities. the detection of stis in one in five tg and one in three msm represents comparably high prevalence for pacific island countries and territories.1,3 no tg and only five msm reported an sti diagnosis history. that 17% of tg and 36% of msm reported sti symptoms in the past 12 months suggests low treatment-seeking behaviour, particularly among symptomatic tg and may reflect barriers to accessing treatment. in settings where same-sex behaviour is not culturally permissible, tg may be unwilling to access mainstream sexual health services where they might be asked to disclose sexual behaviours.10 however, services specifically targeting gay men may not appeal to bisexual msm who maintain relationships with women and thus present a barrier to care and preventative treatment among this group. our findings underscore the needs for culturally appropriate health promotion and sexual health services that reflect the specific needs of msm and tg populations. we found consistently low levels of condom use with regular and casual partners. lifetime and recent sex with females by msm was also higher than reported elsewhere.1,9 against a background of high sti prevalence, low levels of condom use with female partners, high levels of bisexual risk behaviours and multiple and potentially overlapping male and female sexual partnerships create a potential bridge between high-risk groups and the general population. it is crucial that approaches to preventing and treating stis in vanuatu incorporate discrete strategies for partner notification and treatment for female partners. this study was subject to limitations which must be considered when reviewing the findings. our small sample size limited the detection of particular outcomes and statistical power that may have been observed in a larger sample. the rds strategy employed also did not result in sufficient recruitment. our question about participant’s age at sexual debut implied but did not specify homosexual sex; thus, our findings may not accurately represent the age of homosexual debut among participants. despite this, our results show important risk behaviours and profiles of tg and msm in vanuatu not previously documented. overall, high and somewhat specific levels of risk and vulnerability among tg and msm in vanuatu were determined. our findings underscore the need for comprehensive and targeted sti treatment and prevention services for msm and tailored health promotion strategies that recognizes different sexual identities and adequately engages non-gay identifying msm and their female partners in vanuatu. conflicts of interests none declared. funding funding was provided by the pacific island hiv and sti response fund grant, a collaborative funding mechanism by the australia and new zealand governments and managed by the secretariat of the pacific community. acknowledgements we wish to thank the vanuatu ministry of health for its ongoing support and for laboratory testing; national serology reference laboratory (nrl, melbourne, australia) for laboratory testing; wan smolbag for coordinating data collection and entry and management of the field researchers; who western pacific regional office and the pacific unaids coordinator for their technical support in project implementation. caroline van gemert received a travel grant from the ian potter foundation for training in rds. laboratory testing of specimens at the port vila central hospital was provided by the global fund round 7 grant through the vanuatu ministry of health. finally, we thank all participants of the study for their valuable input. we would also like to thank william craw for his valuable advice. references: rawstorne p et al. shattered stereotypes: twists & turns in sexual practices. an integrated bio-behavioural survey of transgender and men who have sex with men in suva and lautoka, fiji. suva, men fiji, 2012. rawstorne p, te tiare association of the cook islands, secretariat of the pacific community. second generation surveillance survey of akavaine and msm in cook islands 2009. cook islands, secretariat of the pacific community, 2009. second generation surveillance survey of msm in tonga 2008. tonga, ministry of health, 2008. second generation surveillance: behavioural survey among msm. guam, guam department of public health and social services, 2007. buchanan-aruwafu h. an integrated picture: hiv risk and vulnerability in the pacific – research gaps, priorities and approaches. new caledonia, secretariat of the pacific community, 2007. i no bin gat protection. understanding hiv and aids risk and vulnerability among vanuatu youth. suva, united nations internation children’s fund pacific sub-regional office, 2010. hiv surveillance in pacific island countries and territories: 2012 report. new caledonia, surveillance and operational health research team, secretariat of the pacific community, 2013. godwin j. legal environments, human rights and hiv responses among men who have sex with men and transgender people in asia and the pacific: an agenda for action. bangkok, united nations development programme, 2010. bavington b et al. secret lives, other voices... a community-based study exploring male-to-male sex, gender identity and hiv transmission risk in fiji. suva, aids task force of fiji, 2011. sullivan ps et al. successes and challenges of hiv prevention in men who have sex with men. lancet, 2012, 380:388–389. doi:10.1016/s0140-6736(12)60955-6 pmid:22819659 epidemiology of tuberculosis in papua new guinea: analysis of case notification and treatment-outcome data, 2008–2016 surveillance report paul aia,a lungten wangchuk,b fukushi morishita,c jacob kisomb,a robin yasi,a margaret kal,a tauhid islamb a national department of health, papua new guinea. b world health organization representative office for papua new guinea. c world health organization regional office for the western pacific. correspondence to lungten wangcuk (email:wangchukl@who.int). to cite this article: aia p, wangchuk l, morishita f, kisomb j, yasi r, kal m, et al. epidemiology of tuberculosis in papua new guinea: analysis of case notification and treatment-outcome data, 2008-2016. western pac surveill response j. 2018 june;9(2). doi:10.5365/wpsar.2018.9.1.006 abstract papua new guinea has strengthened its surveillance system for tuberculosis (tb) under the national tb program. this paper provides an overview of tb surveillance data at the national and subnational levels from 2008 to 2016. tb case notification has consistently increased since 2008 with 6184 cases (93 per 100 000 population) in 2008 to 28 598 (359 per 100 000 population) in 2014 and has stabilized since 2014 with 28 244 cases (333 per 100 000 population) in 2016. the population-screening rate for tb rose from 0.1% in 2008 to 0.4% in 2016. notified cases were dominated by extra-pulmonary tb (ep-tb, 42.4% of all cases in 2016). the proportion of pulmonary tb cases with no sputum test results was high with a national average of 26.6%. the regional variation of case notifications was significant: the southern region had the highest number and rate of notified tb cases. of the nationally reported cases, 26.7% occurred in children. treatment success rates remained low at 73% for bacteriologically confirmed tb and 64% for all forms of tb in 2016, far below the global target of 90%. for all forms of tb, 19% of patients were lost to follow-up from treatment. an analysis of tb data from the national surveillance system has highlighted critical areas for improvement. a low population-screening rate, a high proportion of pulmonary tb cases without sputum test results and a low treatment success rate suggest areas for improvement in the national tb program. our additional subnational analysis helps identify geographical and programmatic areas that need strengthening and should be further promoted to guide the programme's direction in papua new guinea. introduction papua new guinea has high burdens of tuberculosis (tb), multidrug-resistant tb (mdr-tb) and tb/hiv co-infection.1 the estimated tb incidence in papua new guinea in 2016 was 432 cases per 100 000 population.1 papua new guinea initiated directly observed treatment, short-course (dots), a global tb control strategy, in 2008. while other countries have adopted newer global strategies, papua new guinea is facing challenges in adapting and implementing basic dots. with external support, dots was expanded nationwide, and the standardized-routine-surveillance system was strengthened, resulting in the capturing of tb reports nationwide since 2012. this paper provides an overview of national and subnational tb surveillance data in papua new guinea, from the inception of the dots strategy in 2008 to 2016. the results are expected to facilitate better understanding of tb epidemiology in papua new guinea, help identify programmatic gaps and inform actions. methods we conducted a retrospective descriptive analysis of tb cases and treatment outcomes using routine surveillance data from the national tb database for the period 2008–2016. tb laboratory results, case notifications, hiv testing results and treatment outcomes were analysed by disease category, geographic areas and demographic variables. papua new guinea has a decentralized health-care system; tb services are delivered by provincial and local governments under policies set by the national department of health.2 the national tb program defined a basic management unit (bmu) as the initial point of tb data collection. there are approximately 275 bmus and 114 laboratories with tb testing capacities with varying catchment populations across 22 provinces. recording and reporting formats are in line with who recommendations.3 the bmu reports are consolidated into a standardized report that is submitted quarterly to the provincial health office and to the national tb program at the national department of health. the aggregated national database is maintained in excel. we obtained case-notification and treatment-outcome data from the aggregated national database. population data were projected using 2000 and 2011 census data;4,5 ageand sex-disaggregated population data for 2015 were sourced from livepopulation.com.6 to assess case-finding efforts, we calculated a population-screening rate,7 which we defined as the number of people with presumptive tb examined by smear microscopy divided by the total population in each year. the smear-positivity rate was defined as the number of smear-positive patients divided by the total number of people examined for tb. treatment outcomes were classified as per who definitions as cured, treatment completed, treatment failed, died, lost to follow-up and not evaluated. treatment success was defined as the sum of cured and treatment completed.3 r version 3.4.1 was used for data analysis and visualization. qgis version 2.18 was used to produce maps. ethics statements as this report used routinely available data and no personal identifying information was collected, ethical clearance was not required according to local regulations. results in 2016, 0.4% of the national population was screened for tb, and 15% of those screened were smear positive; the percentages varied across regions and provinces (fig. 1). low levels of both indicators were observed in the highlands region (0.22% screened, 7.6% positive), low screening with high positivity was observed in the islands region (0.34% screened, 17.9% positive), and moderate screening with high positivity was observed in the momase region (0.44% screened, 17.9% positive) and the southern region (0.78% screened, 15.8% positive). while national population screening increased over time, from 0.1% in 2008 to 0.4% in 2016, smear positivity did not decrease proportionately (17% in 2008 and 15% in 2016) (fig. 2). fig. 1. population-screening rate vs smear-positivity rate by province, papua new guinea, 2016 click to download figure 1. jpg, 437kb fig. 2. population-screening rate vs smear-positivity rate, papua new guinea, 2008–2016 click to download figure 2. jpg, 194kb in 2016, the case notification rate for all forms of tb was 333 per 100 000 population (n = 28 244). the number and rate of case notifications of all forms of tb increased during 2008–2014 but stabilized during 2015–2016 (fig. 3). the total tb caseload was driven mainly by extra pulmonary tb (ep-tb) (n = 11 984, 42% in 2016) and pulmonary tb cases without sputum test results (either the test was not done or the result was not available) (n = 7527, 27% in 2016). among all tb cases and pulmonary tb cases, 15.6% and 25.9% were bacteriologically confirmed, respectively. fig. 3. tb case notification (absolute number and rate) by diagnostic category, papua new guinea, 2016 click to download figure 3. jpg, 324kb case notification of new smear-positive tb was highest in the 15–24-year-old age group (fig. 4). case notification rates show two peaks in the 25–34-year old age group (for both males and females) and in the 55–64-age group (for males only). case notification rates were equally high in younger males and females (15–34 years old), whereas higher rates were observed in men in older age groups. fig. 4. tb case notification (new smear-positive) by age and sex, papua new guinea, 2016 click to download figure 4. jpg, 252kb we observed variations in case notification among the four regions (fig. 5 and 6a). the southern region had the highest rate (615 per 100 000 population) in 2016, with an increasing annual trend since 2008 and a peak in 2014 (802 per 100 000 population). the rate in the regions of momase and islands increased during the study period to over 300 per 100 000 population in 2016, while the rate in the highlands plateaued at around 200 per 100 000 population in 2013. ep-tb was the main contributor to the overall case notifications in the momase, highlands and southern regions during 2016 (37%, 60% and 46%, respectively), followed by pulmonary tb cases without sputum test results (29%, 21% and 20%, respectively). the proportion of pulmonary tb cases without sputum test results declined in the highlands region (from 39% in 2011 to 21% in 2016) and the southern region (from 35% in 2012 to 20% in 2016). in the islands region, pulmonary tb cases without sputum test results were most commonly reported, and they sharply increased from 28% in 2014 to 47% in 2016. in all regions, the proportion of new smear-positive tb cases remains low at below 20%. fig. 5. tb case notification (absolute number, rate and percentage) by region, papua new guinea, 2008–2016 click to download figure 5. jpg, 532kb fig. 6a. number of tb case notifications by province, papua new guinea, 2016 click to download figure 6a. jpg, 255kb at the provincial level, high case notification rates of more than 600 per 100 000 population were reported in the national capital district (ncd), western, gulf and west new britain provinces in 2016 (fig. 6b). ten provinces contributed to 76% of the reported tb burden: ncd, western, gulf, oro, east sepik, madang, morobe, eastern highlands, chimbu, and west new britain. fig. 6b. tb case notification rate by province, papua new guinea, 2016 click to download figure 6b. jpg, 302kb paediatric tb cases (age ≤14 years old) constituted 26.7% (n = 7541) of all notified tb cases in 2016. most of the provinces reported proportions of paediatric tb cases between 20% and 30% (fig. 7). four provinces—manus, jiwaka, southern highlands and western highlands—reported proportions of paediatric cases of less than 20%. four provinces—sandaun, hela, oro and west new britain—reported proportions of paediatric cases of more than 30%; particularly high proportions were reported in hela (51%) and west new britain (48%) (fig. 7). fig. 7. proportion of paediatric tb among all notified tb cases by province, papua new guinea, 2016 click to download figure 7. jpg, 327kb in 2016, the proportion of pulmonary tb among total tb notifications was 27.3% nationally. new smear-positive cases accounted for 15.6% of tb notifications nationwide, with the lowest proportion found in the highlands region (8%) (table 1). ep-tb contributed 42.4% of the total notifications in 2016, with the highest proportion reported in the highlands region (60.4%). the proportions of pulmonary tb cases without sputum test results ranged from 19.8% in the southern region to 47% in the islands region as compared to the national average of 26.6%. table 1. summary indicators for tb programme, papua new guinea, 2016 click to download table 1. jpg, 519kb of all tb cases, 34.8% were tested for hiv with variations at the subnational level ranging from 3% in central province to 86.4% in jiwaka province (table 1). the regional testing rate was highest in the highlands (45.7%), with two of its provinces (enga and jiwaka) achieving an hiv testing rate of ≥80%. the hiv testing rate was the lowest in the islands (11.4%). in 2016, 7.1% of the notified tb patients who were tested for hiv were hiv positive. hiv positivity ranged from 0% in sandaun province to 28.6% in manus province. six provinces had hiv positivity rates of 10% or more: chimbu, enga, east new britain, manus, central and oro (table 1). the treatment success rate for all tb cases at the national level remained low in comparison to the global standard,1 ranging between 55% and 65% during the study period (fig. 8). the percentage of patients lost to follow-up declined over time; nevertheless, it remained high at ≥19% in 2016. loss to follow-up and not evaluated were the major contributing factors towards a low treatment success rate in papua new guinea. in 2016, 986 deaths were reported. loss to follow-up remained a major issue for all regions, with the highest rate in the islands (27% in 2016). we observed higher treatment success rates in new smear-positive cases (73% in 2016), though the cure rate remained considerably lower than the treatment success rate. fig. 8. treatment outcomes at national and regional levels, papua new guinea, 2008–2016 click to download figure 8. jpg, 785kb discussion in this paper, we report national and subnational tb surveillance data that provide an overview of the tb epidemiological and programmatic situation in papua new guinea over nine years. from 2008 to 2012, the country succeeded in expanding dots and strengthening the national surveillance system to capture nationwide data. improved case-finding efforts resulted in a doubling of population screening from 0.2% in 2011 to 0.4% in 2014. the population-screening rate has remained static since 2014, and the rate was found to be low compared to other countries such as cambodia (1.1% in 2013)7 and tajikistan (0.57% in 2013).8 the programme in papua new guinea might not be reaching hard-to-reach populations possibly due to the policy to focus on a limited number of health centres.9 in the setting of an effective tb programme, the smear-positivity rate is inversely proportional to the population-screening rate.7 in cambodia, the smear-positivity rate declined from 29% in 2001 to 8% in 2013 along with an increased screening rate.7 in contrast, the smear-positivity rate in papua new guinea did not decrease considerably, indicating that improved case detection had a limited impact on reducing infectiousness or that only highly presumptive cases were tested, leading to missed cases. delayed diagnoses (due to limited access to health facilities and microscopy centres) and low treatment success rates likely contribute to high smear positivity. papua new guinea has only 114 microscopy facilities across 275 bmus with weak referral systems, resulting in overreliance on clinical diagnosis. these health systems gaps can also account for the high proportion of pulmonary tb cases without sputum test results (26.6%) and the low proportion of bacteriologically confirmed tb among pulmonary tb cases (25.9%) compared to 38% in the western pacific region and 57% globally.1 in parallel with increased population-screening rates, case notification rates steadily increased from 2008 to 2014, spiked in 2012 and plateaued in 2014. the highest case notification rates were in the 15–64-year-old age group, diverging from the pattern of highest case notification rates in older populations seen in most high-burden countries in the western pacific region.10 similarly, the proportion of paediatric tb in papua new guinea (26.7%) was found to be higher than other high-burden countries in the western pacific region.11 paediatric tb represents recent transmission and can be a sentinel marker of disease transmission.12,13 although over-diagnosis is possible, the large proportion of paediatric tb cases indicates ongoing community transmission. we believe that this calls for improvements in early case finding and appropriate community preventive measures, including contact investigation. without additional information, we cannot determine the causes of regional variations in tb case notification. the increased case notification rate in the southern region might reflect might reflect increased true tb incidence or improved programme activities, or both. given papua new guinea's rich regional sociocultural diversity, different factors can affect an individual's tb risk and health-seeking behaviours as well as a programme's performance measures in different ways. ultimately, these differences may lead to regional differences in case notification rates. the high proportion of pulmonary tb cases without sputum test results is a major barrier in understanding tb epidemiology in papua new guinea. many factors could have contributed to this high proportion, including limited accessibility to a tb laboratory and unreliable sputum transport systems.14 without increasing the number of quality-assured functional tb laboratories, the challenge to increase bacteriological confirmation of tb will remain. despite the national mandate to test everyone diagnosed with tb for hiv infection, only 34.8% of tb patients were tested; 7% were positive, a percentage comparable to other high-risk populations, such as sex workers (14.9%), men who have sex with men and transgender individuals (8.5%).15 among other countries in the western pacific region with a high burden of tb, the percentage of tb patients tested for hiv ranged from 13% in the philippines to 84% in cambodia; hiv positivity ranged from <1% in the philippines to 4% in cambodia.1 while the percentage of tb patients tested for hiv in papua new guinea is comparable with other high-burden countries in the region, positivity is higher. collaboration between tb and hiv programmes and the implementation of integrated service delivery models with proper monitoring are essential to reduce the burden of tb/hiv co-infection. treatment success did not improve during the study period; the national average remained around 65%, far below the global target of 90%,16 and the western pacific region rate of more than 85%.1,10 none of the regions achieved the >85% treatment success target. loss to follow-up continues to be a major challenge that has likely resulted in an underreporting of deaths. new smear-positive cases had better outcomes compared to re-treatment cases but did not reach the global target. to improve treatment outcomes, further action is needed to strengthen patient support, including daily treatment, monitoring, counselling and continued efforts to strengthen the health system and address socioeconomic and physical barriers to accessing tb services.17 family dot and self-administration are currently practised in papua new guinea but have not led to improved treatment success rates. revisiting the care modality by strengthening community involvement and using an informal health workforce for treatment support is warranted. to improve access to tb treatment, it is essential not only to increase the number of bmus but also to advance integrated service delivery through the full network of public health facilities, including aid posts (lowest-level public health facility) in communities. this report has several limitations. an analysis of drug-resistant (dr-tb) was not included because a nationwide data collection system for dr-tb has not been established. laboratory data used in the analysis were limited to smear microscopy results since data on genexpert and culture tests were not captured in the surveillance system. data quality might have been an issue, especially as the surveillance system was being established, and the reporting rate was low between 2008 and 2012. hence, trends in those years should be interpreted with caution. in addition, a high percentage of pulmonary tb cases without sputum test results hindered the interpretation of results. despite these limitations, we have provided an overview of tb surveillance data and identified patterns in tb epidemiology and programmatic performance in papua new guinea. in particular, subnational-level analysis helped identify geographical and programmatic areas that can be prioritized for improvement.7,18 the use of subnational data should be further strengthened and routinely performed for operational planning and implementation of effective tb programmes in papua new guinea. conflicts of interest the authors have no conflicts of interest. funding none. acknowledgements the authors wish to thank all health-care workers who provide tb diagnosis and treatment services in papua new guinea. the authors extend their thanks to all staff members of national and provincial teams working on the national tb program of papua new guinea for their tremendous efforts in data collection and reporting. references global tuberculosis report 2017. geneva: world health organization; 2017 (http://www.who.int/tb/publications/global_report/, accessed 12 february 2018). asante a and hall j. a review of health leadership and management capacity in papua new guinea. syndey: human resources for health knowledge hub, university of new south wales; 2018 (www.hrhhub.unsw.edu.au, accessed 13 february 2018). definitions and reporting framework for tuberculosis–2013 revision (updated december 2014). geneva: world health organization; 2014 (http://www.who.int/tb/publications/definitions/en/, accessed 31 december 2017). 2011 census. waigani: national statistical office of papua new guinea; 2011. population of papua new guinea by age group. fremont, ca: livepopulation.com (https://www.livepopulation.com/country/papua-new-guinea.html, accessed 22 february 2018). title of website. location: organization; 2015 (http://www.wpro.who.int/mediacentre/releases/2015/20150327/en/, accessed 2 february 2017). morishita f, furphy vb, kobayashi m, nishikiori n, eang mt, yadav r-p. tuberculosis case-finding in cambodia: analysis of case notification data, 2000 to 2013. west pac surveill response. 2015 feb 26;6(1):15–24. doi:10.5365/wpsar.2014.5.4.005 pmid:25960919 chang e, luelmo f, baydulloeva z, joncevska m, kasymova g, bobokhojaev o, et al. external quality assessment of sputum smear microsopy in tuberculosis laboratories in sughd, tajikistan. cent asian j glob health. 2016 mar 4;4(2):230. doi:10.5195/cajgh.2015.230 pmid:29138725 national strategic plan (nsp) for papua new guinea (2015–2020). waigani: government of papua new guinea; october 2014. hiatt t, nishikiori n. epidemiology and control of tuberculosis in the western pacific region: update with 2013 case notification data. west pac surveill response. 2016 may 2;7(2):41–50. doi:10.5365/wpsar.2015.6.4.010 pmid:27508090 global tb database. geneva: world health organization; 2018 (http://www.who.int/tb/country/data/download/en/, accessed 12 february 2018). shingadia d, novelli v. diagnosis and treatment of tuberculosis in children. lancet infect dis. 2003 oct;3(10):624–32. doi:10.1016/s1473-3099(03)00771-0 pmid:14522261 dodd pj, gardiner e, coghlan r, seddon ja. burden of childhood tuberculosis in 22 high-burden countries: a mathematical modelling study. lancet glob health. 2014 aug;2(8):e453–9. doi:10.1016/s2214-109x(14)70245-1 pmid:25103518 joint external review of the national tuberculosis programme of papua new guinea, february 2014. external review team. kelly-hanku a, willie b, weikum da, boli neo r, kupul m, coy k, et al. kauntim mi tu: multi-site summary report from the key population integrated bio-behavioural survey, papua new guinea. goroka: papua new guinea institute of medical research and kirby institute, unsw sydney; 2018. resolution wha67.2. global strategy and targets for tuberculosis prevention, care and control after 2015. in: sixty-seventh world health assembly, geneva, 19–24 may 2014. resolutions and decisions, annexes. geneva: world health organization; 2014 (http://apps.who.int/gb/ebwha/pdf_files/wha67-rec1/a67_2014_rec1-en.pdf, accessed 13 february 2018). diefenbach-elstob t, plummer d, dowi r, wamagi s, gula b, siwaeya k, et al. the social determinants of tuberculosis treatment adherence in a remote region of papua new guinea. bmc public health. 2017 jan 13;17(1):70. doi:10.1186/s12889-016-3935-7 pmid:28086845 nishikiori n, morishita f. using tuberculosis surveillance data for informed programmatic decision-making. west pac surveill response. 2013 mar 31;4(1):1–3. doi:10.5365/wpsar.2013.4.1.007 pmid:23908948 https://ojs.wpro.who.int/ 1wpsar vol 12, no 4, 2021 | doi: 10.5365/wpsar.2021.12.4.706 surveillance report t he united states-affiliated pacific islands are a group of six countries and territories spread across the pacific. in spring 2019, unusual increases in influenza-like illness (ili) were reported in four of these micronesian islands: the commonwealth of the northern mariana islands (cnmi); the federated states of micronesia (fsm), comprising the states of chuuk, kosrae, pohnpei and yap; guam; and the republic of the marshall islands (rmi) (fig. 1). these islands are part of the world health organization’s (who’s) pacific syndromic surveillance system, which monitors ilis and other syndromes and distributes weekly reports with data from 23 participating pacific island countries and territories.1 despite inclusion in surveillance system dispatches, these 23 countries and territories have low representation in broader regional reports, partly because of their limited diagnostic testing capacity as well as their small populations, which are dwarfed by other members of who’s western pacific region. data from these us-affiliated islands also generally do not appear in united states influenza surveillance reports. as a result, surveillance of the burden, distribution and type of influenza impacting the pacific island countries and territories may be incomplete. this report uses surveillance data from four a hubert department of global health, rollins school of public health, emory university, atlanta, ga, united states of america. b career epidemiology field officer program, division of state and local readiness, center for preparedness and response, united states centers for disease control and prevention, atlanta, ga, united states of america. c department of public health and social services, mangilao, guam. d ministry of health and human services, majuro, republic of the marshall islands. e public health and hospital emergency preparedness program, commonwealth healthcare corporation, saipan, commonwealth of the northern mariana islands. f department of health and social affairs, pohnpei, federated states of micronesia. g immunization program, commonwealth healthcare corporation, saipan, commonwealth of the northern mariana islands. published: 27 october 2021 doi: 10.5365/wpsar.2021.12.4.706 data collected through routine syndromic surveillance for influenza-like illness in the micronesian united states-affiliated pacific islands highlighted out-of-season influenza outbreaks in the spring of 2019. this report describes the data collected through the world health organization’s pacific syndromic surveillance system for the commonwealth of the northern mariana islands (cnmi), guam, the federated states of micronesia (fsm) and the republic of the marshall islands (rmi). compared with historical data, more cases of influenza-like illness were observed in all four islands described here, with the highest number reported in guam in week 9, cnmi and fsm in week 15, and rmi in week 19. the outbreaks predominantly affected those aged <20 years, with evidence from cnmi and rmi suggesting higher attack rates among those who were unvaccinated. cases confirmed by laboratory testing suggested that influenza b was predominant, with 83% (99/120) of subtyped specimens classified as influenza b/victoria during january–may 2019. these outbreaks occurred after the usual influenza season and were consistent with transmission patterns in eastern asia rather than those in oceania or the united states of america, the areas typically associated with the united states-affiliated pacific islands due to their geographical proximity to oceania and political affiliation with the united states of america. a plausible epidemiological route of introduction may be the high levels of international tourism from eastern asian countries recorded during these periods of increased influenza b/victoria circulation. this report demonstrates the value of year-round surveillance for communicable diseases and underscores the importance of seasonal influenza vaccination, particularly among younger age groups. emergence of influenza b/victoria in the micronesian us-affiliated pacific islands, spring 2019 stephanie o’connor,a w. thane hancock,b estelle ada,c edlen anzures,d christine baza,c annette l. aguon,c doris cruz,e eliaser johnson,f allan j. mallari,c jill a. mccready,d jack niedenthal,d ann pobutsky,c anne marie santos,c jose villagomez santos,g jeremy sasamoto,g portia tomokane,e warren villagomeze and paul whitee correspondence to stephanie o’connor (email: stephanie.oconnor@alumni.emory.edu) wpsar vol 12, no 4, 2021 | doi: 10.5365/wpsar.2021.12.4.706 https://ojs.wpro.who.int/2 o’connor et alpacific islands influenza outbreaks cases were confirmed by nasopharyngeal swab testing, which is implemented routinely on a selection of patients presenting with flu-like symptoms. testing is done at the health-care provider’s discretion but may be more likely when providers are aware of increased circulation of influenza. a small number of nasopharyngeal swab specimens from cnmi, fsm and rmi were subtyped using reverse transcription polymerase chain reaction (rtpcr) analyses (applied biosystems 7500 fast dx realtime pcr, thermofisher scientific, carlsbad, ca, usa) conducted by the guam public health laboratory and the hawaii state laboratories division. the laboratory in guam routinely selects at least four nasopharyngeal swab specimens for surveillance each week. a confirmed influenza case was defined as infection in a patient with symptoms of ili and a nasopharyngeal swab specimen positive for influenza by rapid or rt-pcr testing. cases were considered probable if not confirmed through nasopharyngeal swab testing. data from cnmi came from seven sentinel sites on the three permanently inhabited northern mariana islands. forty-two facilities representing the four states of fsm contributed syndromic data, but ili rates reported here are from only the eight sentinel sites in of the micronesian islands affiliated with the united states to expand understanding of how these islands fit into broader regional and global influenza transmission trends. ethics statement this project was determined to be exempt from review by the emory university institutional review board. methods this surveillance report describes trends in ili and influenza for weeks 1–20 of 2019 from data reported to the surveillance system from the following four usaffiliated islands: cnmi, fsm, guam and rmi. although the primary focus is on the time from january through mid-may, data are provided through june for rmi, which experienced a later outbreak. ili counts were collected as part of routine surveillance system reporting, which defines ili as the acute onset of fever (38 °c/100.4 °f) accompanied by cough or sore throat, or both.1 cnmi routinely calculates ili rates as a percentage of total outpatient encounters; rates were calculated retrospectively for guam, fsm and rmi. fig. 1. number of cases of influenza-like illness reported in four of the us-affiliated pacific islands: the commonwealth of the northern mariana islands, the federated states of micronesia, guam and the republic of the marshall islands, weeks 1–23, 2019 0 2 4 6 8 10 12 14 16 1 2 3 4 5 6 7 8 9 10 11 12 13 14 15 16 17 18 19 20 21 22 23 % in fl u en za -l ik e ill n es s in o u tp at ie n t vi si ts week guam commonwealth of the northern mariana islands republic of the marshall islands, majuro micronesia (federated states of), pohnpei state wpsar vol 12, no 4, 2021 | doi: 10.5365/wpsar.2021.12.4.706https://ojs.wpro.who.int/ 3 pacific islands influenza outbreakso’connor et al among confirmed influenza b cases of known age, 70% (163/232) were 5–19 years, 20% (46/232) were <5 years and 1 was >50 years. altogether, 35% (30/86) of confirmed cases classified as caused by influenza b/ victoria occurred in persons aged <5 years, and 55% (47/86) occurred in persons aged 5–19 years. there were six hospitalizations for confirmed cases of influenza b in weeks 5–17, with two in week 9. five of these confirmed cases were aged ≤6 years, and one of these passed away after admission. commonwealth of the northern mariana islands two weeks after cases of ili peaked in guam, the rate of ili in cnmi began to increase, nearly doubling in 2 weeks (fig. 3). the ili rate increased consistently through week 16, reaching 9.3% (117/1254) of outpatient encounters. the number of confirmed cases rose from week 11 onwards, peaking during week 15 at 50 cases. much like guam, cnmi started the year with a higher number of confirmed cases caused by influenza a. in week 8, however, the number of confirmed cases caused by influenza b viruses for the first time exceeded the confirmed cases caused by influenza a. from week 7 to 20, 87% (293/338) of confirmed cases were caused by influenza b. four specimens collected during weeks 16–17 were sent to the guam public health laboratory for serotyping, and all were identified as influenza b/victoria (table 2). the age range among confirmed cases of influenza b/victoria was 7 months to 11 years, consistent with the range in guam. those aged <20 years accounted for 76% (770/1007) of cases of ili from week 7 to 20. during that period, 46% (462/1007) of ili cases occurred among people aged 5–19 years, with weekly percentages of ili occurring in this age group ranging from 31% (19/62) to 57% (36/63). only 5% (48/1007) of ili cases occurred in those aged ≥50 years. the population-wide vaccination rate in cnmi from august 2018 through week 20 of 2019 was 35% among those younger than 5 years (cnmi commonwealth healthcare corporation, division of public health services immunization program, unpublished data, 2019). however, this is likely an overestimation, as it does not include those who received the second dose recommended for younger children. among confirmed pohnpei, which had the most complete data about total encounters. syndromic data from guam were collected at the island’s only public hospital, and confirmed cases were detected through electronic laboratory reports and morbidity reports from health-care facilities across the island. the rmi system is composed of hospitals and clinics located on ebeye island, majuro and the outer islands, although the data presented here are drawn only from majuro’s three sentinel sites due to constraints on data access. for each jurisdiction, vaccination rates were calculated based on immunization programme records, where available. regional trends were assessed based on information from flunet, who’s online platform that aggregates influenza counts from the global influenza surveillance and response system (gisrs).2 results guam in late february and most of march 2019, guam experienced an increase in rates of ili (fig. 2) not expected based on historical data. in weeks 8 and 9, the rate of ili increased nearly threefold to reach 12.2% (35/287) of outpatient encounters, and it remained above 10% through week 12 (31/301, 30/272 and 29/262 in weeks 10, 11 and 12, respectively). a total of 107 specimens were randomly selected for serotyping from week 1 to 20. although influenza a(h3n2) and a(h1n1)pdm09 were detected early in the year, the number of confirmed cases caused by influenza a generally declined beginning in late january. cases caused by influenza a viruses reached a low just as the number of confirmed cases caused by influenza b viruses began to increase in week 6, when they represented 71% (24/34) of confirmed cases. by the peak of the outbreak in week 13, influenza b viruses accounted for 88% (77/88) of confirmed cases. influenza b/victoria was present in 100% of specimens tested by rt-pcr during weeks 10–20. during the full study period, 80% (86/107) of confirmed cases were caused by the victoria lineage (table 1). no influenza b/ yamagata viruses were detected. the majority of cases of ili occurred among those aged <20 years. from week 6 onwards, 61% (172/280) of ili encounters were with those aged 0–4 years, and 19% (52/280) were with those aged 5–19 years. wpsar vol 12, no 4, 2021 | doi: 10.5365/wpsar.2021.12.4.706 https://ojs.wpro.who.int/4 o’connor et alpacific islands influenza outbreaks fig. 2. number of cases of influenza-like illness reported and confirmed influenza, by virus type and rate, guam, weeks 1–20, 2019 table 1. number of positive influenza specimens by subtype, guam, weeks 1–20, 2019a a the guam public health laboratory subtypes a random selection of nasopharyngeal swab specimens each week for routine influenza surveillance. no testing was conducted during weeks 2–4, indicated by –. 0 2 4 6 8 10 12 14 16 0 10 20 30 40 50 60 70 80 90 100 1 2 3 4 5 6 7 8 9 10 11 12 13 14 15 16 17 18 19 20 % in fl u en za -l ik e ill n es s in o u tp at ie n t vi si ts n o . o f co n fi rm ed in fl u en za c as es week influenza a influenza b undetermined influenza influenza-like illness (rate) week influenza type total no. of specimens tested a(h1n1)pdm09 and a(h3n2) b/victoria 1 8 0 8 2 – – – 3 – – – 4 – – – 5 4 0 4 6 5 3 8 7 0 11 11 8 1 8 9 9 3 6 9 10 0 6 6 11 0 7 7 12 0 6 6 13 0 5 5 14 0 6 6 15 0 6 6 16 0 4 4 17 0 5 5 18 0 4 4 19 0 5 5 20 0 4 4 total 21 86 107 wpsar vol 12, no 4, 2021 | doi: 10.5365/wpsar.2021.12.4.706https://ojs.wpro.who.int/ 5 pacific islands influenza outbreakso’connor et al cases: three of influenza a and three of influenza b. the influenza b viruses were all detected during weeks 14–15 in cases with an age range of 8–29 years. of the two specimens from yap subtyped by the guam public health laboratory, both were influenza b/victoria (table 2). the increase in ili cases in fsm appears to have been driven primarily by increased cases in pohnpei, although this may have been amplified by missing data from other states. pohnpei reported 67% (2068/3066) of fsm’s cases during weeks 1–20. pohnpei’s ili encounters nearly doubled from week 12 to 13, reaching 7.3% of outpatient encounters (153/2085). the ili rate was above 10% for most of april and peaked at 14% (314/2239) in week 15. while ili rates were not available cases aged 0–4 years detected during weeks 8–18, 95% (84/88) were unvaccinated, although 14% (12/84) of these were too young for vaccination. among cases aged 5–19 years, 86% (110/128) were unvaccinated. federated states of micronesia data from fsm indicate similar patterns to those in guam and cnmi. the number of ili encounters increased from week 11 to 15, when encounters peaked at 370, or approximately 2.7 times the year-to-date average of 136 ili encounters per week. in week 14, there were 294 cases of ili, approximately 1.8 times the 4-week average of 167 cases. for weeks 12–18, cases of ili were above the year-to-date average. there were six confirmed fig. 3. number of cases of influenza-like illness reported and confirmed influenza, by virus type and rate, commonwealth of the northern mariana islands, weeks 1–20, 2019, with rates for 2018 and 2019 (2018 rate included for comparison) table 2. number of positive influenza specimens submitted for further testing, by lineage, us-affiliated pacific islands, weeks 1–20, 2019 0 2 4 6 8 10 12 14 16 0 10 20 30 40 50 60 1 2 3 4 5 6 7 8 9 10 11 12 13 14 15 16 17 18 19 20 % in fl u en za -l ik e ill n es s in o u tp at ie n t vi si ts n o . o f co n fi rm ed in fl u en za c as es week influenza a influenza b influenza-like illness 2019 (rate) influenza-like illness 2018 (rate) jurisdiction influenza type total no. of specimens testeda(h1n1)pdm09 and a(h3n2) b/victoria commonwealth of the northern mariana islands 0 4 4 micronesia (federated states of) 0 2 2 republic of the marshall islands 0 7 7 wpsar vol 12, no 4, 2021 | doi: 10.5365/wpsar.2021.12.4.706 https://ojs.wpro.who.int/6 o’connor et alpacific islands influenza outbreaks cases in 2018 versus 322 in 2019), and the 4-week average at the height of the outbreak was 65% higher than during the same period in 2018 (103 in 2018 and 170 in 2019). data from cnmi provide further evidence that the increase in ili cases observed in 2019 was not consistent with recent regional trends, with the peak ili encounter rate of 9.3% in spring 2019 for cnmi more than triple that during the same week in 2018 (2.7%). during the spring 2019 peak, the 4-week average for ili encounters (106 encounters) was more than twice as high as during the same time in the previous year (43 encounters). of the 107 confirmed cases reported from guam during 2019, 80% were influenza b/victoria. although only a few specimens from patients with ili in cnmi, fsm and rmi were subtyped, all were found to be influenza b/victoria. the timing and age distribution of these confirmed cases were also consistent with the confirmed cases from guam. previous studies have found higher rates of influenza b/victoria than influenza b/yamagata in younger age groups, with some highlighting that those of school age are at increased risk.3–5 contributing factors may include molecular differences and higher levels of genetic diversity in influenza b/victoria viruses, which allow them to target younger people with less prior viral exposure.5 widespread circulation of both influenza b subtypes has been documented in the pacific, with influenza b/victoria predominant during 2010–2012 and 2016, and with influenza b/yamagata predominant in 2013–2015 and 2017.6 the outbreaks reported here perhaps indicate a resurgence of influenza b/victoria over influenza b/yamagata. the four us-affiliated pacific islands in this report all lie in the tropical region between the equator and the 20th parallel north. although the timing of these influenza outbreaks in these micronesian islands was consistent with northern temperate climates, where influenza activity spikes in the winter months,6 the emergence of influenza b/victoria did not match the patterns of viruses circulating in the us mainland. during weeks 1–20, only 5% of influenza cases reported by the us to gisrs were caused by influenza b viruses.7 the oceania–melanesia– polynesia influenza transmission zone, of which all us-affiliated pacific islands are members, had similarly low levels of influenza b cases, according to the global reporting system.7 patterns of confirmed influenza cases in the broader who western pacific region, driven in large part by data from china, were similar to those noted for states other than pohnpei, the number of ili cases in yap exceeded the threshold indicating heightened ili activity during weeks 14–16. republic of the marshall islands influenza cases were reported in rmi later than in the other us-affiliated pacific islands and exceeded the expected ili threshold only on the main island of majuro. only majuro is connected to rmi’s health information system, which may impact the capacity to detect outbreaks. within majuro, the ili rate remained <1% until week 16 (fig. 4). at the outbreak’s peak in week 19, the rate of ili in outpatient encounters increased to 10.5% (111/1059), with 49% (54/111) of cases occurring among children aged <5 years and 35% (39/111) among those aged 5–19 years. only 3% (3/111) occurred among people aged ≥50 years. the rate of ili detected in the outpatient department was 8% (40/497) in week 19 and 6.2% (29/467) the following week. consistent with the age range affected by the outbreak, ili rates were significantly higher in the public health/maternal and child health department, at 27.1% (69/255) in week 19 and 17% (38/224) in week 20. there were 131 probable cases of influenza detected on majuro during weeks 16–23. among these, 61% (80/131) were among children aged <5 years and 20% (26/131) were among those aged 5–19 years. seven confirmed cases from week 19 were subtyped as influenza b/victoria by the hawaii state laboratories division (table 2), with these confirmed cases ranging in age from 8 to 54 years. based on data extracted from the rmi national immunization information system, influenza vaccine coverage during the 2018–2019 season for majuro was 66% for those aged <20 years. among the probable and confirmed cases, the overall vaccination rate was 5%, with a slightly higher rate (12%) among those aged 5–19 years. discussion surveillance data identified unseasonal outbreaks of influenza during the spring of 2019 in four us-affiliated pacific islands: cnmi, fsm, guam and rmi. although historical data are limited, the number of cases of ili reported at their peak in fsm in 2019 was three times higher than during the same week the previous year (104 wpsar vol 12, no 4, 2021 | doi: 10.5365/wpsar.2021.12.4.706https://ojs.wpro.who.int/ 7 pacific islands influenza outbreakso’connor et al fig. 4. number of reported cases of influenza-like illness and probable influenza, with rate of influenza-like illness, majuro, republic of the marshall islands, weeks 1–23, 2019 0 2 4 6 8 10 12 14 16 0 10 20 30 40 50 60 1 2 3 4 5 6 7 8 9 10 11 12 13 14 15 16 17 18 19 20 21 22 23 % in fl u en za -l ik e ill n es s in o u tp at ie n t vi si ts n o . o f p ro b ab le in fl u en za c as es week probable cases of influenza influenza-like illness (rate) were available on subtyped influenza b viruses from the republic of korea, but 92% of specimens from china were identified as influenza b/victoria and only 2% were influenza b/yamagata.7 the increase in influenza b cases observed later in 2019 in fsm and rmi compared with cnmi and guam may be partially attributable to the lack of direct flights from eastern asia. rmi received 2049 visitors during january–march 2019, with arrivals peaking in march.10 data from previous years suggest that most visitors to rmi come from other pacific islands and north america,11 and fsm’s visitors are primarily from the us.12 however, guam serves as a primary air transport hub for both fsm and rmi, which may have provided an opportunity for the introduction of influenza b. this would help explain the delays in peak activity, with guam’s burden highest in week 13, followed by that in fsm in week 15 and in rmi in week 20. the epidemiological evidence provided on the vaccination status of influenza cases has implications for immunization policy. the high attack rate among those aged <20 years underscores the vulnerability of the young to seasonal influenza and reinforces the need for concentrated efforts to vaccinate this population. all four us-affiliated pacific islands in this report used influenza vaccines approved for the northern hemisphere that inin this report: a decline in influenza a cases starting in january and influenza b increasing in early march, overtaking influenza a by the end of the month and remaining dominant through week 20.7 overall, 20% of cases reported to gisrs from who’s western pacific region were influenza b, and 88% of these were influenza b/ victoria.7 the high volume of travellers to the us-affiliated pacific islands during the spring of 2019 could explain the distinct influenza peaks recorded. the rise of influenza b in guam and cnmi that began around week 7 corresponded to high levels of visitors from eastern asian countries,8,9 offering a plausible route of introduction. a total of 667 784 visitors arrived on guam from january to may, mostly from the republic of korea (44%) and japan (42%).9 during that period, cnmi recorded 188 147 visitors, 47% from china and 42% from the republic of korea.9 china reported 87% of the influenza cases in gisrs from who’s western pacific region and exhibited trends similar to those of the islands reported here.7 in midfebruary, influenza b cases began to increase in china, and comprised 82% of cases by week 20.7 influenza b began appearing around the same time in the republic of korea, increasing to account for more than 90% of confirmed influenza cases during weeks 18–20.7 no data wpsar vol 12, no 4, 2021 | doi: 10.5365/wpsar.2021.12.4.706 https://ojs.wpro.who.int/8 o’connor et alpacific islands influenza outbreaks of the exact strain circulating was not possible, which precludes determination of whether the virus was contained in the 2018–2019 influenza vaccine as well as precluding confirmation that the viruses were similar to those circulating in china, japan or the republic of korea. analyses based on the immunization status of cases were limited because this information was not routinely reported for ili encounters in all jurisdictions. conclusions the ability of the sentinel surveillance system to detect influenza outbreaks in four us-affiliated pacific islands is a testament to the value of year-round surveillance for ili because it ensures that clinical teams are informed about circulating respiratory infections. epidemiological analysis identified the age groups most at risk, aiding both clinical and public health responses. although influenza b viruses are not considered to have pandemic potential, identifying circulating strains is important, as demonstrated by the increased burden seen in younger age groups. understanding changing influenza patterns helps in evaluating immunization effectiveness and gaps in coverage to protect the population from an undue burden of disease. acknowledgements this project was supported by the epidemiology and laboratory capacity programme of the united states centers for disease control and prevention. conflicts of interest the authors have no conflicts of interest to declare. funding this project was completed as part of existing work responsibilities and so had no additional funding. references 1. kool jl, paterson b, pavlin bi, durrheim d, musto j, kolbe a. pacific-wide simplified syndromic surveillance for early warning of outbreaks. glob public health. 2012;7(7):670–81. doi:10.1080/17 441692.2012.699536 pmid:22823595 2. flahault a, dias-ferrao v, chaberty p, esteves k, valleron aj, lavanchy d. flunet as a tool for global monitoring of influenza on the web. jama. 1998;280(15):1330–2. doi:10.1001/ jama.280.15.1330 pmid:9794312 cluded a b/victoria/2/87 virus (b/colorado/06/2017-like) in both the trivalent and quadrivalent formulations.13 further testing would be needed to determine whether any differences between the vaccine formulation and the circulating strain could partially explain the higher attack rate among those aged <20 years. low vaccination rates in this age group are likely a contributing factor. the availability of data about the vaccination status of cases in cnmi and rmi provides support for the effectiveness of the vaccine, with 12–14% of cases aged 5–19 years having received the vaccine in those jurisdictions. there were some limitations to our analysis. the data presented in this report were drawn from surveillance systems in four different us-affiliated pacific islands, each with unique data collection procedures. although the pacific syndromic surveillance system provides a standard definition of ili, the way in which that definition is operationalized locally may result in disparate levels of data integrity. while surveillance based on who definitions distinguishes ili from severe acute respiratory infection based on whether the case was hospitalized,14 it is possible that some cases of severe acute respiratory infection were reported as ili. because the jurisdictions represented in this report are characterized by their relatively remote locations, in some cases, limited public health infrastructure and completeness of reporting may have influenced the findings. it is possible that resource availability and physical distance from larger hubs reduced reporting from outer islands. those presenting with ili were not systematically selected for rapid influenza testing, but were selected at the provider’s discretion. heightened awareness of influenza activity may have influenced providers’ decisions to test and report patients presenting with ili. however, consistent patterns of age distribution and influenza type in cnmi, where a large portion of ili encounters were followed up with nasopharyngeal swabs, provide evidence that overall trends may not have been significantly impacted by nonrandom selection. classifying influenza cases into either influenza a or b was made possible through rapid testing, but only a small fraction of specimens was subtyped, and most of the subtyped specimens were from guam. beyond its lineage as an influenza b/victoria virus, isolation wpsar vol 12, no 4, 2021 | doi: 10.5365/wpsar.2021.12.4.706https://ojs.wpro.who.int/ 9 pacific islands influenza outbreakso’connor et al 9. visitor arrival statistics 2018–2019. in: commonwealth of the northern mariana islands, marianas visitors authority [website]. saipan: marianas visitors authority; 2019. available from: https:// drive.google.com/file/d/1at2cnrpmpm5q-9pvd6eqnkzoyljja8tk/view, accessed 24 june 2021. 10. ocit progress report: january to march 2019. in: office of commerce, investment and tourism [website]. majuro; 2019. available from: https://tinyurl.com/rmiocit, accessed 24 june 2021. 11. tourism sector profile: marshall islands. in: office of commerce, investment and tourism [website]. majuro; 2019. available from: https://tinyurl.com/rmitourismprofile, accessed 24 june 2021. 12. international visitor arrivals. in: fsm statistics [website]. pohnpei: fsm statistics office; 2016. available from: https://www. fsmstatistics.fm/international-visitor-arrivals/, accessed 31 july 2021. 13. recommended composition of influenza virus vaccines for use in the 2018–2019 northern hemisphere influenza season. geneva: world health organization; 2018. available from: http://apps.who. int/iris/handle/10665/272270, accessed 24 june 2021. 14. pacific outbreak manual. nouméa: pacific public health surveillance network; 2016. available from: https://www.pphsn.net/ publications/pacific_outbreak_manual_mar_2016.pdf, accessed 31 july 2021. 3. sočan m, prosenc k, učakar v, berginc n. a comparison of the demographic and clinical characteristics of laboratory-confirmed influenza b yamagata and victoria lineage infection. j clin virol. 2014;61(1):156–60. doi:10.1016/j.jcv.2014.06.018 pmid:25034374 4. barr ig, vijaykrishna d, sullivan sg. differential age susceptibility to influenza b/victoria lineage viruses in the 2015 australian influenza season. euro surveill. 2016;21(4):30118. doi:10.2807/1560-7917. es.2016.21.4.30118 pmid:26848118 5. vijaykrishna d, holmes ec, joseph u, fourment m, su yc, halpin r, et al. the contrasting phylodynamics of human influenza b viruses. elife. 2015;4:e05055. doi:10.7554/elife.05055 pmid:25594904 6. el guerche-séblain c, caini s, paget j, vanhems p, schellevis f. epidemiology and timing of seasonal influenza epidemics in the asia-pacific region, 2010–2017: implications for influenza vaccination programs. bmc public health. 2019;19(1):331. doi:10.1186/ s12889-019-6647-y pmid:30898100 7. global influenza surveillance and response system [online database]. geneva: world health organization; 2019. available from: https://apps.who.int/flumart/default?reportno=12, accessed 24 june 2021. 8. may 2019 arrivals. in: guam visitors bureau, statistics [website]. tumon: guam visitors bureau; 2021. available from: https://www. guamvisitorsbureau.com/research/statistics/visitor-arrival-statistics, accessed 24 june 2021. https://ojs.wpro.who.int/ 1wpsar vol 12, no 3, 2021 | doi: 10.5365/wpsar.2021.12.3.842 covid-19: lessons from the field problem novel coronavirus disease 2019 (covid-19) was first reported in december 2019 in wuhan, china, and a pandemic was declared by mid-march 2020.1 the pathogen that causes covid-19, severe acute respiratory syndrome coronavirus 2 (sars-cov-2), was first detected in malaysia in three imported cases on 24 january 2020.2–4 in early 2020, malaysia experienced two waves of covid-19 that flattened by the beginning of june. then in september, the third wave began, during which the number of daily reported cases rose from less than 40 to a peak of more than 5000 in late january 2021.5 as of late may 2021, the fourth wave was ongoing, with daily reported cases beginning to exceed the third wave’s peak.5 the covid-19 pandemic has affected not only the population’s health and economic activity in malaysia, but also its regular community health research projects. here, we describe how health researchers in malaysia adopted changes while preparing for and conducting a national survey amid the pandemic to balance the risks and benefits to the participants and society. a institute for public health, national institutes of health, ministry of health, setia alam, malaysia. b institute for medical research, national institutes of health, ministry of health, setia alam, malaysia. c department of social and preventive medicine, faculty of medicine, university of malaya, kuala lumpur, malaysia. published: 3 september 2021 doi: 10.5365/wpsar.2021.12.3.842 problem: the novel coronavirus disease 2019 (covid-19) pandemic adversely affected the preparation of malaysia’s national health and morbidity survey for 2020 because conducting it would expose data collectors and participants to an increased risk of infection. context: the survey is nationally representative and community based and is conducted by the institute for public health, part of the national institutes of health, to generate health-related evidence and to support the malaysian ministry of health in policymaking. its planned scope for 2020 was the seroprevalence of communicable diseases such as hepatitis b and c. action: additional components were added to the survey to increase its usefulness, including covid-19 seroprevalence and facial anthropometric studies to ensure respirator fit. the survey’s scale was reduced, and data collection was changed from including only face-to-face interviews to mainly self-administered and telephone interviews. the transmission risk to participants was reduced by screening data collectors before the survey and fortnightly thereafter, using standard droplet and contact precautions, ensuring proper training and monitoring of data collectors, and implementing other administrative infection prevention measures. outcome: data were collected from 7 august to 11 october 2020, with 5957 participants recruited. only 4 out of 12 components of the survey were conducted via face-to-face interview. no covid-19 cases were reported among data collectors and participants. all participants were given their hepatitis and covid-19 laboratory test results; 73 participants with hepatitis b and 14 with hepatitis c who had been previously undiagnosed were referred for further case management. discussion: preparing and conducting the national health and morbidity survey during the covid-19 pandemic required careful consideration of the risks and benefits, multiple infection prevention measures, strong leadership and strong stakeholder support to ensure there were no adverse events. preparing for and conducting the national health and morbidity survey in malaysia amid the covid-19 pandemic: balancing risks and benefits to participants and society zhuo lin chong,a noor aliza lodz,a mohd hatta abdul mutalip,a yin cheng lim,b,c maznieda mahjoma and noor ani ahmada correspondence to zhuo lin chong (email: chongzhuolin0818@gmail.com) wpsar vol 12, no 3, 2021 | doi: 10.5365/wpsar.2021.12.3.842 https://ojs.wpro.who.int/2 chong et almalaysian national health and morbidity survey amidst the covid-19 pandemic august 2020, might confuse participants and reduce the response rate to the population census that would be conducted later that same year. the survey would also increase the risk of covid-19 among participants and data collectors. action because the nhms 2020 faced potential cancellation or postponement, researchers at the institute for public health aimed to increase the benefits of the survey as a whole and reduce the risks of covid-19 transmission to participants and data collectors. therefore, the trajectory of the covid-19 pandemic internationally and locally was closely monitored while work continued to prepare for the survey. we also revised our target sample size, from 12 000 to 6000 participants, and reviewed literature on covid-19 research and guidelines on its prevention and control.10,11 at the same time, stakeholders from within the moh and other institutions were engaged in discussions and negotiations to adapt the survey to reflect the latest and anticipated developments of the pandemic. by april 2020, covid-19 was estimated to be under-reported due to subclinical or asymptomatic infections that could contribute to silent transmission. a covid-19 seroprevalence study was necessary to quantify the actual burden and inform prevention and control strategies.12 because the nhms 2020 already included seroprevalence studies requiring blood draws by phlebotomists, a covid-19 seroprevalence study was added. adding a facial anthropometric study to develop a respirator fit test panel for malaysia was also proposed because this is essential to provide adequate protection for the population. these and other proposed measures are summarized in box 1. apart from the survey’s benefits to society, the hepatitis b and c seroprevalence studies would detect undiagnosed cases and ensure that they were referred for further case management. additionally, all participants would be informed of their test results, whether positive or negative. lastly, each participant was compensated for their time and transport costs. this research project was approved by the medical research ethics committee under the moh (approval numbers nmrr-19-867-47973, nmrr-20-1166-55133 and nmrr-20-1217-55489). context in 2020, malaysia had an estimated population of 32.7 million. this number is expected to continue growing in the coming years.6 in order to protect and improve the health of the population, the malaysian ministry of health (moh) must review its programmes and priorities, evaluate the impacts of its health strategies and make plans for future resource allocation. these activities require evidence from timely and nationally representative community-based health data. these data are collected yearly by the institute for public health through the national health and morbidity survey (nhms), a cross-sectional community-based survey. data collected previously included information about the burden of various diseases and their risk factors, health-related behaviours, health care demand, health expenditures and disability.7 the focus of the nhms 2020 was on communicable diseases, primarily hepatitis b and c, to be assessed through seroprevalence studies that would quantify the proportions of the population with immunity and with active and chronic disease. although malaysia is moving towards the goal of eliminating viral hepatitis by 2030, there have been no nationwide, population-based estimates of the burdens of hepatitis b and c.8,9 the nhms 2020 was designed to provide robust estimates to strengthen the moh’s prevention and treatment programmes targeting viral hepatitis and to achieve the elimination target. the initial plan was to centrally recruit and train 22 teams of 7 data collectors. the data collectors would be sent to 4400 homes in communities across malaysia that had been randomly preselected. there, the data collectors would recruit up to 12 000 eligible participants and interview them in their homes. in addition, multiple meetings and workshops would be scheduled with relevant stakeholders prior to data collection to aid in planning and after data collection to aid in data analysis and report writing.7 the covid-19 outbreak in malaysia, and the subsequent movement control order imposed by the government, created many uncertainties around preparing for and conducting the nhms 2020, especially in areas such as procurement, hiring and logistics planning. the houseto-house data collection, planned to occur from june to wpsar vol 12, no 3, 2021 | doi: 10.5365/wpsar.2021.12.3.842https://ojs.wpro.who.int/ 3 malaysian national health and morbidity survey amidst the covid-19 pandemicchong et al measures undertaken during data collection included: • limiting initial visits to selected homes to only 10 minutes and only for the purpose of recruiting eligible participants and distributing self-administered questionnaires; • collecting data in a public place within a community or at the nearest health facility to simplify compliance with additional infection prevention measures, such as: ◦ making appointments to avoid crowding among participants; ◦ providing a face mask (if the participant was not wearing one) and hand sanitizer upon arrival; ◦ screening participants for fever and symptoms upon arrival at the registration counter; ◦ providing a separate entrance and exit, with participants moving through the area in only one direction; ◦ ensuring physical distancing between participants and data collectors, except during blood draws; ◦ providing ppe for data collectors that followed standard droplet precautions, including a singleuse face mask, face shield and long-sleeve gown; ◦ limiting interaction to 15 minutes at each station (registration, interview and blood draw); ◦ ensuring that data collectors and phlebotomists implemented hand hygiene and surface sanitization after interactions with each participant; ◦ ensuring that clinical waste was properly managed; • screening data collectors with sars-cov-2 rtpcr or a rapid antigen test kit every 2 weeks during the survey; • ensuring that compliance was monitored by the field supervisor and audited by institute for public health researchers during regular visits. measures undertaken before data collection included: • adding covid-19 seroprevalence and facial anthropometric studies (to develop a respirator fit test panel); • reducing the level of statistical analysis (from subnational to national) and reducing the overall survey target sample size from 12 000 to 6000 participants; • shortening the duration of data collection, from 3 months to 2 months; • downsizing the data collection team from 22 teams to 12 teams, with 7 data collectors each, comprising one experienced field supervisor from the institute for public health, 5 research assistants and 1 phlebotomist; • changing the data collection method from exclusively face-to-face interviews to mostly self-administered questionnaires and computerassisted telephone interviews; • recruiting well-trained and experienced health staff as phlebotomists; • ensuring pre-training or pre-deployment sarscov-2 reverse transcription polymerase chain reaction (rt-pcr) screening for all trainers and data collectors; • limiting the number of trainers and data collectors attending in-person training, which included a session on covid-19 prevention, with training for phlebotomists delivered virtually; • ensuring that attendees at in-person training practised physical distancing and hand hygiene, and wore a face mask as their minimum personal protective equipment (ppe); • printing standard operating procedures for all staff. box 1. measures proposed for the preparation and conduct of the national health and morbidity survey 2020 in malaysia to increase its benefits and reduce the risk of covid-19 transmission wpsar vol 12, no 3, 2021 | doi: 10.5365/wpsar.2021.12.3.842 https://ojs.wpro.who.int/4 chong et almalaysian national health and morbidity survey amidst the covid-19 pandemic among the 226 people involved in the survey, from training to data collection and phlebotomy, 492 covid-19 screening tests were performed and their results tracked. this included postdeployment screening, which was added, due to the increase in covid-19 cases in some areas towards the end of data collection. of these tests, 147 were rt-pcr and 287 were rapid antigen tests. the method used for 58 tests could not be determined. nevertheless, all screening tests were negative. also, participants who were contacted within 1 month of the computer-assisted telephone interviews reported no new covid-19 cases. a total of 73 cases of hepatitis b and 14 of hepatitis c were detected by the survey in participants who were previously undiagnosed and unaware of their infection. all were notified and referred for further case management. all participants received all their laboratory results. discussion the ethics, risks and benefits of any research project must be considered, even more so during a pandemic (box 2). the nhms 2020 was directly beneficial to its participants, by informing them about their covid-19 and hepatitis status, and then referring them for further case management when necessary. the survey also benefited malaysia overall by providing an evidence base for health policymaking. however, because the hippocratic oath advises “do no harm”, no matter how beneficial surveys like the nhms may be, the risks posed to participants must be minimized. during preparation for the nhms 2020, we did not come across any literature that considered the ethical aspects of conducting population health research during the covid-19 pandemic that provided adequately detailed steps to prevent disease transmission. one such article was published in july 2020, after planning had almost been completed.13 while we could not use this article to plan for our survey, our ethical and practical considerations were similar to those the article presented. in the absence of directly relevant literature, we turned to other literature and guidelines, particularly the malaysian national guidelines and world health organization recommendations, to aid in drafting our outcomes covid-19 seroprevalence and facial anthropometric studies were added to the nhms 2020 to further justify the survey ethically and financially. data were collected in face-to-face interactions only for these two components and the hepatitis b and c components (blood draw and interview). self-administered questionnaires were used to collect information about risk factors for bloodborne infections, hiv-associated stigma, and cognitive, affective and behavioural risk factors for dengue and zoonoses; computer-assisted telephone interviews were used to collect data about tuberculosis-like symptoms, antibiotic use, hiv knowledge and malaria prevention strategies. field data collection lasted about 2 months, from 7 august to 11 october 2020. a total of 5957 participants were recruited into the study. audits during the survey found that compliance with standard operating procedures (sops) for covid-19 prevention was high. almost all proposed measures were implemented fully. however, there were three deviations. first, two teams were added during the last month of data collection to ensure that the survey remained on schedule and reached the target sample size. second, although all trainers and data collectors were screened for covid-19 prior to training, we could not ensure that this first screening was specifically by reverse transcription polymerase chain reaction (rt-pcr) because some of the tests were performed locally. also, a few phlebotomists were not screened prior to their deployment. third, the fortnightly covid-19 screening was performed slightly later than scheduled for half of the teams. however, two important changes were made to the data collection plan to avoid areas where there was a high risk of covid-19 transmission. prior to the start of training and data collection in one state in east malaysia, it entered a 14-day quarantine mandate due to rising covid-19 cases. thus, activities were reorganized and moved to the next state. also, one of the communities selected for the survey had a covid-19 outbreak while one of the teams was there. although the households the team was recruiting were not affected, activities had to be terminated before the authorities imposed stricter lockdown measures. wpsar vol 12, no 3, 2021 | doi: 10.5365/wpsar.2021.12.3.842https://ojs.wpro.who.int/ 5 malaysian national health and morbidity survey amidst the covid-19 pandemicchong et al in conclusion, although our circumstances may differ from other researchers’, the principles we followed in preparing for and while conducting the nhms 2020 during the covid-19 pandemic can reduce the risks and increase the benefits of health research to participants and to society. standard operating procedures for preventing covid-19 transmission during the survey.10,11 because this novel disease was not adequately understood at that time, we took standard droplet and contact precautions, as well as additional measures, but did not fully rely on just one type of precaution (box 1, 2). these precautions were shown to be crucial later when the sars-cov-2 rapid antigen test was found to be less sensitive in detecting asymptomatic covid-19.14,15 thus, relying on only one measure, especially when test results were negative, could have led to a false sense of security and a disease outbreak.15 the institute for public health received strong support to conduct the survey from all stakeholders, including policymakers, researchers and research collaborators, and selected study participants (box 2). it took the efforts of all parties directly involved in training and data collection to ensure that the sops would prevent covid-19 transmission. however, because screening for all of the phlebotomists and four of the data collection teams was done locally, some phlebotomists were not screened, and not all had the more sensitive rt-pcr test for their first screening. additionally, adherence to fortnightly screening was affected by each team’s location and schedule, as well as the availability of health facilities to perform screening. we believe that adherence to the sars-cov-2 screening protocol could be improved by effective communication, better coordination and closer monitoring and auditing. although we consider the absence of positive tests and covid-19 cases associated with the nhms 2020 to be the result of the well-constructed and strictly followed sops, we recognize that the lower sensitivity of our screening methods and the lack of active covid-19 cases among the communities we encountered may have also led to these good outcomes. we also relied on passive surveillance efforts in each community. nevertheless, as our understanding of covid-19 improves, we believe that our sops remain relevant and adequate. finally, we learned that planning and conducting a national health survey, such as the nhms 2020, during a pandemic is not easy. circumstances can change rapidly, even in the presence of advance planning. strong leadership, creativity and flexibility were instrumental to this survey’s success (box 2). box 2. summary of the lessons learned • conducting a national health survey during a pandemic like covid-19 requires more consideration of the risks and benefits it poses to participants and society. • multiple measures are required to prevent covid-19 transmission during a health survey. their implementation should be closely monitored and audited. • strong support from stakeholders, strong leadership, creativity and flexibility were instrumental to the success of this health survey conducted during the covid-19 pandemic: there were no infections among the data collectors, phlebotomists and participants. references 1. coronavirus disease (covid-19): situation report, 51. geneva: world health organization; 2020. available from: https://apps.who. int/iris/handle/10665/331475, accessed 21 may 2021. 2. naming the coronavirus disease (covid-19) and the virus that causes it. in: who/coronavirus disease (covid-19)/technical guidance [website]. geneva: world health organization; 2020. available from: https://www.who.int/emergencies/diseases/novelcoronavirus-2019/technical-guidance/naming-the-coronavirus-disease-(covid-2019)-and-the-virus-that-causes-it, accessed 21 may 2021. 3. kenyataan akhbar ketua pengarah kesihatan malaysia pada 24 januari 2020 [press statement of director general of health malaysia 24 january 2020] (in malaysian). putrajaya, malaysia: ministry of health; 2020. available from: http://www.moh.gov.my/index. php/database_stores/store_view_page/21/1300, accessed 21 may 2021. 4. kenyataan akhbar ketua pengarah kesihatan malaysia pada 25 januari 2020 [press statement of director general of health malaysia 25 january 2020]. putrajaya, malaysia: ministry of health; 2020. available from: http://www.moh.gov.my/index.php/database_ stores/store_view_page/21/1301, accessed 21 may 2021. 5. who coronavirus (covid-19) dashboard: malaysia. in: who coronavirus (covid-19) dashboard/global [website]. geneva: world health organization; 2020. available from: https://covid19.who.int/ region/wpro/country/my, accessed 21 may 2021. 6. mycensus 2020. [portal rasmi banci penduduk dan perumahan malaysia 2020]. in: department of statistics [website]. putrajaya, malaysia: department of statistics; 2020. available from: https:// www.mycensus.gov.my/, accessed 21 may 2021. wpsar vol 12, no 3, 2021 | doi: 10.5365/wpsar.2021.12.3.842 https://ojs.wpro.who.int/6 chong et almalaysian national health and morbidity survey amidst the covid-19 pandemic 11. modes of transmission of virus causing covid-19: implications for ipc precaution recommendations: scientific brief, 27 march 2020. geneva: world health organization; 2020. available from: https://apps.who.int/iris/handle/10665/331601, accessed 21 may 2021. 12. population-based age-stratified seroepidemiological investigation protocol for covid-19 virus infection, 17 march 2020. geneva: world health organization; 2020. available from: https://apps.who. int/iris/handle/10665/331656, accessed 21 may 2021. 13. singh ja, bandewar svs, bukusi ea. the impact of the covid-19 pandemic response on other health research. bull world health organ. 2020;98(9):625-31. doi:10.2471/blt.20.257485 pmid:33012862 14. dinnes j, deeks jj, adriano a, berhane s, davenport c, dittrich s, et al. rapid, point-of-care antigen and molecular-based tests for diagnosis of sars-cov-2 infection. cochrane database syst rev. 2020;8(8):cd013705. doi:10.1002/14651858.cd013705 pmid:32845525 15. rubin r. the challenges of expanding rapid tests to curb covid-19. jama. 2020;324(18):1813-5. doi:10.1001/jama2020.21106 pmid:33084882 7. aris t, yusoff mfm, abd ghani aa, ahmad na, omar a, hio tg, et al. national health and morbidity survey 2015. volume i: methodology and general findings. kuala lumpur, malaysia: institute for public health; 2015. available from: http://www.iku.gov.my/images/iku/document/report/nhmsreport2015vol1.pdf, accessed 21 may 2021. 8. schweitzer a, horn j, mikolajczyk rt, krause g, ott jj. estimations of worldwide prevalence of chronic hepatitis b virus infection: a systematic review of data published between 1965 and 2013. lancet. 2015;386(10003):1546-55. doi: 10.1016/s01406736(15)61412-x pmid:26231459 9. mcdonald sa, dahlui m, mohamed r, naning h, shabaruddin fh, kamarulzaman a. projections of the current and future disease burden of hepatitis c virus infection in malaysia. plos one. 2015;10(6):e0128091. doi:10.1371/journal.pone.0128091 pmid:26042425 10. edaran guidelines covid-19 management in malaysia no. 05/2020 (edisi kelima) [guidelines for covid-19 management no. 5/2020, updated on 24 march 2020] (in malaysian). putrajaya, malaysia: ministry of health; 2020. available from: https://mpaeds.my/wpcontent/uploads/2020/02/covid19-management-guidelines-edition-5_2020.pdf.pdf, accessed 21 may 2021. impact of seasonal influenza on polyclinic attendances for upper respiratory tract infections in singapore original research annabel c.y. soh,a anurag sharma,a david j. muscatello,a a university of new south wales, kensington, new south wales, australia. correspondence to dr david muscatello (email: david.muscatello@unsw.edu.au). to cite this article: soh acy., sharma a, muscatello d. impact of seasonal influenza on polyclinic attendances for upper respiratory tract infections in singapore. western pac surveill response j. 2020 jun;11(2). doi:10.5365/wpsar.2019.10.4.001 purpose: the burden of influenza on primary health-care services is not well established in tropical countries, where there are no clearly defined influenza seasons. we aimed to estimate the association between influenza infection activity and polyclinic attendance rates for upper respiratory tract infections (urtis) in the singapore population. methods: we used generalized additive time series models to estimate the association between the proportion of respiratory tests positive for influenza infection in singapore reported to the world health organization every week, and the population rate of polyclinic attendances in singapore for physician-diagnosed urti, which includes influenza-like illness (ili), for six years from 2012 through 2017. where data were available, we controlled for other infections that can cause fever or respiratory symptoms. results: influenza, dengue fever and chickenpox (varicella) were positively associated with acute urti polyclinic attendances. the estimated urti polyclinic attendance rates attributable to influenza, dengue fever and chickenpox were 618.9 (95% confidence interval [ci]: 501.6–736.3), 153.3 (95% ci: 16.5–290.2) and 1751.5 (95% ci: 1246.3–2256.8) per 100 000 population per year, respectively. conclusions: influenza poses a considerable burden on primary health-care services in singapore. however, a substantial number of polyclinic attendances due to febrile infections such as dengue fever and chickenpox appear to be recorded as urti in the polyclinic database. these associations require further investigation. recent global estimates of influenza-associated mortality are in the range of 290 000–650 000 deaths every year.1 availability of hospital admission and vital statistics databases on mean hospitalizations or deaths attributable to influenza are most often studied.2 however, influenza infections leading to health care for relatively mild symptoms often go unobserved at the population level. the milder outcomes of influenza have not been fully studied despite their greater prevalence.3 singapore is a highly developed country with strong health information systems. this, combined with its equatorial location, makes singapore an ideal candidate for estimating influenza burden in the tropics. singapore’s health information systems include a database of attendances at polyclinics. polyclinics are the first point of contact that patients have with the health-care system when they present with a medical condition. there are around 20 government polyclinics that provide 20% of singapore’s primary health care.4 patients can present to these polyclinics for the treatment of acute conditions or for the follow-up of chronic conditions.5 a widely used method to estimate the burden of influenza is the serfling regression model.6 the model was originally used to estimate influenza-attributable excess mortality from a time series of deaths classified due to pneumonia or influenza. however, one of the limitations is that the model assumes a cyclical baseline activity of influenza due to the distinct seasonality of background (non-influenza) deaths in temperate countries.7,8 yet this may be less applicable in tropical countries such as singapore, where seasonality is less clearly defined.9,10 the generalized additive model (gam) can be used for time series analysis that more flexibly addresses the issue of less distinct seasonality from which excess outcomes attributable to influenza can be discerned. the gam approach models the baseline activity using a more flexible approach than the serfling model.11 unlike serfling’s traditional approach, which excluded influenza periods to ensure the model was not influenced by the effect of epidemics on the time series, the gam approach requires independent variables that are a complete time series. one of these time series, a parametric component of the model, needs to reflect the changing incidence of influenza in the population over time. the gam approach also includes a non-parametric smoothing function of time that reflects the background incidence of unmeasured causes of disease that contribute to the time series, typically a spline curve.7 the objective of this study was to estimate the burden of milder influenza infections on polyclinic attendance rates in singapore. we used time series analysis to estimate the association between influenza and polyclinic attendances for upper respiratory tract infections (urtis), which include influenza-like illness (ili), from 2012 through 2017. where data were available, we controlled for other infections that can cause fever or upper respiratory symptoms. materials and methods study setting and study period we performed a retrospective observational time series analysis of influenza infections and polyclinic attendances in singapore for 2012 through 2017, for 313 weeks over the six-year period. the first week of 2012 was recorded as week 1. data sources available data relevant to urti or ili and other fever-causing infections were downloaded from the singapore government’s data portal.12 these were average daily polyclinic attendances in each week with a physician diagnosis of urti. the definition of urti in the database includes ili. patients are diagnosed with urti at the polyclinic when they present with acute upper respiratory symptoms including cough or sore throat, with or without fever (> 38 °c). patients are diagnosed with ili when they present only with cough and fever (> 38 °c) (ministry of health singapore, personal communication, 10 july 2018). we also obtained average daily polyclinic attendances for chickenpox (varicella) as chickenpox is a possible cause of fever or upper respiratory symptoms in the early stages of infection. influenza surveillance data for singapore were retrieved from the world health organization’s flunet database.13 the weekly number of respiratory specimens reported to flunet that were positive for influenza was obtained.14 weekly counts of all available infectious diseases from the weekly infectious diseases bulletin published by the ministry of health, singapore,15 that could produce fever or upper respiratory symptoms were obtained. the illnesses available were dengue fever, haemophilus influenzae type b, legionellosis and malaria. polyclinics are open only for half a day on saturdays and closed on sundays and public holidays. public holidays affect the hours that polyclinics are open each week and thus the number of weekly attendances. thus, holidays were included in the model to account for their effects. the number of public holidays in each week was tabulated from press releases from the ministry of manpower, singapore.16 school holidays may also affect patient demand and were compiled based on publicly available information provided by the ministry of education, singapore.17 analysis we used a gam to investigate the association of influenza and other infectious diseases with acute urti polyclinic attendances. since the daily average counts of weekly polyclinic attendances for acute urtis were large (~3000 in 2017), a model with normally distributed residuals was assumed. gams can include linear parametric terms and a non-parametric, nonlinear smoothing functions of the independent variables.18 a natural cubic spline of week number was used as the non-parametric smoother to account for unobserved background variation in acute urti polyclinic attendances not associated with the included parametric, independent variables, as described previously.7 the model equation for the daily average number of acute urti polyclinic attendances included the following variables: a model intercept; parameter estimates for all six diseases each multiplied by their respective independent variable; public holidays; school holidays; week number; and an error term. consistent with similar studies,7,18,19 the smoothing spline of week number included 36 degrees of freedom (six per year), to control for mediumand longer-term variation and seasonality of background polyclinic attendances. this effectively controlled for variation in the time series on time scales longer than two months, leaving shorter time scale variation to be explained by the independent variables in the model. to estimate the weekly values of average daily polyclinic attendances attributable to each independent variable, the parameter estimates were multiplied by the observed value of the variable in that week. the parameter estimate of chickenpox was multiplied by the weekly number of chickenpox polyclinic attendances. the parameter estimate of influenza was multiplied by the number of positive specimens in a week. for dengue fever, its parameter estimate was multiplied by the number of infections in one week. to obtain annual total polyclinic attendances attributable to each variable, the estimates of average daily acute urti polyclinic attendances were multiplied by the number of days that polyclinics were open each year. since polyclinics only operate for half a day on saturdays and are also closed on public holidays, the number of days that polyclinics are open can vary each week. the total number of attendances each year was converted to population rates using annual population estimates.20 sas version 7.1 was used for data analysis. quantile-quantile (qq) plots were used to check the modelling assumption that the error term was normally distributed. autocorrelation plots were used to identify autocorrelation in the error term time series, which is another modelling assumption (independence of residuals). ethical approval this project was approved by the unsw sydney human research ethics committee as a negligible risk project (hc number: 180169). results data characteristics a total of 313 weeks from january 2012 to december 2017 was included in the study. during that period, the mean number of average daily acute urti polyclinic attendances each week was 2694.0 (table 1, fig. 1). the mean number of average daily chickenpox polyclinic attendances was 15.0, and attendances occurred throughout the year without apparent seasonality (table 1, fig. 2). the mean number of weekly positive influenza specimens was 18.2, and infections increased during epidemic periods that varied in amplitude between years and occurred at different times of the year (table 1, fig. 3). the mean number of dengue infections each week was 230.7. there were dengue epidemics in some, but not all, years and background rates varied between years (table 1, fig. 4). table 1. descriptive statistics of variables considered click to download table 1. jpg, 164kb fig 1. average daily acute urti polyclinic attendances, by week, singapore, 2012–2017 click to download fig. 1. jpg, 159kb fig 2. average daily chickenpox polyclinic attendances, by week, singapore, 2012–2017 click to download fig. 2. jpg, 184kb fig 3. number of positive influenza specimens, by week, singapore, 2012–2017 click to download fig. 3. jpg, 174kb fig 4. number of reported dengue fever infections, by week, singapore, 2012–2017 click to download fig. 4. jpg, 158kb the mean number of reported haemophilus influenzae type b, malaria and legionellosis cases each week were markedly lower at 0.1, 1.0 and 0.5, respectively, over the six-year period. model fit the qq plots showed that the model assumption of a normally distributed error term was reasonable, although there were some departures from normality at the extremes. the modelling assumption of a non-autocorrelated error term was incompletely met, with some low but statistically significant autocorrelation evident in the model residuals. we attempted to reduce this residual autocorrelation by introducing first-order autoregressive terms into the model. this may be plausible due to delayed health-care seeking following infection. the resulting model therefore included a lag term of one week for each of the three diseases. autocorrelation in the error term was not affected by this change to the model so the autoregressive terms were discarded. as a sensitivity analysis, we changed the functional form of the gam to a poisson model, with a log link function and poisson error term. this did not alter the error term autocorrelations. therefore, this model was discarded in favour of the simpler linear gam model form with a normally distributed error term. main results in the initial model with all available independent variables, weekly occurrences of laboratory-confirmed influenza infections and dengue fever, and of physician-diagnosed chickenpox, were statistically significantly associated with weekly rates of acute urti polyclinic attendances. the parameter estimates for each of these variables were 6.9 (95% ci: 5.6–8.2), 0.1 (95% ci: 0.02–0.3), and 24.0 (95% ci: 17.2–30.8), respectively (table 2). table 2. parameter estimates for each variable in the initial model click to download table 2. jpg, 137kb haemophilus influenzae type b, legionellosis and malaria did not show a significant association with acute urti polyclinic attendances. due to their lack of association and extremely low frequencies, they were excluded from the final model. in the revised model, chickenpox, influenza and dengue fever remained statistically significantly associated with the number of acute urti polyclinic attendances. the parameter estimate for chickenpox was 23.3 (95% ci: 16.5–30.0), while the parameter estimate for influenza was 6.8 (95% ci: 5.5–8.0). the parameter estimate for dengue fever was 0.1 (95% ci: 0.01–0.2) (table 3). table 3. parameter estimates for each variable in the revised model click to download table 3. jpg, 124kb the average annual estimated polyclinic attendance rate per 100 000 population was estimated to be the highest for chickenpox at 1751.5 (95% ci: 1246.3–2256.8), as compared to influenza and dengue fever at 618.9 (95% ci: 501.6–736.3) and 153.3 (95% ci: 16.5–290.2) respectively (table 4, fig. 5). when aggregated by year, chickenpox was estimated to constitute the greatest proportion of acute urti polyclinic attendances across all six years. the percentage of acute urti polyclinic attendances attributable to chickenpox, influenza and dengue fever was 13.0%, 4.6% and 1.2%, respectively, over the study period. table 4. estimated polyclinic attendance rate per 100 000 population by disease and year, singapore, 2012–2017 click to download table 4. jpg, 348kb fig 5. observed totals and estimated averages of daily urti polyclinic attendances attributable to each disease and to background causes, by week, singapore, 2012–2017 click to download fig. 5. jpg, 316kb discussion this study quantifies the influenza activity associated with polyclinic attendances for acute urtis. an estimated average of 618.9 urti polyclinic attendances per 100 000 population per year were attributable to influenza. assuming these polyclinic attendances represent 20% of total primary health-care episodes in singapore with the remainder of primary care services delivered privately,21 the national rate of total influenza-attributable primary care attendances may be around 3100 per 100 000. this is higher than the estimated rate of 2156 per 100 000 in england.22 the percentage of urti polyclinic attendances in singapore that were estimated to be attributable to influenza was 4.6%, and this is also higher than the estimated 2.2% for primary care in beijing, china, but lower than the estimated 8.7% in the united states of america.23,24 the total influenza burden also comprises hospitalizations and deaths in addition to primary care encounters. a study on influenza-associated deaths in singapore found that the average estimated rate was 14.8 per 100 000 person-years from 1996 to 2003.25 the rate of influenza-associated hospitalizations diagnosed with influenza or pneumonia was 29.6 per 100 000 person-years from 2010 to 2012.10 this is likely to underestimate total hospitalizations attributable to influenza, which are often estimated based on broader diagnosis categories such as all respiratory diagnoses.26 the rate of influenza-attributable urti polyclinic attendances is far higher than these more severe outcomes. this is in line with the understanding that mild influenza infections constitute a large proportion of the influenza burden.3,27 the number of influenza-attributable polyclinic attendances dipped slightly in 2015 before rising in 2016. this may be due to the introduction of a novel influenza a(h3n2) strain to singapore in 2016, against which the population did not have prior immunity.28 furthermore, although vaccines including one active against a(h3n2) strain were available in singapore, there are low levels of vaccination uptake in the singaporean population.29 in addition, the reduced effectiveness of the vaccine protective against a(h3n2) vaccine virus strains could have also contributed to the increase in influenza-attributable polyclinic attendances in 2016.30,31 a surprising result was that both dengue fever and chickenpox were associated with acute urti polyclinic attendances. this could be because the clinical symptoms of dengue fever and chickenpox both include fever and these diseases could therefore be mistaken for acute urti in the early days following infection.32,33 this highlights the discriminatory limitations of syndromic data for estimating the burden of influenza infection in primary care.34,35 in taiwan, china, it was found that predictors such as the absence of rashes, platelet count, rhinorrhoea, malaise and sore throat were useful in distinguishing influenza from dengue fever or other febrile illnesses.36 the estimated average annual rate of influenza-attributable urti polyclinic attendances was approximately one third that of chickenpox-attributable urti polyclinic attendances. this suggests that chickenpox may have a very high incidence compared with influenza in singapore. varicella is highly infectious, and a high incidence of infection has been reported in singapore and hong kong sar (china).37–30 varicella is not currently included in the singapore childhood immunization schedule, but it is recommended for adults.40,41 it is no longer a notifiable disease, but a seroprevalence study from 2008 to 2010 showed that seroprevalence of infection was around 30% in singapore infants and around 80% by age 17 years and varicella vaccination uptake was estimated at 52%.42 thus, a high rate of infection is not surprising. the time series of chickenpox polyclinic attendances shows that chickenpox circulates throughout the year, which could also explain the relatively high estimates. influenza and dengue fever, on the other hand, showed varying incidence over time associated with epidemic activity. the relationship of chickenpox with urti polyclinic attendances, however, does require further investigation; it may be able to be further elaborated through age-specific analysis. our results also showed that public holidays had a positive association with urti polyclinic attendances, whereas school holidays a negative association. this is consistent with the trend shown by other infectious diseases in singapore, where hand, foot and mouth disease demonstrated a seasonal trough during school holidays.44 a european study investigating the spread of infectious diseases showed that the highest incidence of cases in an epidemic occurred in schoolchildren.45 this is because contact made within this age group was more likely to be physical, and also because children tended to have a larger social circle than other age groups, leading to a greater dissemination of diseases. these reasons could therefore explain the lower rates of influenza-attributable polyclinic attendances for urtis during school holidays in singapore. on the other hand, mass gatherings during public holidays are likely to contribute to greater spread of diseases like influenza.46 an advantage of our study is that we were able to use a time series of laboratory-confirmed influenza infections to provide a proxy for week-to-week changes in the incidence of influenza infections in singapore. by using only laboratory-confirmed infections, this potentially allows for a more accurate estimation of influenza-attributable urti polyclinic attendance incidence. the study had some limitations. our results did not account for the mild-to-moderate influenza infections where medical care is not sought. in addition, the main limitation is that government-run polyclinics represent only around one fifth of primary care services in singapore, with the remainder delivered privately. thus, our results do not represent the total primary care burden of influenza in singapore. nevertheless, polyclinics remain an important component of the primary health-care sector in singapore, and the database of information on polyclinic attendances can allow for a relatively continuous estimation of influenza’s burden on primary health care in the country. also, we were unable to obtain age-specific information for this study. the data available also did not include information on lower respiratory tract infections or other common respiratory pathogens such as rhinovirus and respiratory syncytial virus. lack of information on other sources of variation in the time series may have explained some of the low residual first-order autocorrelation (r = 0.29), despite the use of the smoothing spline. the degree of smoothing we chose was predetermined to avoid over-fitting the model. in singapore, school holidays can vary by institution, and we used the holiday dates associated with the main educational institutions. sick leave entitlements may influence health-care-seeking behaviour. singaporeans are entitled to a maximum of 14 days of paid outpatient sick leave every year.16 this limited entitlement may lead patients to avoid seeking treatment of relatively mild infections. alternately, it may increase presentations because of the need to obtain a medical certificate. there is limited information on influenza vaccination levels in singapore, although a recent estimate is 14% coverage in 65–74 year olds.47 the vaccine is recommended for all residents, but it is only subsidized for employed citizens and permanent residents with a high risk for severe infection outcomes through the national medical savings scheme (medisave).48 depending on citizenship or residency status, a polyclinic visit can cost up to 68 singapore dollars in 2019.49 this cost, with the additional cost of a vaccine, may lead to a lower vaccine uptake. in summary, influenza may pose a considerable health-care burden on primary health-care services in singapore. the data from our study may be helpful in supporting cost-effectiveness studies to evaluate if an influenza immunization policy would be beneficial to the singaporean population. this could, in turn, lower the rates of polyclinic attendances for influenza. the surprising finding that a substantial proportion of urti presentations appears to be associated with chickenpox and dengue fever activity requires further study. acknowledgements we would like to thank rachael pung from the ministry of health in singapore for helpful advice on the study. funding no funding was received for this project. declaration of interests the authors have no relevant financial information or potential conflicts of interest to disclose. references iuliano ad, roguski km, chang hh, muscatello dj, palekar r, tempia s, et al.; global seasonal influenza-associated mortality collaborator network. estimates of global seasonal influenza-associated respiratory mortality: a modelling study. lancet. 2018 mar 31;391(10127):1285–300. doi:10.1016/s0140-6736(17)33293-2 pmid:29248255 gordon a, reingold a. the burden of influenza: a complex problem. curr epidemiol rep. 2018;5(1):1–9. doi:10.1007/s40471-018-0136-1 pmid:29503792 shubin m, virtanen m, toikkanen s, lyytikäinen o, auranen k. estimating the burden of a(h1n1)pdm09 influenza in finland during two seasons. epidemiol infect. 2014 may;142(5):964–74. doi:10.1017/s0950268813002537 pmid:24139316 primary healthcare services. singapore: ministry of health; 2017. available from: https://www.moh.gov.sg/our-healthcare-system/healthcare-services-and-facilities/primary-healthcare-services, accessed 3 february 2020. services. singapore: singhealth group; 2014. available from: https://polyclinic.singhealth.com.sg/patient-care/our-services, accessed 3 february 2020. serfling re. methods for current statistical analysis of excess pneumonia-influenza deaths. public health rep. 1963 jun;78(6):494–506. doi:10.2307/4591848 pmid:19316455 muscatello dj, newall at, dwyer de, macintyre cr. mortality attributable to seasonal and pandemic influenza, australia, 2003 to 2009, using a novel time series smoothing approach. plos one. 2013 jun 3;8(6):e64734. doi:10.1371/journal.pone.0064734 pmid:23755139 thompson ww, ridenhour bl, barile jp, shay dk. commentary: time-series analyses of count data to estimate the burden of seasonal infectious diseases. epidemiology. 2012 nov;23(6):839–42, discussion 843–4. doi:10.1097/ede.0b013e31826cc1df pmid:23038110 viboud c, alonso wj, simonsen l. influenza in tropical regions. plos med. 2006 apr;3(4):e89. doi:10.1371/journal.pmed.0030089 pmid:16509764 muscatello dj. redefining influenza seasonality at a global scale and aligning it to the influenza vaccine manufacturing cycle: a descriptive time series analysis. j infect. 2019 feb;78(2):140–9. doi:10.1016/j.jinf.2018.10.006 pmid:30476494 wood sn. generalized additive models: an introduction with r, second edition. boca raton: crc press; 2017. average daily polyclinic attendances for selected diseases. singapore: government technology agency; 2017. available from: https://polyclinic.singhealth.com.sg/patient-care/our-services, accessed 10 july 2018. flunet. geneva: world health organization; 2018. available from: https://www.who.int/influenza/gisrs_laboratory/flunet/en/, accessed 10 january 2018. gul d, cohen c, tempia s, newall at, muscatello dj. influenza-associated mortality in south africa, 2009-2013: the importance of choices related to influenza infection proxies. influenza other respir viruses. 2018 jan;12(1):54–64. doi:10.1111/irv.12498 pmid:29197161 weekly infectious diseases bulletin. singapore: ministry of health; 2017. available from: https://www.moh.gov.sg/resources-statistics/infectious-disease-statistics/2017/weekly-infectious-diseases-bulletin, accessed 10 july 2018. sick leave eligibility and entitlement. ministry of manpower; 2019. available from: https://www.mom.gov.sg/employment-practices/leave/sick-leave/eligibility-and-entitlement, accessed 30 november 2019. press releases. ministry of education; available from: https://www.moe.gov.sg/news/press-releases, accessed 30 march 2018. yang l, ma s, chen py, he jf, chan kp, chow a, et al. influenza associated mortality in the subtropics and tropics: results from three asian cities. vaccine. 2011 nov 8;29(48):8909–14. doi:10.1016/j.vaccine.2011.09.071 pmid:21959328 muscatello dj, bein kj, dinh mm. emergency department demand associated with seasonal influenza, 2010 through 2014, new south wales, australia. west pac surveill response. 2017 sep 25;8(3):11–20. doi:10.5365/wpsar.2017.8.2.002 pmid:29051837 population trends 2017. department of statistics singapore. 2017. available from: https://www.singstat.gov.sg/-/media/files/publications/population/population2017.pdf, accessed 29 march 2018. khoo hs, lim yw, vrijhoef hjm. primary healthcare system and practice characteristics in singapore. asia pac fam med. 2014 jul 19;13(1):8. doi:10.1186/s12930-014-0008-x pmid:25120380 cromer d, van hoek aj, jit m, edmunds wj, fleming d, miller e. the burden of influenza in england by age and clinical risk group: a statistical analysis to inform vaccine policy. j infect. 2014 apr;68(4):363–71. doi:10.1016/j.jinf.2013.11.013 pmid:24291062 wu s, van asten l, wang l, mcdonald sa, pan y, duan w, et al. estimated incidence and number of outpatient visits for seasonal influenza in 2015-2016 in beijing, china. epidemiol infect. 2017 dec;145(16):3334–44. doi:10.1017/s0950268817002369 pmid:29117874 fowlkes a, dasgupta s, chao e, lemmings j, goodin k, harris m, et al. estimating influenza incidence and rates of influenza-like illness in the outpatient setting. influenza other respir viruses. 2013 sep;7(5):694–700. doi:10.1111/irv.12014 pmid:22984820 chow a, ma s, ling ae, chew sk. influenza-associated deaths in tropical singapore. emerg infect dis. 2006 jan;12(1):114–21. doi:10.3201/eid1201.050826 pmid:16494727 matias g, taylor r, haguinet f, schuck-paim c, lustig r, shinde v. estimates of hospitalization attributable to influenza and rsv in the us during 1997-2009, by age and risk status. bmc public health. 2017 mar 21;17(1):271. doi:10.1186/s12889-017-4177-z pmid:28320361 newall at, wood jg, macintyre cr. influenza-related hospitalisation and death in australians aged 50 years and older. vaccine. 2008 apr 16;26(17):2135–41. doi:10.1016/j.vaccine.2008.01.051 pmid:18325639 lau b. polyclinics report record high acute respiratory infections due to weak herd immunity. singapore: mims; 8 august 2016. available from: https://today.mims.com/polyclinics-report-all-time-high-for-acute-respiratory-infection-visit-due-to-weak-herd-immunity chua a. doctors suggest free flu vaccines to boost adult immunisation rates2017 27 september 2018. available from: https://www.todayonline.com/singapore/boost-adult-immunisation-rates-doctors-suggest-free-flu-vaccines-and-targeting-patients belongia ea, simpson md, king jp, sundaram me, kelley ns, osterholm mt, et al. variable influenza vaccine effectiveness by subtype: a systematic review and meta-analysis of test-negative design studies. lancet infect dis. 2016 aug;16(8):942–51. doi:10.1016/s1473-3099(16)00129-8 pmid:27061888 osterholm mt, kelley ns, sommer a, belongia ea. efficacy and effectiveness of influenza vaccines: a systematic review and meta-analysis. lancet infect dis. 2012 jan;12(1):36–44. doi:10.1016/s1473-3099(11)70295-x pmid:22032844 dengue control. geneva: world health organization; 2017. available from: https://www.who.int/denguecontrol/faq/en/index2.html, accessed 4 september 2018. chickenpox and shingles. adelaide: sa health; 2017. available from: https://www.sahealth.sa.gov.au/wps/wcm/connect/public+content/sa+health+internet/health+topics/health+conditions+prevention+and+treatment/infectious+diseases/chickenpox+and+shingles, accessed 4 september 2018. navarro-marí jm, pérez-ruiz m, cantudo-muñoz p, petit-gancedo c, jiménez-valera m, rosa-fraile m; influenza surveillance network in andalusia, spain. influenza-like illness criteria were poorly related to laboratory-confirmed influenza in a sentinel surveillance study. j clin epidemiol. 2005 mar;58(3):275–9. doi:10.1016/j.jclinepi.2004.08.014 pmid:15768487 van elden lj, van essen ga, boucher ca, van loon am, nijhuis m, schipper p, et al. clinical diagnosis of influenza virus infection: evaluation of diagnostic tools in general practice. br j gen pract. 2001 aug;51(469):630–4. pmid:11510391 huang s-y, lee ik, wang l, liu j-w, hung s-c, chen c-c, et al. use of simple clinical and laboratory predictors to differentiate influenza from dengue and other febrile illnesses in the emergency room. bmc infect dis. 2014 nov 25;14(1):623. doi:10.1186/s12879-014-0623-z pmid:25421019 chan dyw, edmunds wj, chan hl, chan v, lam yck, thomas sl, et al. the changing epidemiology of varicella and herpes zoster in hong kong before universal varicella vaccination in 2014. epidemiol infect. 2018 apr;146(6):723–34. doi:10.1017/s0950268818000444 pmid:29526171 finger r, hughes jp, meade bj, pelletier ar, palmer ct. age-specific incidence of chickenpox. public health rep. 1994 nov-dec;109(6):750–5. pmid:7800783 goh aen, choi eh, chokephaibulkit k, choudhury j, kuter b, lee p-i, et al. burden of varicella in the asia-pacific region: a systematic literature review. expert rev vaccines. 2019 may;18(5):475–93. doi:10.1080/14760584.2019.1594781 pmid:30869552 national childhood immunisation schedule. health promotion board; 2016. available from: https://www.nir.hpb.gov.sg/nirp/eservices/immunisationschedule, accessed 4 september 2018. moh establishes national adult immunisation schedule. extends use of medisave for vaccines under the schedule. singapore: ministry of health; 2017. available from: https://www.moh.gov.sg/news-highlights/details/moh-establishes-national-adult-immunisation-schedule-extends-use-of-medisave-for-vaccines-under-the-schedule, accessed 18 september 2019. fatha n, ang lw, goh kt. changing seroprevalence of varicella zoster virus infection in a tropical city state, singapore. international journal of infectious diseases. 2014;22:73–77. chickenpox (varicella). centres for disease control and prevention; 2016. available from: https://www.cdc.gov/chickenpox/about/bam-villain-for-kids-fs.html, accessed 5 september 2018. ang lw, koh bkw, chan kp, chua lt, james l, goh kt. epidemiology and control of hand, foot and mouth disease in singapore, 2001-2007. ann acad med singapore. 2009 feb;38(2):106–12. pmid:19271036 mossong j, hens n, jit m, beutels p, auranen k, mikolajczyk r, et al. social contacts and mixing patterns relevant to the spread of infectious diseases. plos med. 2008 mar 25;5(3):e74. doi:10.1371/journal.pmed.0050074 pmid:18366252 abubakar i, gautret p, brunette gw, blumberg l, johnson d, poumerol g, et al. global perspectives for prevention of infectious diseases associated with mass gatherings. lancet infect dis. 2012 jan;12(1):66–74. doi:10.1016/s1473-3099(11)70246-8 pmid:22192131 subsidies for vaccines recommended under the national adult immunisation schedule (nais) for singaporeans and permanent residents. singapore; 2018. available from: https://www.moh.gov.sg/docs/librariesprovider5/pressroom/press-release_healthysg_annexa.pdf, accessed 16 december 2019. influenza. ministry of health; 2019. available from: https://www.healthhub.sg/a-z/diseases-and-conditions/103/topics_influenza#:~:targettext=in%20singapore%2c%20the%20flu%20season,is%20from%20may%20to%20july.&targettext=flu%20vaccines%20are%20offered%20in,cost%20between%20%2420%20to%20%2440, accessed 26 march 2020. charges & payment. ministry of health; 2019. available from: https://polyclinic.singhealth.com.sg/patient-care/charges-payment, accessed 30 november 2019. rapid increase of syphilis in tokyo: an analysis of infectious disease surveillance data from 2007 to 2016 original research yoshiyuki sugishita,a aya kayebeta,a kumiko soejimaa and mariko yauchia a infectious disease control section, health and safety division, bureau of social welfare and public health, tokyo metropolitan government. correspondence to yoshiyuki sugishita (email:yoshiyuk@gmail.com). to cite this article: sugishita y, kayebeta a, soejima k, yauchi m. long title of the article. rapid increase of syphilis in tokyo: an analysis of infectious disease surveillance data from 2007 to 2016. 2019 mar;10(1). doi:10.5365/wpsar.2017.8.2.006 abstract the objective of this study was to examine the trends of primary and secondary syphilis in tokyo between 2007 and 2016 using national infectious disease surveillance data. we analysed all 3269 cases reported during these 10 years. a statistically significant increase in cases was observed after 2010 with a more rapid rate of increase after 2014 mainly in urban areas in tokyo. the notification rates per 100 000 population in 2010, 2014 and 2016 were 0.9 (n = 113), 2.2 (n = 295) and 8.7 (n = 1190), respectively. domestic syphilis transmission was suspected in 92.6–99.3% of cases during the period 2007–2016. until 2013, the increase was mainly observed among men who have sex with men (msm); however, heterosexual transmission became more dominant and eventually surpassed transmission among msm in 2015. in 2016, the notified cases of infections through heterosexual contact were 22.3 and 40.4 times higher in men and women, respectively, compared to those in 2010. the median ages of affected heterosexual men and women were 37 (interquartile range: 28–46) and 26 (interquartile range: 22–32) years, respectively. reports of oropharyngeal lesions have been increasing among both men and women with syphilis. the number of congenital syphilis cases reported in tokyo was 0 to 3 cases per year during the study period. more information and further analysis are needed to explain the reason for this increase. introduction syphilis is a common sexually transmitted infection. in 2012, an estimated 5.6 million new syphilis infections among people aged 15 to 49 years were reported globally.1 in japan, a venereal disease prevention law passed in 1948 mandated a syphilis patient notification system. the ministry of health, labour and welfare consolidates data using the national epidemiological surveillance of infectious disease (nesid) system.2,3 although syphilis cases nationwide decreased from 216 617 in 1948 to 621 in 2010, they rebounded afterwards, reaching 4546 in 2016.2,3 methods surveillance medical institutions report cases to nesid through public health centres. in 2015, 31 public health centres and approximately 13 600 medical institutions served the 13.5 million residents of tokyo.4,5 syphilis diagnosis and treatment are widely available throughout the metropolitan area, including at community medical facilities. free and anonymous syphilis and hiv testing is also offered by most municipal public health centres and the tokyo metropolitan testing and counselling offices. physicians are required to report cases of early symptomatic (primary and secondary [p&s]) syphilis, late symptomatic syphilis, asymptomatic syphilis and congenital syphilis (cs) via facsimile to public health centres using a designated paper notification form. public health centre staff then register cases online to nesid. demographic and clinical information, date of diagnosis and epidemiological information (e.g. location of disease transmission, sexual history) are consolidated in nesid. all registered syphilis cases are verified by surveillance officers in the tokyo metropolitan infectious disease surveillance center (tmidsc), which publishes weekly surveillance reports.6 data collection we extracted cases of p&s syphilis and cs in tokyo from 1 january 2007 to 31 december 2016 from nesid. tokyo consists of 23 special wards (central), the tama area (suburban) and the islands (suburban) (fig. 1). we used nesid surveillance definitions to define early symptomatic syphilis and cs. early symptomatic syphilis was defined as an individual who tested positive in both nontreponemal and specific treponemal tests with at least one clinical sign or symptom (primary: painless chancre; secondary: painless inguinal lymphadenopathy, syphilitic roseola, papular syphilide or condyloma lata).2,3 cs was defined as a live infant with signs or symptoms of cs or a positive serological examination.2,3 fig. 1. map of tokyo (includes 23 special wards, tama area, and islands) click to download figure 1. jpg, 242kb descriptive analysis we performed descriptive analysis of early symptomatic syphilis cases considering sex, age, diagnosis date, syphilis stage, symptoms, sex of partner, suspected location of disease transmission (tokyo, other prefectures in japan, outside of japan or unknown) and location of the reporting medical facility (central or suburban tokyo). sex partner preferences were categorized as men who have sex with men (msm), men who have sex with women only (msw), men who have sex with men and women (msmw), women who have sex with men only (wsm), women who have sex with women (wsw), women who have sex with women and men (wswm) or sexual contact type unknown. the notification rate was calculated to indicate the annual number of newly diagnosed and notified cases per 100 000 population using the annual population estimates from the 2010 and 2015 census in tokyo. descriptive analysis of cs was performed considering date of diagnosis. regression analysis we focused on p&s syphilis to analyse trends in cases using a generalized linear model. we offset a poisson regression model by the estimated annual population and compared every pair of adjacent years by two-sample tests for equality of proportion. for comparison, we employed the notified cases of p&s syphilis and the estimated annual population of tokyo. all statistical analyses were done with r software version r-3.4.1 (r foundation for statistical computing, vienna, austria). a p value of <0.05 was considered statistically significant. we performed bonferroni corrections for multiple comparisons. the number of tests that compared adjacent years was nine, so the significance level for each test was set to 0.0056. ethics statement this study was exempt from ethical review committee review since the data were surveillance data conducted under the provisions of japanese law. the data collected in this study do not contain personal information. results notifications and rates overall and by sex the notification rate of p&s syphilis was 8.7 per 100 000 population (n = 1190) in 2016, 9.7 times higher compared to 0.9 (n = 113) in 2010 and a fourfold increase compared to 2.2 (n = 295) in 2014 (fig. 2). the annual notification rate for men exceeded that for women throughout the period of 2007 to 2016. both men and women had the highest notification rate in 2016, which was 13.0 (n = 875) for men and 4.6 (n = 315) for women. fig. 2. notification rates per 100 000 population of primary and secondary syphilis by sex and area, tokyo, 2007 to 2016 click to download figure 2. jpg, 268kb sources of notification reports annual notification rates from central tokyo exceeded those from the suburbs (fig. 2). in central tokyo, the notification rate was 1.1 per 100 000 population in 2007, increased to 3.0 in 2014 and climbed to 11.7 in 2016. in the tokyo suburbs from 2007 to 2012, the notification rate ranged from 0.1 to 0.2, then climbed to 2.2 by 2016. trend analysis the model shows that cases trended upward throughout the study period (p fig. 3). there was a statistically significant increase in the number of cases from 2012–2013, 2014–2015 and 2015–2016 (p fig. 3. generalized linear model fitting and comparison of adjacent years by two-sample test for equality of proportions, by use of the number of primary and secondary syphilis notifications and estimated population of the residents in tokyo click to download figure 3. jpg, 272kb suspected location of disease transmission the proportions of cases with suspected transmission within japan ranged from 92.6% to 99.3% during the study period. the proportions of domestically acquired infections stemming from tokyo ranged from 87.6% to 96.3%. disease stage a total of 1198 primary cases and 2071 secondary cases were reported from 2007 to 2016 (fig. 4). the number of primary syphilis cases had been declining; they started increasing again after 2010. the number of secondary syphilis cases has consistently increased since 2007. in 2016, the number of primary cases was 533, a 31-fold increase since 2010. the number of secondary cases was 657, a sevenfold increase during the same period. fig. 4. cases of notified syphilis by stage, tokyo, 2007 to 2016 click to download figure 4. jpg, 154kb sex of partner men who have sex with men infections among msm steadily increased from 2007 to 2016 (fig. 5). the number of cases among msm was 4.2 times higher in 2016 than in 2010. the proportion of msm cases increased annually from 2007 to 2013, peaked at 62.9% in 2013 and then decreased to 21.6% in 2016. the median age of msm during 2007–2016 was 36 (interquartile range [iqr]: 29–43) years (fig. 6a). during the period 2012–2016, the incidence of oropharyngeal lesions increased (fig. 7) and affected a greater percentage of msm with syphilis (2.7% in 2016 to 6.1% in 2014.) fig. 5. changes in the number of the notifications of primary and secondary syphilis cases by sex of partner, tokyo, 2007 to 2016 click to download figure 5. jpg, 256kb fig. 6. age distribution of primary and secondary syphilis cases among men who have sex with men, men who have sex with women only, and women who have sex with men only, tokyo, 2007 to 2016 click to download figure 6. jpg, 444kb fig. 7. changes in the number of cases with oropharyngeal lesions among primary and secondary syphilis cases by sex of partner, tokyo, 2007 to 2016 click to download figure 7. jpg, 242kb men who have sex with women only the number of cases among msw decreased from 2007 to 2010, then increased in 2014, and markedly increased during the years 2015–2016 (fig. 5). the cases among msw (n = 283) exceeded those among msm (n = 170) in 2015 and was 22.3 times higher in 2016 compared to 2010. the proportion of cases among msw was 50.9% in 2007, decreased to 15.5–21.3% from 2010 to 2013 and increased again in 2014 to 37.5% in 2016. the median age of msw during 2007–2016 was 37 (iqr: 28–46) years (fig. 6b). affected msw with oropharyngeal lesions sharply increased in 2015 and 2016 (fig. 7); the proportion was 3.5% in 2015 and 3.4% in 2016. men who have sex with men and women the notified cases in msmw were 0 to 3 cases per year in 2007 to 2015. in 2016, six cases were reported. women who have sex with men only the notified cases in wsm were stable between 2007 and 2012; however, they increased in 2013 to 2014 and markedly increased in 2015 and 2016, mirroring the trend seen in the msw population (fig. 5). there were 40.4 times more cases in 2016 compared to 2010. the proportion of wsm cases ranged from 6.2–9.9% in 2007 to 2013; it increased in 2014, reaching 23.8% in 2016. from 2007 to 2016, the median age of affected wsm was 26 (iqr: 22–32) years; in 2016, 59.7% of the affected wsm were in their 20s (fig. 6c). oropharyngeal lesions increased among wsm in 2015 and 2016 (fig. 7); the proportion was 4.1% in 2015 and 4.2% in 2016. women who have sex with women only one case of syphilis, reported in 2015, involved wsw. women who have sex with women and men two cases, reported in 2015, were in wswm. congenital syphilis twelve cases (0–3 cases per year) of cs were reported in tokyo. the number of cases was one in 2008, two in 2009, three in 2012, one in 2014, two in 2015 and three in 2016. discussion we found that p&s syphilis cases in tokyo generally increased from 2007 to 2016 and has been sharply increasing since 2015. during the period 2007–2010, an increase in infections among msm was offset by a decrease of infections among msw. as transmission among msm continued to rise, the number of cases overall increased from 2011 to 2013. cases among msw and wsm increased rapidly after 2014, resulting in a larger number of cases transmitted through heterosexual contact than among msm in 2015. we conclude that heterosexual transmission is a significant driver of the increase in syphilis cases in tokyo with a contributing increase of cases among msm. the disproportionate increase in primary-stage syphilis may be due to increased ascertainment from prompt health-care seeking and improved recognition among clinicians. however, secondary syphilis also increased sevenfold, suggesting that the increase in primary syphilis cases may be due to increased incidence. reports of oropharyngeal lesions increased among both men and women with syphilis. the proportion of those with oropharyngeal lesions did not vary considerably among msm, msw and wsm. the oral cavity can be a point of entry for syphilis, and an oropharyngeal lesion can be a source of syphilis infection.7 providers and the public should be aware that syphilis can be transmitted through oral sex. we are concerned about the increase of syphilis in young women. an increase of syphilis among women occurred in the 2010s in the united states of america that resulted in increased cs incidence.8 cs is preventable; pregnant women and their partners should be encouraged to seek appropriate prenatal care, including routine prenatal screening and treatment of syphilis. the notification rate in central tokyo exceeded that in the suburbs. one potential explanation is that there are more medical facilities with infectious disease departments in central tokyo. though the notification rate in suburban areas is low, it has increased, highlighting that syphilis is not a public health problem limited to urban areas. during the study period, trends in syphilis cases at the national level were like those in tokyo. national syphilis cases started increasing in 2011. most cases were from large metropolitan areas such as tokyo and osaka. cases among msm and heterosexual men and women increased during the years 2011–2016.2,3 syphilis has been increasing globally since the 2000s,9 including in countries neighbouring japan.10,11 global travel contributes to the spread of sexually transmitted infections; one study found that 20.4% of travellers have casual sexual contact during foreign trips.12 as the tokyo metropolitan government (tmg) is hosting the olympic and paralympic games in 2020, it is expected that more people will visit tokyo. foreign visitors may introduce or acquire syphilis in japan, potentially spreading syphilis both in japan and their home countries. limitations we used census and surveillance data collected by government departments. identifying the reasons behind the increased number of syphilis cases in tokyo is beyond the scope of this study since nesid data do not contain risk factor information. other studies outside of japan have cited increased health-care access and utilization, improved diagnostic testing or increased high-risk sexual behaviour as reasons for increasing syphilis incidence.13,14 physicians may have increased reporting in response to heightened awareness that syphilis is a notifiable disease and the availability of the syphilis case reporting form on the tmidsc website.6 not all cases of syphilis are diagnosed; patients often do not seek medical care for an initial lesion, which is painless and disappears spontaneously. since the clinical presentation is non-specific, syphilis testing may not be performed for those who do seek care. some diagnosed cases are likely never reported. also, the prevention of infectious diseases and medical care for infectious patients act has no express provision for contact tracing,15 which is necessary to detect and treat sexual contacts. the number of cs cases may also be underestimated since only live births are classified as cs. in response to the increase in syphilis cases, tmg provided clinician training sessions on testing and treatment, expanding syphilis testing opportunities, adding home address and nationality to surveillance information and updating public educational materials (including an e-learning curriculum). targeted interventions are needed to curb the rising number of syphilis cases. continued surveillance and additional analysis are needed to identify and mitigate factors causing the increase. public health strategies to prevent and treat infections in young women are imperative to preventing cs. curbing syphilis cases in tokyo depends on increased awareness and the collaborative efforts of health-care providers, educators, media, academia and the public. acknowledgements we would like to thank all the members of the surveillance staff at public health centres and all physicians who reported syphilis cases in tokyo for their contribution to syphilis surveillance. funding none of the authors have any financial ties to disclose. conflicts of interest none of the authors have any conflicts of interest to disclose. references newman l, rowley j, vander hoorn s, wijesooriya ns, unemo m, low n, et al. global estimates of the prevalence and incidence of four curable sexually transmitted infections in 2012 based on systematic review and global reporting. plos one. 2015 dec 8;10(12):e0143304. doi:10.1371/journal.pone.0143304 pmid:26646541 national institute of infectious diseases and tuberculosis and infectious diseases control division, ministry of health, labour and welfare. syphilis 2008–2014. infectious agents surveillance report. 2015 feb;36(2):17–8. takahashi t, arima y, yamagishi t, nishiki s, kanai m, ishikane m, et al. rapid increase in reports of syphilis associated with men who have sex with women and women who have sex with men, japan, 2012 to 2016. sex transm dis. 2018 mar;45(3):139–43. doi:10.1097/olq.0000000000000768 pmid:29420439 tokyo statistical yearbook: 19 medical care, sanitation, and environment: 19-1 medical facilities by district [online database]. tokyo: statistics division, bureau of general affairs, tokyo metropolitan government; 2016 (http://www.toukei.metro.tokyo.jp/tnenkan/tn-eindex.htm, accessed 26 may 2018). tokyo statistical yearbook: 2 population and households: 2-1 changes in population [online database]. tokyo: statistics division, bureau of general affairs, tokyo metropolitan government; 2015 (http://www.toukei.metro.tokyo.jp/tnenkan/tn-eindex.htm, accessed 26 may 2018). tokyo metropolitan infectious disease surveillance center [internet]. tokyo: tokyo metropolitan institute of public health; 2019 (http://idsc.tokyo-eiken.go.jp/epid_en/, accessed 6 february 2019). saini r, saini s, sharma s. oral sex, oral health and orogenital infections. j glob infect dis. 2010 jan;2(1):57–62. doi:10.4103/0974-777x.59252 pmid:20300419 bowen v, su j, torrone e, kidd s, weinstock h. increase in incidence of congenital syphilis united states, 2012-2014. mmwr morb mortal wkly rep. 2015 11 13;64(44):1241–5. doi:10.15585/mmwr.mm6444a3 pmid:26562206 abara we, hess kl, neblett fanfair r, bernstein kt, paz-bailey g. syphilis trends among men who have sex with men in the united states and western europe: a systematic review of trend studies published between 2004 and 2015. plos one. 2016 07 22;11(7):e0159309. doi:10.1371/journal.pone.0159309 pmid:27447943 tucker jd, chen xs, peeling rw. syphilis and social upheaval in china. n engl j med. 2010 may 6;362(18):1658–61. doi:10.1056/nejmp0911149 pmid:20445179 kang sh, lee jh, choi sh, lee j, yoon hs, cha sh, et al. recent change in congenital syphilis in korea: retrospective 10 year study. pediatr int. 2015 dec;57(6):1112–5. doi:10.1111/ped.12663 pmid:25916174 vivancos r, abubakar i, hunter pr. foreign travel, casual sex, and sexually transmitted infections: systematic review and meta-analysis. int j infect dis. 2010 oct;14(10):e842–51. doi:10.1016/j.ijid.2010.02.2251 pmid:20580587 savage ej, marsh k, duffell s, ison ca, zaman a, hughes g. rapid increase in gonorrhoea and syphilis diagnoses in england in 2011. euro surveill. 2012 jul 19;17(29):20224. pmid:22835469 baigalmaa j, erdenechimeg c, narantuya j, bulbul a, tugsjargal j, dolgion e, et al. increasing syphilis notifications in mongolia: results from national surveillance for 2001-2011. west pac surveill response. 2012 dec 21;3(4):86–93. doi:10.5365/wpsar.2012.3.2.008 pmid:23908947 national institute of infectious diseases, and tuberculosis and infectious diseases control division, ministry of health, labour and welfare. the national epidemiological surveillance of infectious diseases in compliance with the enforcement of the new infectious diseases control law. infectious agents surveillance report. 1999 april; 20(4). gap in measles vaccination coverage among children aged 9 months to 10 years in ho chi minh city, viet nam, 2014 original research hoang quoc cuong,a,b ho xuan nguyen,a pham van hau,a nguyen le khanh ha,a phan trong lan,a anthony mountsd and tran minh nhu nguyenc a pasteur institute, ho chi minh city, viet nam. b field epidemiology training program, ho chi minh city, viet nam. c world health organization, viet nam. d centers for disease control and prevention, viet nam correspondence to hoang quoc cuong (email: cuonghqpasteur@gmail.com). to cite this article: cuong hq, nguyen hx, hau pv, ha nlk, lan pt, mounts a, et al. gap in measles vaccination coverage among children aged 9 months to 10 years in ho chi minh city, viet nam, 2014. western pac surveill response j. 2019 dec;10(4). doi:10.5365/wpsar.2017.8.2.001 introduction: when viet nam launched the expanded programme on immunization in 1981, it covered six vaccines, including measles. subsequently, viet nam experienced a marked reduction in measles infections. a nationwide measles epidemic occurred in april 2014 and an investigation found that 86% of affected children aged 9 months to 10 years were not fully vaccinated; therefore, understanding the reasons for not vaccinating could improve vaccination coverage. method: we performed a cross-sectional study to determine vaccination coverage and reasons for non-vaccination among children aged 9 months to 10 years in six districts in ho chi minh city with the highest number of measles cases in 2014. measles vaccination status of the youngest child in each household was determined and reasons for non-vaccination were investigated. a χ2 test and multiple logistic regression were used to identify independent predictors of full vaccination. results: in total, 207 children were enrolled during the study period in 2014. full measles vaccination coverage was 55% in these households, and 73% of parents were aware of the importance of measles vaccination to protect their children. we found that the father’s education level (under high school versus high school and above) and the site where the survey was conducted were significantly associated with vaccination status. conclusion: the vaccination coverage was lower than the coverage reported by district preventive medicine centres of the seven study wards. lack of the second vaccination was a key obstacle to eliminating the vaccination gap. a catch-up mass vaccination campaign or health promotion of measles vaccination directed towards parents should be considered to improve vaccination coverage. the world health organization (who) has developed plans to eliminate measles in the western pacific region, which includes viet nam.1 however, recent measles outbreaks throughout the world, including in the united states of america, the netherlands, australia, china, the philippines, indonesia and viet nam have highlighted the challenges in achieving this goal.2–5 in may 2014, more than 3900 confirmed measles cases and 133 deaths were reported in viet nam, a large increase in cases compared to 2012 (637 cases) and 2013 (1233 cases).6–8 the ministry of health in viet nam introduced the expanded programme on immunization (epi) in 1981 with the support of who and the united nations children’s fund (unicef). epi provides immunization services through community health centres (chcs) that dedicate one or two days per month to this service. in 2009, measles vaccination was administered at the ages of 9 months and 6 years; in 2011, the second dose administration was brought forward to 18 months of age. if children miss any of the measles vaccine doses, immunization services are tasked to administer the missed dose. viet nam has conducted periodic measles vaccine campaigns targeting children aged 9 months to 10 years at chcs to address gaps in coverage among young children; however, according to the 2014 outbreak report, 82% of measles cases occurred in children under the age of 10, and 86% of the infected children were not fully vaccinated or had unknown vaccination status.9,10 the proportion of the measles cases occurred in persons known to have no previous measles vaccines was 3%. the proportion in those who had only one dose was 3%. the proportion in those with unknown vaccination status was 6% ho chi minh city (hcmc), the largest municipality in viet nam, is subdivided into 19 urban districts and five rural districts. urban districts are further divided into wards and rural districts into towns and communes. hcmc covers an area of 2061.4 km2 with a population of about 8.6 million people. with a population density of 4.2 persons per km2, there is a high risk of infectious disease transmission.11 in 2013–2014, an outbreak of measles occurred in southern viet nam; a total of 3486 cases were reported, including 1023 cases in hcmc. this outbreak started in hcmc and spread to neighbouring provinces.10 the aims of this study were to describe measles vaccination coverage among children aged from 9 months to 10 years living in hcmc and to identify individual factors associated with and reasons for non-vaccination. methods study design and sample size in june 2014, we conducted a cross-sectional study in the seven wards of hcmc with the highest number of measles cases, which were located in six different districts of hcmc (table 1). click to download table 1. jpg, 260kb the formula to calculate sample size was: n = 4 (r) (1-r) (f) (1.1)/(e2) (p) (nh).13 we planned to recruit 210 children into the study based on the estimated vaccination coverage (r = 98%) reported by the epi in viet nam, taking into account the design effect (f = 1.5f), the proportion of children under 10 years old (p = 7.5%), the average household size (nh = 4) and given α = 0.05 and 95% confidence interval.14 sampling and data collection we selected study households using a cluster sampling method described by the johns hopkins bloomberg school of public health.15 out of 259 wards with an average population of 24 000 people each (range: 10 000–61 000), the seven wards with the highest number of cases during the 2014 measles epidemic were selected. questionnaires were collected in a designated facility in each ward, followed by randomly selected door-to-door visits to 30 households in each ward. we interviewed the parents or principal caregivers of the youngest child face-to-face using a standard questionnaire describing the child’s vaccination history. vaccination status was determined by reviewing the child’s vaccination cards and through parental recall. the study excluded children who were not permanent residents of the ward. we confirmed the child’s residence status using household registration books. lastly, we retrieved the previous year’s (2013) population-level vaccination coverage in the seven study wards from the district preventive medicine centres (dpmc). data analysis and management the analysis took into account the cluster design of the study. study factors included demographic information such as age, gender, parents’ education level and employment; the number of children in each house; and the distance from the household to the closest vaccination site. we examined the relationship between study factors and vaccination status weighted by the number of children in each age group residing in each ward. vaccination coverage was categorized into three groups: no vaccination, one-dose vaccination and two-dose vaccination. we then created a variable that reflected whether a child was fully vaccinated and used it as the outcome with two levels: fully vaccinated and not fully vaccinated. fully vaccinated was defined as a child who either (1) was aged 18 months or older and had received two doses of measles vaccine or (2) was aged 9–18 months and had received one dose of measles vaccine. not fully vaccinated was defined as partial or non-vaccination, including children of any age who had either not received any measles vaccine or children aged ≥18 months old who had received only one dose of measles vaccine. the study population for the analysis also included the children ≥ 18 months of age who did not receive at least one dose of measles vaccine. a χ2 test, unadjusted and adjusted logistic regression models were computed by r statistical software (version 3.3.0, r foundation for statistical computing, vienna, austria) to explore associated factors of vaccination. the r package bma was used to conduct bayesian model averaging approach, which not only accounts for the uncertainty in variable selection by averaging over the best models but also combines estimate and prediction.16 for the multivariable analysis, variables were selected by univariate analysis of each variable using a p-value cut-off point of 0.25. variables were also selected that were previously known to be important risk factors, such as parental awareness, parents’ level of education and fear of adverse reactions. models with lower bayesian information criterion and higher posterior probability are preferred.17 odds ratio (or) and 95% confidence interval (95% ci) were used to identify the relationship between independent and dependent variables. statistical significance was set at p = 0.05 to allow for the incorporation of model uncertainty into inference. the survey was approved by the pasteur institutional review board (no: 272/pas-qđ on 20 june 2014). results of the 210 children recruited for enrollment, 207 children (98.5%) were enrolled during the study period in 2014. the youngest child in the study was 9.4 months old and the oldest was 10 years old with a median age of 38 months (interquartile range: 23 to 70 months). the proportion of males in the studied population (54.1%) was higher than females (45.9%). the majority of parents had not finished high school (58.8% for fathers, 55.7% for mothers). among the 207 children, 179 (86.5%) had lived in hcmc for at least two years. over half of the parents reported living less than 1 km away from a chc (56.6%). the proportion of the measles cases that occurred in persons known to have no previous measles vaccines and in those who had only one dose was 3%. the figure for unknown vaccination status was 5.%. measles vaccination coverage information on vaccination status was available for 190 of the 207 children (91.8%). the parents of the remaining 17 children were uncertain of their child’s vaccination history, and their child’s vaccination cards were not available. our survey found that the proportion of children with full vaccination coverage was 54.9% and those not fully vaccinated was 45.06%, weighted by the number of children in each age group. the proportion of children ≥ 18 months that did not have any measles vaccination was 14.8% (25/169). consequently, there was a large vaccination gap (45.1%), which was three times higher than the vaccination gap (17.7%) reported by dpmcs (fig. 1, table 1). click to download figure 1. jpg, 154kb epidemiological characteristics a greater proportion of those who lived less than 1 km away were fully vaccinated, but this was not statistically significant (p-value = 0.7) (table 2). click to download table 2. jpg, 539kb reasons for non-vaccination the most common reported reason for not being fully vaccinated was the lack of awareness among parents of the need for a second dose of measles vaccine (7.9%); after their children’s first dose, the parents reported thinking that the measles vaccination process was completed. other reasons cited for not completing the full vaccination course were: parents/caregivers were busy, parental reluctance to vaccinate children during illnesses such as the common cold, parental fear of adverse events after vaccination and children not being old enough to be vaccinated according to the immunization schedule (table 2). factors associated with vaccination children of fathers with less education (under high school versus high school and above) were more likely to be fully vaccinated (p table 3). click to download table 3. jpg, 181kb discussion viet nam epi requires the administration of the first dose of measles vaccine at 9 months of age and the second dose at 9 months after the first injection. the goal is to vaccinate at least 95% of eligible children aged 9–24 months across the country.18 however, an accumulation of susceptible children throughout the years, through failure to complete full vaccine courses and incidents of vaccine failure, contributed to a gap in measles immunity in hcmc. the vaccination coverage reported by the national vaccination system in surveyed wards during the same time as our study was 82.4%. the full vaccination coverage of children in our study was only 54.9%, suggesting that the national surveillance system may be overestimating vaccination coverage. to address this issue, we strongly recommend that all children’s vaccinations should be registered in the national immunization information system or a digital immunization registry.19,20 furthermore, measles vaccination should be provided for all eligible children. the survey showed that most parents took their children to receive the first dose of measles vaccine at 9 months old but only 52% returned for the second scheduled dose at 18 months, indicating an important but not statistically significant drop off from children receiving their first dose (62%) of measles vaccine to those receiving their second dose (52%). other studies have found that a lack of awareness of the need for the second vaccination was associated with low coverage in this age group. a cross-sectional study in mali showed that lack of awareness was the most common reason for non-vaccination against six diseases.21 a birth cohort of 64 000 children aged 5 years old in australia also reported that the most important reason for non-uptake of measles vaccination was lack of awareness.22 however, our study found no difference in vaccination status associated with parental awareness. we found the father’s level of education was significantly associated: children whose father had completed at least high school were less likely to be fully vaccinated compared to those whose fathers had less education. although education levels were defined differently in our study (high school degree) compared with a study in france (bachelor’s degree), the findings were similar.23 the reason for this finding has not been adequately studied, but it is possible that parents with a higher level of education may be more likely to perceive a risk of adverse side-effects or parents may have been afraid of a complete the vaccinations due to complications and high costs of vaccines.24 children who lived in districts 6 and 8 were less likely to be fully vaccinated compared to those living in district 9 and thu duc district. the difference in vaccination coverage was not significant in binh chanh and nha be districts compared to district 9 and thu duc district. parents’ educational level and population fluctuations possibly account for the difference between sites. the average population change of districts 6 and 8 was less than district 9 and thu duc district from 2012 to 2014.23 limitations of this study included the lack of vaccination histories, especially with regard to the second dose. vaccination status was based on parental recall in 8.2% of subjects, where the child’s vaccination card had been lost or health staff did not record the vaccine when it was administered. we do not have data on immigration, an important risk factor of measles transmission, so we could not take this into account when we compared vaccination coverage among communities. we do not know how many vietnamese workers, for instance those employed in industrial parks in hcmc who came from the northern regions or the mekong delta, did not register their children with the national vaccination system.26 furthermore, the study selected only the youngest child instead of all children in each household, which might lead us not to have the most representative data. conclusions we found that full vaccination coverage was 67% of the vaccination coverage reported by dpmcs of the seven study wards. while 85% percent of children over 18 months had received a first dose of vaccine, the age group from 18 months to 10 years was less likely to be fully vaccinated because parents were unaware of the second measles vaccine dose at 18 months of age. furthermore, 38% of children aged 9-18 months lacked even a first vaccination dose -a high rate of under-vaccination for this age range. this highlights the critical importance of increasing first dose coverage in children from 9-18 month, and potentially in children ≥ 18 months of age. ensuring at least one vaccination dose for children may be as important (or more) as ensuring the second vaccination dose in children over 18 months of age. lack of information on measles vaccination and other reasons such as children’s illness at immunization time and fear of adverse events contributed to the measles vaccination gap. health staff should monitor actively for children who received incomplete vaccinations and schedule the second vaccination for children who have had only one dose of measles vaccination. lack of the second vaccination dose was a key obstacle to eliminating the vaccination gap; therefore, a catch-up mass vaccination campaign should be implemented. additionally, health promotion of measles vaccination directed towards parents would likely improve vaccination coverage. acknowledgements we thank the staff in the training centre of pasteur institute, ho chi minh city, viet nam field epidemiology training program and provincial preventive medicine centres in the south of viet nam for their cooperation and advice in collecting the data. references measles elimination field guide, 2013. manila: who regional office for the western pacific; 2013. available from: http://www.wpro.who.int/immunization/documents/measles_elimination_field_guide_2013.pdf. measles is a. killer: it took 145,000 lives worldwide last year. national public radio; 2015. available from: https://www.npr.org/2015/01/30/382716075/measles-is-a-killer-it-took-145-000-lives-worldwide-last-year, accessed on 22 jul 2016. gastañaduy pa, redd sb, fiebelkorn ap, rota js, rota pa, bellini wj, et al.; division of viral disease, national center for immunization and respiratory diseases, cdc. measles united states, january 1-may 23, 2014. mmwr morb mortal wkly rep. 2014 jun 6;63(22):496–9. pmid:24898167 woudenberg t, van binnendijk rs, sanders eam, wallinga j, de melker he, ruijs wl, et al. large measles epidemic in the netherlands, may 2013 to march 2014: changing epidemiology. euro surveill. 2017 jan 19;22(3):30443. doi:10.2807/1560-7917.es.2017.22.3.30443 pmid:28128092 gibney kb, brahmi a, o’hara m, morey r, franklin l. challenges in managing a school-based measles outbreak in melbourne. queensland: australian and new zealand journal of public health; 2014. available from: https://onlinelibrary.wiley.com/doi/full/10.1111/1753-6405.12620, accessed on 19 jul 2019. elimination cp-m, viet nam. manila: who regional office for the western pacific; 2012. available from: http://www.wpro.who.int/immunization/documents/vnm_dec2012.pdf. reported measles cases and incidence rates by who member states 2013, 2014 as of 11 february 2015. geneva: world health organization; 2015. available from: https://www.who.int/immunization/monitoring_surveillance/burden/vpd/surveillance_type/active/measlesreportedcasesbycountry.pdf. urgent supports against the outbreak of measles in viet nam. tokyo: japan international cooperation agency; 2014. available from: https://www.jica.go.jp/project/english/vietnam/017/news/general/140727.html, accessed on 20 jul 2016. measles control in viet nam. manila: who regional office for the western pacific; 2014. available from: http://www.wpro.who.int/vietnam/mediacentre/features/measles_control_vietnam_2014/en/, accessed on 22 jul 2016. phan tlnv, ho vt, phan ch, vo nq, nguyen tpl, et al. epidemiological characteristics of measles outbreak in southern part, viet nam, 2013–2014. preventive medicine journals. 2014;3(152):19. statistical yearbook of vietnam. 2018. hanoi: general statistics office of vietnam; 2018. available from: https://www.gso.gov.vn/default_en.aspx?tabid=515&idmid=5&itemid=19299, accessed on 4 mar 2019. weighted average. maryland: prince george’s community college; 2010. available from: http://www.pgccphy.net/ref/weightave.pdf, accessed 28 jul 2017. guidelines for conducting community surveys on injuries and violence. geneva: world health organization; 2004. available from: https://apps.who.int/iris/handle/10665/42975. the 2009 vietnam population and housing census: completed results. hanoi: general statistics office of vietnam; 2010. available from: https://www.gso.gov.vn/default_en.aspx?tabid=515&idmid=5&itemid=10799, accessed on 19 jul 2019. methods in sample surveys: cluster sampling. maryland: johns hopkins university; 2009. available from: http://ocw.jhsph.edu/courses/statmethodsforsamplesurveys/pdfs/lecture5.pdf, accessed on 19 jul 2019. bma. an r package for bayesian model. r news; 2005. available from: https://www.r-project.org/doc/rnews/rnews_2005-2.pdf, accessed on 19 jul 2019. raftery ae. bayesian model selection in social research. sociol methodol. 1995;25:111. doi:10.2307/271063 measles-rubella vaccination rate reached over 95%. hanoi: department of preventive medicine, ministry of health; 2015. available from: http://vncdc.gov.vn/vi/tiem-vac-xin-soi-rubella-tre-1-14-tuoi/657/ty%cc%89-le%cc%a3-tiem-chu%cc%89ng-so%cc%89i-rubella-da%cc%a3t-tren, accessed on 20 jul 2016. vietnamese. health ministry launches national immunisation information system. hanoi: viet nam news; 2017. available from: https://vietnamnews.vn/society/health/373535/health-ministry-launches-national-immunisation-information-system.html#krh5rj7oxhcejws0.97, accessed on 4 mar 2019. nguyen nt, vu hm, dao sd, tran ht, nguyen txc. digital immunization registry: evidence for the impact of mhealth on enhancing the immunization system and improving immunization coverage for children under one year old in vietnam. mhealth. 2017 jul 19;3:26. pmid:28828373 koumaré aktd, traore d, haidara f, sissoko f, traoré i, dramé s, et al. evaluation of immunization coverage within the expanded program on immunization in kita circle, mali: a cross-sectional survey. bmc int health hum rights. 2009 oct 14;9(s1) suppl 1:s13. pmid:19828057 lawrence glmc, macintyre cr, hull bp, mcintyre pb. measles vaccination coverage among five-year-old children: implications for disease elimination in australia. aust n z j public health. 2003;27(4):413–8. doi:10.1111/j.1467-842x.2003.tb00419.x pmid:14705304 toure a, saadatian-elahi m, floret d, lina b, casalegno j-s, vanhems p. knowledge and risk perception of measles and factors associated with vaccination decisions in subjects consulting university affiliated public hospitals in lyon, france, after measles infection. hum vaccin immunother. 2014;10(6):1755–61. doi:10.4161/hv.28486 pmid:24637343 gowda c, schaffer se, kopec k, markel a, dempsey af. does the relative importance of mmr vaccine concerns differ by degree of parental vaccine hesitancy?: an exploratory study. hum vaccin immunother. 2013 feb;9(2):430–6. doi:10.4161/hv.22065 pmid:23032161 sanou a, simboro s, kouyaté b, dugas m, graham j, bibeau g. assessment of factors associated with complete immunization coverage in children aged 12-23 months: a cross-sectional study in nouna district, burkina faso. bmc int health hum rights. 2009 oct 14;9(s1) suppl 1:s10. pmid:19828054 seo dk, kwon y. in-migration and housing choice in ho chi minh city: toward sustainable housing development in vietnam. sustainability. 2017;9(10):1738. doi:10.3390/su9101738 integrating hiv, hepatitis b and syphilis screening and treatment through the maternal, newborn and child health platform to reach global elimination targets perspective joseph woodring,a naoko ishikawa,a mari nagai,b maya malarski,c yoshihiro takashima,a howard sobel,b and ying-ru loa a division of communicable disease, world health organization regional office for the western pacific, manila, philippines. b division of building healthy communities and populations, world health organization regional office for the western pacific, manila, philippines. c imperial college london, london, england. correspondence to joseph woodring (email:woodringj@who.int). to cite this article: woodring j, ishikawa n, nagai m, sobel h, takashima y, malarski m, et al. ntegrating hiv, hepatitis b and syphilis screening and treatment through the maternal, newborn and child health platform to reach global elimination targets. western pac surveill response j. 2017 december;8(4). doi:10.5365/wpsar.2017.8.3.005 abstract every year, an estimated 180 000 babies in the western pacific region are infected by hepatitis b, 13 000 by syphilis and 1400 by hiv through mother-to-child transmission.1 these infections can be largely prevented by antenatal screening, treatment and timely vaccination for newborns. despite challenges in controlling each disease, major achievements have been made. national immunization programmes have reduced the regional hepatitis b prevalence from over 8% in 1990 to 0.93% among children born in 2012. in addition, hiv testing and treatment have helped keep the regional prevalence of hiv infections at 0.1%. in contrast, the number of maternal syphilis cases is still high in the western pacific region, with an estimated 45 million cases in 2012. elimination of mother-to-child transmission of these infections cannot be achieved through vertically applied programming and require using and augmenting to the shared maternal, newborn and child health platform to coordinate, integrate and enable cost efficiencies for these elimination efforts. the regional framework for triple elimination of mother-to-child transmission of hiv, hepatitis b and syphilis in asia and the pacific 2018–2030 offers such a coordinated approach towards achieving the triple elimination of mother-to-child transmission of hiv, hepatitis b and syphilis and provides guidance for decision-makers, managers and health professionals working in programmes addressing maternal, newborn and child health, hiv, hepatitis, sexually transmitted infections and immunization. the regional framework for triple elimination of mother-to-child transmission of hiv, hepatitis b and syphilis in asia and the pacific 2018–20302 (triple elimination framework) was endorsed by all member states at the sixty-eighth session of the regional committee for the western pacific. it was developed to provide a coordinated approach to achieve and sustain elimination of these largely preventable infections using the shared maternal, newborn and child health (mnch) platform for planning, service delivery, monitoring and evaluation. with nearly nine out of 10 mothers and children in this region already receiving antenatal, perinatal, postnatal and well-baby care services, it is more efficient to build additional prevention services upon the shared platform than delivering them as single uncoordinated interventions solely through traditional, vertical, disease-specific control and surveillance programmes. endorsed by the world health assembly in 2016, the 2030 elimination targets for the global health sector strategy on hiv 2016–2021, the global health sector strategy on viral hepatitis 2016–2021 and the global health sector strategy on sexually transmitted infections 2016–2021 include: 0.1% or lower hepatitis b surface antigen (hbsag) prevalence among children and 50 or fewer cases per 100 000 live births for paediatric hiv infections and congenital syphilis.3-5 these three diseases have a significant burden in the western pacific region: the region alone accounts for 45% of all global hepatitis b infections;2 an increasing trend of syphilis infections is observed among key populations including women of reproductive age;6 and while hiv prevalence is low throughout the region at 0.1%, the hiv mother-to-child transmission (mtct) rate is high at 12%.7 mnch care has made significant progress in the region. from 1990 through 2015, the maternal mortality ratio decreased by 64% from 114 to 41 maternal deaths per 100 000 live births,8 in part due to the increases in antenatal care coverage and births attended by skilled birth attendants. nearly nine in 10 pregnant women in the region have attended at least one antenatal care visit and have delivered in a health facility, while provision of quality services and access to at least four antenatal visits still remain as challenges.9 dtp3 vaccine coverage for children has remained over 95% since 2009 with 97.3% coverage in 2016.10 these multiple entry points in receiving peripartum services provide a unique opportunity for coordination and integration of hiv, hepatitis b and syphilis interventions to move towards elimination of mother-to-child transmission (emtct) of these infections. the region has shown remarkable progress with national immunization programmes, reducing the regional hbsag prevalence to less than 1% among children born in 2012. not all countries met the 2012 or 2017 regional prevalence targets among 5-year-olds (less than 2% and less than 1%, respectively) or the regional 2017 milestones of 95% or higher hepatitis b birth dose and 95% or higher hepatitis b third-dose vaccine coverage.11,12 thirty countries had evidence of meeting the 2012 goal of less than 2%; as of november 2017, 18 countries have been verified as meeting the 2017 goal of less than 1%, with five additional countries having evidence of meeting this same goal. introduction of additional interventions are likely to be required to reach the 0.1% hbsag prevalence elimination target by 2030, including antenatal hbsag screening, antiviral treatment of pregnant women with high viral loads and the use of hepatitis b immunoglobulin among infants born to hbsag-positive mothers.4 modelling has shown that global elimination of hepatitis b as a major public health threat can only be achieved by scaling up hepatitis b vaccine third-dose coverage to 90% and birth-dose coverage to 80%, peripartum antivirals to 80% of hepatitis b e-antigen-positive mothers and increasing testing and treatment to 80% of those eligible.13 to meet these suggested screening and treatment targets, immunizations programmes must work with mnch and sexually transmitted infection programmes through an integrated effort to reach hepatitis b emtct. in 2014, who established the global criteria for dual emtct of hiv and syphilis that were further updated in 2017.14 several countries were already validated as having achieved elimination. in this region, emtct of hiv and syphilis has seen limited progress to date. with the target of a 90% reduction in new hiv infections among infants by 2015, actual reductions have only been 27%.2 maternal and congenital infections decreased by one-third from 2008 to 2012; however, coverage of antenatal syphilis screening and treatment remains low in several countries in the region.15 antenatal hiv and syphilis screening coverage and hepatitis b birth-dose coverage were assessed between october 2016 and june 2017 in 161 randomly selected health facilities that had introduced early essential newborn care (eenc) in cambodia, china, the lao people's democratic republic, mongolia, papua new guinea, the philippines, solomon islands and viet nam. accounting for 97% of all neonatal deaths in the region, these eight countries have been selected as priority countries since 2014 under the action plan for healthy newborn infants in the western pacific region (2014–2020).16 hepatitis b birth-dose vaccination has been promoted through eenc coaching to health workers dealing with intrapartum and postnatal care.17 fig. 1 shows that hepatitis b birth-dose coverage was higher than syphilis and hiv antenatal screening coverage in seven of eight countries, with china having 100% coverage for all three. this shows that coordination among the different programmes can improve access to essential services for both women and their babies, while lack of collaboration could result in limited access and inefficiencies. fig. 1. antenatal hiv and syphilis screening coverage and hepatitis b birth-dose coverage in eight countries in the western pacific region click to download figure 1. jpg, 309kb some countries in the region have already begun pioneering a coordinated approach to triple elimination. for example, china has an emtct strategy that integrates provision of the essential package of services for universal hiv, hepatitis b and syphilis screening where all three tests are offered concurrently and free of charge. further interventions such as hiv and syphilis treatment, including hepatitis b prophylaxis and follow-up testing and care for mothers and their children are provided for free. as a result, mtct of hiv decreased to 6.7% in 2013, and over 1200 paediatric hiv infections were averted in 2014.18 mongolia has developed national guidelines for hiv, syphilis and hepatitis b and c antenatal screening, recommending antiviral treatment of women with high viral loads and hepatitis b immunoglobulin to infants born to these mothers. these underpin the importance of coordination and collaboration among concerned programmes for better health outcomes for mother and child.1 current interventions must be scaled up substantially, other interventions introduced and coordination among programmes improved to achieve the global emtct targets.1,13 in response, the triple elimination framework proposes a vision to provide every child the greatest chance to start a healthy life free of three preventable communicable diseases. by better coordinating service delivery among programmes and including the incorporation of hepatitis b screening into existing hiv and syphilis screening at antenatal clinic, the triple elimination framework looks to integrate these programmes to enable pregnant women to know their own and their partners' infection status. it also allows pregnant mothers to understand and receive the necessary interventions for themselves and their baby during pregnancy, delivery and postnatally and to ensure that their babies receive these necessary interventions to prevent transmission of these infections (fig. 2). the triple elimination framework suggests a set of key indicators under the headings of policy, impact and programme for monitoring and evaluating emtct. this includes eventually developing global guidance that incorporates hepatitis b into who established criteria for emtct of hiv and syphilis. the triple elimination framework will also need to be supplemented by an economic analysis of the introduction of additional interventions for emtct of hepatitis b. this is particularly pertinent for countries with high hepatitis b vaccine birth-dose and third-dose coverage rates that are looking to expand their perinatal programmes. moving towards triple elimination should result in greater collaboration between programmes and thus improve accessibility, effectiveness, efficiency and sustainability of mnch services for every woman, child and their family. fig. 2. hiv, syphilis and hepatitis b screening, treatment and vaccination services offered during antenatal, delivery, postnatal care and well-child visits click to download figure 2. jpg, 629kb ethics statement the findings and conclusions in this report are those of the authors and do not necessarily represent the views of the world health organization (who) or the who regional offices. conflicts of interest none. funding all authors are employees of the who and have not received outside funds to conduct this work. acknowledgements the authors would like to acknowledge the multiple member states and experts who have critically reviewed the triple elimination framework. references provisional agenda item 12. triple elimination of mother-to-child transmission of hiv, hepatitis b and syphilis. in: sixty-eighth session of the who regional committee for the western pacific, brisbane, australia 9–13 october 2017. manila: who regional office for the western pacific; 2017 (http://www.wpro.who.int/about/regional_committee/68/documents/wpr_rc68_7_hiv_hepa_syphilis.pdf, accessed 20 december 2017). regional framework for the triple elimination of mother-to-child transmission of hiv, hepatitis b and syphilis in asia and the pacific 2018–2030 [draft]. manila: who regional office for the western pacific; 2017 (http://www.wpro.who.int/about/regional_committee/68/documents/wpr_rc68_7_annex_hiv_hepa_syphilis.pdf?ua=1, accessed 9 september 2017). global health sector strategy on hiv, 2016–2021. geneva: world health organization; 2016 (http://apps.who.int/iris/bitstream/10665/246178/1/who-hiv-2016.05-eng.pdf, accessed 9 september 2017). global health sector strategy on viral hepatitis, 2016–2021. geneva: world health organization; 2016 (http://apps.who.int/iris/bitstream/10665/246177/1/who-hiv-2016.06-eng.pdf?ua=1, accessed 9 september 2017). global health sector strategy on sexually transmitted infections, 2016–2021. geneva: world health organization; 2016 (http://apps.who.int/iris/bitstream/10665/246296/1/who-rhr-16.09-eng.pdf, accessed 9 september 2017). wijesooriya ns, rochat rw, kamb ml, turlapati p, temmerman m, broutet n, et al. global burden of maternal and congenital syphilis in 2008 and 2012: a health systems modelling study. lancet glob health. 2016 aug;4(8):e525–33. pmid:27443780 doi:10.1016/s2214-109x(16)30135-8 global aids monitoring. geneva: unaids; 2017 (http://www.unaids.org/sites/default/files/media_asset/2017-global-aids-monitoring_en.pdf, accessed 9 september 2017). trends in maternal mortality: 1990 to 2015: estimates by who, unicef, unfpa, world bank group and the united nations population division. geneva: world health organization; 2015 (http://www.who.int/reproductivehealth/publications/monitoring/maternal-mortality-2015/en/, accessed 1 november 2017). unicef data: monitoring the situation of children and women. new york: unicef; 2017 (http://data.unicef.org/topic/maternal-health/antenatal-care, accessed 31 may 2017). who/unicef joint reporting form on immunization. geneva: world health organization and new york, ny: unicef; 2017 (http://apps.who.int/immunization_monitoring/globalsummary/timeseries/tscoveragedtp3.html, accessed 31 may 2017). wiesen e, diorditsa s, li x. progress towards hepatitis b prevention through vaccination in the western pacific, 1990-2014. vaccine. 2016 05 27;34(25):2855–62. pmid:27020710 doi:10.1016/j.vaccine.2016.03.060 regional action plan for viral hepatitis in the western pacific 2016–2020. manila: who regional office for the western pacific; 2016 (http://www.wpro.who.int/hepatitis/resource/features/regional_action_plan/en/, accessed 4 september 2017). nayagam s, thursz m, sicuri e, conteh l, wiktor s, low-beer d, et al. requirements for global elimination of hepatitis b: a modelling study. lancet infect dis. 2016 dec;16(12):1399–408. pmid:27638356 doi:10.1016/s1473-3099(16)30204-3 global guidance on criteria and processes for validation. elimination of mother-to-child transmission of hiv and syphilis, second edition. geneva: world health organization; 2017 (http://www.who.int/reproductivehealth/publications/emtct-hiv-syphilis/en/, accessed 11 december 2017). unicef, who, unfpa and unaids. progress review and roadmap: elimination of parent-to-child transmission of hiv and syphilis in asia and the pacific in 2015 and beyond. bangkok: unicef east asia and pacific regional office; 2016 (http://www.wpro.who.int/hiv/documents/topics/pmtct/20160920-eptct-progress-report/en/, accessed 2 february 2017). action plan for healthy newborn infants in the western pacific region (2014–2020). manila: who regional office for the western pacific; 2014 (http://www.wpro.who.int/child_adolescent_health/documents/regional_action_plan_newborn/en/, accessed 1 november 2017. early essential newborn care: clinical practice pocket guide. manila: who regional office for the western pacific; 2014 (http://iris.wpro.who.int/handle/10665.1/10798, accessed 1 november 2017). wang al, qiao yp, wang lh, fang lw, wang f, jin x, et al. integrated prevention of mother-to-child transmission for human immunodeficiency virus, syphilis and hepatitis b virus in china. bull world health organ. 2015 jan 1;93(1):52–6. pmid:25558108 doi:10.2471/blt.14.139626 analysing the characteristics of a measles outbreak in houaphanh province to guide measles elimination in the lao people's democratic republic original research bounthanom sengkeopraseuth,a,b bouaphanh khamphaphongphane,b phengta vongphrachanh,b anonh xeuatvongsa,c sisouveth norasingh,c chansay pathammvong,c manilay phengxay,d phanmanisone philakongd and siddhartha sankar dattad a lao people's democratic republic field epidemiology training programme. b national center for laboratory and epidemiology, lao people's democratic republic. c national immunization programme, lao people's democratic republic. d world health organization, lao people's democratic republic. correspondence to siddhartha sankar datta (email:dattas@who.int). to cite this article: sengkeopraseuth b, khamphaphongphane b, vongphrachanh p, xeuatvongsa a, norasingh s, pathammvong c, et al. analysing the characteristics of a measles outbreak in houaphanh province to guide measles elimination in the lao people's democratic republic. western pac surveill response j. 2018 jul;9(3). doi:10.5365/wpsar.2017.8.1.012 abstract introduction: in recent years, the incidence of measles has declined in the lao people's democratic republic. however, an outbreak was reported in august 2014 in houaphanh province, which was the biggest outbreak in the country since 2008. we describe the characteristics of this outbreak and outline critical interventions for the lao people's democratic republic to achieve measles elimination. methods: fever and rash cases in the khouan and samtai districts with an onset date from 1 september to 25 october 2014 were investigated. active case finding and health facility record reviews were carried out. appropriate samples from the individuals with suspected measles were tested to confirm the diagnosis. results: a total of 265 suspected cases including 12 deaths were reported from eight villages in the khouan and samtai districts. forty-five individuals tested positive for measles igm. most of the confirmed patients were male (n = 28, 62%), less than 5 years old (n = 23, 51%) and from the hmong ethnic community (n = 44, 98%). the majority of the people with suspected measles (n = 213, 80%) and all the confirmed ones were unvaccinated. a measles vaccination campaign conducted in the eight affected villages resulted in 76% coverage of the targeted population. discussion: low routine coverage and measles occurrence among unvaccinated individuals indicate underimmunized areas. the geographical and sociodemographic characteristics of this outbreak highlight the need for tailored vaccination strategies to close the immunity gap. a sensitive surveillance system that is able to detect, notify, investigate and guide response measures, including a second measles dose in the routine immunization schedule, will be essential for the lao people's democratic republic to attain its measles elimination status. introduction measles is a highly contagious disease caused by measles virus (genus morbillivirus, family paramyxoviridae) and remains one of the most contagious diseases of humans.1 measles is characterized by rash, fever and cough, coryza or conjunctivitis and is usually transmitted from four days before to four days after the onset of rash.1 the incubation period is normally 10–14 days and complications include otitis media, laryngotracheobronchitis, pneumonia, diarrhoea, encephalitis and secondary bacterial infections.1 since 1974, the use of safe and cost-effective measles vaccines has resulted in a marked decrease in measles cases and deaths. globally, measles-related deaths have declined from about 548 300 in 2000 to an estimated 114 900 in 2014.2,3 the reduction in measles deaths is a testament to the importance of measles vaccination to global health. however, globally, measles still remains one of the leading causes of death among children under 5 years of age, especially in countries with limited health infrastructure.4-6 both the global vaccine action plan endorsed by the world health assembly in 2012 and the global measles and rubella strategic plan 2012–2020 include elimination of measles, rubella and congenital rubella syndrome as one of the main objectives.7,8 all world health organization (who) regions have established goals to eliminate measles by 2020.3 in 2005, the who regional committee for the western pacific resolved that the region should aim to eliminate measles by 2012. elimination is defined as the absence of endemic measles virus transmission in a defined geographical area more than 12 months in the presence of a well performing surveillance system.9 in 2012, the regional committee reaffirmed its commitment to eliminate measles.10 the number of measles cases in the region has decreased from 54 291 in 2009 to 8524 in 2012, and measles incidence decreased by 83% during the same period.11 the national policy in the lao people's democratic republic is to provide one dose of measles vaccine to all children at 9 months of age. since 2011, a combination measles-rubella vaccine has been used to provide additional rubella protection for the children.12 since 2000, the lao people's democratic republic has been providing a second opportunity for measles vaccination to children through periodic supplementary immunization activities (sias).13 despite reduction in measles incidence since the start of the measles immunization in 1979,14 several sporadic and widespread measles outbreaks have been reported in the lao people's democratic republic. a measles outbreak was reported in august 2014 in houaphanh province. the outbreak in houaphanh province outlined the challenges that lay ahead for the country towards achieving measles elimination. we describe the characteristics of the outbreak with the aim of identifying critical interventions for the lao people's democratic republic to attain the measles elimination status. methods the who-accredited national center for laboratory and epidemiology (ncle) has been receiving weekly reports of measles cases from all provinces in the lao people's democratic republic since 1994.14 on 19 september 2014, khouan district health office received reports of fever, cases of rash and red eyes from khorhai village, khouan district, houaphanh province. the patients were treated at the khouan and samtai district hospitals. on 24 september 2014, the district health office reported the event to the houaphanh provincial health office, which subsequently reported the cases to ncle. rapid response teams conducted investigations of the suspected cases in khorhai and neighbouring villages within two days of the notification; the suspected patients attending hospitals were investigated by the physicians. active case finding through house-to-house visits was conducted in all the affected villages to identify and investigate the suspected cases and ensure initial treatment and referral of patients with measles, as needed, to prevent any deaths. the medical records were reviewed at the provincial and district hospitals including the health centres serving the affected geographical areas for a period of nine months preceding the outbreak to identify any missed cases. the standardized case investigation form and line list routinely used by ncle to record any infectious disease outbreak was adapted to record the information of these fever and rash cases. the data captured in the line list included the characteristics of each of the suspected cases (which conformed to the measles surveillance case definition) such as age, sex, ethnicity, geographical location, date, type and pattern of rash onset, symptoms, travel history, history of contact with individuals with confirmed measles, outcome of the infection and immunization status. the identified fever and rash cases were classified according to the who standard case definition for measles and rubella.15 a suspected measles case is defined as any person with fever and maculopapular rash (non-vesicular) and cough, coryza or conjunctivitis or any person in whom a clinician suspects measles infection. a laboratory-confirmed measles case is one that meets the above case definition and the presence of measles-specific igm antibodies is confirmed in a who-accredited laboratory. the vaccination status was reported either by the patient, caregiver or parents present at the time of the investigation. the childhood vaccination card when available was checked to ascertain the reported vaccination status of the cases. serum samples could not be collected from the suspected cases detected retrospectively during the active case finding or from those who were not in the appropriate time frame for sample collection. to ensure the reliability of the laboratory tests performed to confirm the diagnosis of measles, the optimal time frame of between 7–28 days from the date of rash onset for specimen collection was ensured by the investigation team during the collection of the serum samples.16 who recommends that a single serum sample be obtained from suspected measles cases at the first contact with the health-care system within 28 days after rash onset for adequate measles surveillance; igm elisa detection is most sensitive 4–28 days after the rash onset.17 the serum samples were sent to ncle for measles and rubella igm testing using elisa (enzygnost® kits, siemens, erlangen, germany). viral genotyping was carried out at the public health laboratory centre, department of health, hong kong sar (china). affected districts reported all suspected cases to ncle daily for a 14-day period from 26 september to 10 october 2014. results geographical distribution of cases over a period of eight weeks, 265 suspected cases including 12 deaths (case fatality rate: 4.5%) were reported from four adjoining villages in the khouan and samtai districts in houaphanh province. of the 265 suspected cases, 45 were laboratory-confirmed. all deaths resulted from pneumonia, and all case-patients had fever and rash. most of the confirmed cases (n = 34, 76%) and the deaths (n = 9, 75%) were reported from khouan district. most of the confirmed cases were reported from khorhai (n = 15, 33%) and houiybeuy (n = 11, 24%) villages in the khouan district, while the rest of the cases were located in six different villages in both districts. the cases that were suspected but not confirmed (n = 214) were reported mainly from khorhai village, khouan district (n = 94, 44%), while the rest of the 51 cases were located in 16 different villages of both districts. the majority of the suspected case-patients in khouan district belonged to the hmong ethnic community (n = 211, 80%). all suspected case-patients had fever and rash, 54% (n = 143) had cough and 41% (n = 109) had runny noses at the time of investigation. characteristics of confirmed cases most of the 45 people with confirmed measles were male (n = 28, 62%), ranging from 6 months to 18 years of age. the median age of patients with confirmed measles was 5 years. the highest proportion of the confirmed patients (n = 23, 51%) were less than 5 years of age followed by those 5–9 years old (n = 17, 38%). similar age characteristics were also noticed among the suspected case-patients. all infants less than 1 year old with confirmed measles were less than 9 months old. the majority (n = 44, 98%) of people with confirmed measles were from the hmong ethnic community, and only one patient (n = 1, 2%) was reported from the laolum ethnic community. all four confirmed patients from hinteng village in the khouan district and phanhsavanh village in samtai district had travelled to khorhai village of the khouan district, which reported the highest number of confirmed cases. the epidemiological curve of the outbreak shows a classical pattern of a propagated source of person-to-person transmission (fig. 1). fig. 1. epidemiological curve of measles cases during the outbreak investigation, houaphanh province, lao people's democratic republic, 1 september–25 october 2014 click to download figure 1. jpg, 347kb clinical characteristics of confirmed cases all patients with confirmed measles reported fever and rash. the rashes were identified as maculopapular in 87% (n = 39) of the confirmed patients. the other symptoms reported by the confirmed patients were cough (n = 36, 80%), conjunctivitis (n = 36, 80%), runny nose (n = 29, 64%) and diarrhoea (n = 10, 22%). of the 30 confirmed case-patients who were hospitalized, 29 were admitted to the district hospitals. most (90%) of the hospitalized patients (both suspected and confirmed patients) were less than 10 years of age. six (20%) of these hospitalized patients developed pneumonia. there were no reported cases of encephalitis. vaccination status none of the confirmed patients and only one (0.5%) of the suspected case-patients had received any dose of measles-containing vaccine by the time of the investigation. the characteristics of the suspected and confirmed patients are shown in table 1. table 1. characteristics of measles patients, houaphanh province, lao people's democratic republic, 2014 click to download table 1. jpg, 341kb laboratory diagnosis serum samples were collected from 51 (19%) of the 265 patients with suspected measles; in addition, nasopharyngeal swabs were collected from only nine suspected patients (3%). forty-five patients (88%) tested positive by elisa for measles-specific igm antibodies; the test results in the remaining six patients were equivocal. all but one sample tested negative for rubella-specific igm antibodies. the genotype of the detected measles virus identified in this outbreak was h1. vaccination response in the area the immunization programme units of the samtai and khouan districts carried out outbreak response immunizations targeting individuals between 9 months and 20 years following detection of the confirmed cases. approximately 19 600 children, irrespective of their previous vaccination status, were vaccinated with one dose of measles-rubella vaccine, achieving an overall 76% coverage in the targeted villages with samtai district achieving higher coverage (84%) than the khouan district (63%). discussion the suboptimal vaccination status of the confirmed measles cases in the affected areas indicates pockets of underimmunized populations in the lao people's democratic republic. since the lao people's democratic republic has adopted the goal of measles elimination as part of a 2005 who regional committee resolution,9 the population immunity needs to be sustained above 95% in all districts of the country to prevent measles epidemics.1 measles epidemics have been reported in communities with low vaccination coverage.18 the coverage of the first dose of measles-rubella vaccine in khorhai in 2013 was around 50% [reports from national immunization programme, unpublished data]. the vaccination coverage for the previous years in khorhai and in other affected villages could not be assessed as the monthly vaccination records could not be retrieved from the health centres. the administrative coverage of the first dose of measles-containing vaccine (mcv1) of samtai district was 45%, 49% and 24% for 2011, 2012 and 2013, respectively, while the mcv1 coverage of khouan district was 52% for 2013 [reports from national immunization programme, unpublished data]. khouan is a newly created administrative district and hence the vaccination coverages for the years 2011 and 2012 are not available. the reported administrative mcv1 coverage of the houaphanh province was around 59% in 2011, 2012 and 2013 [reports from national immunization programme, unpublished data], while the reported coverage for the national level was 69%, 72% and 82% for the corresponding years.19 because mcv1 in the lao people's democratic republic is provided at 9 months of age, the country should consider adding a routine second dose of measles-containing vaccine at age 15–18 months to reduce the rate of accumulation of susceptible children and risk of a future outbreak.1 countries aiming for measles elimination should achieve and maintain greater than 95% coverage with two doses in every district of the country.1 because of the delay in reporting by the health centre, almost three weeks after the occurrence of the first case, and the fact that only 19% of the suspected cases had a serum sample, the results of our outbreak investigation may not truly estimate the actual burden of measles in this area. houaphanh province is located in the eastern part of the lao people's democratic republic. it has eight administrative districts and is one of the poorest provinces with a total population of around 310 000.20 the terrain is rugged with dense, mountainous forest forming much of the land mass. the affected villages, including khorhai village, are situated around 15 km and 30 km from the nearest health centre and the district headquarters, respectively. all eight affected villages are primarily mountainous and have poor road conditions; more than half of the roads are inaccessible during the rainy season, making it difficult for the local health centres to deliver routine vaccination services. these geographic difficulties also make it difficult for these villagers to access the health-care services in the nearest health centres. countries with weaker health infrastructure or areas within the countries with moderate or weak functioning health system have used sias to deliver measles vaccine to children who were missed by routine vaccination or who are outside the health system. sias have been used in the lao people's democratic republic since 2011.13 the effectiveness of sias in reaching the vulnerable population in the lao people's democratic republic should be evaluated. studies have shown that in situations with low routine immunization coverage, measles vaccination through supplemental immunization using outreach activities helps reduces the accumulation of susceptible people and is cost effective.21,22 the risk of measles outbreaks is determined by the rate of accumulation of the susceptible population;1 thus, the national immunization programme of the lao people's democratic republic should routinely analyse the available coverage data and immunity gap to monitor the accumulation of susceptible people and plan follow-up sias. ninety-eight per cent of the patients with measles were reported from the hmong community, illustrating that an immunity gap exists in this group. the high case fatality seen in this outbreak is comparable to the fatality rate seen in the past outbreaks.14 the national measles vaccination coverage in the lao people's democratic republic social indicator survey 2011–12 was 55.3% with a wide disparity of vaccination coverage between the ethnic communities, ranging from 35.3% in the hmong-mien community to 72.7% in the lao people's democratic republic-tai community.23 data about vaccination coverage in ethnic groups are not routinely collected by the immunization programme and are available only from periodic national coverage surveys. the outbreak has primarily affected unvaccinated children less than 5 years old who should have received their vaccination doses during routine immunization or during the periodic sias conducted in the lao people's democratic republic. a wide-age-range (9 months to 19 years) measles-rubella sia was conducted in the lao people's democratic republic in 2011,23 but this outbreak indicates that these cases had missed both the routine and sia doses. a similar pattern of age-group affected, rate of pneumonia and low vaccination status was observed during a measles outbreak in a district of balochistan province of pakistan where the affected population had difficulties in accessing health facilities and had poor routine vaccination coverage.25 the h1 genotype identified in this outbreak was also detected in the lao people's democratic republic in 2011–2012 and has been the predominant genotype detected in china between 2009 and 2012.11,26 there were several limitations to the investigation of this outbreak. the health-seeking behaviour of the community and their knowledge about measles were not assessed to understand the reasons of low routine coverage in the affected villages. the reported vaccination status of the cases were not verified with the immunization registers at the health centres, and thus recall biases would be inevitable. the existing system of passive notification of measles cases could still be useful for decision-making if the information were promptly shared with the district and provincial levels by the reporting health facilities.27 the delay in timely reporting resulted in the health system taking 41 days to conduct any sias after the detection of the suspected cases in the community. while who recommends the use of serum-based igm elisa assays to confirm clinically suspected measles/rubella,1,15,23 there is an inherent limitation in using igm elisa for confirmation of measles when the serum samples are collected within four days of rash onset. however, this may not have been relevant in an outbreak setting as individual diagnosis is not critical.17 in this outbreak, 22% of the serum samples were collected within four days of rash onset; however, all samples tested either positive or equivocal for measles igm by elisa. the sample collection for measles diagnosis should be further improved by collecting urine or nasopharyngeal samples to confirm the outbreaks and document measles elimination by virus genotyping.17,28 lastly, the line list prepared in this outbreak did not indicate the method of case detection; hence, the differentiation of the cases identified during active case finding or in routine surveillance was not possible. this outbreak in houaphanh province was the biggest measles outbreak in the lao people's democratic republic since 2008. the outbreak highlights the vulnerability of the ethnic and other geographically dispersed communities in the country to any vaccine-preventable diseases. to achieve measles elimination, the national immunization programme should consider investing in ways to identify and target high-risk populations and use community-specific strategies to close immunity gaps. this includes regular outreach activities and the introduction of a second dose of measles vaccine in the national immunization schedule. in order to achieve elimination, it is crucial that a sensitive surveillance system that can detect, notify and ensure timely investigation of suspected cases, classify them as confirmed or discarded and guide appropriate response measures to prevent further transmission in the lao people's democratic republic. conflicts of interest none declared. funding none. acknowledgements the authors thank the surveillance and immunization staff of samtai and khouan districts and houaphanh province for providing the epidemiological, surveillance and vaccination data. the authors thank the laboratory staff of ncle and hong kong sar (china) reference laboratory for providing the laboratory surveillance data. the authors would like to express their special gratitude to the late aieng thong from the houaphanh provincial health office for his generous support during the measles outbreak. references world health organization. measles vaccines: who position paper – april 2017. wkly epidemiol rec. 2017 04 28;92(17):205–27. pmid:28459148 world health organization. progress in global control and regional elimination of measles, 2000–2011. wkly epidemiol rec. 2013 jan 18;88(3):29–36. pmid:23393700 measles fact sheet. geneva: world health organization, 2016 (http://www.who.int/mediacentre/factsheets/fs286/en/, accessed march 2017). moss wj, griffin de. measles. lancet. 2012 jan 14;379(9811):153–64. doi:10.1016/s0140-6736(10)62352-5 pmid:21855993 atkinson wl. epidemiology and prevention of measles. dermatol clin. 1995 jul;13(3):553–9. pmid:7554503 perry rt, halsey na. the clinical significance of measles: a review. j infect dis. 2004 may 1;189(s1) suppl 1:s4–16. doi:10.1086/377712 pmid:15106083 global vaccine action plan. geneva: world health organization; 2012 (http://apps.who.int/iris/bitstream/10665/78141/1/9789241504980_eng.pdf?ua=1). global measles and rubella strategic plan: 2012–2020. geneva: world health organization; 2012 (http://apps.who.int/iris/bitstream/10665/44855/1/9789241503396_eng.pdf). world health organization, regional committee for the western pacific. resolution wpr/rc56.r8: measles elimination, hepatitis b control, and poliomyelitis eradication. manila: who regional office for the western pacific; 2005 (http://www2.wpro.who.int/rcm/en/archives/rc56/rc_resolutions/wpr_rc56_r08.htm). world health organization, regional committee for the western pacific. resolution wpr/rc63.5: elimination of measles and acceleration of rubella control. manila: who regional office for the western pacific; 2012 (http://www.wpro.who.int/about/regional_committee/63/resolutions/wpr_rc63_r5_measles_elimination_03oct.pdf). world health organization. progress towards measles elimination in the western pacific region, 2009–2012. wkly epidemiol rec. 2013 jun 7;88(23):233–40. pmid:23757799 at a glance: lao people's democratic republic, lao pdr takes a swipe at measles and rubella. new york: united nations international children's emergency fund; 2016 (https://www.unicef.org/health/laopdr_60910.html). mayxay m, khomthilat t, souvannasing p, phounesavath k, vorasane b, keomany s, et al. factors associated with a measles outbreak in children admitted at mahosot hospital, vientiane, laos. bmc public health. 2007 08 4;7:193. doi:10.1186/1471-2458-7-193 pmid:17683576 kuroiwa c, vongphrachanh p, xayyavong p, southalack k, hashizume m, nakamura s. measles epidemiology and outbreak investigation using igm test in laos. j epidemiol. 2001 nov;11(6):255–62. doi:10.2188/jea.11.255 pmid:11769943 who-recommended standards for surveillance of selected vaccine-preventable diseases. geneva: world health organization; 2003 (http://apps.who.int/iris/bitstream/10665/68334/1/who_v-b_03.01_eng.pdf?ua=1). mokhtari-azad t, naseri m, yavari p, gooya mm, esteghamati a, hamkar r. optimal timing of specimen collection after rash onset for diagnosis of measles igm antibody. arch razi inst. 2005;60(1):1–10. manual for the laboratory diagnosis of measles and rubella infection. who/ivb/07.01, geneva: world health organization; 2007 (http://www.who.int/ihr/elibrary/manual_diagn_lab_mea_rub_en.pdf). who guidelines for epidemic preparedness and response to measles outbreaks. geneva: world health organization; 1999 (http://www.who.int/csr/resources/publications/measles/whocdscsrisr991.pdf?ua=1). immunization coverage, who/unicef joint reporting process. geneva: world health organization; 2016 (http://apps.who.int/immunization_monitoring/globalsummary/timeseries/tswucoveragemcv1.html, accessed 5 january 2017). lao people's democratic republic, national immunization programme, 2015, provincial and district population 2014-2015. unpublished raw data. dayan gh, cairns l, sangrujee n, mtonga a, nguyen v, strebel p. cost-effectiveness of three different vaccination strategies against measles in zambian children. vaccine. 2004 jan 2;22(3-4):475–84. doi:10.1016/j.vaccine.2003.07.007 pmid:14670330 vijayaraghavan m, lievano f, cairns l, wolfson l, nandy r, ansari a, et al. economic evaluation of measles catch-up and follow-up campaigns in afghanistan in 2002 and 2003. disasters. 2006 jun;30(2):256–69. doi:10.1111/j.0361-3666.2006.00318.x pmid:16689921 lao social indicator survey (lsis) 2011–12. vientiane: ministry of health and lao statistics bureau; 2012 (https://dhsprogram.com/pubs/pdf/fr268/fr268.pdf, accessed 5 january 2017). who/unicef joint annual measles and rubella report 2011. measles rubella initiative; 2013 (http://www.measlesrubellainitiative.org/wp-content/uploads/2013/06/mri-2011-annual-report.pdf). saeed a, butt za, malik t. investigation of measles outbreak in a district of balochistan province, pakistan. j ayub med coll abbottabad. 2015 oct-dec;27(4):900–3. pmid:27004349 country profile–measles elimination, lao people's democratic republic. manila: who regional office for the western pacific; 2016 (http://www.wpro.who.int/immunization/documents/measles_country_profile_may2016_lao.pdf). disease surveillance and burden, national passive surveillance. geneva: world health organization; 2017 (http://www.who.int/immunization/monitoring_surveillance/burden/vpd/surveillance_type/passive/en/, accessed 10 august 2017). bellini wj, helfand rf. the challenges and strategies for laboratory diagnosis of measles in an international setting. j infect dis. 2003 may 15;187(s1) suppl 1:s283–90. doi:10.1086/368040 pmid:12721927 diarrhoeal disease surveillance in papua new guinea: findings and challenges surveillance report mohammad yazid abdad,a,b,d kevin w soli,a,d bang pham,a grace bande,a tobias maure,a marinjo jonduo,a debbie kisa,a glennis rai,a suparat phuanukoonnon,a peter m siba,a paul f horwood,a,e* and andrew r greenhilla,f* a papua new guinea institute of medical research, goroka, papua new guinea. b national centre for infectious diseases, singapore. c institute of infectious diseases and epidemiology, tan tock seng hospital, singapore. d united states centers for disease control and prevention, port moresby, papua new guinea. e college of public health, medical and veterinary sciences, james cook university, townsville, australia. f school of health and life sciences, federation university australia, victoria, australia. * corresponding author correspondence to andrew greenhill (email: andrew.greenhill@federation.edu.au) and paul horwood (email: paul.horwood@jcu.edu.au). to cite this article: abdad my, soli kw, pham b, bande g, maure t, jonduo m, et al. diarrhoeal disease surveillance in papua new guinea: findings and challenges. western pac surveill response j. 2020 mar;11(1). doi:10.5365/wpsar.2018.9.2.006 diarrhoeal diseases are among the leading causes of morbidity and mortality in the western pacific region. however, data on the major causes of infectious diarrhoea are limited in many countries within the region, including papua new guinea. in 2013–2014, we conducted surveillance for acute diarrhoeal illness in four provinces in papua new guinea. one rural health clinic from each province participated in the surveillance activity. samples were sent to central laboratories and batch analysed for bacterial and viral gastrointestinal pathogens that are commonly associated with diarrhoea. across the four sites, the most commonly detected pathogens were shigella spp., campylobacter spp. and rotavirus. in this paper, we report the results of the surveillance activity and the challenges that we faced. the lessons learnt may be applicable to other parts of the region with a similar socioeconomic status. diarrhoeal diseases are among the leading causes of morbidity and mortality globally. they are the sixth greatest contributor to disability-adjusted life years across all age groups. however, the burden of diarrhoea is most significant in children, particularly under the age of 5 years. for individuals aged one month to 5 years, diarrhoea is the second leading cause of disability-adjusted life years.1 diseases related to unsafe water, poor sanitation and lack of hygiene are some of the most common causes of disease outbreaks and death among the poor in developing countries. in papua new guinea, it is estimated that only 40% of people have access to improved water supply and less than 20% have access to adequate sanitation,2 one of the lowest rates in the world. consequently, enteric infectious diseases remain a serious health concern as one of the major causes of hospitalization and death in the country.3 despite this, little is known about the etiology of diarrhoea in papua new guinea because of a lack of laboratory facilities and human resources to support the necessary microbiologic analysis. an overview of the current knowledge can be accessed in an editorial3 and a review4 published in 2013. identification of pathogens is essential for improved clinical management and effective prevention strategies. when we began surveillance in 2013, there was no monitoring of the etiology of diarrhoeal disease in papua new guinea. we established diarrhoeal disease surveillance for acute diarrhoeal illness at four health clinics in different regions of papua new guinea. the etiology of diarrhoeal illness and the challenges of establishing and maintaining ongoing disease surveillance in papua new guinea are discussed. methods site selection surveillance sites were established in four of the 22 provinces of papua new guinea, with each province represented by one rural health clinic. the surveillance locations were malanda clinic, hela province; asaro, eastern highlands province; karkar island, madang province; and papa, central province (fig. 1). the four surveillance sites were selected to be representative of the country. papua new guinea has a dispersed population, with over 70% of the population living in rural and regional areas. thus, the four selected sites were non-urban, though two sites (papa and asaro) were readily accessible to major urban areas (port moresby and goroka, respectively). the surveillance was conducted as part of a public–private partnership between a government-funded medical research institute and a private enterprise, with the intention to conduct demographic surveillance over 4 years. thus, some requests of the industry sponsor of this study were considered, including setting up surveillance in or near areas of industry activity (malanda clinic and papa sites). patient samples were collected in 2013 and 2014. click to download figure 1. jpg, 232kb case definition we used the world health organization’s case definition for diarrhoea – the passing of three or more loose or watery stools in a 24-hour period.5 we did not actively exclude people with chronic diarrhoea. data were collected at the clinics using a specially designed case reporting form that included socio-demographic variables in addition to general clinical findings. participants patients who presented to one of the participating health clinics with a diarrhoeal illness fitting the case definition were asked to provide a self-collected stool sample. a study nurse verbally described the implications, objectives and rationale of the surveillance activity to each potential participant. the study nurse also provided instructions on specimen collection that aimed to ensure personal hygiene for patients and sample integrity. participation in the surveillance activity was voluntary, and verbal consent was obtained. logistical constraints in the storage and transport of samples in this resource-limited setting necessitated batch testing of samples. consequently, clinically relevant results could not be provided to the clinic or the patient. sample processing and laboratory analysis samples were stored at 4 °c for less than 24 hours prior to their transport to the papua new guinea institute of medical research laboratories (fig. 1), where they were aliquoted and stored at –80 °c until analysis. nucleic acids were extracted from stool samples using the qiaamp dna stool mini kit (qiagen, hilden, germany) and eluates were stored at –80 °c until batch testing. molecular analysis using real-time polymerase chain reaction was conducted for a wide range of enteric pathogens. the bacterial pathogens targeted were shigella spp., salmonella spp., vibrio cholerae (species level [hyla] and toxigenic strains [ctxa]), and campylobacter spp. several viral pathogens, including rotavirus, adenovirus 40/41, norovirus gi, norovirus gii, sapovirus and astrovirus, were also targeted. detection methods were based on those previously described.6 ethics statement this study was conducted as part of the partnership in health programme. the programme was approved by the papua new guinea medical research advisory committee (mrac no. 10.17). results this surveillance was embedded in a broader demographic and health surveillance programme.7 the total numbers of surveillance participants and diarrhoeal cases are provided in table 1. the etiological agent of diarrhoea was investigated for 118 patients presenting to the participating clinics with diarrhoea (table 2). the median age of patients presenting with diarrhoea was 19.8 months, with an age range of 1 month to 69 years (n = 81 patients with age data). males represented 63.6% of the patients who presented with acute diarrhoea (n = 99 patients with sex data). an enteric pathogen was detected in 85.6% (n = 101) of the samples tested. shigella spp. (38.1%), campylobacter spp. (33.1%), rotavirus (20.3%) and norovirus genogroup gii (12.7%) were the pathogens most commonly detected. all other pathogens were detected at varying rates below 10%, including sapovirus (8.5%), adenovirus (5.9%), astrovirus (2.5%), norovirus genogroup gi (1.7%), salmonella spp. (1.7%) and v. cholerae (1.7%). the two v. cholerae–positive samples were further investigated to determine if they were toxigenic strains, but both faecal samples were negative for the ctxa gene. mixed infections were detected in 31.4% (n = 37) of diarrhoeal cases, including seven patients concurrently infected with three pathogens and two patients with four pathogens. click to download table 1. jpg, 221kb click to download table 2. jpg, 236kb discussion papua new guinea is a tropical, developing country. it is prone to infectious disease outbreaks, as demonstrated by the maiden (and thus far only) outbreak of cholera in 2009–2011, which was the result of a single incursion.8,9 the capacity for conducting outbreak investigations in papua new guinea is currently low.10 notwithstanding the need for increased laboratory capacity to rapidly confirm the etiology of outbreaks, there is also a distinct lack of baseline data on endemic disease in papua new guinea. diarrhoeal illnesses can be caused by a wide range of viral, bacterial and protozoan infections, and it is difficult to ascertain the etiological agent based on clinical characteristics. the lack of knowledge of the epidemiology of diarrhoeal disease in papua new guinea negatively impacts the development and implementation of targeted control strategies. in this study, shigella spp., campylobacter spp. and rotaviruses were the leading causes of diarrhoea at all four sites where samples were collected. these results are mostly consistent with previous investigations of the etiology of diarrhoea in papua new guinea. soli et al.6 detected shigella (26.6%) and rotavirus (25.6%) as the leading causes of acute watery diarrhoea in hospitalized paediatric patients from the eastern highlands region of papua new guinea. similarly, in a case-control study conducted approximately 30 years before our recent surveillance in the eastern highlands region, howard et al.11 detected rotavirus, shigella spp. and campylobacter spp. in 23%, 13% and 12% of cases, respectively. additional studies have highlighted the importance of shigella spp. in papua new guinea as the cause of an outbreak in a displaced population12 and as a contributor to diarrhoea in both adults and children.13 one of the shortcomings in our understanding of infectious diseases in papua new guinea is our limited knowledge of the geographical distribution of many infectious agents. through this surveillance, we gained insights into the etiology of diarrhoeal disease in geographically distinct locations in papua new guinea. to our knowledge, this is the first time that surveillance data containing diarrhoeal etiology have been collected concurrently from multiple geographical locations in papua new guinea. despite the small sample sizes, our surveillance data provide preliminary evidence that pathogens such as shigella spp., campylobacter spp. and rotavirus may be significant contributors to gastrointestinal illness throughout the country. the corroboration of our data with previously obtained data strengthens our understanding of the major gastrointestinal pathogens associated with diarrhoea in papua new guinea. our surveillance system had several limitations. as with most infectious disease surveillance systems, the detection of a pathogen does not confirm that a specific pathogen is the cause of illness. this assumption is evidenced by our recent study where gastrointestinal pathogens were detected in asymptomatic participants in similar geographical locations in papua new guinea.14 moreover, the common detection of multiple pathogens in participants, a finding supported in our recent work,6 makes it difficult to ascertain which pathogen, or combination of pathogens, is causing the presenting illness in these participants. the detection of recognized gastrointestinal pathogens is of public health importance irrespective of whether they cause diarrhoea: individuals carrying these pathogens are reservoirs of infection whether or not they are symptomatic. however, in symptomatic participants, the risk of pathogen dissemination increases because of increased frequency of defecation, high pathogen loads, and inadequate sanitation and hygiene. in our surveillance system, we did not seek to detect protozoal pathogens, although parasites such as giardia lamblia and entamoeba histolytica have been detected in pregnant women in the highlands of papua new guinea in recent years.15 unfortunately, we could not include all potential etiological agents when conducting diarrhoeal disease surveillance, particularly in low-income settings. in addition to the limitations inherent to many surveillance programmes, we encountered many logistical and funding challenges that affected our ability to establish ongoing and sustained surveillance. we initially selected four sites for ongoing surveillance. site selection was determined largely by a programmatic health agenda, dictated by the industry partner. establishing and maintaining surveillance activities at remote sites is challenging. the financial and human resource costs are considerable, and all organizations need to consider where their efforts in health care are best directed. we believe that in this context, a smaller number of surveillance sites with pre-existing support networks (including laboratory and sample storage infrastructure) would be more appropriate. the clinics selected in this study, like many regional and rural health clinics in papua new guinea, lacked the appropriate facilities for aseptic and culturally appropriate collection of stool samples. at three of the four clinics, we could not start stool sample collection until toilets were built or commissioned. all of the clinics lacked reliable running water, making proper handwashing after the passing and handling of stool samples difficult. restricted access to electricity impacted sample storage (in fridges/freezers), which, in turn, influenced our approach to sampling. opportunistic sampling was implemented because of the unavailability of suitable sample storage and infrequent opportunities to transport specimens. routine diagnosis of infectious diseases in papua new guinea is limited predominantly to diseases diagnosed from a small volume of blood using point-of-care tests (e.g. malaria, hiv). health-care providers in papua new guinea infrequently request other types of clinical specimens used to diagnose disease, particularly stool samples, even when the diagnostic capacity exists. the infrequency of routine stool collection may have led to the reluctance of patients to provide stool samples, perhaps because of their unfamiliarity with the procedure or cultural discomfort. further sociocultural studies are required to investigate these issues before future surveillance of gastrointestinal pathogens. transport of diagnostic samples to central laboratories was hindered by the low number of samples being received and the challenging logistics in papua new guinea. the road network is an impediment to health delivery as observed during the cholera outbreak in 2009–2011.16 in some cases, poor roads made transport of consumables to the clinics and specimens to the laboratories difficult. no major logistical challenges impacted the transport of samples from the asaro site to the nearby goroka laboratory. however, the road connecting goroka to hides (location of malanda clinic) and madang (a major town on the papua new guinea mainland near karkar island) is frequently impassable as a result of natural disasters, poor road maintenance and security threats. samples from papa were transported without difficulty to port moresby and processed in a recently established biomedical research laboratory in port moresby associated with the papua new guinea institute of medical research and the university of papua new guinea. health facilities, including the study clinics, were closed at times for extended periods because of political unrest and violence during and following the 2012 election campaign. these disruptions negatively affected the establishment and continuation of surveillance. more importantly, but outside the scope of this work, they also negatively impacted the delivery of health services in times of increased need. despite the limitations and challenges associated with this surveillance, the relevance of the data should not be undervalued. we have furthered our knowledge of diarrhoeal pathogens circulating in papua new guinea. in doing so, we have identified significant potential challenges in establishing indicator-based surveillance. we are not suggesting that surveillance cannot, or should not, be conducted in papua new guinea. event-based surveillance has been successfully implemented in other instances17 and is an extremely useful tool for monitoring outbreaks. indicator-based surveillance and event-based surveillance complement each other and are considered essential components of a single national surveillance system.18 attempts to establish indicator-based surveillance could benefit from an awareness of the challenges faced here. conflicts of interest andrew greenhill has received research funding through the public and government affairs department of exxonmobil png limited to investigate the safety and immunogenicity of pneumococcal vaccines. no other conflicts of interest declared. funding this study was supported by a partnership in health program grant from esso highlands limited, an exxonmobil subsidiary. acknowledgements we are grateful to the many people who contributed to this work. in particular, we thank the clinical staff at the study clinics who collected diagnostic samples. we also thank staff within the infection and immunity unit and the environmental and emerging diseases unit at the papua new guinea institute of medical research. references kassebaum nj, arora m, barber rm, bhutta za, brown j, carter a, et al.; gbd 2015 dalys and hale collaborators. global, regional, and national disability-adjusted life-years (dalys) for 315 diseases and injuries and healthy life expectancy (hale), 1990-2015: a systematic analysis for the global burden of disease study 2015. lancet. 2016 oct 8;388(10053):1603–58. doi:10.1016/s0140-6736(16)31460-x pmid:27733283 at a glance: papua new guinea. port moresby: unicef papua new guinea. available from: https://www.unicef.org/png. horwood pf, greenhill ar. enteric diseases remain a major contributor to poor health outcomes in papua new guinea. p n g med j. 2013 sep-dec;56(3-4):97–102. pmid:26288925 toliman pj, guwada c, sou kw. a review of diarrhoea aetiology in papua new guinea, 1995-2012. p n g med j. 2013 sep-dec;56(3-4):145–55. pmid:26288933 the treatment of diarrhoea: a manual for physicians and other senior health workers, 4th rev. geneva: world health organization; 2005. soli kw, maure t, kas mp, bande g, bebes s, luang-suarkia d, et al. detection of enteric viral and bacterial pathogens associated with paediatric diarrhoea in goroka, papua new guinea. int j infect dis. 2014 oct;27:54–8. doi:10.1016/j.ijid.2014.02.023. boli r, pham bn, siba p and integrated health and demographic surveillance system (ihdss) team. assessing the changing burden of diseases at the primary health care level in rural papua new guinea. p n g med j. 2017;60(3–4):122–38. horwood pf, collins d, jonduo mh, rosewell a, dutta sr, dagina r, et al. clonal origins of vibrio cholerae o1 el tor strains, papua new guinea, 2009-2011. emerg infect dis. 2011 nov;17(11):2063–5. doi:10.3201/eid1711.110782 pmid:22099099 greenhill ar, mutreja a, bulach d, belousoff mj, jonduo mh, collins da, et al. wave 2 strains of atypical vibrio cholerae el tor caused the 2009-2011 cholera outbreak in papua new guinea. microb genom. 2019 mar;5(3). doi:10.1099/mgen.0.000256 pmid:30810520 greenhill a, rosewell a, kas m, manning l, latorre l, siba p, et al. improved laboratory capacity is required to respond better to future cholera outbreaks in papua new guinea. west pac surveill response. 2012 may 23;3(2):30–2. doi:10.5365/wpsar.2011.2.4.016 pmid:23908909 howard p, alexander nd, atkinson a, clegg ao, gerega g, javati a, et al. bacterial, viral and parasitic aetiology of paediatric diarrhoea in the highlands of papua new guinea. j trop pediatr. 2000 feb;46(1):10–4. doi:10.1093/tropej/46.1.10 pmid:10730034 benny e, mesere k, pavlin bi, yakam l, ford r, yoannes m, et al. a large outbreak of shigellosis commencing in an internally displaced population, papua new guinea, 2013. west pac surveill response. 2014 sep 15;5(3):18–21. doi:10.5365/wpsar.2014.5.2.003 pmid:25648967 greenhill ar, guwada c, siba v, michael a, yoannes m, wawarie y, et al. antibiotic resistant shigella is a major cause of diarrhoea in the highlands of papua new guinea. j infect dev ctries. 2014 11 13;8(11):1391–7. doi:10.3855/jidc.4396 pmid:25390051 horwood pf, soli kw, maure t, naito yi, morita a, natsuhara k, et al. a high burden of asymptomatic gastrointestinal infections in traditional communities in papua new guinea. am j trop med hyg. 2017 dec;97(6):1872–5. doi:10.4269/ajtmh.17-0282 pmid:29016338 phuanukoonnon s, michael a, kirarock ws, pomat ws, van den biggelaar ah. intestinal parasitic infections and anaemia among pregnant women in the highlands of papua new guinea. p n g med j. 2013 sep-dec;56(3-4):119–25. pmid:26288929 horwood pf, greenhill ar. cholera in papua new guinea: observations to date and future considerations. p n g med j. 2013 sep-dec;56(3-4):162–5. pmid:26288935 dagina r, murhekar m, rosewell a, pavlin bi. event-based surveillance in papua new guinea: strengthening an international health regulations (2005) core capacity. west pac surveill response. 2013 jul 30;4(3):19–25. doi:10.5365/wpsar.2013.4.2.001 pmid:24319609 a guide to establishing event-based surveillance. manila: world health organization regional office for the western pacific; 2008. https://ojs.wpro.who.int/ 1wpsar vol 12, no 2, 2021 | doi: 10.5365/wpsar.2020.11.2.015 perspective a school of tropical medicine and global health, nagasaki university, japan. published: 7 may 2021 doi: 10.5365/wpsar.2020.11.2.015 c ases of infection with severe acute respiratory syndrome coronavirus 2 (sars-cov-2), the virus responsible for coronavirus disease 2019 (covid-19), have been increasing since the virus emerged in wuhan, china, in december 2019. as of 13 march 2021, confirmed covid-19 cases have exceeded 119 million infected individuals across 188 countries, with more than 2.6 million recorded deaths.1 national health systems have attempted to contain the pandemic through control measures such as community quarantine and isolation. in the philippines, an enhanced community quarantine (ecq) took effect on 15 march 2020 in an effort to flatten the epidemic curve.2 ecq involves placing stringent limitations on people’s mobility and strict regulations on various industry operations, all of which are enforced by uniformed personnel.3 in spite of the ecq, active infections have been steadily increasing in the country, at 611 618 total cases and 12 694 deaths as of 13 march 2021.1 in 2020, the philippines recorded a substantial decrease in the number of dengue cases, with a reduction in notified cases of about 70–90% during the rainy season4 specifically from epidemiological weeks 28 to 40.5 apart from existing control and prevention measures implemented in the country – such as the establishment of dengue centres of excellence in tertiary hospitals and the creation of dengue fast lanes – the decrease in the number of cases during the covid-19 pandemic may be largely due to the reduced mobility of the population. several studies noted that reduction of localized household movement could lead to a reduction in transmission.6 on a larger geographical scale, movement control measures reportedly slow or even prevent the spread of a dengue epidemic from locations with high transmission intensity to suburbs or remote areas.7 conversely, the decrease may have also been a result of reporting hesitancy due to the fear of contracting covid-19 while visiting a health facility. in caribbean and latin american countries, an initial sharp decrease in dengue cases coincided with the start of reporting of covid-19 cases.8 the reduction in dengue trend may be due, in part, to the impact of the pandemic on health-seeking behaviour of the population, driven by fear of being infected. a similar reduction in health facility visits was also purported to be the reason behind the decrease in both infectious diseases and noninfectious diseases during the pandemic.9 the philippines has experienced several clusters of infection in hospitals. covid-19 hospital transmissions have been widely documented in hospitals in various countries.3 the existence of these hospital clusters has decreased medical-seeking behaviour due to the fear of contracting the disease, to the extent that it has impacted the reporting of other diseases and illnesses. several other countries in the world health organization (who) western pacific region also noted a decrease in dengue cases in 2020.5 however, this was not the case in singapore, which has seen a substantial increase in cases, possibly associated with the country’s physical distancing measures implemented in response to covid-19.10 for example, the work-from-home measure implemented may have contributed to the increase in dengue cases, compared with the usual workplace setting. compared with workplaces, residences have a higher propensity for causing dengue infection, owing to the thriving conditions for mosquito breeding. the rise in dengue cases in singapore and the reduction in the philippines and other countries in the region show how different control measures (e.g. mobility restrictions) can vary in their effects on levels of dengue. these variations may be due to the extent and degree of control measures, coupled with prevention and control measures directed to either dengue or covid-19, and inherent dengue at the time of covid-19 in the philippines xerxes t. seposoa correspondence to xerxes seposo (seposo.xerxestesoro@nagasaki-u.ac.jp) wpsar vol 12, no 2, 2021 | doi: 10.5365/wpsar.2020.11.2.015 https://ojs.wpro.who.int/2 seposodengue at the time of covid-19 in the philippines country-specific sociodemographic factors; thus, further investigation of these factors is warranted, subject to the availability of data. the philippines and other countries in the who western pacific region did not see a similar increase in dengue cases in 2020. however, caution should be exercised, because a trend of increasing dengue cases could still develop in current conditions. the renewed rise of covid-19 cases and the roll-out of covid-19 vaccinations may have an impact on dengue cases in the latter part of 2021. the increase in covid-19 cases may lead to more stringent control measures, but the strength of these measures will depend on the progress of vaccination coverage. according to the philippines’ current covid-19 vaccination timeline, the general population will probably start receiving vaccinations in july 2021, after completion of the full master list of people to be vaccinated, which is expected by 30 june 2021.1 the dengue season starts a month later, at the end of july. in summary, although the philippines has seen a decrease in dengue cases in 2020, a scenario in which cases increase is possible, as has happened in singapore. further investigation of countries in the region is needed to ascertain which factors have affected the varying impact on notified dengue cases from covid-19-related measures, compounded by innate sociodemographic characteristics. nevertheless, health managers can plan ahead and appraise the current conditions, including the rise in covid-19 cases and vaccination progress, and consider how these may affect the number of dengue cases in the latter part of 2021. references 1. department of health [internet]. manila: department of health. covid-19 tracker. available from: https://doh.gov.ph/covid19tracker, accessed 20 april 2021. 2. amit aml, pepito vcf, dayrit mm. early response to covid-19 in the philippines. west pac surveill response. 2021;12(1):5. 3. villarama eps, lopez eb, sayo ar, seposo x, ariyoshi k, smith c. covid-19 is moving to high-density, poor residential areas in metropolitan manila, philippines. west pac surveill response. 2021;12(1):3. 4. saipen a, demot b, de leon l. dengue–covid-19 coinfection: the first reported case in the philippines. west pac surveill response. 2021;12(1):5. 5. dengue situation update number 606. manila: who regional office for the western pacific; 2020. available from: https://iris.wpro. who.int/bitstream/handle/10665.1/14461/dengue-20201022. pdf, accessed 30 march 2021. 6. stoddard st, forshey bm, morrison ac, paz-soldan va, vazquez-prokopec gm, astete h, et al. house-to-house human movement drives dengue virus transmission. proc natl acad sci usa. 2013;110(3):994–9. doi:10.1073/pnas.1213349110 pmid:23277539 7. brady o, wilder-smith a. what is the impact of lockdowns on dengue? curr infect dis rep. 2021;23(2):2. doi:10.1007/s11908020-00744-9 pmid:33500682 8. dantés hg, manrique-saide p, vazquez-prokopec g, morales fc, siqueira jr jb, pimenta f, et al. prevention and control of aedes transmitted infections in the post-pandemic scenario of covid-19: challenges and opportunities for the region of the americas. mem inst oswaldo cruz. 2020;115:e200284. doi:10.1590/007402760200284 pmid:32785481 9. bhambhvani hp, rodrigues aj, yu js, carr jb 2nd, hayden gephart m. hospital volumes of 5 medical emergencies in the covid-19 pandemic in 2 us medical centers. jama intern med. 2021;181(2):272–4. doi:10.1001/jamainternmed.2020.3982 pmid:33104161 10. lim jt, chew lzx, choo elw, dickens bsl, ong j, aik j, et al. increased dengue transmissions in singapore attributable to sarscov-2 social distancing measures. j infect dis. 2021;223(3):399– 402. doi:10.1093/infdis/jiaa619 pmid:33000172 public health event communication under the international health regulations (2005) in the western pacific region, september 2006-january 2017 regional analysis li xi,a li ailana awho health emergencies programme, who regional office for the western pacific, manila, philippines correspondence to li ailan (email: lia@who.int). to cite this article: li x, li a. public health event communication under the international health regulations (2005) in the western pacific region, september 2006-january 2017. western pac surveill response j. 2019 sep;10(3). doi:10.5365/wpsar.2019.10.1.006 highlights the international health regulations, or ihr (2005), establishes timely communication between the world health organization (who) and member states to manage acute public health events and protect health security. experiences of the who ihr contact point for the western pacific region demonstrated the communication mechanism has achieved its functions in the region. investment in ihr communication as part of the asia pacific strategy for emerging diseases and public health emergencies (apsed iii) during peaceful times between public health emergencies builds capacity, confidence and trust in information sharing during emergencies. ihr communication is integral to the national, regional and global epidemic intelligence and risk assessments system. regular simulation exercises (for example, ihr exercise crystal) play an important role in testing and strengthening ihr communication. ihr communication continues to be vital for member states and who country offices to advise on health security. the revised international health regulations (ihr) (2005), entered into force in june 2007, is a legally binding international agreement on 196 states parties, including all 194 member states of world health organization (who).1 in the western pacific region, national ihr focal points (nfps) have been established in 27 member states, which are states parties to the ihr. communication between who and countries through the nfps is the cornerstone of timely detection of public health risks and effective response to health emergencies. countries are required to notify who of all events that may constitute a public health emergency of international concern (pheic) through their nfps. strengthening the functions of nfps is one of the strategic actions to enhance public health emergency preparedness through the implementation of the asia pacific strategy for emerging diseases and public health emergencies (apsed iii).2 ihr event communication refers to official communication between nfps and who ihr contact points (cps) at regional and global levels, as well as communication between nfps in different countries, and between the nfp and relevant departments or agencies within the country to notify public health events; share and verify information; determine whether an event constitutes a pheic; and coordinate emergency responses.1 email has been the main mechanism of communication between who cps and nfps. in addition to email communication, who has developed a password-protected website, the event information site (eis), to facilitate information sharing with all nfps. events posted on eis, which are often potential pheics or public hazards with international impact, are accessible to all nfps.3 ihr exercise crystal, a simulation exercise organized by the who western pacific regional office (wpro) to test and strengthen event communication between the ihr cp of wpro (wpro ihr cp) and nfps in the region, has been conducted in the western pacific region annually since 2008,4 except that in 2009 nfps communicated frequently with the wpro ihr cp during the pheic of pandemic influenza a(h1n1). the role of ihr exercise crystal in testing and strengthening the communication functions is well recognized in the 10-year evaluation of apsed and meetings of the technical advisory group on apsed.5,6 this regional analysis presents an evaluation of the extent and function of ihr event communication in the who western pacific region as informed by email records of the wpro ihr cp and experiences from ihr exercises crystal. specifically, we classified each event under one ihr article related to communications from states parties to who and analysed the number and types of events communicated under the relevant ihr articles: article 6 notification; article 8 consultation; article 9 other reports; article 10 verification; article 44 collaboration and assistance.1 we also summarized the types of events posted on eis and the scopes, objectives and results of ihr exercise crystal from 2008 to 2016. ihr communication email was the main mechanism of communication between the wpro ihr cp and nfps. in rare cases, documents were faxed to wpro, and the wpro ihr cp received email notices when faxes arrived. telephone calls were infrequent and were always accompanied by an email. emails were retrieved from the archives of the mailbox of the wpro ihr cp. the emails covered communications from september 2006, when the mailbox was put into use, to january 2017 at the time of analysis. the contents of emails received from nfps and external partners or from other regional who ihr cps were reviewed to determine the disease or public health hazard reported, the ihr article under which the event was communicated, the countries involved and the time of the communication. in case of novel influenza viruses, the notification of the first case in a member state is counted as one event, while the subsequent reports of additional cases were considered as updates to the event. event information disseminated by the international food safety authorities network (infosan), in which nfps were copied, were not included in the analysis. email exchanges among who staff other than those between the designated who ihr cps were not included; these were considered to be internal business processes after events were communicated to who. after removing duplicates, a total of 34 438 emails were recovered from the archives of wpro ihr mailbox from 11 september 2006 to 12 january 2017, of which 2944 (8.5%) were ihr exercise messages. emails received from 1 may to 25 august 2011 could not be recovered due to archiving issues. among the 34 438 retrieved emails, 13 252 (38%) were sent from the wpro ihr cp; and 18 922 (55%) were sent to the wpro ihr cp, including 5523 emails that copied the wpro ihr cp. the other 2264 emails (7%) included fax notices, surveillance reports that did not list the recipients and emails sent to a very large group of recipients for which we could not determine if wpro was on the direct or copying lines as the lines were truncated when data were imported into an access database. fig. 1 shows the number of emails by month. fig. 1. number of emails by months in the mailbox of the wpro ihr cp, september 2006–january 2017 click to download figure 1. jpg, 454kb of the 21 186 emails received by the wpro ihr cp, 5809 (27.4%) were from member states in the western pacific region, 508 (2.4%) were from member states and areas outside the western pacific region, 2881 (13.6%) were from who ihr cps in who headquarters or other who regional offices, 10 582 (49.9%) were from who staff other than who ihr cps, 612 (2.9%) were from infosan and 41 (0.2%) were from international partner organizations (fig. 2). the remaining 753 (3.6%) included autoreplies, subscriptions to event alerts and system-generated emails. all 27 nfps in the western pacific region communicated with the wpro ihr cp. thirty-four member states and areas§ of the who western pacific region, including those that are not states parties to the ihr, communicated with the wpro ihr cp. thirty-five countries outside the western pacific region communicated with the wpro ihr cp. fig. 2. number of emails received by the wpro ihr cp by sender categories, september 2006–january 2017 click to download figure 2. jpg, 334kb notification (ihr article 6, article 9) a total of 89 notifications of potential pheic under article 6 were received from member states and areas of the western pacific region as of 12 january 2017 (france and the united states of america made notifications on behalf of their territories in the pacific). all states parties in the western pacific region, except for tuvalu, made at least one notification of a potential pheic to the wpro ihr cp during this period. thirty-three diseases and one nuclear accident following an earthquake were reported to the wpro ihr cp. forty-three (48%) notifications were about novel influenza viruses, including 32 notifications on pandemic h1n1, four on h5n1, two on h7n9, two on h9n2 and one each for h10n8, h3n2, and h5n6. eleven notifications were about zika virus disease, including microcephaly and guillain–barré syndrome associated with zika virus disease. in addition to notifications under article 6, five notifications cited article 9, which asks states parties to inform who of a public health risk identified outside their territory that may cause international disease spread. these notifications included cases of zika virus disease and cholera imported from other countries, a norovirus outbreak during an international gathering, and a close contact of a middle east respiratory syndrome (mers) case who travelled internationally. information sharing and consultation with wpro (ihr article 8) five countries consulted with the wpro ihr cp about 14 events that either did not require notification as a potential pheic or did not have enough information to determine if pheic criteria had been met. none of these events was declared as a pheic. in addition, 12 nfps shared information with the wpro ihr cp about 27 diseases or disasters that might have international impact but did not constitute a pheic. verification (ihr article 10) the wpro ihr cp made 13 requests for verification of events known to who from sources other than notifications and consultations. of these, eight events (62%) had evidence of response from nfps within 24 hours. inter-country collaboration and assistance (ihr article 44) the ihr has been widely used by nfps for communication between countries. the wpro ihr cp facilitated or was copied in communication between nfps in 273 events. in 237 events, nfps initiated the communication to provide information to other nfps, including contact tracing in 71 events, follow-up for patient management in 10 events, reporting travellers or foreign nationals under public health observation/investigation in 17 events and sharing information of imported or exported cases of communicable diseases in 135 events. the most frequently reported diseases were tuberculosis (53 events), measles (29 events), chlamydia (16 events), legionnaire’s disease (15 events), mers (14 events), zika virus disease (12 events) and ebola virus disease (10 events for sharing notice of travellers under monitoring with low risk exposure and two events for contact tracing). due to the pandemic nature of h1n1, communications following initial notifications in each country related to contact tracing of h1n1 cases and antiviral resistance were not counted as separate from initial notification. in 36 instances, nfps made requests for information from another nfp. these communications usually took place when nfps wanted to verify media reports of diseases in another country or ask questions following an eis posting. information sharing through eis events that are potential pheics or other health hazards with international impact are posted on eis following notifications or other communications under the ihr. nfps of all states parties can view the event information on the password-protected website. a total of 90 postings from 24 countries or areas in the western pacific region were shared on eis as of january 2017. thirty-nine (43%) of the postings were about influenza. fig 3 shows the type of public health events from the western pacific region posted on eis between 2007 and 2016. fig. 3. types and counts of public health events posted on the event information site from the western pacific region, 2007–january 2017 click to download figure 3. jpg, 426kb avian influenza a(h7n9) in china had the highest number of updates for a single event in the western pacific region. the virus was first laboratory-confirmed in china on 31 march 2013 and notified to who on 1 april 2013. the first posting on eis was published on 1 april 2013 and was accessible to all nfps. the additional cases were reported daily during the first season of the epidemic, and weekly or monthly in the subsequent seasons. the reporting frequency increased during the seasons when the number of h7n9 cases increased. between 1 april 2013 and 12 january 2017, 166 updates of h7n9 were posted on eis. sixty-two out of 177 updates were posted on the same day. the median time from reporting to eis posting was 1.62 days. requesting information from who forty-two requests for further information were sent from nfps to the wpro ihr cp, often following media reports or eis postings of events in another country. ihr exercise crystal ihr exercise crystal has been held annually from 2008 to 2016, with the exception of 2009 when the real-world event of pandemic influenza a(h1n1) tested ihr communication between countries and who. the scope of ihr exercise crystal has been evolving with increased complexity (table 1). the main objectives of ihr exercise crystal have been consistent over the years: to strengthen the accessibility of nfp contact details, event notification process and information sharing through developing postings for eis. additional objectives have been added with more functions tested (table 2). table 1. scopes of ihr exercise crystal, 2008–2016 click to download table 1. jpg, 479kb table 2. objectives of ihr exercise crystal, 2008–2016 click to download table 2. jpg, 451kb all 27 countries in the region were invited to participate in ihr exercise crystal, except in 2014, when 11 countries were invited to participate in a joint ihr-infosan exercise. in 2016, eight territories and areas in the region were invited in addition to the 27 countries (fig. 4). the accessibility of nfps by email increased steadily over 2008–2016. in 2008, 70% (19 out of 27) of nfps were accessible by emails. this percentage increased to over 95% since 2011. the other ways of communication, including fax, telephone, teleconference and text messaging were tested in some years with varying results. the number of nfps who completed the expected tasks increased over the years. in 2015, 21 nfps made notifications during the allotted exercise time, an increase from five nfps in 2011. in 2015, 20 nfps completed the draft eis posting in the allotted exercise time compared to eight nfps in 2011. fig. 4. member states’ participation and performance in ihr exercise crystal, 2008–2016 click to download figure 4. jpg, 455kb feedback was collected from nfps following the exercises. nfps have commented that the scopes were appropriate and the objectives were achieved; the exercises “enhanced collaboration with partners and promoted teamwork”; and the exercises “strengthened ihr event-related communication” between nfps and who. nfps recommended that the exercise be continued. in october 2014, in response to the global ebola virus disease (evd) epidemic, an ebola simulation exercise and an ebola preparedness survey were conducted in addition to the regular ihr exercise crystal.7 twenty-three countries participated in the exercise that simulated the scenario of an imported case of evd. the majority of the countries were able to complete the expected actions, including sharing national evd guidelines and response plans, providing technical advice on contact tracing, case management and patient transportation and drafting a press release. the exercise identified specimen referral as an area for improvement. discussion ten years after ihr (2005) entered into force, the communication mechanism set up by ihr (2005) has been functional in supporting member states to report potential public health risks to who and other countries. all states parties in the western pacific region have made contact with the wpro ihr cp, and all but one made a notification of potential pheics to wpro. ihr event communication has also been used for sharing information with who on events that do not constitute a pheic. wpro has used ihr event communication to verify media and other reports with nfps. countries that are actively screening media or other information sources for public health risks used ihr event communication to verify information from who or another country. the network has become an important information source for risk assessment to both who and the countries. it is an integral component of global epidemic intelligence system. the ihr communication mechanism has been widely used by nfps for inter-country collaboration and assistance. the majority of ihr communication occurred between countries for information sharing, contact tracing and follow-up of patients to ensure continuity of infectious disease management. ihr communication has an all-hazards approach. while most of the events reported through ihr communication were infectious diseases, other public health concerns, including natural disasters, nuclear accidents and food safety issues were reported through ihr. timely communication during epidemics (the h1n1 pandemic influenza, zika virus disease, mers) exemplifies the importance of investment in public health preparedness in peaceful times between major public health emergencies to build confidence and trust between who and member states in information sharing. the capacity of nfps has been strengthened in the past 10 years, which can be observed through the simulation exercises: increasing numbers of nfps could complete the tasks of making notifications and developing an eis posting in the exercises. ihr exercise crystal is being replicated globally as a model to test and improve the functions of ihr communication. the analysis had several limitations. first, multiple ihr articles may apply to the same event, and countries reported events of similar nature to who citing different ihr articles. we classified the events under each ihr article based on our best understanding of the content and context, while acknowledging the classification might be subjective in some events and we didn’t attempt to analyse how many times articles in other parts of ihr (for example, part iv points of entry, part v public health measures) have been applied. second, only emails were analysed. other means of ihr event communication have been used, for example telephones and fax, although it is rare that events are reported without any email record. additionally, emails received from may to july 2010 could not be retrieved, and emails sent by the wpro ihr cp were not systematically archived. the wpro ihr cp could potentially improve its information management by developing a system to routinely archive messages. third, we likely underestimated the number of verifications from who. in countries with who country offices, the requests for verifying media reports and other reports were often communicated through who country offices, which then facilitated communication with the in-country counterparts. these communications may not have involved direct communication between the wpro ihr cp and nfps, and therefore were not covered by this analysis. fourth, we also likely underestimated the number of inter-country communications as the wpro ihr cp was not always copied in communications between nfps. given the communications not covered in the analysis, this report presents a conservative picture of the extent of ihr communication within the region. in conclusion, ihr communication has played a pivotal role in communicating pheic and other public health risks between countries and who and among countries. ihr exercise crystal played a positive role in strengthening ihr communication and collaboration. the capacity of nfps improved as shown in ihr exercise crystal. timely ihr event communication between nfps and who is an integral component of the global and regional surveillance and risk assessment system that protects national, regional and global health security. with the establishment and implementation of the who new health emergencies programme,8 it is expected that the functions of the nfps and the who ihr cps will be further strengthened and advanced. the experiences and lessons from the western pacific region could be a useful contribution to the achievement of the mission of the global programme to strengthen the capacity to prevent, detect and respond to public health threats worldwide. ethics statement ethical review is not required since reviewing the information communicated through the ihr mechanism is a public health practice activity and the purpose of the analysis is to evaluate and improve the ihr communication mechanism. acknowledgements the authors would like to thank colleagues from member states in the western pacific region, who country offices and the health emergencies programme at the who headquarters. funding this is a public health activity of the who regional office for the western pacific, and no funding from direct external sources was involved. conflicts of interest dr ailan li is a staff member of the who regional office for the western pacific and oversees who activities in the region in health emergency responses and health security, including ihr communications and ihr simulation exercises. dr xi li served as the first-line officer of the regional ihr contact point and as the editor of the western pacific surveillance and response journal. she participated in ihr exercise crystal in 2016. references international health regulations (2005). geneva: world health organization; 2008 (https://www.who.int/ihr/publications/9789241580496/en/). asia pacific strategy for emerging diseases and public health emergencies (apsed iii): advancing implementation of the international health regulations (2005). manila: who regional office for the western pacific; 2017 (https://iris.wpro.who.int/handle/10665.1/13654). who event management for international public health security: operational procedures. geneva: world health organization; 2008 (https://www.who.int/ihr/publications/who_hse_epr_aro_2008_1/en/). ihr exercise crystal. (2015). manila: who regional office for the western pacific; 2015 (https://apps.who.int/iris/handle/10665/246428). asia pacific strategy for emerging diseases: evaluation report 2005–2015. manila: who regional office for the western pacific; 2018 (https://iris.wpro.who.int/handle/10665.1/14028). meeting of the technical advisory group on the asia pacific strategy for emerging diseases and public health emergencies (apsed iii). manila, philippines, 11–13 july 2017: meeting report. manila: who regional office for the western pacific; 2017 (https://iris.wpro.who.int/handle/10665.1/13980). xu z et al on behalf of the who regional office for the western pacific emergency support team. ebola preparedness in the western pacific region, 2014. western pac surveill response j. 2015 jan 26;6(1):66-72. doi:10.2471/wpsar.2014.5.4.004 who health emergencies programme: progress and priorities, financing dialogue 31 october 2016. geneva: world health organization; 2016 (https://www.who.int/about/finances-accountability/funding/financing-dialogue/whe-update.pdf). assessment of the risk posed to singapore by the emergence of artemisinin-resistant malaria in the greater mekong subregion risk assessment emma xuxiao zhang,a jean-marc chavatte,b cherie see xin yi,a charlene tow,a wong jia ying,a kamran khan,c,d olivia seen huey oh,a sarah ngeet mei chin,a khong wei xin,a zubaidah said,a lyn james,a jeffery cutter,a marc hoa and jeannie su hui teya a ministry of health, singapore. b national public health laboratory, national centre for infectious diseases, singapore. c li ka shing knowledge institute, st. michael’s hospital, toronto, canada. d department of medicine, division of infectious diseases, university of toronto, toronto, canada. correspondence to emma xuxiao zhang (email: emma_zhang@moh.gov.sg). to cite this article: zhang ex, chavatte jm, yi csx, tow c, ying wj, khan k, et al. assessment of the risk posed to singapore by the emergence of artemisinin-resistant malaria in the greater mekong subregion. western pac surveill response j. 2019 may;10(2). doi:10.5365/wpsar.2018.9.2.011 abstract objective: to assess the public health risk to singapore posed by the emergence of artemisinin-resistant (art-r) malaria in the greater mekong subregion (gms). methods: we assessed the likelihood of importation of drug-resistant malaria into singapore and the impact on public health of its subsequent secondary spread in singapore. literature on the epidemiology and contextual factors associated with art-r malaria was reviewed. the epidemiology of malaria cases in singapore was analysed. the vulnerability and receptivity of singapore were examined, including the connectivity with countries reporting art-r malaria, as well as the preparedness of singaporean health authorities. sources of information include international journals, world health organization guidelines, data from the singapore ministry of health and national public health laboratory of the national centre for infectious diseases, and the international air transport association. results: the importation of art-r malaria into singapore is possible given the close proximity and significant travel volume between singapore and the gms countries reporting artemisinin resistance. singapore’s vulnerability is further enhanced by the presence of foreign workers from neighbouring endemic countries. nonetheless, the overall likelihood of such an event is low based on the rarity and decreasing trend of imported malaria incidence. with the presence of anopheles vectors in singapore, imported cases of drug-resistant malaria could cause secondary transmission. nevertheless, the risk of sustained spread is likely to be mitigated by the comprehensive surveillance and control system in place for both infected vectors and human cases. discussion: this risk assessment highlights the need for a continued high degree of vigilance of art-r malaria locally and globally to minimize the risk and public health impact of drug-resistant malaria in singapore. objective despite remarkable global progress in the fight against malaria since 2010, growing resistance to antimalarial drugs remains the biggest challenge on the path towards malaria elimination.1 to date, drug resistance has been recorded in plasmodium falciparum, p. vivax and p. malariae.2,3 the development of resistance by p. falciparum to nearly all antimalarial drugs, including current first-line treatments artemisinin and its derivatives, has become an issue of utmost concern. the greater mekong subregion (gms), which comprises cambodia, the lao people’s democratic republic, myanmar, thailand, viet nam and yunnan province of china, has long been the epicentre of antimalarial drug resistance.4 the first cases of artemisinin resistance were reported in cambodia in 2008.5 since then, artemisinin resistance has been observed in other countries in the gms and in neighbouring india.5,6 concomitantly, variable levels of resistance to the partner drugs used in artemisinin-based combination therapies (acts) have been reported.4 singapore is a globally connected city-state in south-east asia with high travel connectivity with many countries in the world, including those in the gms, due to its position as a travel and trade hub. although singapore has been declared malaria-free by the world health organization (who) since 1982, singapore is at risk of importation of emerging diseases including artemisinin-resistant (art-r) malaria. in view of the emergence of resistance across the gms and the spread beyond its borders, we carried out an analysis to assess the risk of importation and secondary spread of art-r malaria infection in singapore. methods the risk of importation of drug-resistant malaria into singapore and the public health impact of its subsequent secondary spread in singapore were assessed following who guidance on the risk assessment of acute public health events.7 the process of risk assessment included relevant literature review, epidemiological analysis of malaria cases in singapore, analysis of the air travel volume between singapore and countries reporting artemisinin resistance, an assessment of the vulnerability and receptivity of singapore, and the preparedness of singaporean health authorities to a potential (case/introduction/outbreak) of art-r malaria. the risk assessment was conducted by four public health officers specializing in public health surveillance, epidemiology and risk analysis of infectious diseases. their findings were reviewed by a broader group of experts from the singapore ministry of health (moh) in the areas of public health, laboratory medicine, epidemiology, infectious diseases, risk communication and emergency preparedness and response. the epidemiology of malaria cases in singapore was analysed based on information released by the moh.8 a qualitative review of the public health measures taken by singapore in response to the emerging threat was conducted based on information released by the moh and the singapore national environment agency (nea). the volume of travellers on commercial flights originating from countries with art-r malaria and with final destinations in singapore in 2017 was analysed using data from the international air transport association (iata) in singapore. the iata data are reported monthly and contain anonymized, itinerary-level passenger volumes. the data capture an estimated 90% of the world’s air traffic, with the remainder being imputed using market intelligence. full itineraries of the travellers have been used, including the initial airport of embarkation, final destination and any connecting flights. iata data have been used previously to inform risk assessments of the spread of pathogens of epidemic potential.9 among the imported p. falciparum cases, the monitoring of artemisinin resistance based on the kelch 13 (k13) gene was performed by the malaria reference centre from the national public health laboratory (mrc-nphl) by polymerase chain reaction (pcr) amplification and sequencing according to the protocol of ariey et al.10 risk assessment hazard assessment malaria is caused by plasmodium parasites that are transmitted to people through the bites of female anopheles mosquitoes with infectious sporozoites of malaria parasites.11 five plasmodium species cause malaria in humans: p. falciparum, p. vivax, p. malariae, p. ovale and p. knowlesi. p. falciparum is responsible for most malaria-related deaths globally and is the most prevalent malaria parasite in africa, while p. vivax is the dominant malaria parasite in most countries outside of sub-saharan africa including those in south-east asia.1 the first symptoms of malaria—fever, headache, chills and vomiting—usually appear between 10 to 15 days after a bite from a vector mosquito with infectious sporozoites of malaria parasites. without prompt diagnosis and treatment, p. falciparum malaria can rapidly progress to severe illness and death.11 currently, the most effective treatments are acts.12,13 drug resistance has been one of the greatest challenges in fighting malaria. resistance usually develops progressively, from the initial delay of parasite clearance in a few locations to the gradual expansion of geographic range and increase in prevalence, eventually leading to treatment failure. of the various antimalarial drugs available, chloroquine was the agent of choice for many years because of its safety, efficacy and affordability. however, since its first detection along the border of cambodia and thailand in 1957, resistance of p. falciparum to chloroquine has spread to almost everywhere that p. falciparum exists.14 p. falciparum has also developed resistance to nearly all other available antimalarial drugs, including sulfadoxine, pyrimethamine, amodiaquine, mefloquine, piperaquine, atovaquone and an increasing frequency of reported quinine resistance in several regions.15 the first clinical evidence of artemisinin resistance originated in western cambodia in 2008; however, further retrospective studies of molecular markers have indicated that artemisinin resistance likely emerged before 2001 and the widespread usage of acts.5,16,17 the extensive and often suboptimal usage of monotherapies as well as the genetic background of parasites in the gms were thought to have contributed to the development of resistance.18 since then, emergence of resistance to artemisinin and act partner drugs such as piperaquine have been reported in other areas in the gms.19,20 nevertheless, most patients with delayed parasite clearance can still be cured using acts as long as the partner drug remains effective; there is no evidence that higher levels of artemisinin resistance (full resistance) have emerged.4 exposure assessment reports of imported malaria infections in singapore in singapore, malaria was the most common vector-borne disease in the early 20th century, resulting in substantial morbidity and mortality.21 with strengthened epidemiological and vector control measures, singapore was certified malaria-free by who in november 1982. since 2010, the annual incidence of malaria has continued to decrease from 3.7 cases per 100 000 population in 2010 to 0.7 cases per 100 000 population in 2017. incidence has been maintained below 1 per 100 000 population in recent years. the number of imported malaria cases steadily decreased from 187 cases in 2010 to 39 cases in 2017. among the 290 cases of malaria reported in singapore between 2013 and 2017, 289 (99.7%) were imported cases, of whom 141 (49%) were work-permit or employment pass holders. the majority of imported cases were from south-east asia (16%), africa (16%) and india (62%). among the cases imported from south-east asia, most were from indonesia and malaysia, which accounted for 8% and 4% of cases, respectively. most of the cases of malaria reported in singapore between 2013 and 2017 were caused by p. vivax (70%) followed by p. falciparum (22%). in a retrospective survey from 2008 to 2017, 12 out of 209 (5.7%) p. falciparum cases tested had mutations possibly associated with artemisinin resistance (table 1). of the 12 cases, three cases had validated k13 resistance mutations while two cases had candidate k13 resistance mutations classified by who.4 however, none experienced treatment failure and all recovered without complications. table 1. number of p. falciparum malaria cases in singapore with mutations possibly associated with artemisinin resistance detected by k13 molecular marker analysis click to download table 1. jpg, 572kb travel volume from the gms to singapore among cities outside the gms, singapore receives the highest number of travellers from the gms (table 2a). from 2013 to 2017, there was an average of more than 303 000 travellers each month from the gms to singapore (table 2b). thailand accounted for the highest number of travellers followed by viet nam and myanmar. more than 15 000 monthly travellers to singapore came from cambodia where artemisinin resistance was first detected. despite being a major international transportation hub with high connectivity to the gms, importation of malaria into singapore appears to be rare (table 2b). table 2. connectivity between singapore and the gms countries click to download table 2. jpg, 547kb context assessment vector distribution singapore remains vulnerable and receptive to the reintroduction of malaria and the introduction of drug-resistant malaria due to the presence of anopheles vectors. among the over 400 species of anopheles mosquitoes discovered globally to date, about 70 species are potential vectors of malaria.22 in singapore, the two most common anopheles species are anopheles epiroticus and anopheles sinensis.23 anopheles epiroticus, anopheles maculatus and anopheles letifer, were reported to be involved in malaria outbreaks in singapore in the 1960s and 1970s, while anopheles sinensis was implicated in the 2009 outbreak.24,25 preparedness and response in singapore malaria surveillance and control in singapore is under the purview of two public health agencies: the nea, which undertakes the surveillance and control of anopheles mosquitoes, and the singapore moh, which is responsible for case surveillance and epidemiological investigation. vector control remains the cornerstone for controlling mosquito-borne diseases, including malaria. nea has put in place an integrated vector surveillance and control programme comprising environmental management and source reduction.26 nea has also identified specific malaria receptive areas for regular anopheles surveillance and control.27 malaria is a legally notifiable disease under the infectious disease act and all medical practitioners and laboratories are required to notify the moh within 24 hours of diagnosis.28 the moh then investigates all cases of malaria to determine if transmission is likely to be locally acquired or imported and assess whether any clusters are present. the mrc-nphl has the capability to detect a large panel of molecular markers associated with antimalarial drug resistance, including the who-recommended k13 gene (as a marker of artemisinin resistance) and several genes associated with partner drug resistance. to address the issue of imported malaria cases among foreign workers, singapore implemented compulsory screening for malaria for foreign workers in 1997 as part of the pre-employment medical examinations. among singapore residents diagnosed with imported malaria infections from 2012 to 2016, more than 90% did not observe adequate preventive measures such as taking chemoprophylaxis before overseas travel.29 such behaviours could be due to the lack of risk perception associated with travel, especially within asia, and the lack of awareness of travel medicine among travellers.29 past outbreaks of malaria in the event of an imported case although imported cases continue to pose challenges for malaria control, the chances of resumption of endemic transmission are small as elimination tends to be a stable state.30 singapore has maintained its malaria-free status31 since 1982. between 1983 and 2009, 32 outbreaks involving 225 cases were reported, and the majority of the cases were imported through foreign workers with relapsing p. vivax malaria.26 further transmissions from these occasional outbreaks were promptly curbed by aggressive preventive and remedial actions, including extensive vector surveillance and control measures; early case detection through blood and fever surveys in malaria receptive areas; and risk communication to medical practitioners as well as health education for the public.26 no outbreaks have been reported since 2010. measures taken by gms countries to prevent global spread of artemisinin resistance, containment efforts have been initiated in the gms. in 2015, who launched the strategy for malaria elimination in the greater mekong subregion (2015–2030), which was endorsed by all gms countries.31 all gms countries have begun to implement national malaria elimination strategies that have resulted in a significant reduction in malaria cases and death; the surveillance of the efficacy of antimalarial drugs has led to prompt updating of malaria treatment policies in most gms countries.1 risk characterization the risk imposed to singapore by the emergence of art-r malaria was characterized using the information collected; key factors were considered to assess the likelihood of importation of cases into singapore and the impact on public health (table 3). table 3. risk characterization matrix for the public health risk posed to singapore click to download table 3. jpg, 880kb the risk characterization of likely based on the likelihood of importation and the according minimal consequence suggest that the overall risk of art-r malaria to singapore is low. the importation of a case of art-r malaria into singapore is possible given the close proximity and significant travel volume between singapore and the gms countries reporting artemisinin resistance. singapore’s vulnerability is further enhanced by the presence of foreign workers from neighbouring endemic countries. nonetheless, the overall likelihood of importation is considered low based on the rarity and the decreasing trend of imported malaria incidence over the past few years. with the presence of anopheles vectors in singapore, imported cases of art-r malaria can cause secondary transmission. the risk of sustained spread is likely to be mitigated by the comprehensive surveillance and control system in place for both infected vectors and human cases as observed in the past local outbreaks of malaria initiated by imported cases. discussion singapore is the top destination for travellers from the gms. among the imported p. falciparum cases in singapore, 5.8% had genetic mutations that may confer resistance to artemisinin. the presence of competent local vectors, the high volume of travel from regions with art-r malaria, and the presence of foreign workers from neighbouring endemic countries make it possible that drug-resistant malaria could be imported and introduced to singapore. to reduce the risk of singapore residents acquiring malaria infections overseas, pre-travel health education, particularly by travel agents, the media and health-care providers, can increase awareness of the risk of contracting malaria overseas so that personal preventive measures can be taken. secondary spread following an imported case is also possible. however, any spread is not likely to be sustained. malaria has not re-established itself as an endemic disease in singapore despite local outbreaks since it was declared malaria-free in 1982. the singapore moh and nea have implemented comprehensive malaria surveillance and control programmes to detect cases and curb the transmission of local outbreaks. the risk assessment has some limitations. the assessment is based on limited data as the number of imported cases of malaria in singapore is small. as the risk characterization was defined by the epidemiological and contextual knowledge available currently, conclusions could change as new information emerges. ongoing studies on genetic mutations, particularly their underlying molecular and cellular mechanisms and their phenotypic manifestations in resistance, could provide a better understanding of an epidemic and facilitate the design of surveillance and control measures. identification of new molecular markers and improvements in laboratory capability continues to impact disease surveillance as illustrated by the significant progress in global surveillance of artemisinin resistance expedited by the discovery of the molecular marker k13.12 risk assessment will also change as new treatment options become available. even though an assessment of the risks posed by resistance to partner drugs in the acts is out of scope for this paper, we recognize the risk of such resistance and the importance of monitoring all molecular markers of antimalarial-drug resistance. analysis is currently under way to test molecular markers for partner drugs and assess potential variations. in addition, artemisinin resistance has also been observed in non-gms countries, including countries in africa, although the occurrence is very rare.4 the risk of importation of art-r malaria from these non-gms countries is not discussed in this paper because of low connectivity of singapore with these countries. nevertheless, it warrants our close monitoring of the development of global situations. in conclusion, in view of the emergence of art-r malaria in the gms and its geographical expansion, this risk assessment highlights the need for a high degree of vigilance over the local and global situation to be maintained to minimize the risk and severity of the public health threat of art-r malaria to singapore. acknowledgements we are grateful to dr derrick heng (group director of the public health group), dr vernon lee (director of the communicable diseases division), and dr raymond lin (head of the national public health laboratory) of singapore ministry of health for their valuable advice. we would also like to thank mr matthew german and mr deepit bhatia of bluedot inc. for feedback on the manuscript and helpful discussions. funding none. conflicts of interest none. references world malaria report 2018. geneva: world health organization; 2018 (https://www.who.int/malaria/publications/world-malaria-report-2018/en/, accessed 27 november 2018). white nj, pukrittayakamee s, hien tt, faiz ma, mokuolu oa, dondorp am. malaria. lancet. 2014 feb 22;383(9918):723–35. doi:10.1016/s0140-6736(13)60024-0 pmid:23953767 worldwide antimalarial resistance network [website]. oxford: worldwide antimalarial resistance network; 2017 (https://www.wwarn.org/, accessed 29 december 2017). status report on artemisinin and artemisinin-based combination therapy resistance. geneva: world health organization; 2018 (https://apps.who.int/iris/bitstream/handle/10665/274362/who-cds-gmp-2018.18-eng.pdf?ua=1, accessed 28 november 2018). noedl h, se y, schaecher k, smith bl, socheat d, fukuda mm; artemisinin resistance in cambodia 1 (arc1) study consortium. evidence of artemisinin-resistant malaria in western cambodia. n engl j med. 2008 dec 11;359(24):2619–20. doi:10.1056/nejmc0805011 pmid:19064625 das s, saha b, hati ak, roy s. evidence of artemisinin-resistant plasmodium falciparum malaria in eastern india. n engl j med. 2018 nov 15;379(20):1962–4. doi:10.1056/nejmc1713777 pmid:30428283 rapid risk assessment of acute public health events. geneva: world health organization; 2012 (https://www.who.int/csr/resources/publications/hse_gar_aro_2012_1/en/, accessed 30 april 2018). resources & statistics. in: singapore ministry of health [website]. singapore: singapore ministry of health; 2019 (https://www.moh.gov.sg/resources-statistics, accessed 11 april 2019). brent se, watts a, cetron m, german m, kraemer mu, bogoch ii, et al. international travel between global urban centres vulnerable to yellow fever transmission. bull world health organ. 2018 may 1;96(5):343–354b. doi:10.2471/blt.17.205658 pmid:29875519 ariey f, witkowski b, amaratunga c, beghain j, langlois ac, khim n, et al. a molecular marker of artemisinin-resistant plasmodium falciparum malaria. nature. 2014 jan 2;505(7481):50–5. doi:10.1038/nature12876 pmid:24352242 fact sheet on malaria. geneva: world health organization; 2018 (https://www.who.int/en/news-room/fact-sheets/detail/malaria, accessed 30 april 2018). guidelines for the treatment of malaria, 3rd edition. geneva: world health organization; 2015 (https://apps.who.int/iris/bitstream/10665/162441/1/9789241549127_eng.pdf?ua=1&ua=1, accessed 30 april 2018). artemisinin and artemisinin-based combination therapy resistance. geneva: world health organization; 2017 (https://apps.who.int/iris/bitstream/10665/255213/1/who-htm-gmp-2017.9-eng.pdf?ua=1, accessed 30 april 2018). payne d. spread of chloroquine resistance in plasmodium falciparum. parasitol today. 1987 aug;3(8):241–6. doi:10.1016/0169-4758(87)90147-5 pmid:15462966 thu am, phyo ap, landier j, parker dm, nosten fh. combating multidrug-resistant plasmodium falciparum malaria. febs j. 2017 aug;284(16):2569–78. doi:10.1111/febs.14127 pmid:28580606 dondorp am, nosten f, yi p, das d, phyo ap, tarning j, et al. artemisinin resistance in plasmodium falciparum malaria. n engl j med. 2009 jul 30;361(5):455–67. doi:10.1056/nejmoa0808859 pmid:19641202 amato r, pearson rd, almagro-garcia j, amaratunga c, lim p, suon s, et al. origins of the current outbreak of multidrug-resistant malaria in southeast asia: a retrospective genetic study. lancet infect dis. 2018 03;18(3):337–45. doi:10.1016/s1473-3099(18)30068-9 pmid:29398391 dondorp am, fairhurst rm, slutsker l, macarthur jr, breman jg, guerin pj, et al. the threat of artemisinin-resistant malaria. n engl j med. 2011 sep 22;365(12):1073–5. doi:10.1056/nejmp1108322 pmid:21992120 imwong m, suwannasin k, kunasol c, sutawong k, mayxay m, rekol h, et al. the spread of artemisinin-resistant plasmodium falciparum in the greater mekong subregion: a molecular epidemiology observational study. lancet infect dis. 2017 05;17(5):491–7. doi:10.1016/s1473-3099(17)30048-8 pmid:28161569 woodrow cj, white nj. the clinical impact of artemisinin resistance in southeast asia and the potential for future spread. fems microbiol rev. 2017 jan;41(1):34–48. doi:10.1093/femsre/fuw037 pmid:27613271 goh kt. eradication of malaria from singapore. singapore med j. 1983 oct;24(5):255–68. pmid:6669988 sinka me, bangs mj, manguin s, rubio-palis y, chareonviriyaphap t, coetzee m, et al. a global map of dominant malaria vectors. parasit vectors. 2012 apr 4;5(1):69. doi:10.1186/1756-3305-5-69 pmid:22475528 not all mosquitoes transmit dengue. singapore: the national environmental agency; 2018 (https://www.nea.gov.sg/corporate-functions/resources/research/wolbachia-aedes-mosquito-suppression-strategy/not-all-mosquitoes-transmit-dengue, accessed 9 july 2018). ng lc, lee ks, tan ch, ooi pl, lam-phua sg, lin r, et al. entomologic and molecular investigation into plasmodium vivax transmission in singapore, 2009. malar j. 2010 oct 29;9(1):305. doi:10.1186/1475-2875-9-305 pmid:21029478 pang sc, andolina c, malleret b, christensen pr, lam-phua sg, razak maba, et al. singapore’s anopheles sinensis form a is susceptible to plasmodium vivax isolates from the western thailand-myanmar border. malar j. 2017 nov 16;16(1):465. doi:10.1186/s12936-017-2114-3 pmid:29145859 lee yca, tang cs, ang lw, han hk, james l, goh kt. epidemiological characteristics of imported and locally-acquired malaria in singapore. ann acad med singapore. 2009 oct;38(10):840–9. pmid:19890574 malaria receptive areas in singapore. singapore: the national environmental agency; 2018 (https://data.gov.sg/dataset/malaria-receptive-areas, accessed 9 july 2018). list of infectious diseases legally notifiable under the infectious diseases act. singapore: singapore ministry of health; 2019 (https://www.moh.gov.sg/docs/librariesprovider5/default-document-library/list-of-infectious-diseases-legally-notifiable-under-the-ida.pdf, accessed 11 april 2019). lin yj, badaruddin h, ooi spl. epidemiology of malaria in singapore, 2008–2015. epidemiological news bulletin. 2016;42(2):49–54. smith dl, cohen jm, chiyaka c, johnston g, gething pw, gosling r, et al. a sticky situation: the unexpected stability of malaria elimination. philos trans r soc lond b biol sci. 2013 jun 24;368(1623):20120145. doi:10.1098/rstb.2012.0145 pmid:23798693 strategy for malaria elimination in the gms (2015–2030). geneva: world health organization; 2015 (https://iris.wpro.who.int/bitstream/handle/10665.1/10945/9789290617181_eng.pdf, accessed 11 april 2019). https://ojs.wpro.who.int/ 1wpsar vol 12, no 1, 2021 | doi: 10.5365/wpsar.2020.11.2.010 original research a biosecurity program, kirby institute, faculty of medicine, university of new south wales, sydney, australia. published: 17 february 2021 doi: 10.5365/wpsar.2020.11.1.005 o n 31 december 2019, china reported an increased occurrence of pneumonia of unknown cause in wuhan,1 which was later confirmed as coronavirus disease 2019 (covid-19), a respiratory illness caused by the newly discovered coronavirus, severe acute respiratory syndrome coronavirus 2 (sarscov-2). on 13 january 2020, thailand became the first country to identify imported cases of covid-19. other countries in south-east asia, including singapore and malaysia, also reported their first imported cases in january 2020.2,3 on 31 january 2020, the world health organization (who) declared covid-19 a public health emergency of international concern,4 and on 11 march 2020, it declared the outbreak a pandemic.5 indonesia reported its first two confirmed positive cases of covid-19 on 2 march 2020.6 early identification of an infectious disease outbreak is essential, to allow for immediate initiation of public health interventions and to mitigate global impacts of transnational spread of the disease. traditional public health surveillance, especially where there is low testing capability, is often not timely due to delays in reporting and validation by local health authorities.4 open-source intelligence may serve as a valuable tool for rapid epidemic surveillance.5 who reports that more than half of early epidemic information can be obtained through unofficial sources, including online news outlets and social media.6 this study aims to evaluate the use of open-source data from the epidemic observatory, epiwatch, to identify the early signals of pneumonia of unknown cause as a proxy for sars-cov-2 circulation in indonesia. methods epiwatch is a semi-automated open-source epidemic observatory that collects and analyses outbreak data from publicly available sources, such as online news outlets and social media.7 epiwatch has been used to collect outbreak data since 2016. the observatory colobjective: open-source data from online news reports and informal sources may provide information about outbreaks before official notification. this study aims to evaluate the use of open-source data from the epidemic observatory, epiwatch, to identify the early signals of pneumonia of unknown cause as a proxy for covid-19 in indonesia. methods: using open-source data on pneumonia of unknown cause in indonesia between 1 november 2019 and 31 march 2020 (extracted from epiwatch, an open-source epidemic observatory), a descriptive analysis was performed to identify the trend of pneumonia of unknown cause in indonesia before official notification of covid-19 cases. results: a rise in reports of pneumonia of unknown cause was identified in indonesia, starting from late january 2020. there were 304 reported cases of pneumonia of unknown cause, 30 of which occurred before the identification of the first covid-19 cases on 2 march 2020. the early signals of pneumonia of unknown cause in indonesia may indicate possible unrecognized circulation of severe acute respiratory syndrome coronavirus 2 (sars-cov-2) before official detection. discussion: open-source data may provide rapid, unvalidated information for early detection of outbreaks. although unvalidated, such information may be used to supplement or trigger investigation and testing. as epiwatch sources global information, this methodology can be repeated for other countries within the western pacific region, and for other diseases. using open-source intelligence to identify early signals of covid-19 in indonesia yoser thamtono,a aye moaa and chandini raina macintyrea correspondence to yoser thamtono (yoserthamtono@protonmail.com) mailto:yoserthamtono@protonmail.com wpsar vol 12, no 1, 2021 | doi: 10.5365/wpsar.2020.11.2.010 https://ojs.wpro.who.int/2 thamtono et alearly signals of covid-19 in indonesia ethics and permissions no ethics approval was required for this study because it uses publicly available open-source data from online media. results between november 2019 and march 2020, epiwatch documented 217 entries or reports related to pneumonia of unknown cause in indonesia. six duplicates were removed, leaving a total of 211 included reports. the highest number of reports (184 entries) were from march 2020, after the official identification of the first cases of covid-19 in indonesia. however, a steady increase in the reports of pneumonia of unknown cause was seen from late january 2020 (five entries) to the end of february 2020 (17 entries). these 211 entries correspond to 304 reported cases of pneumonia of unknown cause in indonesia, 30 (9.9%) of which occurred before the identification of the first covid-19 cases on 2 march 2020. among those 30 cases, 17 were suspected for covid-19, including the case of a toddler from china, aged 18 months, who was treated for pneumonia in lombok, west nusa tenggara, on 27 january 2020.9 covid-19 diagnosis was ruled out based on a blood laboratory count that was suggestive of bacterial infection; however, no further results of polymerase chain reaction (pcr) or bacterial culture were reported.9 fig. 1 shows the count of pneumonia of unknown cause from 1 november 2019 to 31 march 2020 as obtained from epiwatch reports. in november and december 2019, there were five epiwatch-reported cases of pneumonia of unknown cause. the number of reports increased slightly from late january (six identified cases) to february 2020 (19 identified cases), six weeks before the official identification of the first two covid-19 cases in indonesia. in march 2020, the count of epiwatch-reported cases of pneumonia of unknown cause increased significantly to 274 cases, which may represent an increase in covid-19 cases or growing media attention and reporting following the official notification of covid-19 in indonesia on 2 march 2020. in the same period in the previous year, there were far fewer reports of pneumonia of unknown cause, with only lects information on outbreaks of diseases and emerging infections, globally, to detect early signals and trends, which can then be used by researchers. the system was established and is managed by the australian national health and medical research council (nhmrc) centre for research excellence, integrated systems for epidemic response (iser).7 epiwatch gathers open-source data from online news outlets and social media through an intelligent and modular system. to enable enhanced surveillance, searches are modified for specific languages and for specific infectious disease syndromes. modifications include changing and adding keywords and languages for searching. the observatory system supports various intelligent data-gathering algorithms, including natural language processing algorithms, regular expression matching and supervised machine-learning algorithms. the data are stored in a postgresql database.8 within epiwatch, reports are reviewed and entered manually by the team, to ensure collection of key data points identified by the automated data-gathering system and prevent duplication of reports. in this study, enhanced surveillance was performed through epiwatch using keywords reflecting sars or pneumonia, such as “pneumonia, lung infection, lung inflammation, severe acute respiratory infection (sari), cough, fever, cough and fever”, with indonesia as a location, in bahasa indonesia (the country’s official language). the obtained reports were manually reviewed, and any reported cases of pneumonia of unknown cause in indonesia dated between 1 november 2019 and 31 march 2020 were included in the epiwatch database. reports matching the keywords were analysed and were excluded if they were not reporting cases from indonesia or cases of pneumonia of unknown cause, or if they were reporting duplicate news or pneumonia cases with a known cause. indonesia was chosen for this study as its first official covid-19 notification was made later than that of other south-east asian countries. a descriptive epidemiological analysis was performed using microsoft excel 2016 to group cases by geolocation and by the date on which they were reported. data reported from indonesia’s ministry of health were also reviewed and compared with the news reports. wpsar vol 12, no 1, 2021 | doi: 10.5365/wpsar.2020.11.2.010https://ojs.wpro.who.int/ 3 early signals of covid-19 in indonesiathamtono et al five epiwatch-reported cases of pneumonia of unknown cause from january to march 2019. almost half of all epiwatch-reported cases of pneumonia of unknown cause were from provinces in java. east java (39 cases; 12.8%) and jakarta (37 cases; 12.1%) were the provinces with the highest number of epiwatch-reported cases, followed by central java (26 cases; 8.5%), west java (17 cases; 5.6%), yogyakarta (15 cases; 4.9%) and banten (seven cases; 2.3%). outside java, bali had the highest number of epiwatch-reported cases (28 cases; 9.2%) (fig. 2 and fig. 3). gender information was given for 157 of the 304 epiwatch-reported cases. among those 157 cases, there was a higher proportion of males (96 cases; 61.1%) than females (61 cases; 38.9%), with a 1.5:1 ratio of males to females. information on age was given for 138 of the 304 epiwatch-reported cases, with the highest proportion of cases being those aged 50–60 years. discussion this study provides a descriptive analysis of cases of pneumonia of unknown cause that occurred in indonesia from november 2019 to march 2020 as detected by the epiwatch observatory. these epiwatch-reported cases of pneumonia of unknown cause in indonesia increased from late january 2020, which may reflect the presence of covid-19 cases in the country before official identification of two cases at the start of march 2020. data from the ministry of health10 show that, by 31 march 2020, indonesia had 1528 laboratory confirmed cases of covid-19, with 136 documented deaths. among these cases, almost half (48.9%) were identified in jakarta, followed by other provinces in java: west java (11.9%), banten (9.2%), east java (5.9%), central java (5.2%) and yogyakarta (1.2%).10 at that time, bali had reported only 19 confirmed cases of covid-19 (1.2% of total cases).10 the spatial distribution of notified covid-19 cases in indonesia is similar to that of pneumonia of unknown cause from epiwatch, suggesting the potential use of pneumonia of unknown cause as a proxy for covid-19 cases in indonesia. however, there were proportionately more notified cases from jakarta compared with the spatial distribution of pneumonia of unknown cause from epiwatch in our study. this might suggest geographical differences in the ability to identify and report covid-19 cases. health infrastructure gaps have been cited as one of the most critical issues in the indonesian health system.11 health facilities, including hospital and laboratory services, are more readily available in the urban java region, where jakarta, the capital city, is located.12 provinces in java, especially jakarta, might have better capability for identifying cases of covid-19. meanwhile, other provinces may have underdetection of covid-19 cases; for example, bali notified a low number of confirmed covid-19 cases compared with the epiwatch-reported cases of pneumonia of unknown cause. of the 12 covid-19 national reference laboratories in indonesia, only three are located outside java, which may hinder the ability of provinces outside java to rapidly identify and respond to the presence of covid-19.13 this study is the first of its kind to describe the epidemiological pattern of pneumonia of unknown cause reported from open-source intelligence before and after the official notification of covid-19 cases in indonesia. it shows that monitoring trends of pneumonia of unknown cause in open-source data could provide rapid, unvalidated information for early detection of covid-19 outbreaks. although the information is unvalidated, once a signal is detected, it could prompt further investigation and validation. consequently, such information may supplement traditional surveillance, which is frequently subject to delays in reporting and validation by local health authorities.4 this study has several limitations. first, there is a possibility of reporting bias because we may have captured increasing media awareness rather than an actual increase in disease occurrence. the early signal was detected in late january 2020, when covid-19 had been detected in many countries worldwide. second, this study relies on an online news-based surveillance system, which is unvalidated and may include other etiologies of pneumonia that were not covid-19.14 third, we only included pneumonia in our study; however, covid-19 has a wide range of symptoms, with most of those infected having a mild illness.15 nevertheless, this study has highlighted the ability of open-source data to identify wpsar vol 12, no 1, 2021 | doi: 10.5365/wpsar.2020.11.2.010 https://ojs.wpro.who.int/4 thamtono et alearly signals of covid-19 in indonesia fig. 1. number of epiwatch reported cases of pneumonia of unknown cause in indonesia between 1 november 2019 and 31 march 2020 fig. 2. number of epiwatch reported cases of pneumonia of unknown cause in indonesia, by province (november 2019 to march 2020) c ou n ts o f p n eu m on ia o f u n kn ow n c au se p er d ay 1 n ov 2 0 1 9 7 n ov 2 0 1 9 1 3 n ov 2 0 1 9 1 9 n ov 2 0 1 9 2 5 n ov 2 0 1 9 1 d ec 2 0 1 9 7 d ec 2 0 1 9 1 3 d ec 2 0 1 9 1 9 d ec 2 0 1 9 2 5 d ec 2 0 1 9 3 1 d ec 2 0 1 9 6 j an 2 0 2 0 1 2 j an 2 0 2 0 1 8 j an 2 0 2 0 2 4 j an 2 0 2 0 3 0 j an 2 0 2 0 5 f eb 2 0 2 0 1 1 f eb 2 0 2 0 1 7 f eb 2 0 2 0 2 3 f eb 2 0 2 0 2 9 f eb 2 0 2 0 6 m ar 2 0 2 0 1 2 m ar 2 0 2 0 1 8 m ar 2 0 2 0 2 4 m ar 2 0 2 0 3 0 m ar 2 0 2 0 reporting date travel restriction for china 5 feb travel restriction for some european countries 20 mar first detected cases 2 mar travel restriction for iran, italy and republic of korea 8 mar 25 0 5 10 15 20 travel restriction for tourists from hubei 27 jan 1 28 3 7 5 26 9 2 39 2 2 1 37 7 3 2 4 10 6 7 10 7 13 12 2 17 16 3 1 7 15 n u m b er o f ca se s provinces 45 40 35 30 25 20 15 10 5 0 source: epiwatch wpsar vol 12, no 1, 2021 | doi: 10.5365/wpsar.2020.11.2.010https://ojs.wpro.who.int/ 5 early signals of covid-19 in indonesiathamtono et al fig. 3. geographical distribution of epiwatch reported cases of pneumonia of unknown cause in indonesia (november 2019 to march 2020) conflicts of interests the content of this manuscript is solely the responsibility of the authors, and we have no conflicts of interest to declare. we verify that all authors have seen and approved the final manuscript and declare the manuscript content herein has not been submitted for consideration or published elsewhere. references 1. coronavirus disease (covid-19) outbreak. world health organization; 2020. available from: https://www.who.int/westernpacific/ emergencies/covid-19, accessed 1 april 2020. 2. confirmed imported case of novel coronavirus infection in singapore; multi-ministry taskforce ramps up precautionary measures. ministry of health singapore; 2020. available from: https:// www.moh.gov.sg /news-highlights/details/confirmed-importedcase-of-novel-coronavirus-infection-in-singapore-multi-ministrytaskforce-ramps-up-precautionary-measures, accessed 1 april 2020. 3. kenyataan akhbar kpk 26 januari 2020 – situasi terkini jangkitan novel coronavirus di malaysia [press statement 26 january 2020 – current update on novel coronavirus situation in malaysia]. director-general of health malaysia; 2020. available from: https://kpkesihatan.com/2020/01/26/kenyataan-akhbar-kpk26-januari-2020-situasi-terkini-jangkitan-novel-coronavirus-dimalaysia/, accessed 1 april 2020. 4. may l, chretien j-p, pavlin ja. beyond traditional surveillance: applying syndromic surveillance to developing settings–opportunities and challenges. bmc public health. 2009 jul 16;9(1):242. doi:10.1186/1471-2458-9-242 early alerts of pneumonia before the initial confirmation of covid-19 cases in indonesia, making such data a promising option to enhance epidemic surveillance. conclusion in this study, we detected possible early signals of the covid-19 outbreak in indonesia using an online news-based surveillance system that used bahasa indonesia through epiwatch. the earliest signals from the epiwatch observatory of pneumonia of unknown cause in indonesia were in late january 2020, indicating possible unrecognized circulation of covid-19 cases in indonesia before the country’s official notification of cases. the observed spatial pattern of cases between epiwatch-reported pneumonia of unknown cause and officially confirmed covid-19 cases in indonesia was similar. monitoring trends in open-source data can provide rapid, unvalidated information for the early detection of outbreaks. although unvalidated, such information may be used to supplement or trigger investigation and testing. as epiwatch sources global information, this methodology can be repeated for other diseases and other countries within the western pacific region. number of cases: 30–40 20–30 10–20 1–10 source: epiwatch https://www.who.int/westernpacific/emergencies/covid-19 https://www.who.int/westernpacific/emergencies/covid-19 https://www.moh.gov.sg/news-highlights/details/confirmed-imported-case-of-novel-coronavirus-infection-in-singapore-multi-ministry-taskforce-ramps-up-precautionary-measures https://www.moh.gov.sg/news-highlights/details/confirmed-imported-case-of-novel-coronavirus-infection-in-singapore-multi-ministry-taskforce-ramps-up-precautionary-measures https://www.moh.gov.sg/news-highlights/details/confirmed-imported-case-of-novel-coronavirus-infection-in-singapore-multi-ministry-taskforce-ramps-up-precautionary-measures https://www.moh.gov.sg/news-highlights/details/confirmed-imported-case-of-novel-coronavirus-infection-in-singapore-multi-ministry-taskforce-ramps-up-precautionary-measures https://kpkesihatan.com/2020/01/26/kenyataan-akhbar-kpk-26-januari-2020-situasi-terkini-jangkitan-novel-coronavirus-di-malaysia/ https://kpkesihatan.com/2020/01/26/kenyataan-akhbar-kpk-26-januari-2020-situasi-terkini-jangkitan-novel-coronavirus-di-malaysia/ https://kpkesihatan.com/2020/01/26/kenyataan-akhbar-kpk-26-januari-2020-situasi-terkini-jangkitan-novel-coronavirus-di-malaysia/ https://doi.org/10.1186/1471-2458-9-242 wpsar vol 12, no 1, 2021 | doi: 10.5365/wpsar.2020.11.2.010 https://ojs.wpro.who.int/6 thamtono et alearly signals of covid-19 in indonesia 11. mahendradhata y, trisnantoro l, listyadewi s, soewondo p, marthias t, harimurti p, et al. the republic of indonesia health system review. vol 7, no 1. new delhi: who regional office for south-east asia; 2017. 12. nababan hy, hasan m, marthias t, dhital r, rahman a, anwar i. trends and inequities in use of maternal health care services in indonesia, 1986–2012. int j womens health. 2017 dec 29;10:11– 24. doi:10.2147/ijwh.s144828 13. pemerintah perluas lokasi pemeriksaan covid-19, berikut daftarnya [government decided to expand the location for covid-19 testing, here is the list]. indonesia ministry of health; 2020. available from: http://sehatnegeriku.kemkes.go.id/baca/ rilis-media/20200320/3333441/pemerintah-perluas-lokasipemeriksaan-covid-19-berikut-daftarnya/, accessed 4 april 2020. 14. aiello ae, renson a, zivich pn. social mediaand internetbased disease surveillance for public health. annu rev public health. 2020 apr 2;41(1):101–18. doi:10.1146/annurev-publhealth-040119-094402, accessed 29 october 2020. 15. report of the who-china joint mission on coronavirus disease 2019 (covid-19). geneva: world health organization; 2020. available from: https://www.who.int/docs/default-source/coronaviruse/who-china-joint-mission-on-covid-19-final-report.pdf, accessed 1 april 2020. 5. collier n. uncovering text mining: a survey of current work on webbased epidemic intelligence. glob public health. 2012;7(7):731– 49. doi:10.1080/17441692.2012.699975 6. epidemic intelligence – systematic event detection. geneva: world health organization; 2016. available from: https://www.who.int/csr/ alertresponse/epidemicintelligence/en/, accessed 3 april 2020. 7. nhmrc centre for research excellence, integrated systems for epidemic response. available from: https://iser.med.unsw.edu.au/ epiwatch, accessed 3 april 2020. 8. kpozehouen eb, chen x, zhu m, macintyre cr. using opensource intelligence to detect early signals of covid-19 in china: descriptive study. jmir public health surveill. 2020 sep 18;6(3):e18939. doi:10.2196/18939 9. harikasidi. toddler from china treated in west nusa tenggara hospital is not a coronavirus patient. inews bali; 2020. available from: https://bali.inews.id/berita/balita-asal-china-dirawat-dirsud-ntb-negatif-virus-korona. 11. mahendradhata y, trisnantoro l, listyadewi s, soewondo p, marthias t, harimurti p, et al. the republic of indonesia health system review. vol 7, no 1. new delhi: who regional office for south-east asia; 2017. 10. covid-19 update until april 1st 2020, 09.00 gmt+7.0. indonesia ministry of health; 2020. available from: https://infeksiemerging. kemkes.go.id/category/situasi-infeksi-emerging/#.xoq3x4gzzyw, accessed 1 april 2020. https://doi.org/10.2147/ijwh.s144828 http://sehatnegeriku.kemkes.go.id/baca/rilis-media/20200320/3333441/pemerintah-perluas-lokasi-pemeriksaan-covid-19-berikut-daftarnya/ http://sehatnegeriku.kemkes.go.id/baca/rilis-media/20200320/3333441/pemerintah-perluas-lokasi-pemeriksaan-covid-19-berikut-daftarnya/ http://sehatnegeriku.kemkes.go.id/baca/rilis-media/20200320/3333441/pemerintah-perluas-lokasi-pemeriksaan-covid-19-berikut-daftarnya/ https://doi.org/10.1146/annurev-publhealth-040119-094402 https://doi.org/10.1146/annurev-publhealth-040119-094402 https://www.who.int/docs/default-source/coronaviruse/who-china-joint-mission-on-covid-19-final-report.pdf https://www.who.int/docs/default-source/coronaviruse/who-china-joint-mission-on-covid-19-final-report.pdf https://doi.org/10.1080/17441692.2012.699975 https://www.who.int/csr/alertresponse/epidemicintelligence/en/ https://www.who.int/csr/alertresponse/epidemicintelligence/en/ https://iser.med.unsw.edu.au/epiwatch https://iser.med.unsw.edu.au/epiwatch https://doi.org/10.2196/18939 https://bali.inews.id/berita/balita-asal-china-dirawat-di-rsud-ntb-negatif-virus-korona https://bali.inews.id/berita/balita-asal-china-dirawat-di-rsud-ntb-negatif-virus-korona https://infeksiemerging.kemkes.go.id/category/situasi-infeksi-emerging/#.xoq3x4gzzyw https://infeksiemerging.kemkes.go.id/category/situasi-infeksi-emerging/#.xoq3x4gzzyw https://ojs.wpro.who.int/ 1wpsar vol 12, no 3, 2021 | doi: 10.5365/wpsar.2021.12.3.836 original research a key milestone of the world health organization’s end tb strategy is a 75% reduction in deaths from tuberculosis (tb) between 2015 and 2025 worldwide.1 to achieve this, the annual decrease in the estimated global incidence rate of tb (110 per 100 000 population in 2015) should be accelerated from 2%/year in 2015 to 10%/year in 2025, and the case fatality rate among tb patients should be reduced from 15% in 2015 to 6.5% in 2025.1 in japan in 2018, the tb incidence rate was 12.3 per 100 000, corresponding to an annual reduction of 6% from 2013. the tb case fatality rate in 2017 was 22.5% in all age groups but was higher for patients aged ≥70 years (34.6% vs 4.9% for patients aged 0–69 years).3 neither indicator meets the global targets. in 2018, osaka city had the highest tb notification rate of all cities in japan, at 29.3 per 100 000 population, and the highest rate (298 per 100 000) was in the small, densely populated area of airin (21 500/0.62 km2).2 the annual reduction in the tb incidence rate in airin during 2013–2018 was 5%,2 similar to the national average. the tb case fatality rate in airin during 2015–2018 was 25.9% for all age groups, 15.5% for patients aged 0–69 years and 41.7% for patients aged ≥70 years.2 airin was a residential area during the country’s period of economic growth between the 1950s and the 1980s, accommodating japan’s largest population of day labourers, including factory, dock and construction workers. its peak population was in 1960, when there were 30 306 residents.4 during the economic recession a nishinari district public health office, osaka city, japan. b the research institute of tuberculosis, japan anti-tuberculosis association, japan. c osaka city public health office, japan. d faculty of health and nutrition, otemae university, japan. published: 16 september 2021 doi: 10.5365/wpsar.2021.12.3.836 objective: to determine the characteristics associated with mortality in patients with culture-positive pulmonary tuberculosis (ptb) in airin, osaka city, japan. methods: the characteristics of patients with culture-positive ptb registered between 2015 and 2018 in airin, osaka city, japan, were compared between those who died of all causes before or during treatment and those who completed treatment. results: of the 241 culture-positive ptb patients eligible for this study, 170 completed treatment, with negative sputum culture tests, and 62 died. the all-cause case fatality rate was 26.7% (62/232). multivariate analysis showed that mortality was associated with age ≥70 years, having a positive sputum smear, a body mass index of <18.5 and serious comorbidities such as cancer and heart and renal disease. detection of tuberculosis (tb) by screening or in an outpatient department (opd) for other diseases was inversely associated with mortality. discussion: detection of ptb by chest x-ray screening and during regular visits to opds for other diseases was associated with non-fatal tb and might contribute to early case finding. therefore, current active tb case finding and health education on regular visits to physicians for other diseases should be strengthened further for the urban poor population of osaka city, japan. factors associated with mortality among patients with culture-positive pulmonary tuberculosis in the urban poor population of osaka city, japan akira shimouchi,a,b yuko tsuda,c jun komukai,c kenji matsumoto,d hideki yoshidac and akihiro ohkadob correspondence to akira shimouchi (email: ak-shimouchi@city.osaka.lg.jp) wpsar vol 12, no 3, 2021 | doi: 10.5365/wpsar.2021.12.3.836 https://ojs.wpro.who.int/2 shimouchi et alfactors associated with mortality in tuberculosis patients comorbidity index (17 conditions) or the elixhauser score (30 comorbidities).13,14 the aim of this study was to guide interventions to reduce mortality from tb by determining the characteristics associated with mortality in patients with culture-positive ptb in airin, osaka city, between 2015 and 2018. methods study population tb is a notifiable disease under the infectious disease control law in japan; thus, physicians must report all tb cases to their local government. ptb patients registered in airin between january 2015 and december 2018 were included in the study if they were alive at diagnosis, examined by chest x-ray and were culture-positive. culture-positive ptb was defined as the presence of mycobacterium tuberculosis in cultured sputum identified by immune-chromatography or nucleic acid amplification. notifications of extrapulmonary tb were excluded, as most were not bacteriologically proven. eligible ptb patients with coexisting extrapulmonary tb such as lymphadenitis and pleuritis were included. patients who moved out of osaka city during the treatment period, in whom treatment failed (i.e. culture reversed from negative to positive or was persistently positive during treatment) or who were lost to follow-up were excluded from the analysis. data collection in routine practice, public health nurses (phns) at local public health centres record data on individual tb patients on structured patient cards, which are then entered onto an electronic spreadsheet. the data include sex, age, social condition (homeless or not), chest x-ray findings, bacteriological test results, mode of case detection and comorbidities. during interviews with the cases, phns also collect information such as height and body weight. determination of death in japan, a tb patient’s attending physician is solely responsible for diagnosing the cause of death as tb-specific or non-tb-specific. in osaka city, attending physicians in 1993, however, many lost their jobs, some became homeless and the influx of workers into airin ceased. the number of day labourers covered by insurance fell by 91.7%, from 24 458 in 1986 to 2025 in 2009.4 as a result, the population has aged, the percentage of the population aged ≥65 years increasing from 8 to 10% in 1975–1990 to 20% in 2000, 30% in 2005, 40% in 20104 and 45% in 2015.2 airin has the highest proportion of population aged ≥65 years in osaka city, where the city average was 25% in 2015.5 in 2015, the population of airin was 21 500; 81% were male, 52% were pensioners or day labourers, 43% were in a public assistance programme (pap) that provides free medical services and 5% were homeless. in comparison, 6% of the population of osaka city are in a pap. more than half of all homeless people in osaka city live in airin.2,5 consequently, the population of airin has become the oldest and the poorest in osaka city. to reduce the high tb notification rate in airin, the community tb control programme has strengthened active case finding through chest x-ray screening and directly observed treatment (dot) since 2013.2 active case finding comprises chest x-rays of all residents, including the homeless, at public health centres and in mobile units. homeless people are encouraged to be screened at various facilities, such as shelters. patients undergo chest x-ray screening during annual health checks and may also be screened in outpatient departments (opds) during visits for other diseases if the attending physician suspects tb or another respiratory disease. if any abnormal shadow is detected, further examinations are conducted, such as sputum smears for acid-fast bacilli, nucleic acid amplification, culture and computed tomography, mainly at osaka social medical center. during 2015–2018, 92.1% (290/315) of ptb patients in airin received daily dot, whereby patients take anti-tb medicines daily in front of health care staff for the duration of treatment, in hospitals or in the community.2 the patient characteristics reported to increase the rate of tb case fatality in industrialized countries include demographic factors (increased age, male sex), social factors (homelessness), clinical aspects (positive sputum smear, multidrug-resistant tb, undernutrition/underweight, inadequate treatment, hiv infection)6–12 and serious comorbidities such as those listed in the charlson wpsar vol 12, no 3, 2021 | doi: 10.5365/wpsar.2021.12.3.836https://ojs.wpro.who.int/ 3 factors associated with mortality in tuberculosis patientsshimouchi et al fined as death before or within the first 2 months of tb treatment) and late deaths (defined as death during the third month of treatment or later). the characteristics of tb-specific and non-tb-specific deaths were also compared. variables with p < 0.1 were included in binomial multivariate logistic regression analysis, and adjusted odds ratios (aor) were calculated. backward stepwise selection was applied to the binomial multivariate analysis. p < 0.05 was considered statistically significant. the univariate analysis was performed in microsoft excel® 2016, and binomial multivariate analysis was performed with spss version 11.0j for windows (spss inc., chicago, il, usa). ethical considerations the ethical review committee of the research institute of tuberculosis, japan anti-tuberculosis association, tokyo, japan, approved the study protocol (authorization number: rit/irb 2019–20). informed consent was not obtained from eligible tb patients, as it is not required by the research ethics guidelines of the japanese government when research is conducted retrospectively from de-individualized, anonymous data collected routinely by legal requirement. results between january 2015 and december 2018, 342 tb patients were registered in airin. one was diagnosed with tb at autopsy, two were clinically diagnosed and died before chest x-ray examination and 18 had extrapulmonary tb. of the remaining 321 ptb patients who underwent a chest x-ray, 241 were culture-positive and 80 were culture-negative. of the 241 culture-positive ptb cases, nine were transferred out of osaka city, and none had treatment failure or was lost to follow-up. therefore, 232 culture-positive ptb patients were included in the analysis (fig. 1). the mean age of the study participants was 66.4 years (range, 19–97), 95.7% (n = 222) were male, 51.9% (n = 121) were enrolled in pap, and 29.2% (n = 68) were homeless. there were two foreign-born patients. and medical staff at the public health office have monthly meetings at each hospital where tb patients are treated to discuss and agree on the cause of each tb patient’s death (tb or non-tb) for official records. furthermore, by police request, any death of unknown cause identified in osaka city is investigated by the osaka coroner’s office, by inspection or autopsy. variables the outcome variables for this study were (1) treatment success: treatment completed and culture negative, “cured” for smear-positive patients and “treatment completion” for smear-negative patients; and (2) death: patients who died of any cause before or during treatment. possible explanatory variables were: sex (male, female); age (<70, ≥70 years); homelessness (yes, no); cavity finding on chest x-ray (present, absent); bacteriological test results: sputum smear on ziehl-neelsen staining (positive, negative) and susceptibility to all five first-line anti-tb medicines, isoniazid, rifampicin, ethambutol, streptomycin and pyrazinamide (yes, no); body mass index (bmi) (<18.5, ≥18.5 kg/m2); detection by “active screening” (yes, no), diabetes mellitus (present, absent); and other serious comorbidities (yes, no). “detection by active screening” was defined as diagnosis from a chest x-ray during active screening or at an outpatient visit for other diseases. this was compared with all other detection categories, e.g. at an outpatient visit for tb symptoms or during hospitalization for other diseases. as diabetes mellitus was not shown to be associated with tb disease in a previous case–control study in airin in 2015–2018,15 this was analysed separately from other comorbidities. analysis to ascertain associations between the explanatory variables and mortality, univariate analysis was conducted with the χ2 test. three separate analyses were conducted against treatment success: all deaths, early deaths (dewpsar vol 12, no 3, 2021 | doi: 10.5365/wpsar.2021.12.3.836 https://ojs.wpro.who.int/4 shimouchi et alfactors associated with mortality in tuberculosis patients table 1. serious comorbidities included in the study of enrolled pulmonary tuberculosis patients, airin, osaka city, japan, 2015–2018 fig. 1. flowchart of ptb case selection for analysis cancer affected organ: stomach, liver, lung, colon, bladder, larynx heart atrial fibrillation, acute cardiac ischaemia, cardiac bypass surgery, angina pectoris, chronic heart failure, dilated cardiomyopathy, sequelae of rheumatic fever lung pulmonary fibrosis, emphysema, chronic obstructive pulmonary disease, tracheostomy, asbestosis digestive organ hepatic disorder, alcoholic liver disorder, liver cirrhosis, hepatic failure, alcoholic pancreatitis, peritonitis, intestinal ileus, gastrostomy, gastrectomy kidney renal failure, nephrotic syndrome brain sequelae of cerebral infarction neurological disorder parkinson disease systemic anaemia, chronic thyroiditis, disuse syndrome all forms of tb newly notified in airin, osaka city, 2015–2018 (n = 342) clinically diagnosed ptb dead before chest x-ray (n = 2) all forms of tb, alive (n = 341) tb, dead at notification diagnosed by autopsy (n = 1) ptb examined by chest x-ray (n = 321) eptb (n = 18) culture-positive ptb (n = 241) culture-negative ptb (n = 80) analyzed (n = 232) treatment success (n = 170) died (n = 62) not analyzed (n = 9) transferred out (n = 9) lost to follow-up/ treatment failure (n = 0) tb: tuberculosis; ptb: pulmonary tuberculosis; eptb: extrapulmonary tuberculosis. wpsar vol 12, no 3, 2021 | doi: 10.5365/wpsar.2021.12.3.836https://ojs.wpro.who.int/ 5 factors associated with mortality in tuberculosis patientsshimouchi et al table 2. univariate and multivariate analyses of characteristics associated with all deaths, early deaths and late deaths in pulmonary tuberculosis patients in airin, osaka city, 2015–2018 characteristic treatment success (n = 170) n (%) all deaths (n = 62) early deaths (n = 29) late deaths (n = 33) n (%) univariate analysis p multivariate analysis aor (95% ci) p n (%) univariate analysis p multivariate analysis aor (95% ci) p n (%) univariate analysis p multivariate analyis aor (95% ci) p sex male 165 (97.1) 57 (91.9) 0.089 0.19 (0.02–1.55) 0.122 28 (96.6) 0.883 29 (87.9) 0.019 0.11 (0.01–1.01) 0.051 female 5 (2.9) 5 (8.1) 1 (3.4) 4 (12.1) age ≥70 53 (31.2) 37 (59.7) <0.001 2.66 (1.11–6.35) 0.027 19 (65.5) <0.001 4.39 (1.32–14.63) 0.016 18 (54.5) 0.010 2.01 (0.73–5.54) 0.176 <70 117 (68.8) 25 (40.3) 10 (34.5) 15 (45.5) country of birth japan 168 (98.8) 62 (100) 0.391 29 (100) 0.557 33 (100) 0.532 other 2 (1.2) 0 0 (0) 0 (0) homeless yes 54 (31.8) 14 (22.6) 0.174 6 (20.7) 0.230 8 (24.2) 0.402 no 116 (68.2) 48 (77.4) 23 (79.3) 25 (75.8) cavity on chest x-ray yes 55 (32.4) 29 (46.8) 0.043 1.97 (0.81–4.80) 0.134 15 (51.7) 0.043 3.06 (0.90–10.46) 0.073 14 (42.4) 0.254 no 115 (67.6) 33 (53.2) 14 (48.3) 19 (57.6) sputum smear positive 107 (62.9) 55 (88.7) <0.001 5.03 (1.51–16.80) 0.008 25 (86.2) 0.014 3.82 (0.79–18.32) 0.094 30 (90.9) 0.002 7.79 (1.53–39.76) 0.013 negative 63 (37.1) 7 (11.3) 4 (13.7) 3 (9.1) susceptibility to isoniazid, rifampicin, ethambutol, streptomycin and pyrazinamide yes 150 (88.2) 55 (88.7) 0.921 25 (86.2) 0.757 30 (90.9) 0.657 no 20 (11.8) 7 (11.3) 4 (13.8) 3 (9.1) body mass index (kg/m2) <18.5 49 (29.5) 31 (59.6) <0.001 2.77 (1.17–6.53) 0.020 14 (63.6) 0.001 3.33 (1.03–10.72) 0.044 17 (56.7) 0.004 2.66 (0.98–7.25) 0.056 ≥18.5 117 (70.5) 21 (40.4) 8 (36.4) 13 (43.3) unknown 4 10 7 3 diabetes mellitus yes 37 (21.8) 12 (20.3) 0.818 5 (18.5) 0.702 7 (21.9) 0.989 no 133 (78.2) 47 (79.7) 22 (81.5) 25 (78.1) unknown 3 2 1 other serious comorbidity yes 41 (24.1) 38 (61.3) <0.001 5.56 (2.24– 13.81) <0.001 18 (62.1) <0.001 6.15 (1.79–21.13) 0.004 20 (60.6) <0.001 6.45 (2.35–17.69) <0.001 no 129 (75.9) 24 (38.7) 11 (37.9) 13 (39.4) detected by screening, including at outpatient department for other diseases yes 94 (55.3) 3 (4.8) <0.001 0.06 (0.02–0.24) <0.001 1 (3.4) <0.001 0.06 (0.01–0.49) 0.009 2 (6.1) <0.001 0.06 (0.01–0.32) <0.001 no 76 (44.7) 59 (95.2) 28 (96.6) 31 (93.9) wpsar vol 12, no 3, 2021 | doi: 10.5365/wpsar.2021.12.3.836 https://ojs.wpro.who.int/6 shimouchi et alfactors associated with mortality in tuberculosis patients 62 patients died before or during tb treatment, for a case fatality rate of 26.7%. there were 29 (46.7%) early deaths, including 3 (4.8%) before treatment, and 33 (53.2%) late deaths. of the 59 patients who died during treatment, 55 (93.2%) were hospitalized from the beginning of treatment until death. two were discharged the conditions included those listed in the charlson comorbidity index and the elixhauser comorbidity score as well as alcoholic pancreatitis, peritonitis, intestinal ileus and parkinson disease (table 1). treatment was completed by 170 patients, and table 3. univariate and multivariate analyses of characteristics of tb-specific (n = 35) and non-tb-specific deaths (n = 27) among pulmonary tb patients, airin, osaka city, 2015–2018 characteristic tb-specific deaths n (%) non-tb-specific deaths n (%) univariate analysis p multivariate analysis aor (95% ci) p sex male 35 (100%) 23 (85%) 0.019 female 0 (0%) 4 (15%) age (years) ≥70 21 (60%) 16 (59%) 0.953 <70 14 (40%) 11 (41%) homeless yes 9 (26%) 5 (19%) 0.502 no 26 (74%) 22 (81%) cavity on chest x-ray present 20 (57%) 9 (33%) 0.062 2.26 (0.73–6.94) 0.155 absent 15 (43%) 18 (67%) sputum smear positive 33 (94%) 22 (81%) 0.114 negative 2 (6%) 5 (19%) susceptible to isoniazid, rifampicin, ethambutol, streptomycin and pyrazinamide yes 31 (89%) 24 (89%) 0.969 no 4 (11%) 3 (11%) body mass index <18.5 16 (59%) 15 (60%) 0.957 ≥18.5 11 (41%) 10 (40%) unknown 8 2 diabetes mellitus yes 5 (15%) 7 (27%) 0.265 no 28 (85%) 19 (73%) unknown 2 1 other serious comorbidity yes 18 (51%) 20 (74%) 0.070 0.32 (0.10–1.03) 0.057 no 17 (49%) 7 (26%) detected by screening, including at outpatient department for other diseases yes 2 (6%) 1 (4%) 0.715 no 33 (94%) 26 (96%) early death yes 21 (60%) 8 (30%) 0.017 3.95 (1.29–12.07) 0.016 no 14 (40%) 19 (70%) wpsar vol 12, no 3, 2021 | doi: 10.5365/wpsar.2021.12.3.836https://ojs.wpro.who.int/ 7 factors associated with mortality in tuberculosis patientsshimouchi et al about half of the fatalities among ptb patients were early deaths, occurring before or within the first 2 months of treatment. similar findings were reported in australia,6 denmark,12 taiwan (china),16 spain,17 the republic of korea,18 the united kingdom19 and finland.20 we also found that a higher proportion of early deaths were tbspecific rather than non-tb-specific, which suggests that patients who survive >2 months of tb treatment have better outcomes, and late deaths are due more commonly to causes other than tb. advanced age is well recognized as a risk factor for morbidity and mortality from tb because of weakening of both the innate and adaptive immune systems.21 the presence of comorbidity has also been identified as the most common characteristic of death from tb in other developed countries, such as australia,6 denmark,12 finland,20 the netherlands,22 spain,17 singapore,23 the republic of korea,18 taiwan (china)9,11,24 and the usa.10 older people tend to be more vulnerable to comorbidity, as suggested by a one-day survey of the prevalence of morbidity in 2017 conducted by random stratified sampling in 6402 hospitals (76% of hospitals in japan), which showed that the rate of comorbidity among people aged ≥65 years was 17 times higher than among those aged 20–24 years.25 in our study, both older age and having a comorbidity were associated with ptb mortality. a bmi of <18.5 was significantly associated with all deaths and with early deaths of ptb patients in this study but not with late deaths of ptb patients. a similar finding was made in a study in taiwan (china).16 undernutrition impairs cell-mediated immunity, which increases vulnerability to specific infectious diseases, including tb.26,27 a bmi of <18.5 defines underweight and is a good proxy indicator of undernutrition. a literature review of cohort studies in the usa, europe, india, bangladesh and east asia showed that being underweight was associated with a significantly higher risk for all-cause mortality.28 in contrast, our study showed that having a positive sputum smear status was associated with all deaths and late deaths in ptb patients but not with early deaths in these patients. a review of individual patient records in our study showed that about half of smear-negative cases had treatment delays of about 2 months until the culture became positive; however, the other half of smear-negative cases had no delay in tb treatment, because other methods of sputum smear examination on from hospital but were readmitted when their general condition deteriorated just before death. five died in the community. the binomial multivariate analysis showed that, in comparison with treatment success, death of ptb patients was significantly associated with age ≥70 years, sputum smear positivity, underweight (bmi <18.5) and presence of serious comorbidity. detection of tb at screening was inversely associated with mortality. all these variables, apart from sputum smear positivity, were also significantly associated with early death in ptb patients. in the comparison of treatment success and late deaths of ptb patients, positive sputum smear and serious comorbidity were significantly associated with late death, and detection by tb screening was inversely associated with late death (table 2). of the 62 deaths, 35 were tb-specific and 27 non-tb-specific. of the tb-specific deaths, 60.0% (21/35) were early deaths. in the multivariate analysis of patient characteristics for tb-specific and non-tbspecific deaths, tb-specific deaths were associated only with early death (aor: 3.95, 95% confidence interval: 1.29; 12.07) (table 3). discussion the all-cause case fatality rate among culture-positive ptb patients in airin, osaka city, between 2015 and 2018 was 26.7%. multivariate analysis showed that age ≥70 years, a positive sputum smear, bmi <18.5 and serious comorbidity were associated with mortality in ptb patients. detection by active screening or during an opd visit for another disease was inversely associated with mortality in ptb patients. the frequency of characteristics did not differ between tb-specific and non-tb-specific deaths. similar results were reported in a much larger national study in the usa, although different methods were used to determine tb-specific deaths.10 of the fatal ptb cases in airin, 93% were in a hospital from the beginning of treatment until death. almost all (92%) of the cases during the study period received daily dot in the airin tb programme. none of the tb patients in the study failed treatment or were lost to follow-up; therefore, none of the deaths was due to treatment interruption or non-adherence, which may have contributed to deaths in other studies.8 wpsar vol 12, no 3, 2021 | doi: 10.5365/wpsar.2021.12.3.836 https://ojs.wpro.who.int/8 shimouchi et alfactors associated with mortality in tuberculosis patients the urban poor setting in osaka city, japan. attending physicians should be advised to take periodic chest x-rays for aged patients with serious comorbidities or low bmi, regardless of symptoms and even in other parts of osaka city if the facilities are available. acknowledgement the authors are grateful to the public health nurses of nishinari district public health offices for their hard work and data collection. funding this research was partly supported by the research programme on emerging and re-emerging infectious diseases of the japan agency for medical research and development, amed (reference number: 19fk0108063s0202). conflict of interest none declared. references 1. the end tb strategy. geneva: world health organization; 2015. available from: https://www.who.int/teams/global-tuberculosis-programme/the-end-tb-strategy, accessed 12 july 2021. 2. tuberculosis control in nishinari district: report of special tb project in nishinari district (in japanese). osaka: nishinari public health office; 2020. available from: https://www.osaka-pha.or.jp/ suisin_02/pdf/shimoutiakira.pdf, accessed 12 july 2021. 3. statistics of tb. 2019. tokyo: japan anti-tuberculosis association; 2019. available from: https://www.jata.or.jp/rit/ekigaku/en/statistics-of-tb/, accessed 12 july 2021. 4. mizuuchi t, hirakawa t, tominaga t, editors. fifty years’ history of the osaka prefecture urban hostels’ association: global center of excellence report series 17. osaka: osaka city university; 2011. (in japanese). available from: https://www.ur-plaza.osaka-cu.ac.jp/ wp1/wp-content/uploads/2016/06/gcoe_report17.pdf, assessed 12 july 2021. 5. 2015 population census. osaka city: statistics bureau, ministry of internal affairs and communications, japan; 2021. available from: https://www.e-stat.go.jp/en/stat-search, accessed 12 july 2021. 6. walpola hc, siskind v, patel am, konstantinos a, derhy p. tuberculosis-related deaths in queensland, australia, 1989-1998: characteristics and risk factors. int j tuberc lung dis. 2003 aug;7(8):742–50. pmid:12921150 7. shuldiner j, leventhal a, chemtob d, mor z. mortality of tuberculosis patients during treatment in israel, 2000-2010. int j tuberc lung dis. 2014 jul;18(7):818–23. doi:10.5588/ijtld.13.0591 pmid:24902558 the same day led to a diagnosis of tb, e.g. cases in which tb bacilli were confirmed by nucleic acid amplification or chest x-ray showed typical infiltration of tb. this may explain our findings. detection of tb by screening and during an opd visit for other diseases were both considered early diagnoses because these patients were unlikely to have symptoms of tb. in each of our analyses, early diagnosis was inversely associated with mortality from ptb, in that fatal ptb cases had significantly smaller odds of being detected with these early diagnosis measures. a study in norway showed that the case fatality rate of tb patients detected through passive case finding due to symptoms was 11.1% and that of immigrants, close contacts of infectious cases and others screened for tb was 6.2%, suggesting that patients who are symptomatic at diagnosis have a higher case fatality rate.29 in airin, high-risk patients have the opportunity to undergo tb screening, as medical services are available to all through universal health coverage via health insurance or pap. the limitations to this study were as follows. smoking, alcohol use and initial tb symptoms were excluded from the analysis because of lack of data, as the critical condition of patients who died early obviated questioning by phns during interviews. therefore, delayed tb diagnosis was not included in the analysis. hiv infection was not included because tb/hiv co-infection was diagnosed for only 0.4% (42/10 038) of tb patients in osaka city in 2008–2016 (unpublished data). the severity of comorbidities was determined from reported diagnoses, with no detailed clinical or laboratory test results. finally, as a special chest x-ray screening programme is available only in airin, as mentioned above, this study may not be generalizable to other parts of osaka city. conclusion old age, severe disease, undernutrition and serious comorbidities were associated with mortality of ptb patients. detection of ptb by chest x-ray screening and regular visits to opds for other diseases was associated with non-fatal tb, perhaps because they contributed to early case finding. therefore, current active tb case finding and health education on regular visits to physicians for any disease should be further strengthened in wpsar vol 12, no 3, 2021 | doi: 10.5365/wpsar.2021.12.3.836https://ojs.wpro.who.int/ 9 factors associated with mortality in tuberculosis patientsshimouchi et al 18. min j, kim js, kim hw, shin ay, koo hk, lee ss, et al. clinical profiles of early and tuberculosis-related mortality in south korea between 2015 and 2017: a cross-sectional study. bmc infect dis. 2019 aug 22;19(1):735. doi:10.1186/s12879-019-4365-9 pmid:31438876 19. pedrazzoli d, kranzer k, thomas hl, lalor mk. trends and risk factors for death and excess all-cause mortality among notified tuberculosis patients in the uk: an analysis of surveillance data. erj open res. 2019 dec 16;5(4):00125. doi:10.1183/23120541.00125-2019 pmid:31857993 20. korhonen v, lyytikäinen o, ollgren j, soini h, vasankari t, ruutu p. risk factors affecting treatment outcomes for pulmonary tuberculosis in finland 2007-2014: a national cohort study. bmc public health. 2020 aug 17;20(1):1250. doi:10.1186/s12889020-09360-7 pmid:32807112 21. byng-maddick r, noursadeghi m. does tuberculosis threaten our ageing populations? bmc infect dis. 2016 mar 11;16(1):119. doi:10.1186/s12879-016-1451-0 pmid:26968654 22. borgdorff mw, veen j, kalisvaart na, nagelkerke n. mortality among tuberculosis patients in the netherlands in the period 1993-1995. eur respir j. 1998 apr;11(4):816–20. doi:10.1183/ 09031936.98.11040816 pmid:9623682 23. low s, ang lw, cutter j, james l, chee cbe, wang yt, et al. mortality among tuberculosis patients on treatment in singapore. int j tuberc lung dis. 2009 mar;13(3):328–34. pmid:19275792 24. yen yf, yen my, shih hc, hu bs, ho bl, li lh, et al. prognostic factors associated with mortality before and during anti-tuberculosis treatment. int j tuberc lung dis. 2013 oct;17(10):1310–6. doi:10.5588/ijtld.12.0888 pmid:24025383 25. outline of patient survey 2017. tokyo: ministry of health, labour and welfare; 2017. available from: https://www.mhlw.go.jp/toukei/list/10-20.html, accessed 12 july 2021. 26. chandra rk. nutritional deficiency and susceptibility to infection. bull world health organ. 1979;57(2):167–77. pmid:108017 27. chandra rk. numerical and functional deficiency in t helper cells in protein energy malnutrition. clin exp immunol. 1983 jan;51(1):126–32. pmid:6219837 28. flegal km, kit bk, graubard bi. body mass index categories in observational studies of weight and risk of death. am j epidemiol. 2014 aug 1;180(3):288–96. doi:10.1093/aje/kwu111 pmid:24893710 29. farah mg, tverdal a, steen tw, heldal e, brantsaeter ab, bjune g. treatment outcome of new culture positive pulmonary tuberculosis in norway. bmc public health. 2005 feb 7;5(1):14. doi:10.1186/1471-2458-5-14 pmid:15698472 8. nahid p, jarlsberg lg, rudoy i, de jong bc, unger a, kawamura lm, et al. factors associated with mortality in patients with drugsusceptible pulmonary tuberculosis. bmc infect dis. 2011 jan 3;11(1):1. doi:10.1186/1471-2334-11-1 pmid:21199579 9. yen yf, chuang ph, yen my, lin sy, chuang p, yuan mj, et al. association of body mass index with tuberculosis mortality, a population-based follow-up study. medicine (baltimore). 2016 jan;95(1):e2300. doi:10.1097/md.0000000000002300 pmid:26735532 10. hannah ha, miramontes r, gandhi nr. sociodemographic and clinical risk factors associated with tuberculosis mortality in the united states, 2009–2013. public health rep. 2017 may/jun;132(3):366–75. doi:10.1177/0033354917698117 pmid:28394707 11. wu yc, lo hy, yang sl, chu dc, chou p. comparing the factors correlated with tuberculosis-specific and non-tuberculosis-specific deaths in different age groups among tuberculosis-related deaths in taiwan. plos one. 2015 mar 3;10(3):e0118929. doi:10.1371/ journal.pone.0118929 pmid:25734444 12. holden ik, lillebaek t, andersen ph, wejse c, johansen is. characteristics and predictors for tuberculosis related mortality in denmark from 2009 through 2014: a retrospective cohort study. plos one. 2020 jun 4;15(6):e0231821. doi:10.1371/journal. pone.0231821 pmid:32497102 13. sundararajan v, henderson t, perry c, muggivan a, quan h, ghali wa. new icd-10 version of the charlson comorbidity index predicted in-hospital mortality. j clin epidemiol. 2004 dec;57(12):1288–94. doi:10.1016/j.jclinepi.2004.03.012 pmid:15617955 14. li b, evans d, faris p, dean s, quan h. risk adjustment performance of charlson and elixhauser comorbidities in icd-9 and icd10 administrative databases. bmc health serv res. 2008 jan 14;8(1):12. doi:10.1186/1472-6963-8-12 pmid:18194561 15. shimouchi a, tsuda y, komukai j, matsumoto k, yoshida h, ohkado a. characteristics of individuals with tuberculosis in an urban, poor population in osaka city, japan – a case-control study. 2020;11(1):22–8. doi:10.5365/wpsar.2018.9.1.005. pmid:32963888 16. lai hh, lai yj, yen yf. y yf. association of body mass index with timing of death during tuberculosis treatment. plos one. 2017 jan 13;12(1):e0170104. doi:10.1371/journal.pone.0170104 pmid:28085951 17. rodrigo t, casals m, caminero ja, garcía-garcía jm, jiménezfuentes ma, medina jf, millet jp, ruiz-manzano j, caylá j, working group of the integrated programme of tuberculosis research. factors associated with fatality during the intensive phase of antituberculosis treatment. plos one. 2016 aug 3;11(8):e0159925. doi:10.1371/journal.pone.0159925 pmid:27487189 findings and lessons from establishing zika virus surveillance in southern viet nam, 2016 original research lan trong phan,a quang chan luong,a thi hong hien do,b cindy h chiu,b,c thang minh cao,a thao thi thanh nguyen,a hai thanh diep,a thao phuong huynh,a dung tri nguyen,d nga hong le,d satoko otsu,b phu dac tran,e thuong vu nguyena and masaya katof a pasteur institute, ho chi minh city, viet nam. b world health organization viet nam country office, viet nam. c tohoku university graduate school of medicine, japan. d preventive medicine centre, ho chi minh city, viet nam. e general department of preventive medicine, ministry of health, viet nam. f world health organization regional office for the western pacific, philippines. correspondence to quang chan luong (email: lcq33new@gmail.com). to cite this article: phan lt, luong qc, do thh, chiu ch, cao tm, thanh tt, et al. findings and lessons from establishing zika virus surveillance in southern viet nam, 2016. 2019 may;10(2). doi:10.5365/wpsar.2018.9.2.014 abstract objective: to document the evolution and optimization of the zika virus (zikv) disease surveillance system in southern viet nam in 2016 and to describe the characteristics of the identified zikv-positive cases. methods: we established a sentinel surveillance system to monitor zikv transmission in eight sites in eight provinces and expanded the system to 71 sites in 20 provinces in southern viet nam in 2016. blood and urine samples from patients who met the case definition at the sentinel sites were tested for zikv using real-time reverse transcription polymerase chain reaction at the pasteur institute in ho chi minh city (pi-hcmc). we conducted descriptive analysis and mapped the zikv-positive cases. results: in 2016, 2190 specimens from 20 provinces in southern viet nam were tested for zikv at pi-hcmc; 626 (28.6%), 484 (22.1%), 35 (1.6%) and 1045 (47.7%) tests were conducted in the first, second, third and fourth quarters of the year, respectively. of these tested specimens, 214 (9.8%) were zikv positive with 212 (99.1%) identified in the fourth quarter. in the fourth quarter, the highest positivity rate was those in age groups 30–39 years (30.0%) and 40–59 years (31.6%). of the 214 zikv-positive patients, 210 (98.1%) presented with rash, 194 (90.7%) with fever, 149 (69.6%) with muscle pain, 123 (57.5%) with joint pain and 66 (30.8%) with conjunctivitis. discussion: the surveillance system for zikv disease underwent several phases of optimization in 2016, guided by the most up-to-date local data. here we demonstrate an adaptable surveillance system that detected zikv-positive cases in southern viet nam. objective in viet nam, although zika virus (zikv) disease was not listed as a nationally notifiable disease before 2016, previous literature suggests that it is not a new disease in the country. there has been evidence of possible transmission of zikv disease dating as far back as 1954 when neutralizing antibodies against zikv were detected in the indigenous population in northern viet nam.1 more recently, a study that retrospectively tested 5617 dengue-negative serum samples collected at seven hospital outpatient departments in 2010–2014 in southern viet nam also identified zikv-positive cases from 2013.2 when zika disease was declared by the world health organization (who) as a public health emergency of international concern (pheic) in 2016,3 several zikv-positive cases of travellers who visited viet nam before symptom onset were reported.4–6 in response to who’s declaration of pheic, viet nam responded swiftly in rolling out zika surveillance, prevention and control guidelines on 2 february 2016 and the zika diagnosis and treatment guidelines on 5 february 2016 (see fig. 1).7,8 in march 2016, two cases of autochthonous transmission of zikv infection were detected in nha trang and ho chi minh city (hcmc) and reported to who.9 the case in hcmc was a pregnant woman who had fetal demise at week nine of her pregnancy.10 in june 2016, an infant, born in dak lak, viet nam,11 was the first and only known case of microcephaly potentially linked to zikv infection in viet nam. the zikv disease surveillance data are critical to better understand the local outbreak and to guide the appropriate level of response. as with any new surveillance system, adjustments may be needed as part of the optimization process. surveillance for zikv infection was initially based on existing dengue virus disease surveillance; however, given the largely asymptomatic and mild clinical presentation of zikv disease, an independent surveillance strategy specifically tailored for zikv disease was needed. as the local and international situations evolved, viet nam also adjusted its surveillance approach and expanded the number of zikv disease surveillance sites in southern viet nam where the majority of the cases occurred. fig. 1. timeline of key events related to the zikv outbreak internationally and in viet nam, 2016 click to download figure 1. jpg, 638kb the objectives of this paper were to document the evolution and optimization of the zikv disease surveillance system in southern viet nam in 2016 and to describe the characteristics of the zikv-positive cases identified through the surveillance system. we hope that by sharing our lessons we can highlight the practical realities of implementing a new surveillance system for a re-emerging disease in the context of a rapidly evolving international public health emergency and a local zikv disease outbreak. methods epidemiological surveillance surveillance sites a sentinel surveillance system to monitor zikv transmission in southern viet nam was established using a phased approach in 2016 (fig. 1). sentinel sites were gradually expanded from an initial eight sites in eight provinces in february 2016 to 71 sites in 20 provinces by november 2016 (fig. 1). in phase i, the surveillance system was first established using the existing dengue sentinel surveillance system. we targeted eight southern provinces deemed as high-risk areas for active transmission of zika with the assumption that high-risk areas for dengue transmission would also be high-risk areas for zika transmission. high-risk areas were selected based on three factors based on the guidance from the ministry of health and national program for dengue control: 1) the epidemiology of dengue fever (>100 dengue cases per 100 000 population); 2) the aedes aegypti mosquito density index (>0.5 female mosquito per house per day); and 3) the tourist flow (presence of international and domestic transportation and famous sites frequented by tourists). in each of the eight selected provinces, one existing surveillance site at either a provincial or district hospital was selected and began case finding from 15 february 2016 (fig. 1). one month later, in phase ii, sentinel surveillance was rolled out in hcmc, the largest city in southern viet nam. the roll-out included all district hospitals in the city (fig. 1). from may 2016, in phase iii, the remaining 12 provinces in southern viet nam also began implementing the sentinel zikv surveillance system in at least one district hospital per province. by november 2016, when zikv-positive cases peaked in hcmc, the zikv surveillance system had been further expanded to all four city obstetrics hospitals (fig. 1). in addition, eight commune health stations and 15 private clinics participated in the sentinel surveillance system in the fourth quarter of 2016. case definitions all outpatients meeting the case definition at each sentinel hospital were included in our analysis. in 2016, the viet nam ministry of health issued an initial and a revised official case definitions guided by the international outbreak situation and local data from viet nam, as listed in table 1. table 1. zikv surveillance case definitions used in viet nam, february–december 2016 click to download table 1. jpg, 538kb case investigation we conducted case investigations and interviewed the patients who met the case definition using a one-page, semi-structured questionnaire to obtain and confirm information on their socio-demographic characteristics, signs and symptoms, dates of symptom onset and travel histories. laboratory testing we collected blood and urine samples from patients who met the case definition. on the same day, we sent the specimens to the pasteur institute in hcmc (pi-hcmc) where testing was conducted once per week for zikv. a patient was defined as a zikv-positive case when zikv was detected using real-time reverse transcription polymerase chain reaction (rt–pcr) with trioplex reagents provided by the united states centers for disease control and prevention. the zikv testing procedure was developed in accordance with the primer and probe sequences as described previously by lanciotti et al.12 data collection and analysis questionnaire data and test results were first collected on paper forms and later entered and analysed in microsoft excel. we conducted descriptive analysis to examine the data by person, place and time. spot mapping was conducted using arcgis (esri, redlands, ca, usa) to look at the geographical spread of zikv-positive cases over time. ethical approval the data presented in this manuscript were for public health surveillance13 and not research; therefore, approval from an ethics committee was not sought. results in total, 2190 specimens from 20 provinces in southern viet nam were tested for zikv at pi-hcmc in 2016; 626 (28.6%) tests were performed in quarter 1; 484 (22.1%) tests in quarter 2; 35 (1.6%) tests in quarter 3; and 1045 (47.7%) tests in quarter 4. two distinct waves of zikv-positive cases occurred in 2016 (fig. 2). a total of 214 (9.8%) of the 2190 tested specimens were positive for zikv. of the 214 zikv-positive specimens, the majority were identified in quarter 4 (n = 212, 99.1%). the positivity rate was 0.2% in quarter 1 (1 positive among 626 samples tested), 0% in quarter 2 (0 positive among 484 samples tested), 2.9% in quarter 3 (1 positive among 35 samples tested) and 20.3% in quarter 4 (212 positive among 1045 samples tested). fig. 2. number of zikv tests performed, number of specimens tested positive, and positivity rate by administrative level of facility, southern viet nam, 2016 click to download figure 2. jpg, 416kb most (n = 1749; 79.9%) of the specimens were collected at district hospitals where 173 (9.9%) tested positive; 407 (18.6%) specimens were collected at regional and provincial facilities where 35 (8.6%) specimens tested positive for zikv. these facilities included infectious disease hospitals, obstetrics and gynaecology hospitals, paediatric hospitals, provincial general hospitals and provincial preventive medicine centres. during the quarter with the highest incidence (quarter 4), a small number (n = 32; 1.5%) of specimens were obtained from one commune health station (n = 5; 0.2%) and private clinics (n = 27; 1.2%) in one of the sentinel districts (district 2); of these 32 specimens, 6 (18.8%) tested positive (1 [3.1%] from commune health stations and 5 [15.6%] from private clinics.) the positivity rate in quarter 4 was similar across levels of facilities: 20.2% at regional and provincial facilities, 20.4% at district facilities and 18.8% at commune health station and private clinics (fig. 2). the characteristics of the individuals tested for zikv and those tested positive are summarized in table 2. pregnant women had relatively high positivity rates compared to others tested during the year (22.9%) and in quarter 4 specifically (24.6%). in children and non-pregnant women, the positivity rate in quarter 4 was more than double that of the year as a whole. the positivity rates in non-pregnant women and men were similar (8.7% versus 8.0% in the whole year; 18.8% versus 20.2% in quarter 4). those in age groups 30–39 and 40–59 had the highest positivity rate at 16.5% and 14.8% in the whole year and 30.0% and 31.6% in quarter 4, respectively. fewer children under 15 years of age were tested than adults, and the positivity rate for children was 0.7% during the whole year and 3.4% in quarter 4. of the 145 children aged 5–9 years old who were tested, none tested positive for zikv. table 2. demographics of individuals tested for zikv and those with laboratory-confirmed zikv infection, southern viet nam, 2016 click to download table 2. jpg, 348kb the positivity rate was higher in hcmc than in other provinces in southern viet nam in 2016 (13.6% versus 2.8%) and in quarter 4 (24.4% versus 8.6%) (table 2). within hcmc, the positive cases were concentrated in certain districts (fig. 3): binh thanh district, district 2 and district 12 had the highest number of positive cases detected in 2016 and in quarter 4. fig. 3. spot map of confirmed zikv-positive cases identified through the zikv surveillance system, ho chi minh city, southern viet nam, 2016 click to download figure 3. jpg, 352kb a patient can often present with multiple symptoms. of the 214 patients who were positive for zikv infection, 210 (98.1%) presented with rash, 194 (90.7%) with fever, 149 (69.6%) with muscle pain, 123 (57.5%) with joint pain and 66 (30.8%) with conjunctivitis (data not shown). discussion in this article, we presented initial efforts to roll out and optimize the surveillance system for zikv disease in southern viet nam in 2016 and described our early surveillance data. the surveillance system for zikv disease underwent several phases of optimization in 2016, guided by the most up-to-date local data. in phase i, pi-hcmc had initially explored integrating zikv testing with the existing dengue surveillance. inpatients with clinically suspected dengue who tested negative for dengue by nonstructural protein 1 or viral culture in 2015 were tested for zikv using rt–pcr. all 96 dengue-negative patients were negative for zikv (unpublished data). based on this data, in phase ii we decided to implement a dedicated surveillance system for zikv that focused on the outpatient ward where patients with milder clinical presentations seek medical care. we believed that this approach was more appropriate than integrating zikv surveillance into existing dengue surveillance that is primarily focused on more severe cases from inpatient wards. focusing on mild cases was also supported by evidence that everyone diagnosed with zikv disease outside of viet nam after travelling to the country had only mild symptoms.4–6 in phase iii, after successfully detecting zikv-positive cases in outpatient departments, particularly at district hospitals, zikv surveillance was gradually expanded throughout southern viet nam, focusing on outpatient services at district hospitals in hcmc. in addition, the surveillance case definition was adjusted based on our initial analysis of symptoms associated with zikv-positive patients, and guided by the latest literature, which showed a high prevalence of rash in zikv-positive patients relative to fever, joint pain, muscle pain and conjunctivitis.14 our approaches were in line with those proposed by the asia pacific strategy for emerging diseases and public health emergencies,15 which suggests surveillance systems should be effective, efficient, flexible and promptly adaptable to new available information and needs before, during and after events. in the rapidly changing contexts of an ongoing outbreak, viet nam demonstrated flexibility by shifting sampling sites from inpatient to outpatient services and revising case definitions as new knowledge became available. here, we demonstrate that the surveillance system established during the event in 2016 successfully detected zikv-positive cases in southern viet nam. the number of zikv-positive results increased markedly in quarter 4, likely reflecting an actual increase in zikv transmission during this period. however, the increase could also be due to other contributing factors, including those that may have enhanced the ability of the surveillance system to more efficiently detect zikv infections. first, since fewer specimens were tested in quarter 3 due to resource constraints, zikv infections may have been under-detected in that quarter, leading to a more dramatic increase in zikv infections in quarter 4. second, the number of surveillance sites doubled from 32 in march to 71 in november, alongside a gradual decentralization of surveillance sites, which resulted in a higher proportion of specimens being collected from district facilities. third, a new case definition with rash being the primary symptom was first introduced in some district hospitals in march 2016 and was formally implemented across all surveillance sites from august 2016 after accumulating evidence suggested that this could be a better case definition to identify more zikv-positive cases. evolution of the surveillance system may have led to increased efficiency in detecting zikv-positive cases. data from quarter 4 showed that the positivity rate was similar across regional, provincial and district-level facilities. this result suggests that people with zikv infection are attending various types of health facilities, and our ability to detect zikv infection might be similar across different levels of health facilities. in one of the sentinel districts (district 2), sample collection was experimentally decentralized to the commune health station and private clinics in quarter 4. the decentralized sample collection had a similar positivity rate of zikv infection. however, the large majority of cases in 2016 in hcmc were from district hospitals. therefore, we expect that district-level facilities will continue to play a central role in the surveillance system for zikv disease in southern viet nam. our data suggested the number of the reported cases differed considerably among districts and the reported cases concentrated in certain districts in hcmc. careful interpretation is needed to understand such results since several factors could influence the level of case detection to varying degrees. it would be reasonable to consider that there were clusters of active transmission in certain districts. however, the geographical differences could also be due to other factors such as the selection of sentinel sites and the case definition not being applied consistently across hospitals by different clinicians. in addition, intensified guidance from national and local authorities following the zikv disease outbreak in singapore in september 2016 may have raised clinicians’ awareness levels and made it more likely for them to collect and test specimens for zikv infections. our results showed that adults, especially those aged 30–59 years, were more affected by zikv infection than children. this finding is consistent with previous literature that suggests that children with zikv infections generally experience mild symptoms.16 however, our results contrast with the age distribution of dengue infection, showing that children are more affected by dengue than adults in southern viet nam.18 one possible explanation is that the adult population of southern viet nam may have largely developed immunity against dengue, which has been hypothesized to enhance zikv infection through antibody-dependent enhancement.19 ongoing zikv seroprevalence surveys in southern viet nam may provide a better understanding of population immunity against zikv. the first year of zikv surveillance in southern viet nam provided critical evidence that will inform surveillance and response efforts in viet nam and other countries, and offered important lessons in optimizing zikv surveillance systems. viet nam’s approach of focusing on outpatient services of health care facilities effectively detected zikv-positive cases. however, both the fluctuation in the number of tests performed and the change in case definition made it challenging to interpret trends in local transmission. in addition, given that the zikv-positive cases were identified based on the symptoms listed in the case definition, the symptoms of the zikv-positive cases shown here may not be representative of all zikv-infected individuals. moving forward, it may be necessary to prioritize the surveillance approach based on resource availability, especially given the high cost of the current molecular testing methodology using zikv pcr. based on our data, we believe there may be two future directions for zikv surveillance to achieve two separate but interrelated objectives. first, viet nam may consider monitoring transmission trends by establishing sentinel sites to detect all individuals who meet the case definition, irrespective of age and sex. based on the system described here, which was developed in response to who’s pheic declaration for zika, the ministry of health of viet nam developed guidelines in 2017 for an ongoing, integrated chikungunya-dengue-zika (cdz) sentinel surveillance system.20 second, depending on resource availability, it is important to prioritize zika testing and surveillance for pregnant women presenting with symptoms consistent with the case definition, regardless of whether they are from sentinel sites or other health facilities to better detect pregnancies that are at risk for microcephaly. in 2017, viet nam developed guidelines for all obstetric clinics and hospitals to register, investigate and report pregnancy courses and outcomes of mothers with confirmed zikv and babies with microcephaly;21 however, fewer laboratory samples than expected have been collected and tested for zikv to date. therefore, it would be pertinent to continue to strengthen the implementation of the guidelines. in addition to the zikv surveillance activities, we believe full genome sequencing of selected specimens in southern viet nam may also shed light on the phylogenetic lineage of circulating zikv in the country. conclusions in our interconnected world, all countries are becoming increasingly aware of the borderless nature of emerging and re-emerging infectious diseases. monitoring a new disease in the population requires establishing a surveillance system in the context of many unknowns while ensuring flexibility of surveillance systems to adapt to changing information and needs. here, we demonstrate an adaptable sentinel surveillance system for zikv disease in viet nam, where it was optimized in a phased approached in 2016, using the most up-to-date local data. we hope that in sharing viet nam’s experiences with zikv surveillance we can document what is often missing in the literature: the real-world challenges faced in public health and the practical solutions needed to conquer these obstacles. acknowledgements we would like to thank all the clinical and public health staff at national, regional, city, provincial and district facilities who contributed to the surveillance activities. we would also like to thank dr anthony mounts from the united states centers for disease control and prevention for his technical advice and collaboration and mr michael o’leary from the united states agency for international development for his support for zika-related activities. funding this surveillance activity was funded by the world health organization, the united states centers for disease control and prevention and the united states agency for international development. conflicts of interest the authors have no competing interests or financial conflicts. references pond wl. anthropod-borne virus antibodies in sera from residents of south-east asia. trans r soc trop med hyg. 1963 sep;57(5):364–71. doi:10.1016/0035-9203(63)90100-7 pmid:14062273 quyen nth, kien dth, rabaa m, tuan nm, vi tt, van tan l, et al. chikungunya and zika virus cases detected against a backdrop of endemic dengue transmission in vietnam. am j trop med hyg. 2017 jul;97(1):146–50. doi:10.4269/ajtmh.16-0979 pmid:28719300 who statement on the first meeting of the international health regulations (2005) (ihr 2005) emergency committee on zika virus and observed increase in neurological disorders and neonatal malformations − 1 february 2016. geneva: world health organization; 2016 (https://www.who.int/mediacentre/news/statements/2016/1st-emergency-committee-zika/en/). hashimoto t, kutsuna s, tajima s, nakayama e, maeki t, taniguchi s, et al. importation of zika virus from vietnam to japan, november 2016. emerg infect dis. 2017 jul;23(7):1223–5. doi:10.3201/eid2307.170519 pmid:28445122 katanami y, kutsuna s, taniguchi s, tajima s, takaya s, yamamoto k, et al. detection of zika virus in a traveller from vietnam to japan. j travel med. 2017 sep 1;24(5). doi:10.1093/jtm/tax031 pmid:28498965 meltzer e, lustig y, leshem e, levy r, gottesman g, weissmann r, et al. zika virus disease in traveler returning from vietnam to israel. emerg infect dis. 2016 aug;22(8):1521–2. doi:10.3201/eid2208.160480 pmid:27331627 guidelines on surveillance and prevention and control of zika virus disease 2 february 2016. hanoi: ministry of health of the socialist republic of viet nam; 2016 (https://thuvienphapluat.vn/van-ban/the-thao-y-te/quyet-dinh-3792-qd-byt-huong-dan-giam-sat-phong-chong-benh-do-vi-rut-zika-2016-317999.aspx, accessed 12 apr 2019). guidelines on diagnosis and treatment of zika virus disease 5 february 2016. hanoi: ministry of health of the socialist republic of viet nam; 2016 (https://thuvienphapluat.vn/van-ban/the-thao-y-te/quyet-dinh-439-qd-byt-huong-dan-chan-doan-dieu-tri-benh-do-vi-rut-zika-302367.aspx, accessed 12 apr 2019). zika virus infection viet nam 12 april 2016. geneva: world health organization; 2016 (https://www.who.int/csr/don/12-april-2016-zika-viet-nam/en/). lan pt, quang lc, huong vtq, thuong nv, hung pc, huong ttln, et al. fetal zika virus infection in vietnam. plos curr. 2017 sep 5;9:9. pmid:29188136 moi ml, nguyen ttt, nguyen ct, vu tbh, tun mmn, pham td, et al. zika virus infection and microcephaly in vietnam. lancet infect dis. 2017 aug;17(8):805–6. doi:10.1016/s1473-3099(17)30412-7 pmid:28741545 lanciotti rs, kosoy ol, laven jj, velez jo, lambert aj, johnson aj, et al. genetic and serologic properties of zika virus associated with an epidemic, yap state, micronesia, 2007. emerg infect dis. 2008 aug;14(8):1232–9. doi:10.3201/eid1408.080287 pmid:18680646 who guidelines on ethical issues in public health surveillance. geneva: world health organization; 2017 (https://www.who.int/ethics/publications/public-health-surveillance/en/). musso d, gubler dj. zika virus. clin microbiol rev. 2016 jul;29(3):487–524. doi:10.1128/cmr.00072-15 pmid:27029595 asia pacific strategy for emerging diseases and public health emergencies (apsed iii): advancing implementation of the international health regulations (2005). manila: who regional office for the western pacific; 2017 (http://iris.wpro.who.int/bitstream/handle/10665.1/13654/9789290618171-eng.pdf). goodman ab, dziuban ej, powell k, bitsko rh, langley g, lindsey n, et al. characteristics of children aged 10.15585/mmwr.mm6539e2 pmid:27711041 cao-lormeau vm, roche c, teissier a, robin e, berry al, mallet hp, et al. zika virus, french polynesia, south pacific, 2013. emerg infect dis. 2014 jun;20(6):1085–6. doi:10.3201/eid2006.140138 pmid:24856001 dengue fact sheet [2 february 2018]. ha noi: who representative office in viet nam; 2018 (http://www.wpro.who.int/vietnam/topics/dengue/factsheet/en/). dejnirattisai w, supasa p, wongwiwat w, rouvinski a, barba-spaeth g, duangchinda t, et al. dengue virus sero-cross-reactivity drives antibody-dependent enhancement of infection with zika virus. nat immunol. 2016 sep;17(9):1102–8. doi:10.1038/ni.3515 pmid:27339099 guidelines on the integrated chikungunya-dengue-zika (cdz) sentinel surveillance system – 3 july 2017. hanoi: ministry of health of the socialist republic of viet nam; 2017 (https://thuvienphapluat.vn/van-ban/the-thao-y-te/quyet-dinh-3091-qd-byt-2017-giam-sat-long-ghep-sot-xuat-huyet-dengue-vi-rut-zika-chikungunya-353831.aspx, accessed 12 apr 2019). guidelines on the surveillance of microcephaly in foetus and the infants exposed to zika – 13 april 2017. hanoi: ministry of health of the socialist republic of viet nam; 2017 (https://thuvienphapluat.vn/van-ban/the-thao-y-te/quyet-dinh-1425-qd-byt-giam-sat-hoi-chung-dau-nho-o-thai-nhi-va-tre-so-sinh-do-vi-rut-zika-2017-346513.aspx, accessed 12 apr 2019). epidemiology of vaccine-preventable diseases in japan: considerations for pre-travel advice for the 2019 rugby world cup and 2020 summer olympic and paralympic games original research matthew m. griffith,a munehisa fukusumi,a yusuke kobayashi,b yusuke matsui,b shingo nishiki,b reiko shimbashi,b saeko morino,a tomimasa sunagawa,a keiko tanaka-taya,a tamano matsuia and kazunori oishia a infectious disease surveillance center, national institute of infectious diseases, tokyo, japan. b field epidemiology training program, national institute of infectious diseases, tokyo, japan. correspondence to matthew griffith (email:griffith@niid.go.jp). to cite this article: griffith m, fukusumi m, kobayashi y, matsui y, nishiki s, shimbashi r, et al. epidemiology of vaccine-preventable diseases in japan: considerations for pre-travel advice for the 2019 rugby world cup and 2020 summer olympic and paralympic games. western pac surveill response j. 2018 june;9(2). doi:10.5365/wpsar.2017.8.4.002 abstract introduction: in 2019 and 2020, japan will host two international sporting events estimated to draw a combined 22 million visitors. mass gatherings like these ones increase the risk of spread of infectious disease outbreaks and international transmission. pre-travel advice reduces that risk. methods: to assist ministries of health and related organizations in developing pre-travel advice, we summarized national surveillance data in japan (2000–2016, to the extent available) for rubella, invasive pneumococcal disease, measles, non-a and non-e viral hepatitis, hepatitis a, invasive haemophilus influenzae disease, tetanus, typhoid fever, invasive meningococcal disease, japanese encephalitis, influenza, varicella, mumps and pertussis by calculating descriptive statistics of reported cases and reviewing trends. (see annex a for details of reviewed diseases.) results: our findings showed notable incidences of rubella (1.78 per 100 000 person-years), influenza (243.5 cases per sentinel site), and mumps (40.1 per sentinel site); seasonal increases for influenza (november–may) and japanese encephalitis (august–november); and a geographical concentration of japanese encephalitis in western japan. measles cases decreased from 11 013 in 2008 to 35 in 2015, but outbreaks (n = 165 cases) associated with importation occurred in 2016. though invasive meningococcal disease incidence was only 0.03 per 100 000, international transmission occurred at a mass gathering in japan in 2015. discussion: ministries of health and related organizations should use these findings to develop targeted pre-travel advice for travellers to the 2019 rugby world cup and the 2020 summer olympic and paralympic games, especially for mumps, measles, rubella, influenza, and meningitis. travellers with increased exposure risk should also be advised about hepatitis a and japanese encephalitis. introduction the 2019 rugby world cup will occur from 20 september to 2 november throughout japan, and the 2020 summer olympic and paralympic games will happen in tokyo from 24 july to 6 september. these mass gatherings (mgs) are estimated to attract 22 million visitors to japan.1 mgs like these can strain resources of the host country and have been associated with disease outbreaks and the international spread of disease.2-4 the world health organization (who) and centers for disease control and prevention (cdc) recommend travellers seek advice from health professionals before travelling to an mg.5,6 this strategy has been associated with a twofold increase in vaccinations among hajj pilgrims who seek such advice compared to those who do not.7 up-to-date vaccination for all vaccine-preventable diseases (vpds) is the best way to prevent illness, outbreaks and the international spread of disease. to assist ministries of health and other organizations in developing targeted pre-travel advice for these mgs, we aimed to summarize the recent epidemiology of selected vpds in japan. methods we selected diseases based on frequency, severity and potential immunity (i.e. likelihood that foreign travellers to japan would have developed immunity against the disease before visiting japan because of wide circulation of the pathogen or global vaccination trends) among visitors to japan. we obtained data from the national epidemiological surveillance of infectious diseases (nesid) system for a period of at least eight years up to the latest finalized data (for most diseases 2015; years inclusive unless otherwise noted). national notifiable disease surveillance comprises passive case-based reporting from all health-care facilities in japan. for this work, we selected rubella, invasive pneumococcal disease, measles, viral hepatitis non-e and non-a, hepatitis a, invasive haemophilus influenzae disease, tetanus, typhoid, invasive meningococcal disease and japanese encephalitis. nesid also has weekly sentinel surveillance from approximately 3000 paediatric clinics for some diseases. of these, we selected varicella, mumps, pertussis and influenza. an additional 2000 adult outpatient clinics report influenza. we gathered data on case totals by sex, age group, prefecture, and week and year of report. when available, we obtained clinical disease classifications (e.g. modified measles), vaccination history, the suspected location or route of infection and laboratory results. for influenza and varicella, we obtained counts of hospitalized cases with laboratory evidence of infection. influenza cases have been reported from hospitals with more than 300 beds since 2011 and varicella cases from all hospitals since september 2014. we calculated totals, proportions, ranges, and incidence per 100 000 person-years using annual population estimates from japan's statistics bureau,8 applying relevant proportions for incomplete years. for sentinel diseases, we calculated mean cases reported per sentinel site because catchment population sizes were unavailable. to further contextualize the findings, we briefly described current vaccination policies. for detailed case definitions and additional disease information, see annex b. results vpds under national notifiable disease surveillance (non-sentinel) rubella (2008–2015) for the period reviewed, approximately 79% of the reported rubella cases occurred in 2013 (n = 14 344). the 2013 epidemic affected all 47 prefectures and comprised mostly males (76%; n = 10 972) and persons aged 20–44 years (70%; n = 10 055). cases for the overall period were also mostly male (75%; n = 13 660) and aged 20–44 years (69%; n = 12 440). for 2015, cases with known vaccination history (n = 74; 45%) were typically undervaccinated: 49% (n = 36) unvaccinated, including four individuals too young to vaccinate, and 41% (n = 30) with one dose. the incidence of rubella for the reviewed period was 1.78 cases per 100 000 person-years (n = 18 117) (see table 1). since april 2006, the routine vaccination schedule has included two doses of measles-rubella (mr) vaccine: the first dose at 1 year of age and the second dose less than 1 year before entering primary school (typically age 5 or 6). prior to 2006, a single rubella dose had been routine for 11–12-year-old girls since 1977. doses for both sexes aged 12–89 months and for boys 11–12 years old were added in 1995. table 1. incidence and characteristics of selected notifiable (non-sentinel) vaccine-preventable diseases (vpds), japan, 2006–2016 click to download table 1. jpg, 702kb invasive pneumococcal disease (ipd) (2013–2015) reported cases of ipd were consistently lowest from mid-july to late september. the incidence was 1.5 per 100 000 person-years (n = 5229) from april 2013, when ipd became notifiable, through 2015. adults aged ≥60 years accounted for 62% (n = 3227) of cases, while children <5 years made up 19% (n = 1017). males accounted for 60% (n = 3134). since november 2013, routine vaccination has included four doses of 13-valent pneumococcal conjugate vaccine (pcv13) for children aged 2–59 months. pcv13 replaced pcv7, which had been subsidized since november 2010 and was routine since april 2013 for children <24 months old. routine immunization with 23-valent pneumococcal polysaccharide vaccine for adults aged ≥65 years began in october 2014 after having been available on a voluntary basis since 1988. measles (2008–2016) reports of measles in japan decreased from 11 013 cases in 2008 to 35 cases in 2015. in 2016, however, 165 cases were reported. of these, 32% (n = 52) were modified measles (i.e. laboratory confirmation with less than 3 classic measles symptoms), 58% (n = 95) were 20–39 years old and 19% (n = 32) were <10 years old. among the 112 cases in 2016 (68%) with known vaccination history, most were undervaccinated: 42% (n = 47) unvaccinated, including eight under vaccine age and 36% (n = 40) with one dose. measles virus was detected in 139 (84%) of the 2016 cases, 25% (n = 35) of which had travelled abroad. genotype was identified for 89% (n = 124) of these isolates: 53% (n = 66) d8, 46% (n = 57) h1 and <1% (n = 1) b3. case-patients with these isolates who had not travelled abroad were linked to international airports in japan. for the reviewed period, measles incidence was 1.2 per 100 000 person-years (n = 13 805). see rubella vaccination (above). additionally, a single measles vaccine dose has been available for children aged 12–71 months since 1978 and was expanded to 89 months in 1995. viral hepatitis (non-a, non-e) (2006–2015) hepatitis b virus (hbv) accounted for 81% (n = 1933) of the 2400 (incidence: 0.19 per 100 000 person-years) reported laboratory-confirmed viral hepatitis non-a, non-e cases in japan for the reviewed period. hbv cases were 78% male (n = 1503). suspected sexual transmission accounted for 70% of hbv cases (n = 1349). of the 1091 male case-patients reporting sexual transmission, 66% (n = 715) reported heterosexual contact, 21% (n = 226) reported homosexual contact, 2% (n = 20) reported heterosexual and homosexual contact and 16% (n = 170) gave no response. the routine schedule has included three doses of hepatitis b vaccine for infants aged <12 months since october 2016. voluntary maternal vaccination is also available. hepatitis a (2006–2016) hepatitis a cases peaked in 2006 (n = 320), 2010 (n = 347) and 2014 (n = 433) with higher frequencies during the first half of each year. males were 58% of all cases (n = 1313) and persons aged 25–64 years were 72% (n = 1744). domestic infection was suspected for 80% (n = 1185) of cases from 2010 to 2015 (prior data not reviewed) without regional clustering. total incidence for the reviewed period was 0.18 per 100 000 person-years (n = 2245). since march 2013, two-dose inactivated hepatitis a vaccination has been available on a voluntary basis for all ages. previously it had been available for those aged ≥16 years. invasive haemophilus influenzae disease (ihd) (2013–2015) the number of reported ihd cases increased from 108 in 2013 (ihd became notifiable in april 2013) to 200 in 2014 and 252 in 2015. males accounted for 60% (n = 338) of the cases. over half (52%; n = 293) of the cases were aged ≥70 years and 17% (n = 95) were <5 years old. the incidence of ihd was 0.16 per 100 000 person-years (n = 560) from april 2013 through 2015. since april 2013, four doses of h. influenzae type b vaccine have been routine for those aged <59 months. voluntary vaccination for children <5 years had been approved since december 2008; government financial assistance was added in november 2010. tetanus (2006–2015) between 89 and 128 cases of tetanus were reported each year with consistent increases during epidemiologic weeks 19–29. cases were mostly aged ≥55 years (85%; n = 984). all prefectures reported cases. the incidence of tetanus in japan for the reviewed period was 0.09 per 100 000 person-years (n = 1158). four doses of diptheria, tetanus, acellular pertussis, and inactivated polio vaccine (dtap–ipv) between age 3 months and 7½ years and one diptheria and tetanus (dt) dose at age 11 or 12 are included in the routine schedule. typhoid fever (2008–2015) most cases of typhoid fever reported in japan (72%; n = 238) were acquired outside japan. the annual percentage of domestically acquired cases decreased from 38% (n = 25) in 2013 to 11% (n = 4) in 2015. domestic cases appeared mostly sporadically with no known cause; however, in august 2014, an outbreak of eight cases was linked to salad consumption at a restaurant in tokyo.9 the incidence of typhoid fever for the reviewed period was 0.03 per 100 000 person-years (n = 330). no vaccine has been approved for typhoid fever in japan. individual physicians may import and administer the vaccine without government reimbursement or, in the case of adverse events, patient compensation. invasive meningococcal disease (imd) (2013–2015) there were 23–37 cases of imd reported each year from april 2013 (when meningococcal sepsis was added to the list of conditions requiring mandatory reporting for imd) through 2015 with no seasonality. most cases were male (64%; n = 60) and aged ≥50 years (59%; n = 55). imd incidence in japan was 0.03 per 100 000 (n = 94). the meningococcal conjugate vaccine (mcv4) became available for voluntary use in may 2015. japanese encephalitis (je) (2006–2015) of the 47 prefectures in japan, five in western japan (fukuoka, kumamoto, nagasaki, shimane and ehime) accounted for 43% (n = 22) of reported je cases for the reviewed period; 22 prefectures did not report any cases. reports were consistently higher during epidemiologic weeks 35–47. males were 63% (n = 32) and persons aged ≥60 years were 61% (n = 31) of all cases. je incidence in japan was 0.004 per 100 000 person-years (n = 51) with 2–10 cases reported each year. four doses of inactivated je vaccine are included in the routine schedule: three between 6 months and 7½ years of age and one between 9 and 13 years of age. vpds under sentinel surveillance influenza (2000–2015) all influenza seasons reviewed, except 2009, began in november, peaked in late january to mid-march and finished in may. sentinel sites reported 18 508 470 cases, averaging 243.5 annual cases per sentinel site (see table 2). there were 9905 (2013–2014 season) and 12 705 (2014–2015 season) hospitalized cases with laboratory evidence of infection. no human infection with avian influenza a(h5n1), a(h5n6), a(h7n9) or a(h9n2) has been reported in japan. seasonal influenza vaccinations for those aged >64 years or 60–64 years with certain chronic diseases or immunocompromised conditions are in the routine schedule. for anyone else, vaccinations are voluntary. table 2. comparison of case and case-per-site totals and characteristics of reported selected sentinel based vpds, japan, 2000–2015 click to download table 2. jpg, 328kb varicella (2005–2016) a peak of 88.1 varicella cases per sentinel site (n = 265 453) was reported in 2006. the ratio decreased to 67.1 (n = 202 732) in 2009, increased to 76.2 (n = 238 645) in 2011 and decreased to 24.7 (n = 77 614) in 2015. early in the reviewed period, cases peaked in november–june, but later they did not. children <5 years old represented 77% of cases in 2005–2011 and 54% in 2015. in total, 2 018 171 cases were reported from sentinel sites for 2005–2016 (65.5 cases per site per year). there were 521 hospitalized cases (clinically diagnosed or with laboratory evidence of infection) reported in japan from mid-september 2014 through march 2016 (0.27 per 100 000 person-years). since october 2014, the routine vaccination schedule has included two varicella vaccination doses for children between 1 and 2 years old. the vaccine is available on a voluntary basis for those aged ≥2 years. mumps (2000–2015) mumps cases in japan peaked in 2001 (84.4 cases per sentinel site), 2006 (66.6 cases per site) and 2010 (59.3 per site) without seasonality. no prefecture consistently reported high numbers of cases. cases aged 2–5 years accounted for 57% (n = 1 048 851) and males for 54% (n = 1 051 903) of cases. in total, 1 963 679 cases were reported from sentinel sites from 2000 to 2015 (40.1 per sentinel site per year). a monovalent mumps vaccination replaced the measles, mumps and rubella (mmr) vaccine in 1993 and is available on a voluntary basis for those aged at least 1 year. pertussis (2000–2015) the number of reported pertussis cases per sentinel site fluctuated during the reviewed period: 1.28 (n = 3804) in 2000, 0.44 (n = 1358) in 2005, 2.24 (n = 6753) in 2008, 0.53 (n = 1662) in 2013 and 0.85 (n = 2675) in 2015. we did not observe seasonality. in 2001, 27% (n = 471) of the cases were 6–11 months old and 3% (n = 49) were aged ≥20 years. by 2010, those aged ≥20 years were 48% (n = 2607) and those 6–11 months were 4% (n = 205) of cases. for the 2000–2015 period, 48 783 pertussis cases were reported from sentinel sites (0.996 per sentinel site per year). four doses of dtap-ipv are included in the routine schedule between ages 3 months and 7½ years. discussion most vpds in japan present low risk for the majority of travellers attending the 2019 rugby world cup and 2020 tokyo summer olympic and paralympic games. occurrence has either declined or maintained a low level. rubella, mumps, influenza, measles and imd, however, present more complicated pictures. hepatitis a and je may pose higher risk for some travellers as discussed below. due to the epidemiology of rubella, mumps and influenza in japan, these diseases should be prioritized for pre-travel advice. rubella surged in 2013, likely related to undervaccination among adult males. a rubella antibody seroprevalence study in japan in 2016 suggested that males 35–54 years old had less immunity than women for that age group; the gap narrowed to <10 percentage points for those aged 20–34 and ≥55.10 the vaccine was introduced in 1977 for 11–12-year old girls and was expanded in 1995 to boys 11–12-year-old and both sexes 12–89 months old.11 for mumps, 4–5 year peak cycles are also likely related to undervaccination. recent mumps vaccination coverage in japan has been 30–40%.12 vaccinations against mumps were voluntary until 1989 when mmr became routine; due to concerns with mumps component-related aseptic meningitis, mmr was replaced with a voluntary monovalent mumps vaccination in 1993. mumps outbreaks with up to 214 cases have been reported at mgs in europe.13,14 for influenza, seasons typically occur outside of when mgs are scheduled to occur in japan. nevertheless, travellers from the southern hemisphere leaving during its influenza season could import the virus and transmit it to northern hemisphere attendees who have not yet been vaccinated. to prevent mumps, rubella and influenza, advice should include ensuring up-to-date (or for influenza early) vaccinations, practising proper hygiene and recognizing and reporting signs and symptoms of these diseases. although case numbers have been low, measles and imd outbreaks with international transmission suggest these diseases should also be considered during pre-travel consultations. the endemic measles strain (d5) was last detected in japan in 2010, and who verified elimination in 2015.15 in 2016, however, measles outbreaks occurred in japan. all were linked to importation, including an outbreak at an international airport. most cases were undervaccinated.16 for imd, authors have noted japan's low incidence compared to other developed countries.17 a 2015 outbreak with six imd cases was detected after an international youth event in japan with more than 33 000 participants from 162 countries. all cases were from europe, one of which did not attend the event.18 these events show how importation can cause outbreaks even when domestic incidence is low; pre-travel advice should include ensuring up-to-date vaccinations, frequent handwashing and avoiding contact with items that contain others' saliva or respiratory droplets as much as possible. travel advisers should also consider individual traveller behaviours and itineraries. hepatitis a transmission in japan has primarily been linked to food, particularly shellfish and seafood.19 this information was obtained through self-reporting, which can be biased by social desirability. in 2017, outbreaks of hepatitis a among men who have sex with men were reported in both europe and the americas.20 individuals who engage in activities that put them at risk for hepatitis a should be advised on preventive measures like vaccination, safe-sex practices, handwashing and food selection. travellers intending to visit western japan, especially non-urban areas, should consider je vaccination and mosquito-bite prevention. though not reviewed, rotavirus disease tends to increase from february to may, outside the scheduled mg periods, and tuberculosis has been decreasing since 1999 with 14.4 new cases per 100 000 person-years in 2015.21,22 the selection of diseases for this work was largely based on expert opinion and discussion among leaders within the infectious diseases surveillance center (idsc) at niid. we could have unintentionally left out diseases that might affect travellers visiting the upcoming mgs. most passive disease surveillance systems may be limited by incomplete reporting, lack of representativeness or failure to identify outbreaks.23 nesid may also suffer these limitations. additionally, it lacks catchment population data for sentinel surveillance, limiting the ability to estimate sentinel disease incidences. nonetheless, nesid comprises the most standardized, robust national data available. we believe comparisons across time and place are valid and sufficient for our purposes. in most cases, we attempted to review 10 years of data. for some diseases the introduction or change of reporting requirements prevented that. readers should conclude with caution when considering diseases with very short reviewed periods. few outbreaks associated with sports-based mgs have been reported in literature. most were reported from the united states of america24,25,26 with one from the united kingdom of great britain and northern ireland,27 limiting generalization. their findings nevertheless imply important considerations: outbreak risk at sports-based mgs is low but not null; outbreaks occur among athletes and nonathletes, associated and unassociated persons and populations of high and low vaccination coverage; importation can spark an outbreak even in low-incidence countries; and, as noted in one article,25 the difficulties of conducting surveillance on international visitors could mean misunderstanding the size or nature of an outbreak or missing an outbreak entirely. ministries of health, organizations, health-care providers and travellers should ensure up-to-date vaccinations of travellers before they attend mgs, and they should also promote and support travellers carrying updated vaccination records to assist the home country with any potential case or outbreak investigations. as we have outlined, up-to-date vaccinations with additional preventive measures should be included in pre-travel advice for visitors to the 2019 rugby world cup and 2020 tokyo summer olympic and paralympic games, specifically for mumps, measles, rubella, influenza and imd for all travellers and for hepatitis a and je for travellers at higher risk. when providing advice, health professionals should also inform travellers about the role they could play in transmitting or preventing the transmission of disease to mg attendees from across the world. conflicts of interest none. funding financial support; this study was partly supported by the research on emerging and re-emerging infectious diseases and immunization (h30-shinkougyousei-shitei-004). acknowledgements none. references the economic impact of the 2020 tokyo olympic games. tokyo: mizuho research institute; 2014 (http://www.mizuho-ri.co.jp/publication/research/pdf/eo/mea141017.pdf, accessed 23 august 2016). public health for mass gatherings: key considerations. geneva: world health organization; 2015 (http://www.who.int/ihr/publications/who_hse_gcr_2015.5/en/). gautret p, steffen r. communicable diseases as health risks at mass gatherings other than hajj: what is the evidence? int j infect dis. 2016 jun;47:46–52. doi:10.1016/j.ijid.2016.03.007 pmid:26987476 santibanez s, prosenc k, lohr d, pfaff g, jordan markocic o, mankertz a. measles virus spread initiated at international mass gatherings in europe, 2011. euro surveill. 2014 sep 4;19(35):20891. doi:10.2807/1560-7917.es2014.19.35.20891 pmid:25210982 brazil health advice for travellers to the 2016 summer olympic and paralympic games. geneva: world health organization; 2016 (http://www.who.int/ith/updates/20160621/en/, accessed 1 september 2017). gaines j, brunette gw. travel to mass gatherings. atlanta: centers for disease control and prevention; 2017 (https://wwwnc.cdc.gov/travel/yellowbook/2018/advising-travelers-with-specific-needs/travel-to-mass-gatherings). alqahtani as, wiley ke, tashani m, willaby hw, heywood ae, bindhim nf, et al. exploring barriers to and facilitators of preventive measures against infectious diseases among australian hajj pilgrims: cross-sectional studies before and after hajj. int j infect dis. 2016 jun;47:53–9. doi:10.1016/j.ijid.2016.02.005 pmid:26875699 result of the population estimates. tokyo: statistics bureau; 2017 (http://www.stat.go.jp/english/data/jinsui/2.html, accessed accessed 1 june 2018). national institute of infectious diseases. [case study of food poisoning by typhoid presumed to be caused by raw salad – tokyo]. infectious agents surveillance report. 2015;36(8):162–3. japanese. age distribution of rubella hi antibody positives in japan, 2016. tokyo: national institute of infectious diseases; 2017 (https://www.niid.go.jp/niid//images/epi/yosoku/seroprevalence/r2016serum-e.pdf, accessed 26 september 2017). national institue of infectious diseases. rubella and congenital rubella syndrome in japan, as of march 2013. infectious agents surveillance report. 2013;34(4):87–9. national institue of infectious diseases. [on the results of the investigation of the vaccination history of “mumps vaccineâ€� in recent years]. infectious agents surveillance report. 2016;37(10):198–9. japanese. schmid d, holzmann h, alfery c, wallenko h, popow-kraupp th, allerberger f. mumps outbreak in young adults following a festival in austria, 2006. euro surveill. 2008 feb 14;13(7):8042. doi:10.2807/ese.13.07.08042-en pmid:18445415 gerstel l, lenglet a, garcãa cenoz m. mumps outbreak in young adults following a village festival in the navarra region, spain, august 2006. euro surveill. 2006 11 9;11(11):e061109.4. pmid:17213550 national institue of infectious diseases. measles in japan, as of march 2015. infectious agents surveillance report. 2015;36(4):51–3. national institute of infectious diseases. [outbreak of measles in business offices in kansai international airport]. infectious agents surveillance report. 2017;38(3):48–9. japanese. fukusumi m, kamiya h, takahashi h, kanai m, hachisu y, saitoh t, et al. national surveillance for meningococcal disease in japan, 1999-2014. vaccine. 2016 jul 25;34(34):4068–71. doi:10.1016/j.vaccine.2016.06.018 pmid:27291085 kanai m, kamiya h, smith-palmer a, takahashi h, hachisu y, fukusumi m, et al. meningococcal disease outbreak related to the world scout jamboree in japan, 2015. west pac surveill response. 2017 may 8;8(2):25–30. doi:10.5365/wpsar.2016.7.3.007 pmid:28729922 national institute of infectious diseases. hepatitis a in japan, 2010–2014, as of november 2014. infectious agents surveillance report. 2015;36(1):1–2. hepatitis a outbreaks mostly affecting men who have sex with men—european region and the americas. disease outbreak news. geneva: world health organization; 2017 (http://www.who.int/csr/don/07-june-2017-hepatitis-a/en/, accessed 29 november 2017). national institute of infectious diseases. rotavirus, 2010–2013. iasr monthly report. 2014;35(3):63–64. annual reports 2015 summary/foreigner. tokyo: the research institute of tuberculosis jata; 2016 (http://www.jata.or.jp/rit/ekigaku/en/annual-reports/, accessed 12 september 2017). teutsch sm. considerations in planning a surveillance system. in: lee lm, teutsch sm, thacker sb, st. louis me, editors. principles & practice of public health surveillance. 3rd ed. new york: oxford university press; 2010:22. doi:10.1093/acprof:oso/9780195372922.003.0002 gundlapalli av, rubin ma, samore mh, lopansri b, lahey t, mcguire hl, et al. influenza, winter olympiad, 2002. emerg infect dis. 2006 jan;12(1):144–6. doi:10.3201/eid1201.050645 pmid:16494733 ehresmann kr, hedberg cw, grimm mb, norton ca, macdonald kl, osterholm mt. an outbreak of measles at an international sporting event with airborne transmission in a domed stadium. j infect dis. 1995 mar;171(3):679–83. doi:10.1093/infdis/171.3.679 pmid:7876616 hunt e, lurie p, lute j, moll m, stafford h, bart j, et al.; centers for disease control and prevention (cdc). multistate measles outbreak associated with an international youth sporting event–pennsylvania, michigan, and texas, august-september 2007. mmwr morb mortal wkly rep. 2008 feb 22;57(7):169–73. pmid:18288074 orr h, kaczmarski e, sarangi j, pankhania b, stuart j; outbreak investigation team. cluster of meningococcal disease in rugby match spectators. commun dis public health. 2001 dec;4(4):316–8. pmid:12109402 ebola preparedness in the western pacific region, 2014 regional analysis xu zhen,a* boris pavlin,b* raynal c squires,a thilaka chinnayah,a frank konings,a chin-kei leea and li ailana on behalf of the world health organization regional office for the western pacific ebola emergency support team a emerging disease surveillance and response unit, division of health security and emergencies, world health organization regional office for the western pacific, manila, philippines. b office of the who representative in papua new guinea, port moresby, papua new guinea. * both authors contributed equally in the writing of this paper. correspondence to xu zhen (email: xuz@wpro.who.int). to cite this article: xu z et al on behalf of the world health organization regional office for the western pacific emergency support team. ebola preparedness in the western pacific region, 2014. western pacific surveillance and response journal, 2014, 6(1):66–72. doi:10.5365/wpsar.2014.5.4.004 abstract west africa is currently experiencing the largest outbreak of ebola virus disease (evd) in history with intense transmission in several affected countries. for non-affected countries, the best protective measures are adequate levels of preparedness including vigilant surveillance to detect cases early and well-prepared health systems to ensure rapid containment of the virus and to avoid further spread. the world health organization regional office for the western pacific recently conducted two activities: a web-based evd preparedness survey and an evd simulation exercise to determine the overall level of evd preparedness in the region. the survey and exercise together demonstrate there is a good overall level of preparedness for a potential imported case of evd in the western pacific region. however, a number of areas still require further strengthening before the region can efficiently and effectively respond to potential evd events, including laboratory testing arrangements; clinical management and infection prevention and control; and public health intervention measures, particularly at points of entry. importantly, the survey and exercise also highlight the unique situation in pacific island countries and emphasize that special considerations are needed to better support these countries in evd preparedness. introduction the largest outbreak of ebola virus disease (evd) in history has been ongoing in west africa since december 2013.1 recent transmission of evd outside of west africa in the united states of america and spain2,3 suggests that no region of the world is immune to either the introduction or the onward transmission of evd. there are no direct flights between the three countries with widespread transmission of evd in west africa and any countries in the western pacific region; on the other hand, a number of countries in the region have economic or other ties with africa. risk assessments conducted by the world health organization (who) regional office for the western pacific4 suggest that the possibility of imported evd cases to the region is not high, but if it occurs the consequences would be major. the consequences of an introduction, particularly in developing country settings such as those found in many pacific island countries, would likely be severe. many of these countries are characterized by poor health-care infrastructure, low health-seeking behaviour, crowded housing, close-knit yet extensive social networks, low levels of sanitation and hygiene, low health literacy and challenging infrastructure. in light of this, a framework for action to respond to ebola virus disease for the western pacific region was developed by the who regional office for the western pacific to assist unaffected countries and areas in the region set priorities for preparedness to detect and respond to an outbreak of evd. the framework for action provides a useful checklist for countries in the region to determine their preparedness in key areas related to evd.5 as part of its support to member states, and within the context of the international health regulations (ihr 2005)6 and the asia pacific strategy for emerging diseases (apsed 2010, a strategy for capacity-building for public health events in the south-east asia and western pacific regions),7 the who regional office for the western pacific recently conducted two activities to assess evd preparedness in the region. the first of these was an online survey administered to the national ihr focal point in each member state. the second was a simulation exercise conducted with the participation of the national ihr focal points in member states, who country offices and the who regional office. the findings of these two activities can help national ihr focal points and the who regional office identify strengths and challenges regarding the preparedness level in the region and help partners identify areas of potential support. methods ebola preparedness survey invitations to the web-based ebola preparedness survey were sent to all 27 national ihr focal points in the who western pacific region on 29 september 2014. the survey was not administered to non-self-governing areas within the region, such as several pacific island jurisdictions, as these do not have national ihr focal points. the survey consisted of self-reporting against 34 closed-ended (“yes” or “no”) questions. questions were related to the six components of the framework for action: (1) command and coordination; (2) surveillance, risk assessment and response; (3) laboratory; (4) clinical management, and infection prevention and control; (5) public health interventions, including points of entry measures; and (6) risk communication. analysis was conducted for all countries and separately for asian countries and pacific island countries. ebola simulation exercise an ebola simulation exercise, which required national ihr focal points to respond quickly to incoming information by email regarding a potential evd event, was conducted from 8 to 9 october 2014. invitations to participate were sent to all 27 national ihr focal points in the western pacific region. briefly, the exercise simulated the entry and detection of a travel-related evd case in a local district in the national ihr focal points’ country which required them to take rapid response actions. the exercise scenario and injects were designed to promote the following expected actions: (1) share national evd-relevant guidelines and response plans; (2) provide technical advice on contact tracing, case management and patient transferral; (3) arrange specimen referral to who-recognized laboratories; (4) notify who of suspected and confirmed evd cases under ihr (2005); and (5) draft the press release of the first announcement of an evd case. results ebola preparedness survey results of the survey are shown in table 1. twenty-six national ihr focal points (96%) completed the survey: australia, brunei darussalam, cambodia, china, cook islands, fiji, japan, kiribati, the lao people’s democratic republic, malaysia, the marshall islands, the federated states of micronesia, mongolia, new zealand, niue, palau, papua new guinea, the philippines, the republic of korea, samoa, singapore, solomon islands, tonga, tuvalu, vanuatu and viet nam. table 1. responses to a web-based survey of ebola preparedness by asian, pacific island and all countries and areas,* who western pacific region, 2014 click to download table 1. jpg, 486kb * asian countries included australia, brunei darussalam, cambodia, china, japan, the lao people’s democratic republic, malaysia, mongolia, new zealand, papua new guinea, the philippines, the republic of korea, singapore and viet nam; pacific island countries included cook islands, fiji, kiribati, the marshall islands, the federated states of micronesia, niue, palau, samoa, solomon islands, tonga, tuvalu and vanuatu. † based on available survey results. eoc, emergency operations centre; evd, ebola virus disease; iata, international air transport association; moh, ministry of health; poe, points of entry; rrt, rapid response team. the components of evd preparedness with the highest number of positive responses for all countries on average were risk communication (86%) and command and coordination (84%). the lowest-scoring component was laboratory (60%). asian countries and pacific island countries differed in their overall responses, with the pacific island countries registering lower than their asian counterparts in every component. within the command and coordination component, most asian and pacific island countries had plans and structures in place in case of an evd event; 92% of asian countries had tested or planned to test those plans, but only 8% of pacific island countries had done so (prior to the simulation exercise described below). in the surveillance, risk assessment and response component, an evd surveillance protocol had been developed and disseminated to public health officials and hospitals in 92% of asian countries compared to 15% of pacific island countries. an investigation protocol had been developed in 100% of asian countries compared to 31% of pacific island countries. national rapid response teams (rrts) had been briefed or trained on evd response in 92% of asian countries and country-specific risk assessments conducted in 85%; 31% of pacific island countries reported completing either of the same preparedness actions. in regard to laboratory preparedness, in-country capacity to diagnose suspected evd cases was limited to asian countries alone (10/13). however, 77% of asian countries and 54% of pacific island countries reported having a referral arrangement in place, and 77% of countries in each subregion reported having staff trained to package specimens for referral. for clinical management and infection, prevention and control, most countries in both subregions had a designated isolation facility, had an infection prevention and control guidelines in place and had given staff appropriate training. however, compared to 77% of asian countries only 15% of pacific island countries had adequate personal protective equipment to actually manage a potential evd case. there was great discrepancy between asian countries and pacific island countries with regard to public health intervention measures at points of entry. all asian countries had briefed points of entry staff on the management of suspected evd in arriving passengers, all had a protocol in place to monitor and manage returning travellers with evd-like symptoms and 85% had evd-related information available for both incoming and outgoing travellers at points of entry. in the same respective categories, 31%, 23% and 31% of pacific island countries reported having completed those preparations. risk communication capacity was high in both groups, with few components requiring further strengthening; pacific island countries demonstrated a median level of evd public awareness dissemination (69%) and development of risk communication plans for the event of an evd outbreak (62%). ebola simulation exercise twenty-three national ihr focal points participated in the exercise; 11 from asian countries on 8 october and 12 from pacific island countries on 9 october. countries participating in the exercise were: brunei darussalam, cambodia, china, cook islands, fiji, japan, kiribati, the lao people’s democratic republic, malaysia, the marshall islands, the federated states of micronesia, mongolia, niue, new zealand, palau, the philippines, the republic of korea, samoa, singapore, solomon islands, tuvalu, vanuatu and viet nam. five of the national ihr focal points (fiji, kiribati, the federated states of micronesia, the republic of korea and vanuatu) participated but could not complete the exercise due to communication, technical or personnel constraints. the national ihr focal points of australia, nauru, papua new guinea and tonga did not participate. the exercise demonstrated that asian countries are well advanced in the preparation of national evd response plans or relevant guidelines. during the exercise, all 11 asian countries were able to share the existing national evd guidelines/response plans that had been developed in-country. some asian countries had developed very comprehensive response plans which included key components of emergency response coordination and communication. in contrast, only 30% of pacific island countries could share evd-relevant guidelines developed prior to the exercise. all asian country national ihr focal points were able to provide technical guidance to the simulated local public health unit on patient referral, contact tracing and case management. some countries provided very technical and detailed advice and necessary assistance that could be beneficial at the local level. all pacific island countries were able to provide advice on patient referral, contact tracing and management as well, but there were some technical inaccuracies with the materials provided by some pacific island countries. during the exercise, all asian country and pacific island country national ihr focal points were able to facilitate laboratory testing of simulated evd specimens, although there was some minor confusion about referral mechanisms. national ihr focal points from two asian countries with evd diagnostic capacity declared that specimens only required in-country testing, while others understood the need for referral but were not clear about where specimens should be shipped. who requests that, at least initially, clinical specimens diagnosed in-country be shipped to specific who-recognized laboratories for confirmation. under ihr (2005), suspected or confirmed cases of evd should be notified to who. fifteen countries notified who of the individual meeting a suspected case definition in the scenario (9/11 asian countries; 6/10 pacific island countries), and 17 notified who of the confirmed case (9/11 asian countries; 8/10 pacific island countries). in total, 91% (10/11) of the asian countries and 80% (8/10) of pacific island countries notified who of either suspected or confirmed evd cases. sixteen of the participating national ihr focal points (from 10/11 asian countries and 6/10 pacific island countries) were able to share a draft first announcement upon simulated confirmation of the evd case, but difficulties were noted in some countries’ ability to develop a well-written press release, especially in pacific island countries. discussion the survey and simulation exercise suggest that there is a good overall preparedness level in the western pacific region in the event of an imported case of evd. however, a number of areas still require further strengthening before the region can efficiently and effectively respond to potential evd events, including laboratory testing arrangements; clinical management and infection prevention and control; and public health intervention measures, particularly at points of entry. importantly, the survey and exercise demonstrated that several countries were not completely ready to facilitate specimen testing. it was not expected that all countries (especially pacific island countries) would have the appropriate facilities and biosafety infrastructure for in-country testing of suspected evd specimens, but an adequate referral mechanism to facilitate specimen testing should be in place. countries need to ensure fully that agreements have been made with who-recognized laboratories for confirmatory testing, have sufficiently trained staff to safely and correctly package suspected specimens and that export arrangements for dangerous goods have been prepared so that shipments will be smooth and efficient. both the survey and the simulation exercise highlight the unique situation and requirements of pacific island countries compared to asian countries and emphasize that special considerations for pacific island countries are needed in terms of evd preparedness, in particular specimen testing, interventions at points of entry and availability of personal protective equipment. the implications of the survey and exercise should extend beyond stakeholders in health, as the experience in west africa has shown that an extensive evd outbreak impacts and necessitates a response from the whole of society. as the survey was based on country self-reporting, it is difficult to objectively assess whether the results provided are a true reflection of country capacity. to some extent, this was addressed by having the simulation exercise, which sought to elicit objective evidence of certain preparedness capacities such as the ability to quickly produce guidance documents. still, many capacities were unable to be tested due to the tabletop nature of the simulation. this further underscores the need for in-country functional or full-scale exercises to truly assess capacity. a limitation of the simulation exercise was that the personnel available to participate varied from one country to another. for example, one country had 20 participants, while another had only one to two participants as it was a national holiday. thus, the performance in the exercise may not have been a true reflection of that country’s actual capacity. the survey and simulation exercise did not include the non-sovereign areas of the pacific (e.g. american samoa, guam and french polynesia); therefore, the preparedness levels in these areas could not be assessed. while many of the issues faced by these areas are likely similar to those encountered in their developing country neighbours, it is expected that they would have access to resources from their metropolitan governments (in this case, the united states and france, respectively). other countries in the region with close political ties to developed countries (e.g. papua new guinea to australia, and the northern micronesian countries to the united states) would probably benefit from similar support if an outbreak were to occur in their jurisdictions. it is in the interest of regional security for all that high-resource countries increase their support to developing countries; should an outbreak of evd occur in an inadequately prepared developing country, patients seeking better care would likely flee to their high-resource, traditional allies. it would be far more cost-effective and politically acceptable for all countries involved to prevent such outbreaks in the first place. the evd outbreak in west africa has served as a high alert to all countries against becoming complacent about the threat of emerging diseases and as an opportunity to test the public health and social systems that countries have put in place to deal with such threats. many of the assessed elements of preparedness referenced here were generic capacities that could be used for a variety of events, not solely an evd outbreak. generic capacities allow for the quick adaptation of surveillance and response systems to novel or (re-)emerging pathogens, such as ebola virus; this is particularly critical in developing country settings, such as the pacific island countries, in which it is simply not feasible to have vertical approaches to each novel disease. apsed provides a foundation for generic public health emergency system strengthening based on its focus areas and contributions towards achieving ihr (2005) core capacities, but more remains to be done. donors and technical partners can use the results of the preparedness survey and simulation exercise to prioritize urgent support to member states to further advance these capacities, particularly in the areas of laboratory, case management, infection prevention and control and points of entry, particularly in the pacific subregion. further evd-specific preparedness can be achieved through application of the framework for action.5 conflicts of interest none declared. funding none. acknowledgements the who regional office for the western pacific ebola emergency support team acknowledges all member states in the western pacific for their contribution and support to the ebola preparedness survey and ebola simulation exercise. other members of the who western pacific region ebola emergency support team when the survey and exercise were conducted: kotaro tanaka, selenic dubravka, may chiew, christine cool, samantha chapman, christophe delaude and janet mina. references: ebola virus disease fact sheet no 103, september 2014. geneva, world health organization, 2014. available from: http://who.int/mediacentre/factsheets/fs103/en/ [accessed 10 november 2014]. ebola response roadmap situation report. 8 october 2014. geneva, world health organization, 2014. available from: http://apps.who.int/iris/bitstream/10665/ 136020/1/roadmapsitrep_8oct2014_eng.pdf?ua=1 [accessed 13 november 2014]. cases of ebola diagnosed in the united states. atlanta, centers for disease control and prevention (cdc), 2014. available from: http://www.cdc.gov/vhf/ebola/outbreaks/ 2014-west-africa/united-states-imported-case.html [accessed 13 november 2014]. ebola virus disease: risk assessment in the western pacific region 09 october 2014. manila, world health organization regional office for the western pacific, 2014. available from: http://www.wpro.who.int/outbreaks_emergencies/ wpr_ra_ebola_09oct2014.pdf?ua=1 [accessed 13 november 2014]. preparedness for a potential outbreak of ebola virus disease: a framework for action in the western pacific region. manila, world health organization regional office for the western pacific, 2014. available from: http://www.wpro.who.int/outbreaks_ emergencies/wpro_ebola/en/ [accessed 13 november 2014]. international health regulations (2005), second edition. geneva, world health organization, 2008. available from: http://www.who.int/ihr/9789241596664/en/ [accessed 13 november 2014]. asia pacific strategy for emerging diseases (apsed, 2010). manila, world health organization regional office for the western pacific, 2011. available from: http://www.wpro.who.int/emerging_diseases/apsed2010/en/ [accessed 13 november 2014]. an enterohaemorrhagic escherichia coli outbreak spread through the environment at an institute for people with intellectual disabilities in japan in 2005 original research masaki ota,a taro kamigaki,b satoshi mimura,c kazutoshi nakashima,d and takashi ogamie a research institute of tuberculosis, tokyo, japan. b department of virology, graduate school of medicine, tohoku university, sendai, japan. c department of respiratory medicine, japan self defense force central hospital, tokyo, japan. d department of health science, faculty of sports and health science, daito bunka university, saitama, japan. e hokubu health office, oita prefecture, oita, japan. correspondence to masaki ota (email: otam@jata.or.jp). to cite this article: ota m, kamigaki t, mimura s, nakashima k, ogami t. an enterohaemorrhagic escherichia coli outbreak spread through the environment at an institute for people with intellectual disabilities in japan in 2005. western pac surveill response j. 2019 apr;10(2). doi:10.5365/wpsar.2017.8.4.010 abstract objective: an enterohaemorrhagic escherichia coli (ehec) outbreak at an institute with multiple facilities for children and adults with intellectual disabilities was investigated to characterize the cases and identify risk factors for infection. methods: a case was defined as a resident, a staff member or a visitor at the institute from 16 may through 30 june 2005 testing positive for type 2 vero toxin-producing ehec o157:h7 (confirmed case) or exhibiting bloody diarrhoea for two or more days (probable case). we collected and analysed demographic, clinical, laboratory and individual behaviour data to identify possible risk factors for infection and infection routes. results: we recorded 58 confirmed cases, of which 13 were symptomatic. one probable case was also found. the median age of the patients was 37 years (range: 6–59 years). thirty-six patients (61%) were male. thirteen patients (93%) had diarrhoea and six (43%) had abdominal pain. two developed haemolytic-uraemic syndrome but recovered. all the patients were treated with antibiotics and tested negative after treatment. some residents had problems with personal hygiene. the residents of one of the facilities who cleaned a particular restroom had 18.0 times higher odds of being infected with ehec (95% confidence interval: 4.0–102.4) than those who did not. discussion: the source of the outbreak could not be identified; however, the infection may have spread through environmental sources contaminated with ehec. we recommend that institutional settings, particularly those that accommodate people with intellectual disabilities, clean restrooms as often as possible to reduce possible infection from contact with infected surfaces. introduction enterohaemorrhagic escherichia coli (ehec) was first reported in 1983 in the united states of america.1 infection can cause diarrhoea, haemorrhagic colitis and haemolytic-uraemic syndrome (hus).2 outbreaks involving ehec can be spread through infected food,2 water,3 direct contact with infected humans4 or animals5,6 or exposure to infected environments.7 in japan, ehec is a reportable communicable disease; the largest outbreak to date was associated with consumption of white radish sprouts affecting about 8400 schoolchildren in 1997.8 on 6 june 2005, a physician informed a local health office of oita prefecture in western japan of two ehec cases at an institute for adults and children with intellectual disabilities. the objectives of the study were to characterize the epidemiology of the cases and identify possible risk factors for ehec infection in this outbreak. methods a case was defined as a resident, a staff member or a participant in the activities at the institute for at least one day from 16 may through 30 june 2005 who had a stool specimen that tested positive for vero toxin type 2 (vt2)-producing ehec o157:h7 (confirmed case) or exhibited bloody diarrhoea for two days or more (probable case), considering the long incubation period (1 to 9 days) of ehec. at the time of the outbreak, the institute had 162 long-term and 13 short-term residents, 20 participants of day care and vocational training and 81 staff members (total 276) in three facilities (facilities a, b and c). facilities a and b were for children and adults with intellectual disabilities, respectively, and facility c was for vocational training and residence for adults with mild intellectual disabilities. some residents of facility a attended a school outside the facility run by another organization five days a week. residents of facility c worked outside the institute, and about 20 persons who lived outside the institute attended vocational training held at facility c. to obtain relevant epidemiological and clinical information, the local health office staff and the authors interviewed the staff members at the time of the outbreak and reviewed charts of the residents and participants at the institute using semi-standardized instruments, to determine demographics (e.g. age, sex), symptoms and signs, date of onset and potential exposure history. affected patients were referred to a local hospital where we also reviewed patient charts. environmental samples, including surface swabs of doorknobs, water taps and stair and hand rails, were also collected from the institute by the local health office staff and examined at the oita prefecture hygiene and environment centre (ophec).9 the local health office collected stool samples from residents, vocational training participants and staff of the school for the intellectually disabled. the samples were examined for ehec at the local health office and ophec using the national institute of infectious diseases’ standard method.10 staff members of the institute collected stool samples from the kitchen staff that were examined at a private laboratory. we randomly selected half of the strains isolated from the confirmed cases which were further analysed with pulsed-field gel electrophoresis (pfge).11 we conducted a nested, unmatched case-control study of the residents, vocational training participants and the staff at each facility. for the case-control study, we defined a case as a person with bacteriologically confirmed ehec infection. all residents at the facilities who tested negative for ehec and did not exhibit diarrhoea between 1 and 9 june were chosen as controls. individuals who had diarrhoea but tested negative for ehec were not included in the case-control study. we conducted interviews with the patients and controls with the assistance of the staff, if necessary, using a structured questionnaire. potential risk factors were age; sex; daily living skills, including personal hygiene (whether one was able to wash hands, brush teeth or bathe independently); toilet hygiene (whether one was able to defecate independently or one had allotriophagic behaviours); and needing assistance in taking meals; participating in day care or vocational training; and specific restrooms used or cleaned. stratified analysis by mantel-haenszel method was employed to explore and adjust odds ratios if the univariable analysis revealed statistically significant result (p-value statistical tests were conducted using r software (the r foundation for statistical computing, vienna, austria), and a p-value of ethics statement the investigation was conducted in accordance with the infectious disease control act of 1999 and the food safety act of 1947 of japan, which grants the prefectural health director the authority to collect epidemiological information and biologic specimens from patients without obtaining formal consent, in the event of an outbreak of certain confirmed or suspected communicable diseases, including ehec. results all 276 residents, staff members, and participants of day care and vocational training had stool specimens collected and examined for ehec. fifty-nine cases were reported, of which 58 (98%) were confirmed and one was probable (2%). the probable case was a resident of facility c who had continuous bloody diarrhoea but had been treated with antibiotics before the stool examination and tested negative for ehec. overall, 14 (24%) cases were symptomatic. the median age of the cases was 37 years (range: 6–59 years), and 36 (61%) cases were male. four staff members exhibited non-bloody diarrhoea during the outbreak period; all four tested negative for ehec and were eventually determined not to be confirmed or probable cases. among the staff, there were five cases (6.2%). no staff members were out ill before the first case report on 1 june. no children in the school, except for those who were residents of facility a, tested positive for ehec. there were no reports of any diarrhoea among staff members and children at the school, except for those who were residents of facility a. the breakdown of bacteriological test results by facility is shown in table 1. when stratified by sex and location, the infection rate was highest in women residents of facility c (52.6%, 95% confidence interval [ci]: 28.8–75.5%). table 1: ehec o157:h7 positivity among staff, residents and day care participants of an institute for people with intellectual disabilities, japan, 2005 click to download table 1. jpg, 277kb fig. 1 shows the epidemic curve of the 14 symptomatic (13 confirmed and one probable) cases. four of the five residents who exhibited symptoms and signs from 1 to 2 june participated in a vocational training held on the 1st floor of facility c; however, we were not able to identify a period of close contact or a possible event that may have transmitted ehec among them during the training, since they participated in separate and different tasks. three patients of facility c are clustered on 7–8 june following the first case at the same facility on 1 june. fig. 1. epidemic curve of symptomatic cases by date of symptom onset during an outbreak of ehec o157:h7 at an institute for people with intellectual disabilities, japan, 2005 click to download table 1. jpg, 277kb the predominant clinical symptoms and signs of the 14 symptomatic cases were diarrhoea (13/14 cases, 93%), including bloody diarrhoea (2, 14%); abdominal pain (6, 43%); nausea or vomiting (3, 22%); and fever ≥37.5 °c (1, 7%). two patients (14%) developed hus; however, both fully recovered. of the 10 symptomatic patients (71%) who sought medical care, five (36%) were hospitalized. no residents or staff members died from this outbreak. ehec o157:h7 (vt2) was detected in the stool of 58 case patients. pfge analysis found that all of the 28 randomly selected case patients had nearly identical strains with differences within two bands.11 the strain was also later found in one patient in nakatsu, about 100 km north-west of the institute in july 2005; however, an epidemiological investigation found no direct link between that case and cases detected in this outbreak. all individuals with confirmed infection, including those who were asymptomatic, were treated with antibiotics and tested negative twice for ehec o157:h7 48 hours after the end of treatment. one patient with hus was treated with fosfomycin, and the other was treated with a fluoroquinolone before onset of hus. of 45 asymptomatic individuals, 37 took fosfomycin, six levofloxacin and one each tosufloxacin and cefpodoxime proxetil. we studied potential risk factors for ehec o157:h7 infection. among the resident cases, 88% were independent with respect to feeding, and 54% were independent with respect to urinating. however, most residents required assistance with personal hygiene and grooming (assistance was required by 63% with hand washing, 67% with defecation, and 60% with brushing teeth). some residents (16% of facilities a and b) had problems with personal hygiene, in particular allotriophagic behaviour (i.e. eating one’s own feces) and manipulating their own feces. eleven kitchen staff members, including three nutritionists, worked in a single kitchen preparing meals for the residents and staff who ate in dining halls in each facility. food items served to the residents and staff were almost identical. three nutritionists took turns eating each meal, and none of them exhibited diarrhoea during the outbreak period. all the kitchen staff tested negative for ehec in three separate stool samples collected on 20 may (just before the outbreak as part of routine screening for food-handlers), on 3–4 june and 8–9 june. samples of the meals provided from 23 to 30 may were stored in a freezer, and all samples tested negative for ehec. water samples from the tap water were all culture negative for ehec. chlorine levels of the tap water were checked and recorded every day and were consistently greater than 0.1 ppm. we investigated the pre-outbreak routines for cleaning the toileting areas. the toilets of facilities a and b were cleaned every day by the staff, two toilets on the 1st floor of facility c were cleaned every day by external vocational training participants and residents of facility c, and toilets on the 2nd and 3rd floors of facility c were cleaned by the residents. the cleaning was normally done with detergent applied with reusable mops and cloths. gloves were not always used during the cleaning before the outbreak. the time spent cleaning each restroom was normally 20 to 30 minutes. no animals were brought into the facilities before or during the outbreak period. upon the recognition of the outbreak, the facilities introduced additional disease prevention and control measures, including encouraging intensive hand washing before meals and after toilet use, increasing monitoring of residents with allotriophagic behaviour, strengthening daily diarrhoea surveillance and cleaning surfaces three times per day. prior to the outbreak, an infection control protocol was developed; anecdotally, the protocol was not followed consistently. the results of the primary univariable analyses are shown in table 2, and the stratified analyses for the residents of facilities a and b are shown in table 3. additional univariable analyses are listed in table s1. the univariable analysis found those residents who took meals at a certain table of facility b were 9.7 (95% ci: 1.1–89.4) times the odds of being infected with ehec (table s1b). the inability to independently wash one’s own hands was significantly associated with being a case (or: 5.3, 95% ci: 1.5–29.4), specifically in men (or: 12.9, 95% ci: 1.8–562.6) and not women (or: 1.5, 95% ci: 0.2–18.7) (table 3). those who were unable to independently wash their own hands were more likely to be cases regardless of allotriophagic behavior (adjusted odds ratio [aor]: 4.4, 95% ci: 1.2–16.0) or needing assistance in defecation (aor: 4.3, 95% ci: 1.1–16.3). at facility c, it was found that the residents who had cleaned the female restroom on the 1st floor had 18.0 (95% ci: 4.0–104.4) times the odds of being infected with ehec than those who did not (table 2b). table 2. individual characteristics associated with ehec o157:h7 infection in univariable analyses of an outbreak investigation at an institute for people with intellectual disabilities, japan, 2005 click to download table 2. jpg, 947kb table 3. individual characteristics associated with ehec o157:h7 infection among individuals not able to independently wash their hands during an outbreak among residents of facilities a and b at an institute for people with intellectual disabilities, japan, 2005 (34 cases and 82 controls) click to download table 3. jpg, 413kb discussion we investigated an ehec outbreak that occurred during 1–13 june 2005, affecting 59 residents and staff members of an institute for children and adults with intellectual disabilities. the source of the outbreak could not be identified; however, the infection may have spread through the environment contaminated with ehec. the residents who cleaned a particular restroom at facility c had 18 times the odds of testing positive for ehec compared to those who did not, and neither samples from meal remnants nor stool samples from staff who worked in the kitchen yielded ehec. at facilities a and b, it is likely that the infection spread via person-to-person contact because those who were unable to wash their own hands were more at risk. environmental contamination was also supported by the findings that no single peak in the epidemic curve was noted, no episodes were reported in which a possible single source of infection was suspected and limitations in personal and toilet hygiene were confirmed. ehec spread through contaminated environments has been previously reported;7 thus our findings are consistent with previous reports. infection spread via person-to-person contact is the leading cause of most ehec outbreaks in institutional settings in japan and elsewhere, particularly at day cares, schools13–16 and homes for older people.17 foodborne infections18 and infection spread through the environment were sometimes suspected but were not supported by analytic epidemiology.13 thus, this study is unique in that cleaning a certain restroom was implicated by analytical epidemiology as a possible common source. in this outbreak, about two thirds of cases were asymptomatic. in japan, active case-finding routinely includes testing asymptomatic contacts.14,19 according to the national surveillance data, one third of ehec cases in japan were asymptomatic.20 over three fourths of the cases in our setting were adults, supporting a previous report that the proportion of cases that were symptomatic declined with age.14 additionally, the doses of ehec bacilli were likely small and thus not everyone developed symptoms. asymptomatic carriers or recovered patients may shed ehec for more than 30 days;21 however, humans are not considered as reservoirs.22 during an outbreak in australia in 2007, an asymptomatic sibling spread ehec to another sibling who developed hus.23 the role of asymptomatic carriers of ehec in outbreaks should not be underestimated. our study has both strengths and limitations. since all the residents and staff members of the institution were tested for ehec in their stools, we were able to identify infections that were asymptomatic. although we believe most infections were transmitted through the environment at facility c, the environmental specimens did not yield the pathogen, most probably because the environment, particularly the door knobs, floor and tables, were disinfected shortly before the environmental samples were collected for bacteriological tests. in addition, residents with intellectual disabilities may have limited ability to provide comprehensive behavioural or risk information, and thus recall and information biases are likely. to minimize these biases, we verified the participants’ responses with staff members’ records. we recommend that in institutional settings, particularly those that accommodate people with intellectual disabilities, staff should pay close attention to personal and toilet hygiene of the residents, and restrooms should be cleaned as often as possible to reduce possible infection via contact with contaminated surfaces. the infective dose of ehec is small (lower than 700 organisms).24 institutions should also have a symptomatic surveillance system and monitor trends in diarrhoea incidence among residents. prefectural governments should strengthen their surveillance systems, including pathogen surveillance with routine pfge tests, to detect potential outbreaks involving multiple prefectures. local health offices should provide congregate settings, including health facilities, with training about communicable diseases to prevent outbreaks. acknowledgements the authors would like to thank the staff members of the health division, welfare and health department, oita prefecture, usuki health office, oita prefecture hygiene and environment centre and the field epidemiology training programme (fetp), national institute of infectious disease, tokyo, japan, for their kind support of our investigation. funding this investigation was funded by a grant from the ministry of health, labour, and welfare, japan. conflicts of interest none declared. references riley lw, remis rs, helgerson sd, mcgee hb, wells jg, davis br, et al. hemorrhagic colitis associated with a rare escherichia coli serotype. n engl j med. 1983 mar 24;308(12):681–5. doi:10.1056/nejm198303243081203 pmid:6338386 bell bp, goldoft m, griffin pm, davis ma, gordon dc, tarr pi, et al. a multistate outbreak of escherichia coli o157:h7-associated bloody diarrhea and hemolytic uremic syndrome from hamburgers. the washington experience. jama. 1994 nov 2;272(17):1349–53. doi:10.1001/jama.1994.03520170059036 pmid:7933395 bruneau a, rodrigue h, ismäel j, dion r, allard r. outbreak of e. coli o157:h7 associated with bathing at a public beach in the montreal-centre region. can commun dis rep. 2004 aug 1;30(15):133–6. pmid:15315240 carter ao, borczyk aa, carlson ja, harvey b, hockin jc, karmali ma, et al. a severe outbreak of escherichia coli o157:h7–associated hemorrhagic colitis in a nursing home. n engl j med. 1987 dec 10;317(24):1496–500. doi:10.1056/nejm198712103172403 pmid:3317047 centers for disease control and prevention (cdc). outbreaks of escherichia coli o157:h7 associated with petting zoos–north carolina, florida, and arizona, 2004 and 2005. mmwr morb mortal wkly rep. 2005 dec 23;54(50):1277–80. pmid:16371942 muto t, matsumoto y, yamada m, ishiguro y, kitazume h, sasaki k, et al. outbreaks of enterohemorrhagic escherichia coli o157 infections among children with animal contact at a dairy farm in yokohama city, japan. jpn j infect dis. 2008 mar;61(2):161–2. pmid:18362413 varma jk, greene kd, reller me, delong sm, trottier j, nowicki sf, et al. an outbreak of escherichia coli o157 infection following exposure to a contaminated building. jama. 2003 nov 26;290(20):2709–12. doi:10.1001/jama.290.20.2709 pmid:14645313 michino h, araki k, minami s, takaya s, sakai n, miyazaki m, et al. massive outbreak of escherichia coli o157:h7 infection in schoolchildren in sakai city, japan, associated with consumption of white radish sprouts. am j epidemiol. 1999 oct 15;150(8):787–96. doi:10.1093/oxfordjournals.aje.a010082 pmid:10522649 oita prefectural institute of health and environment (formerly known as oita prefecture hygiene and environment centre) [website]. oita: oita prefectural government; 2015 (http://www.pref.oita.jp.e.ro.hp.transer.com/site/13002/, accessed 7 february 2019). manual for examination and diagnosis of enterohemorrhagic escherichia coli (ehec). tokyo: national institute of infectious diseases; 2017 (https://www.niid.go.jp/niid/images/lab-manual/ehec20170215.pdf, accessed 7 march 2018). terajima j, izumiya h, iyoda s, tamura k, watanabe h. high genomic diversity of enterohemorrhagic escherichia coli isolates in japan and its applicability for the detection of diffuse outbreak. jpn j infect dis. 2002 feb;55(1):19–22. pmid:11971157 katz s. assessing self-maintenance: activities of daily living, mobility, and instrumental activities of daily living. j am geriatr soc. 1983 dec;31(12):721–7. doi:10.1111/j.1532-5415.1983.tb03391.x pmid:6418786 bayliss l, carr r, edeghere o, knapper e, nye k, harvey g, et al. school outbreak of escherichia coli o157 with high levels of transmission, staffordshire, england, february 2012. j public health (oxf). 2016 sep;38(3):e247–53. doi:10.1093/pubmed/fdv122 pmid:26364319 kanayama a, yahata y, arima y, takahashi t, saitoh t, kanou k, et al. enterohemorrhagic escherichia coli outbreaks related to childcare facilities in japan, 2010-2013. bmc infect dis. 2015 nov 20;15(1):539. doi:10.1186/s12879-015-1259-3 pmid:26589805 sonoda c, tagami a, nagatomo d, yamada s, fuchiwaki r, haruyama m, et al. an enterohemorrhagic escherichia coli o26 outbreak at a nursery school in miyazaki, japan. jpn j infect dis. 2008 jan;61(1):92–3. pmid:18219147 gouveia s, proctor me, lee ms, luchansky jb, kaspar cw. genomic comparisons and shiga toxin production among escherichia coli o157:h7 isolates from a day care center outbreak and sporadic cases in southeastern wisconsin. j clin microbiol. 1998 mar;36(3):727–33. pmid:9508303 afza m, hawker j, thurston h, gunn k, orendi j. an outbreak of escherichia coli o157 gastroenteritis in a care home for the elderly. epidemiol infect. 2006 dec;134(6):1276–81. doi:10.1017/s0950268806006546 pmid:16740198 preston m, borczyk a, davidson r, mcgeer a, bertoli j, harris s, et al. hospital outbreak of escherichia coli o157:h7 associated with rare phage type ontario. canadian communicable disease report. 1997;23–05:33-37 (https://pdfs.semanticscholar.org/5972/bd18b94cab06f455754e755e8e89a5cc4c4b.pdf, accessed 7 february 2019). yamazaki s, et al. kansensho yobou hikkei (a handbook for prevention of communicable disease). tokyo, japan: nihon koshu eisei kyokai; 1999. pp. 210–3 (in japanese). national institute of infectious diseases. enterohemorrhagic escherichia coli (ehec) infection, as of april 2017. japan infectious agent surveillance report. 2017;38:87–8 (https://www.niid.go.jp/niid/en/basic-science/865-iasr/7282-447te.html, accessed 7 february 2019). swerdlow dl, griffin pm. duration of faecal shedding of escherichia coli o157:h7 among children in day-care centres. lancet. 1997 mar 15;349(9054):745–6. doi:10.1016/s0140-6736(05)60196-1 pmid:9074570 beutin l, martin a. outbreak of shiga toxin-producing escherichia coli (stec) o104:h4 infection in germany causes a paradigm shift with regard to human pathogenicity of stec strains. j food prot. 2012 feb;75(2):408–18. doi:10.4315/0362-028x.jfp-11-452 pmid:22289607 hanna jn, humphreys jl, ashton se, murphy dm. haemolytic uraemic syndrome associated with a family cluster of enterohaemorrhagic escherichia coli. commun dis intell q rep. 2007 sep;31(3):300–3. pmid:17974224 tuttle j, gomez t, doyle mp, wells jg, zhao t, tauxe rv, et al. lessons from a large outbreak of escherichia coli o157:h7 infections: insights into the infectious dose and method of widespread contamination of hamburger patties. epidemiol infect. 1999 apr;122(2):185–92. doi:10.1017/s0950268898001976 pmid:10355781 https://ojs.wpro.who.int/ 1wpsar vol 12, no 2, 2021 | doi: 10.5365/wpsar.2020.11.4.003 original research i nfluenza is a highly infectious acute respiratory disease that is estimated to result globally in 3–5 million cases of severe illness and 290 000–650 000 deaths annually.1,2 children aged <5 years are more susceptible to infection, with an estimated annual attack rate of 20–30%, compared with adults at 5–10%, with the elderly having the highest risk of mortality.3 syndromic and virological surveillance of influenzalike illness (ili) and severe acute respiratory infection (sari) are used to understand and estimate the burden of influenza. the data generated can be used to identify populations at high risk of infection and of complications, provide early warning of potential epidemics and guide preparedness, resource allocation, selection of preventive, treatment and control measures and selection of strains for seasonal flu vaccination.4 in developing, low-income countries such as mongolia, however, the burden of influenza is poorly quantified.5,6 in 2015, the world health organization (who) published a manual for estimating disease burden associated with seasonal influenza to guide comparable studies of disease burden with a uniform method.7 the method is based on available data from national surveillance that countries may use annually and will result in comparable results across time and geography if the surveillance methods are applied consistently. a national influenza centre, national centre of communicable diseases, ulaanbaatar, mongolia. b mongolian academy of medical sciences, ulaanbaatar, mongolia. c world health organization collaborating centre for reference and research on influenza, royal melbourne hospital, at the peter doherty institute for infection and immunity, melbourne, australia. d melbourne school of population and global health, university of melbourne, melbourne, australia. e victorian infectious diseases reference laboratory, royal melbourne hospital, at the peter doherty institute for infection and immunity, melbourne, australia. published: 7 june 2021 doi: 10.5365/wpsar.2020.11.4.003 background: mongolia is a vast, sparsely populated country in central asia. its harsh climate and nomadic lifestyle make the population vulnerable to acute respiratory infections, particularly influenza. evidence on the morbidity, mortality and socioeconomic impact of influenza in mongolia is scarce; however, routine surveillance for influenza-like illness (ili), severe acute respiratory infection (sari) and laboratory-detected influenza is conducted. this paper describes the epidemiology of influenza and the estimated burden of influenza-associated illness in mongolia in the five influenza seasons between 2013–2014 and 2017–2018. methods: demographic and laboratory data from 152 sentinel surveillance sites on all patients who met the case definitions of ili and sari between october 2013 and may 2018 were extracted and analysed as described in a manual for estimating disease burden associated with seasonal influenza. results: the estimated annual influenza-associated ili and sari rates, presented as ranges, were 1279–2798 and 81–666 cases per 100 000 population, respectively. children aged <5 years accounted for 67% of all ili cases and 79% of all sari cases. the annual specimen positivity for influenza was highest (11–30% for ili and 8–31% for sari) for children aged 5–<15 years and children <2 years old, respectively. the annual mortality rate due to pneumonia and sari was highest among children aged <2 years (15.8–54.0 per 100 000 population). although the incidence of influenzaassociated ili and sari was lowest for people aged ≥65 years, the mortality rate due to pneumonia and sari (1.2–5.1 per 100 000) was higher than that for those aged 15–64 years. conclusion: the estimated influenza-associated ili and sari incidence rates are high in mongolia, and children, especially those aged <5 years, have the highest influenza-associated burden in mongolia. these findings provide evidence for decision-makers in mongolia to consider targeted influenza vaccination, particularly for children. influenza epidemiology and burden of disease in mongolia, 2013–2014 to 2017–2018 oyungerel darmaa,a alexanderyn burmaa,a baataryn gantsooj,a badarchiin darmaa,a pagbajabyn nymadawa,a,b sheena g sullivan,c,d james e fieldingd,e correspondence to james fielding (email: james.fielding@vidrl.org.au) wpsar vol 12, no 2, 2021 | doi: 10.5365/wpsar.2020.11.4.003 https://ojs.wpro.who.int/2 darmaa et alinfluenza epidemiology and burden of disease in mongolia, 2013–2014 to 2017–2018 the largest hospitals in the country are general hospitals, regional centres for diagnosis and treatment and specialized hospitals known as reference centres. there are general hospitals in each of the capital districts and in 16 provinces and regional centres for diagnosis and treatment in five provinces. although all public health facilities participate in influenza surveillance, cases diagnosed and treated in private hospitals are not reported. the proportions of patients treated in public and private facilities were not available. sentinel surveillance the who case definitions of ili and sari were used. an ili case was defined as an acute respiratory infection with measured fever of >38 °c and cough with onset within the previous 10 days.4 a sari case was defined as an acute respiratory infection with a history of fever or measured fever of >38 °c and cough with onset within the previous 10 days and requiring hospitalization.4 ili surveillance with specimen collection has been conducted at 115 sentinel outpatient sites throughout the country (23 in the capital and 92 in the provinces) since 2009. the sites report data on ili daily. the sampling and testing methods are described under “specimen collection and testing” below. sari surveillance has been conducted at 37 hospitals since 2009, of which 16 are provincial general hospitals (located in provincial capital cities), five are regional centres for diagnosis and treatment, nine are district general hospitals in the capital, three are soum hospitals (one in the coldest part of the country, one in the south close to a major border crossing with china and the other in the north close to a major border crossing with the russian federation) and four are reference centres (national centre of maternal and child health, national cancer centre, state hospital number 3 and the nccd hospital). the hospitals report data on sari inpatients once a week. the data collected and reported to the flu information system consisted of the total number of patients at the end of the previous week, the total number of recovered and shifted patients, deaths, total number of newly admitted patients, number of patients at the end of the current week, total number of sari patients at the end of the previous week, total number of recovered and shifted patients, deaths, total number of newly admitted sari patients and total number of sari patients at the end of the current week. mongolia is a landlocked country in east and central asia. the population of about 3 million people is relatively young with 65% aged <35 years. children aged <5 years and people aged >65 years constitute 13% and 4% of the population, respectively.8 the temperature ranges from approximately –30 °c to 40 °c, and the capital, ulaanbaatar, in which nearly half the population resides, is considered the coldest capital city in the world.9 one third of the population resides in rural areas, breeding livestock in nomadic and semi-nomadic pastoralism. the country’s harsh climate and nomadic lifestyle make the population vulnerable to acute respiratory infections, particularly influenza.10 several studies of sentinel surveillance of ili and sari and a cohort study conducted in a district family general practice 130 km east of ulaanbaatar in 2010–2011 showed that, between 2007–2008 and 2011–2012, children aged <5 years had the highest incidence, accounted for almost all cases of ili and sari and had the highest attack rate of laboratory-confirmed influenza.11–13 in this study, we sought to further elucidate the burden of influenza in mongolia. syndromic and laboratory surveillance data were used to compare morbidity and mortality, and to estimate the disease burden associated with seasonal influenza with the standardized protocol described in the who manual, in mongolia between 2013–2014 and 2017–2018. methods health facilities in mongolia administratively, mongolia is divided into nine districts in the capital, ulaanbaatar, and 21 provinces; the provinces are divided into subregions called soums. outpatients are managed in the capital districts in 218 family health centres and in the provinces and soums in 296 soum health centres. data on ili are collected from all outpatient sites in the country and reported weekly to the nine district health departments in the capital and 21 provincial health departments and then forwarded to the national centre for communicable diseases (nccd). the data collected and reported to the flu information system (www.flu.mn) consisted of the total number of outpatient visits to family group practices, the total number of ili cases, the number of clusters, the total number of ambulance calls and the total number of calls due to ili. http://www.flu.mn wpsar vol 12, no 2, 2021 | doi: 10.5365/wpsar.2020.11.4.003https://ojs.wpro.who.int/ 3 influenza epidemiology and burden of disease in mongolia, 2013–2014 to 2017–2018darmaa et al the ili rate crossed the median weekly ili threshold rate for 2013–2014 to 2017–2018. laboratory data were analysed by influenza type or subtype and the percentage of specimens tested that were positive for influenza. these data were used to estimate overall and age-specific (age groups: <2, 2–<5, 5–<15, 15–<50, 50–<65, and ≥65 years) influenza-associated medically attended ili and sari incidence rates for each season between 2013–2014 and 2017–2018, as described in who’s a manual for estimating disease burden associated with seasonal influenza.10 population mortality and case fatality rates were estimated from the ili and sari surveillance data collected throughout the season. influenza-associated mortality and case fatality rates were not estimated, as samples were not taken from all people who died from sari. microsoft excel® 2013 software was used for the data analyses. results between 2013–2014 and 2017–2018, 2 002 825 patients with ili and 205 991 with sari were reported per year (ranges, 371 491–440 389 for ili and 33 136–50 759 for sari). the seasonal peak rates were 50–70 ili cases and 6–10 sari cases per 10 000 population (fig. 1). the peak rates were highest for both ili and sari in the 2016–2017 season, while the lowest peaks were in 2014–2015 and 2013–2014, respectively. during the five seasons, the number of sari patients increased, as both a proportion of hospital admissions and incidence rate, while the number of ili patients decreased as a proportion of consultations and incidence rate (table 1). the 5-year averages were 532.4 ili cases and 42 sari cases per 100 000 population. seasons started between weeks 40 and 44, but the timing of the peaks (weeks 51 to 9) and the ends (weeks 7 to 22) varied more widely (table 1, fig. 1 and 2). the longest season was that of 2013–2014 (35 weeks), and the shortest was that of 2016–2017 (16 weeks). influenza virus was detected in the population in each of the five seasons of 2013–2014 to 2017–2018. specimen collection and testing the sentinel surveillance sites are classified into one of two categories according to the frequency of specimen collection. category i sites (n = 78: 61 outpatient sites and 17 hospitals) collect and send specimens for testing every week, and category ii sites (n = 74: 54 outpatient sites and 20 hospitals) collect and send specimens for testing only during the influenza season or if an outbreak or cluster is detected at the site. physicians at ili and sari sentinel sites were asked to collect nasopharyngeal swabs each week from 5–10 patients who met the case definitions within 3 days of disease onset and before treatment. the collected specimens were immediately immersed into sterile tubes containing virus transport medium, stored in refrigerators at the sentinel sites and transported to the reference virology laboratory of the national influenza centre at the nccd or to one of four participating branch laboratories.12 samples were shipped by car from the central region, by plane from the western and eastern regions and by train from the northern and south-eastern regions. samples were tested for influenza virus by real-time reverse transcriptase polymerase chain reaction. virus-positive samples were passaged in mdck cells for isolation. genetic sequencing analysis was done for five strains of a(h1n1)pdm09 and eight strains of a(h3n2) by abi big dye terminator v.3.1 cycle sequencing and abi 3130 xl analyser. analysis of epidemiological data and burden of disease data from the ili, sari and laboratory surveillance systems in the 2013–2014 and 2017–2018 influenza seasons were analysed to elucidate the epidemiology of influenza in mongolia. as the annual influenza season crosses the new calendar year, seasons were defined as from week 40 of one year to week 39 of the following year. ili incidence rates were calculated from population data for the whole country and total consultations and for the populations of the capital city districts and provincial capital cities.8 sari incidence rates were calculated from total hospitalizations and the populations of the provincial capitals and the districts of the national capital, representing the catchment populations of the sari sentinel sites. an influenza season was defined as the period between the date on which wpsar vol 12, no 2, 2021 | doi: 10.5365/wpsar.2020.11.4.003 https://ojs.wpro.who.int/4 darmaa et alinfluenza epidemiology and burden of disease in mongolia, 2013–2014 to 2017–2018 fig. 1. ili and sari rates per 10 000 population by week, mongolia, 2013–2014 to 2017–2018 0 10 20 30 40 50 60 70 80 40 45 50 3 8 13 18 23 28 33 38 43 48 1 6 11 16 21 26 31 36 41 46 51 3 8 13 18 23 28 33 38 43 48 1 6 11 16 21 26 31 36 41 46 51 4 9 14 19 24 29 34 39 2013–2014 2014–2015 2015–2016 2016–2017 2017–2018 ra te p er 1 0 00 0 po pu la � on year and week number ili sari table 1. ili consultations and sari hospitalizations, incidence rates and season characteristics by year, mongolia, 2013–2014 to 2017–2018 influenza season 5-year average2013–2014 2014–2015 2015–2016 2016–2017 2017–2018 ili cases per total outpatient consultations (%) 5.7 5.2 4.7 4.5 4.4 4.9 no. of ili cases per 100 000 population 15 029 13 732 13 102 12 145 11 690 13 106 sari patients among total hospitalizations (%) 8.4 9.2 10.3 11.1 11.8 10.2 no. of sari cases per 100 000 population 1660 1780 2079 2029 2364 1990 season onset (week) 40 41 42 44 43 season peak (week) 8 51 9 1 52 season end (week) 22 13 19 7 16 wpsar vol 12, no 2, 2021 | doi: 10.5365/wpsar.2020.11.4.003https://ojs.wpro.who.int/ 5 influenza epidemiology and burden of disease in mongolia, 2013–2014 to 2017–2018darmaa et al proportions of age group-specific ili generally decreased with age, whereas for sari, the proportions decreased with age to 50 years and then increased for older age groups. the estimated annual influenza-associated ili and sari rates, presented as ranges, were 1279–2798 and 81–666 cases per 100 000 population, respectively. (tables 2 and 3) the rates were highest for children aged <5 years (especially those aged <2 years) and lowest for people aged 15–<50 years. there was wider variation between the minimum and maximum annual rates of sari (42%) than for ili (29%). the annual rates of ili decreased each year during the study period, while the rates of sari increased. the annual mortality rate due to sari ranged from 1.2 to 3.9 deaths per 100 000 population between 2013–2014 and 2017– 2018. the rate was highest among children aged <5 years, in particular those aged <2 years (15.8–54.0 deaths per 100 000 population in 2015–2016 to 2017– 2018). annual mortality rates were <1.0 deaths among people aged 5–50 years, increasing to 1.2–5.1 deaths per 100 000 population for those aged ≥65 years (table 4). two seasons (2013–2014 and 2014–2015) started earlier, with most cases detected in weeks 2–17, peaking in weeks 3–11 (fig. 3). most cases in seasons 2015–2016, 2016–2017 and 2017–2018 were detected in weeks 47–17, with peaks in weeks 51–5. trends in influenza positivity were similar for ili and sari patients. the 2014–2015 and 2016–2017 seasons were dominated by type a(h3n2), while type b co-circulated with type a(h1n1) in 2014–2015 and 2017–2018, with two distinct peaks in each season. all three types or subtypes co-circulated in 2013–2014. the percentage of tests positive for influenza virus was highest for both ili and sari patients in 2016–2017; however, over each full year, there was more variation in the percentage of ili patients positive for influenza (range: 9–19%; lowest in 2014–2015 and highest in 2013–2014) than of sari patients (range: 8–12%; lowest in 2014–2015 and highest in 2017–2018). the highest proportions of the population positive for both ili and sari from 2013–2017 to 2017–2018 were reported in children aged <5 years (tables 2 and 3). in seasons 2015–2016, 2016–2017 and 2017–2018, for which fewer data were available by age group, the proportions were highest among those aged <2 years. the fig. 2. ili rates by week and year, mongolia, 2013–2014 to 2017–2018 0 10 20 30 40 50 60 70 80 40 42 44 46 48 50 52 2 4 6 8 10 12 14 16 18 20 22 24 26 28 30 32 34 36 38 ca se s pe r 10 0 00 0 po pu la � on week number 2013–2014 2014–2015 2015–2016 2016–2017 2017–2018 average season threshold wpsar vol 12, no 2, 2021 | doi: 10.5365/wpsar.2020.11.4.003 https://ojs.wpro.who.int/6 darmaa et alinfluenza epidemiology and burden of disease in mongolia, 2013–2014 to 2017–2018 fig. 3. numbers of ili cases (3a) and sari cases (3b) positive for influenza by type or subtype and percentages influenza positive, mongolia, 2013–2014 to 2017–2018 0% 10% 20% 30% 40% 50% 60% 0 10 20 30 40 50 60 40 48 4 12 20 28 36 44 52 8 16 24 32 40 48 3 11 19 27 35 43 51 7 15 23 31 39 47 3 11 19 27 35 2013/2014 2014/2015 2015/2016 2016/2017 2017/2018 pe r c en t i nfl ue nz a po si � ve n um be r of s pe ci m en s year and week number type a(h3) type a(h1) type b % positive 0% 10% 20% 30% 40% 50% 60% 0 10 20 30 40 50 60 40 48 4 12 20 28 36 44 52 8 16 24 32 40 48 3 11 19 27 35 43 51 7 15 23 31 39 47 3 11 19 27 35 2013/2014 2014/2015 2015/2016 2016/2017 2017/2018 pe r c en t i nfl ue nz a po si �v e n um be r o f s pe ci m en s year and week number type a(h3) type a(h1) type b % positive 3a 3b wpsar vol 12, no 2, 2021 | doi: 10.5365/wpsar.2020.11.4.003https://ojs.wpro.who.int/ 7 influenza epidemiology and burden of disease in mongolia, 2013–2014 to 2017–2018darmaa et al table 2. range of annual ili cases, incidence and per cent influenza positive by age group, 2013–2014 to 2017–2018 age group (years) total <2* 2–<5* <5 5–<15 15–<50 ≥50 50–<65* ≥65* total outpatient consultations 1 228 239– 1 354 384 765 072– 804 931 1 955 342– 2 180 652 877 738– 1 086 993 2 632 829– 3 666 852 1 714 868– 2 135 206 1 117 744– 1 322 442 721 168– 812 764 7 734 051– 8 502 958 ili cases 148 950– 174 258 100 979– 104 964 249 929– 285 412 71 670– 101 315 34 472– 41 364 9867– 18 261 6170–7792 3727– 4133 371 491– 440 389 ili cases per 100 000 population 96 575– 108 028 42 118– 46 535 63 436– 87 486 13 097– 20 981 2007–2411 2208–4430 1852–2108 3239– 3368 11 690– 15 029 ili cases sampled 488–638 495–651 667–1289 295–736 230–417 76–380 55–68 17–32 1615–2447 % specimens influenza positive 10–13 14–18 6–15 11–30 9–19 9–24 9–25 10–18 9–19 estimated % total consultations for influenzaassociated ili 1.3–1.6 1.8–2.5 0.8–1.9 0.9–2.8 0.1–0.3 0.0–0.1 0.1–0.1 0.0–0.1 0.5–1.1 estimated influenza-associated ili per 100 000 population 10 498– 13 476 5786– 8435 4958– 10 079 1642– 6313 191–457 203–618 168–500 308–582 1279–2798 table 3. range of annual sari cases, incidence and per cent influenza positive by age group, 2013–2014 to 2017–2018 age group (years) total <2* 2–<5* <5 5–<15 15–<50 ≥50 50–<65* ≥65* total admissions 54 095– 66 759 20 389– 28 077 72 470– 87 148 20 209– 49 594 154 586– 204 850 105 027– 122 039 62 124– 69 403 41 738– 52 636 384 711– 432 053 sari cases 25 018– 27 392 9724– 12,640 26 476– 40 032 3003– 6103 1391– 2,654 1043– 1961 758–1034 621–927 33 136– 50 750 sari cases per 100 000 population 23 315– 26 197 6359– 7777 12 226– 14 988 894– 1569 120–228 344–588 336–413 781– 1114 1567–2,356 sari cases sampled 756–804 434–563 1190– 1725 124–209 66–337 17–119 13–51 4–25 1397–2390 % specimens influenza positive 8–31 11–30 4–30 12–22 4–17 4–21 8–16 5–50 5–28 estimated % total hospitalizations for influenza associated sari 3.3–15.5 4.9–13.4 1.5–14.8 1.2–4.0 0.0–0.2 0.0–0.3 0.1–0.2 0.5–0.9 0.5–3.3 estimated influenza associated sari per 100 000 population 1798– 8039 697– 2311 530– 4547 103–316 8–23 14–104 32–57 65–557 81–666 * for seasons 2015–2016, 2016–2017 and 2017–2018 only * for seasons 2015–2016, 2016–2017 and 2017–2018 only wpsar vol 12, no 2, 2021 | doi: 10.5365/wpsar.2020.11.4.003 https://ojs.wpro.who.int/8 darmaa et alinfluenza epidemiology and burden of disease in mongolia, 2013–2014 to 2017–2018 changed the diagnostic and admission criteria for sari to maximize government assistance payments for admitted sari cases. only limited quantities of influenza vaccine are available in mongolia, provided by the government and the partnership for influenza vaccine introduction programme (https://pivipartners.org/). the government subsidized influenza vaccination for health-care workers and staff in emergency agencies following the influenza a(h1n1)pdm09 pandemic in 2009, but vaccination remains voluntary and requires payment by other groups, so that very few people are vaccinated each year. the high influenza-associated ili and sari burden and mortality from pneumonia and sari in children indicate that a vaccination programme for children could have an enormous impact on the burden of influenza in mongolia. it would require considerable funding and resources in view of the high proportion of youth in the population. this population structure is common in developing countries, where 99% of deaths attributable to influenza-associated acute lower respiratory infection deaths in children aged <5 years occur.20 in the five influenza seasons between 2013–2014 and 2017–2018, ili and sari activity in mongolia usually started in october and peaked during the coldest period of the year between late december and february. as measured by the percentage of samples from ili and sari patients who tested positive for influenza, the highest seasonal load was in 2016–2017 and the lowest in 2014–2015. in the 2015–2016 and 2017–2018 seasons, distinct secondary peaks were seen, associated with other influenza types and subtypes that dominated later in the seasons. the subtype distribution was consistent in the ili and sari surveillance systems each year, influenza a(h3) being the predominant circulating subtype in 2014–2015. the timing and distributions of type and subtype in each of the five influenza seasons varied during the surveillance period and were not always consistent with observations from other regions of the northern hemisphere. between 2013–2014 and 2016–2017, the subtype distribution in mongolia was similar to those of north america and of north and east asia (particularly china, japan and the republic of korea) in each of the four seasons and to that of europe in three seasons;21–24 however, the timing of the seasons was similar to those discussion in this first study of the influenza burden in mongolia, estimated with who’s a manual for estimating disease burden associated with seasonal influenza,7 the burden of influenza-associated ili and sari was highest among children aged <5 years, especially among those aged <2 years, consistent with a study conducted with the same methods on the epidemiology and impact of influenza in mongolia between 2007 and 2012.13 the estimated annual influenza-associated ili and sari rates, presented as ranges, were 1279–2798 and 81–666 cases per 100 000 population, respectively; the rates in children aged <5 years were 4958–10 079 and 530–4547 per 100 000 population, respectively. these rates are higher than those in other published studies of influenza in lowand middle-income countries (lmics), as classified by the world bank.14 for example, the influenza-associated sari rates per 100 000 population for all ages and for children aged <5 years, respectively, were: 115–142 and 2021–2349 in china;15 13–19 and 82–114 in indonesia;16 21–82 and 147–469 (in children aged <2 years) in kenya;17 and 43.9 and 187.7 in zambia.18 the studies should be compared cautiously, as the same (who) sari case definition was used only in indonesia and kenya, and the rates were from a relatively small number of hospitals and extrapolated to provincial or national levels. the outcomes of influenza may be more severe in lmics than in high-income countries, particularly in pregnant women, people living with hiv/aids and children aged <5 years,19 contributing to a disproportionate proportion of the global burden of influenza.6 there are several possible explanations for the very high rates observed in mongolia. the extreme winter results in increased occupation of indoor spaces and may reduce immunity in some population groups. increased population mixing also occurs in winter during public holidays, particularly the lunar new year and the beginning of the school year. smoke and pollution caused by burning coal may exacerbate respiratory conditions and increase vulnerability to influenza infection. the wide range of annual estimates of influenzaassociated sari in particular is partly driven by the marked, consistent increase in annual sari rates over the 5-year study period. the reason for this increase has not been established, but hospitals may have wpsar vol 12, no 2, 2021 | doi: 10.5365/wpsar.2020.11.4.003https://ojs.wpro.who.int/ 9 influenza epidemiology and burden of disease in mongolia, 2013–2014 to 2017–2018darmaa et al would dramatically decrease the burden of influenza in mongolia. further improvements to the surveillance system would allow more detailed analysis of risk factors and underlying conditions associated with the severity and economic burden of influenza. acknowledgements the study team acknowledges the who country office for its financial support. the who collaborating centre for reference and research on influenza is supported by the australian government department of health. technical advice and support were provided by dr stella van beers of the royal tropical institute, amsterdam, netherlands; sarah hamid and dr erica dueger, who regional office for the western pacific; and dr evlegsuren and dr ariuntuya of the who country office in mongolia. references 1. iuliano ad, roguski km, chang hh, muscatello dj, palekar r, tempia s, et al. estimates of global seasonal influenza-associated respiratory mortality: a modelling study. lancet. 2018;391(10127):1285–300. doi:10.1016/s01406736(17)33293-2 pmid:29248255 2. paget j, spreeuwenberg p, charu v, taylor rj, iuliano ad, bresee j, et al. global mortality associated with seasonal influenza epidemics: new burden estimates and predictors from the glamor project. j glob health. 2019;9(2):020421. doi:10.7189/ jogh.09.020421 pmid:31673337 3. influenza. geneva: world health organization; 2019. available from: https://www.who.int/biologicals/vaccines/influenza/en/, accessed 10 may 2018. 4. global epidemiological surveillance standards for influenza. geneva: world health organization; 2013. available from: https:// www.who.int/influenza/resources/documents/influenza_surveillance_manual/en/?, accessed 1 december 2013 5. simmerman jm, uyeki tm. the burden of influenza in east and south-east asia: a review of the english language literature. influenza other respir viruses. 2008;2(3):81–92. doi:10.1111/ j.1750-2659.2008.00045.x pmid:19453467 of these regions in only two of the four seasons. in 2017–2018, the timing and subtype distribution best matched that observed in western europe.25 the difference between the seasonal pattern in mongolia and those in other countries in north and east asia and elsewhere in the northern hemisphere highlights the importance of national surveillance in understanding influenza epidemiology and virology in mongolia. our study had several limitations. a high staff workload, limited availability of swab kits, the absence of systematic sampling and the logistical challenges of transporting samples over long distances may have resulted in non-random sampling of ili and sari patients. the influenza-associated sari mortality rate could not be estimated, as not all deaths were confirmed in the laboratory according to surveillance procedures. the positivity rate for influenza virus might have been underestimated due to delayed health care-seeking because of insufficient health literacy and improper use of antibiotics, lengthening the time to presentation to a doctor. furthermore, reluctance among the elderly to seek health care may have resulted in underestimates of influenza-associated ili, sari and mortality rates for this age group. in contrast, sari rates in the provinces might have been overestimated, as serious cases in soum hospitals are sometimes referred to provincial general hospitals. lack of more detailed epidemiological and clinical data on cases prevented in-depth analysis of risk factors, such as underlying conditions and geographical distribution. the estimated incidence of influenza-associated ili and sari in mongolia over five seasons between 2013–2014 and 2017–2018 was higher than that in comparable countries; however, our finding that children under 5 years were the most affected is consistent with regional and global trends. the findings can inform influenza control policies. targeted vaccination of children table 4. range of annual deaths and rates of mortality due to pneumonia and sari, 2013–2014 to 2017–2018 age group (years) total <2* 2–<5* <5 5–<15 15–<50 ≥50 50–<65* ≥65* deaths due to sari 17–59 4–6 21–65 1–2 0–5 1–8 1–4 1–4 25–80 mortality rate per 100 000 population 15.8–54.0 2.5–3.9 7.9–24.8 0.3–0.6 0.0–0.4 0.3–2.6 0.4–1.8 1.2–5.1 1.2–3.9 * for seasons 2015–2016, 2016–2017 and 2017–2018 only wpsar vol 12, no 2, 2021 | doi: 10.5365/wpsar.2020.11.4.003 https://ojs.wpro.who.int/10 darmaa et alinfluenza epidemiology and burden of disease in mongolia, 2013–2014 to 2017–2018 16. susilarini nk, haryanto e, praptiningsih cy, mangiri a, kipuw n, tarya i, et al. estimated incidence of influenza-associated severe acute respiratory infections in indonesia, 2013–2016. influenza other respir viruses. 2018;12(1):81–7. doi:10.1111/irv.12496 pmid:29205865 17. dawa ja, chaves ss, nyawanda b, njuguna hn, makokha c, otieno na, et al. national burden of hospitalized and nonhospitalized influenza-associated severe acute respiratory illness in kenya, 2012–2014. influenza other respir viruses. 2018;12(1):30–7. doi:10.1111/irv.12488 pmid:29243402 18. theo a, tempia s, cohen al, simusika p, chentulo e, chikamukwa cm, et al. the national burden of influenza-associated severe acute respiratory illness hospitalization in zambia, 2011–2014. influenza other respir viruses. 2018;12(1):46–53. doi:10.1111/ irv.12492 pmid:29243406 19. coleman bl, fadel sa, fitzpatrick t, thomas sm. risk factors for serious outcomes associated with influenza illness in high versus lowand middle-income countries: systematic literature review and meta-analysis. influenza other respir viruses. 2018;12(1):22–9. doi:10.1111/irv.12504 pmid:29197154 20. nair h, brooks wa, katz m, roca a, berkley ja, madhi sa, et al. global burden of respiratory infections due to seasonal influenza in young children: a systematic review and meta-analysis. lancet. 2011;378(9807):1917–30. doi:10.1016/s0140-6736(11)610519 pmid: 22078723 21. review of the 2013–2014 winter influenza season, northern hemisphere. wkly epidemiol rec. 2014;89(23):245–56. pmid:24955460 22. review of the 2014–2015 influenza season in the northern hemisphere. wkly epidemiol rec. 2015;90(23):281–96. pmid:26050269 23. review of global influenza activity, october 2015–october 2016. wkly epidemiol rec. 2016;91(51–52):604–22. pmid:27995783 24. review of global influenza activity, october 2016–october 2017. wkly epidemiol rec. 2017;92(50):761–79. pmid:29250946 25. review of the 2017–2018 influenza season in the northern hemisphere. wkly epidemiol rec. 2018;93:429–44. available from: https://apps.who.int/iris/bitstream/handle/10665/274263/ wer9334.pdf 6. lee vj, ho zjm, goh eh, campbell h, cohen c, cozza v, et al. advances in measuring influenza burden of disease. influenza other respir viruses. 2018;12(1):3–9. doi:10.1111/irv.12533 pmid: 29460425 7. a manual for estimating disease burden associated with seasonal influenza. geneva: world health organization, who global influenza programme; 2015. available from: https://www.who.int/ influenza/resources/publications/manual_burden_of_disease/en/, accessed 10 may 2015. 8. national statistics office of mongolia. ulaanbaatar; 2021. available from: http://www.en.nso.mn/index.php, accessed 10 may 2019. 9. the coldest capital cities in the world. world atlas. available from: https://www.worldatlas.com/articles/the-coldest-capital-cities-inthe-world.html, accessed 10 may 2017. 10. mourtzoukou eg, falagas me. exposure to cold and respiratory tract infections. int j tuberc lung dis. 2007;11(9):938–43. pmid:17705968 11. nukiwa n, burmaa a, kamigaki t, darmaa b, od j, od i, et al. evaluating influenza disease burden during the 2008–2009 and 2009–2010 influenza seasons in mongolia. west pac surveill response. 2011;2(1):16–22. doi:10.5365/wpsar.2010.1.1.004 pmid:23908879 12. nukiwa-souma n, burmaa a, kamigaki t, od i, bayasgalan n, darmaa b, et al. influenza transmission in a community during a seasonal influenza a(h3n2) outbreak (2010–2011) in mongolia: a community-based prospective cohort study. plos one. 2012;7(3):e33046. 13. burmaa a, kamigaki t, darmaa b, nymadawa p, oshitani h. epidemiology and impact of influenza in mongolia, 2007–2012. influenza other respir viruses. 2014;8(5):530–7. doi:10.1111/ irv.12268 pmid:25043147 14. world bank country and lending groups. washington, dc: the world bank; 2019. available from: https://datahelpdesk.worldbank.org/knowledgebase/articles/906519-world-bank-countryand-lending-groups, accessed 10 may 2019. 15. yu h, huang j, huai y, guan x, klena j, liu s, et al. the substantial hospitalization burden of influenza in central china: surveillance for severe, acute respiratory infection, and influenza viruses, 2010-2012. influenza other respir viruses. 2014;8(1):53–65. doi:10.1111/irv.12205 pmid:24209711 https://ojs.wpro.who.int/ 1wpsar vol 12, no 1, 2021 | doi: 10.5365/wpsar.2020.11.3.005 case report/series a end tb and leprosy unit, division of programmes of disease control, world health organization regional office for the western pacific, manila, philippines. b research institute of tuberculosis, japan anti-tuberculosis association, tokyo, japan. c national clinical center on tuberculosis, beijing, china. d department of international cooperation, innovation alliance on tb diagnosis and treatment, beijing, china. e korean institute of tuberculosis, seoul, republic of korea. f ministry of health and national center for communicable disease, ulaanbaatar, mongolia. published: 25 january 2021 doi: 10.5365/wpsar.2020.11.3.005 d espite continued progress in reducing the burden of tuberculosis (tb) in the world health organization (who) western pacific region, tb remains a leading cause of death from infectious diseases in the region.1 the tb burden ranges widely across the region, from countries in which tb has been eliminated as a public health concern to countries with some of the highest burdens of tb globally. reports of tb outbreaks among schoolchildren have been increasing recently. congregated settings, overcrowded classrooms and various risk profiles among students may contribute to rapid transmission of tb in school settings. moreover, tb outbreaks in schools and among children attract intense media and community attention and increase scrutiny of tb programmes. to date, there are limited international guidelines on responses to tb outbreaks in schools. we report a range of experiences in responding to tb outbreaks in schools in the western pacific region in four case studies compiled by who collaborating centres (in china, japan and the republic of korea) and by the ministry of health, mongolia. these case studies could inform the responses of countries that have minimal experience in responding to and preventing tb outbreaks in schools. case study: china tb burden in 2019, the incidence rate among children aged 0–14 years was 58 per 100 000 population, representing 1% of all notified cases.2 outbreak definition ten or more cases or any tb-related deaths associated epidemiologically with a school during one semester. laws, regulations and tb control and management in schools standards for tb prevention and control in schools are detailed in the national tb plan within the thirteenth five-year plan and in implementing standards for tuberculosis prevention and control in schools and the tb control action plan 2019–2022. the last was issued jointly by nine ministries, including the national health commission, to increase the capacity of schools reports of tuberculosis (tb) outbreaks among schoolchildren have increased in recent years in countries across the western pacific region. cases from china, japan, mongolia and the republic of korea were studied to derive lessons from the challenges and responses to tb outbreaks in schools. despite differences in the tb burden and outbreak preparedness, the four countries reported similar challenges. these included delayed diagnosis of index cases, lack of experienced health professionals and sustained financial support, and difficulty in responding to intensified media and community attention. early detection of outbreaks, established resource mobilization networks, coordination among stakeholders and proactive communication were highlights of successful outbreak responses. these principles could be adapted to each context for responses to future tb outbreaks in schools. tuberculosis outbreaks in schools: experiences from the western pacific region kalpeshsinh rahevar,a tracy yuen,a kyung hyun oh,a seiya kato,b yuhong liu,c zhang lijie,c jingtao gao,c liang li,c zi chen,d cheon tae kim,e sarankhuu amarzaya,f fukushi morishitaa and tauhid islama correspondence to kalpeshsinh rahevar (email: rahevark@who.int) wpsar vol 12, no 1, 2020 | doi: 10.5365/wpsar.2020.11.3.005 https://ojs.wpro.who.int/2 rahevar et altb outbreaks in schools: case studies which prohibits people with smear-positive results from working until their sputum is negative. the country’s contact investigation guide gives the criteria for extending contact investigation. an outbreak identified by a public health centre must be reported to the ministry of health, labour and welfare. public health centres are primarily responsible for contact investigation. the infectious diseases control law recommends the establishment of an ad-hoc outbreak investigation committee that includes officials from schools, local education committees and public health centres, local laboratory staff, tb experts and representatives of local medical associations. representatives of parents’ associations are usually not invited to preserve the confidentiality of the index case. contacts are screened for tb with a chest x-ray and for ltbi with igra. example outbreak an outbreak investigation was initiated after the diagnosis of tb in a junior high-school student in april 2009. the student experienced intermittent fever, cough and sputum for 6 months and visited several clinics 2 months before diagnosis, but did not receive a chest x-ray. initial investigation of close contacts resulted in the identification of one case of active tb and two cases of ltbi among family members and a high rate of igra positivity among classmates. tb preventive treatment was given to 50% of classmates. another case of pulmonary tb (with the same variable number of tandem repeat patterns as the index case) was identified in july 2009. the second stage of the investigation was campus-wide, and 15 cases of active tb and 45 cases of ltbi were identified overall. case study: mongolia tb burden in 2019, the incidence rate among children aged 0–14 years was 428 per 100 000 population, representing 10% of all notified cases.2 definition of outbreak cdc definition of a higher occurrence of cases than expected in a specific area and/or time.3 to detect tb cases early and to prevent public health emergencies. tb outbreak investigations are guided by the expert consensus on epidemiological investigation and onsite disposition of tb outbreaks in schools. tb case reporting is mandated by the interim regulation on public health emergencies. contacts are screened for tb by chest x-ray and symptoms and for latent tb infection (ltbi) with the tuberculin skin test (tst; recommended) or an interferongamma release assay (igra). example outbreak an outbreak was announced in august 2017 after the identification of cases of active tb at a middle school. during the initial investigation, all students and staff were screened four times, and asymptomatic close contacts and classes in which a high tb incidence was detected were screened at regular intervals. the response was guided by a committee of experts, chaired by the county’s top officials. the school infrastructure was disinfected daily. counselling (at home visits or by phone) and online study schemes were offered to students. the medical costs incurred by students were fully covered by the county government or by medical insurance. of 72 students treated (29 for pulmonary tb, 5 for presumptive pulmonary tb and 38 for ltbi), 50 satisfied the criteria for successful treatment and resumed school in november 2017. case study: japan tb burden in 2019, the incidence rate among children aged 0–14 years was 13 per 100 000 population, representing <1% of all notified cases.2 definition of outbreak a single-source case infects >20 persons in more than two families. laws, regulations and tb control and management in schools epidemiological surveys and contact investigations for tb are described in the infectious diseases control law, wpsar vol 12, no 1, 2020 | doi: 10.5365/wpsar.2020.11.3.005https://ojs.wpro.who.int/ 3 tb outbreaks in schools: case studiesrahevar et al laws, regulations and tb control and management in schools as of 2019, there were no regulations or standards for tb management in schools. a meeting of the ministry of health, the ministry of education, culture and sports, the ulaanbaatar governor’s office and occupational inspection agency and others was convened to develop plans for the management of tb in schools after reports of tb outbreaks. a draft guideline on tb outbreak management was planned for approval by the minister of health. in contact investigations, younger students are screened for tb with tst and teachers and older students with a chest x-ray. example outbreak an outbreak was notified after 60 cases of active tb (3% of 1732 students and staff) were reported at a secondary school between 2015 and 2017. in the initial investigation in april 2017, a high proportion (49% of 889 students) of students had a positive tst. isoniazid preventive therapy could not be offered because of insufficient stock. the second stage of the school-wide investigation was conducted between may and june by chest x-ray for all staff and students in grades 8–12 and/or tst for those in grades 1–7. two cases of active tb were detected among 1618 students tested. three subsequent field investigations were conducted 6 months apart on selected students. the response was coordinated jointly by the khan-uul district health care centre, the tuberculosis surveillance and research department and the diagnostics division of the national centre for communicable disease. follow-up investigations were originally planned every 6 months for 2 years or until no new cases were detected. this was not, however, implemented due to limited financial and human resources. case study: republic of korea tb burden in 2019, the incidence rate among children aged 0–14 years was 59 per 100 000 population, representing 1% of notified cases.2 definition of outbreak more tb cases are detected during contact investigations in congregated settings. laws, regulations and tb control and management in schools the infectious diseases prevention and control act states the legal responsibility of the central and local governments for epidemiological investigation. the tuberculosis prevention act details measures to be taken during outbreaks and for the management of contacts of patients with infectious tb. once a school reports a tb case to a health centre, the head of the health centre notifies the provincial tb officials, the korea disease control and prevention agency (kcda) and the electronic tb surveillance system. the health centre organizes an investigation team of a physician and a tb nurse from the health centre, a medical officer from the provincial health department, a member of the tuberculosis epidemic investigation service at the kcda, the principal and a health teacher from the school and a focal person from the provincial department of education. the health centre is responsible for conducting field investigations, with administrative support from the provincial health department. the health centre also treats patients, reports the results of contact investigations through the tb surveillance system and briefs parents and students when necessary. contact investigations are conducted by screening for tb with a chest x-rays and ltbi with igra. example outbreak an outbreak investigation was initiated after a highschool student with active tb was notified in june 2018, 2 weeks after symptom onset. the initial investigation was conducted among 250 individuals by chest x-ray, and another student was diagnosed with active tb. of the 63 individuals tested for ltbi, 14 (seven close contacts, seven teachers) tested positive. ethics statements as routinely available data were used and no personal identifying information was collected, ethical clearance was not required. wpsar vol 12, no 1, 2020 | doi: 10.5365/wpsar.2020.11.3.005 https://ojs.wpro.who.int/4 rahevar et altb outbreaks in schools: case studies assessed at the beginning of an investigation, so that staff could be recruited from outside tb teams.4,7 sustained financial and human resources are crucial, as investigations may be prolonged. the republic of korea reported that a high turnover of nurses disrupts patient monitoring, and school breaks may interrupt field investigations. the importance of communication was evident, as tb outbreaks in schools often result in intensified attention from the media and communities. designating communications personnel to coordinate media requests and to brief the public and the media regularly was reported to be valuable. certain guidelines4–7 state that proactive communication with parents, the school administration, students, health practitioners and the general public is essential. the who outbreak communications guidelines detail best practices for effective communication with the public during an outbreak.8 in terms of cooperation in outbreak response, local public health centres were those primarily responsible, sometimes sharing the burden with school officials and external experts. this is consistent with the guideline of the european centre for disease control and prevention, which recommends that the core tb management team consult when necessary.7 in the four case studies, policies for managing tb outbreaks in schools were usually covered by the national tb strategy, with no specified contribution from other government bodies. a universal coordination mechanism might be difficult to define, as ministry jurisdictions and public health administrative structures differ among countries. in resource-limited settings, health care programmes may be supplemented with external resources (e.g. from nongovernmental or faith-based organizations). therefore, the most effective way of coordinating stakeholders is unclear. as large-scale outbreaks could deplete the available resources, guidelines for outbreak prevention and control are critical in resource-limited settings. there is also limited guidance on integrating outbreak response into the national tb programme. there are therefore gaps in the current knowledge base, particularly in settings most impacted by tb outbreaks in schools. conclusion the case studies illustrate the challenges and lessons learnt from tb outbreaks in schools across the western pacific discussion the four country case studies show the range of experiences in the western pacific region. the lessons and challenges experienced are summarized in table 1. while the countries faced similar challenges, the causes differed according to the tb burden and the resources available. some elements of the responses differed from who guidance on tb management (e.g. environmental sanitation). a systematic review was therefore conducted to guide interpretation of the case studies to understand evidence on tb outbreaks in schools globally (supplementary material). in most outbreaks, the index case was a secondary school or university student. as young adults and older children are likely to have more casual contacts than younger students, the size and complexity of field investigations may depend on the age of the affected students. some guidelines recommend a “stone-in-the-pond” approach to contact investigation, whereby contacts are prioritized according to their risk of exposure and susceptibility to tb;4–7 however, the approach is difficult to implement when the index case is a child. delayed diagnosis of tb was reported repeatedly. in countries with a low tb incidence, clinicians may be less aware of the symptoms and misdiagnose cases. delayed diagnosis may also be due to poor knowledge about tb among students, parents and teachers and to poor health-seeking behaviour by students. in some outbreaks, health promotion material has been distributed to increase awareness of tb and reduce stigmatization. china has developed online modules for students with tb to reduce interruption of schooling, which may reduce their hesitancy to seek care. as field investigations should begin soon after an outbreak is identified, there is a surge in demand for human resources (e.g. clinicians, nurses) and medical supplies (e.g. test kits, drugs). mongolia was unable to treat patients with ltbi because of a drug shortage and had to limit the number of follow-up investigations because of financial constraints. japan reported a lack of paediatricians with experience in tb for screening. in some outbreaks, assistance was obtained by recruiting resources from neighbouring districts or by screening over a longer period (supplementary material). guidelines suggest that the resources that will be required should be wpsar vol 12, no 1, 2020 | doi: 10.5365/wpsar.2020.11.3.005https://ojs.wpro.who.int/ 5 tb outbreaks in schools: case studiesrahevar et al screening and treatment, coordination of stakeholders in non-health sectors (e.g. education) and proactive communications. countries could adapt the principals to their context when developing a protocol for the prevention and control of tb outbreaks in schools. acknowledgements the authors wish to thank the national tb programmes of the countries in the western pacific region that shared their experiences. the authors acknowledge the contribution of dr anuzaya purevdagva, technical officer, who coordinated work with the national tb programmes. conflicts of interest the authors have no conflict of interests. funding none. references 1. global tuberculosis report. geneva: world health organization; 2020. 2. tb country profiles, 2019. geneva: world health organization; 2019. available from: https://worldhealthorg.shinyapps.io/tb_profiles/, accessed october 2020. 3. lesson 6: investigating an outbreak. in: principles of epidemiology in public health practice. 3rd edition. atlanta (ga): centers for disease control and prevention, office of workforce and career development; 2012. 4. chapter 12: contact follow-up and outbreak management in tuberculosis control. in: canadian tuberculosis standard, 7th edition. ottawa: public health agency of canada; 2014. 5. centers for disease control and prevention. guidelines for the investigation of contacts of persons with infectious tuberculosis. recommendations from the national tuberculosis controllers association and cdc. morbid mortal wkly rep. 2005;54:rr-15. 6. tuberculosis: nice guideline 33. london: national institute for health and care excellence; 2016. available from: https://www. nice.org.uk/guidance/ng33. 7. investigation and control of tuberculosis: incidents affecting children in congregate settings. stockholm: european centre for disease prevention and control; 2013. 8. who outbreak communication guidelines. geneva: world health organization; 2005. region. despite differences in the tb burden and in outbreak preparedness, the countries faced similar challenges. the key lessons include the importance of early outbreak detection to prevent delayed tb diagnosis, establishment of resource mobilization networks to meet the demands for specialized clinicians and supplies for tb table 1. key challenges and lessons learnt challenge lessons and solutions delayed tb diagnosis • empower students to identify and manage their health issues proactively by tb-related health promotion in schools and by reducing stigmatization. • outbreaks could be an opportunity to educate health care professionals and the general public about the persistence of tb in their community. • improve schools’ capacity to detect potential tb cases. low ltbi treatment uptake • educate students, teachers and parents about the importance of ltbi treatment. • offer ltbi treatment at the site of the outbreak. • create a treatment monitoring system to ensure that patients initiate and complete the full course of treatment. lack of financial support and human resource capacity • recruit staff (e.g. nurses, laboratory staff) and resources from neighbouring cities or from outside tb teams. • the available resources should be assessed at the start of a field investigation to ensure continuity of services. poor coordination among stakeholders • establish national policies and local plans to coordinate outbreak response. • health and education authorities, at all levels, should support schools in prevention and control activities. • clarify the role of each organization to ensure harmony and complementarity. media and community attention interference with outbreak response • outbreak communications should ensure 1) a clear, early announcement, 2) building and maintaining trust, 3) transparency and 4) understanding by the public. • designate a communications staff to coordinate media requests and to provide regular public briefings. • provide tb information and counselling to parents and students from the beginning of the outbreak. ltbi, latent tuberculosis infection; tb, tuberculosis https://worldhealthorg.shinyapps.io/tb_profiles/ https://worldhealthorg.shinyapps.io/tb_profiles/ https://www.nice.org.uk/guidance/ng33 https://www.nice.org.uk/guidance/ng33 https://ojs.wpro.who.int/ 1wpsar vol 12, no 2, 2021 | doi: 10.5365/wpsar.2020.11.1.003 perspective a central queensland university, cairns, australia. b hunter new england health, new lambton, australia. c james cook university, cairns, australia. published: 22 june 2021 doi: 10.5365/wpsar.2020.11.1.003 community first responders have been reported to make a difference in lmics in iraq, nigeria and south africa. in south africa, participants from a township in the cape town region who were given a 1-day training session provide effective basic first aid to members of their communities until professional ambulance services arrive.4 in a similar programme in ibadan, south-west nigeria, drivers of commercial passenger vehicles were trained for 2 days in basic first aid techniques.5 as commercial drivers are most likely to encounter motor vehicle accidents, they are able to provide immediate initial first aid. both programmes established that laypeople can successfully complete first aid training programmes, demonstrate skills and retain knowledge, as shown in re-testing.4,5 in iraq, village first responders worked in partnership with trained paramedics to treat victims of motor vehicle accidents, and a significant reduction in mortality was recorded among people who received such pre-hospital care.6 in most lmics, the burden of injury and illness affects not only the victims but also their families, communities and future generations. sickness or injury of the main income earner may reduce their ability to provide for the family, including food and education, with inherent negative effects.7 the extra burden placed on family members of caring for the sick or injured person may also negatively affect the family unit. sick or injured children can lose valuable time away from education, t he higher burdens of morbidity and mortality in lowand middle-income countries (lmics) in the western pacific region (wpr) could be reduced if there were community first responders qualified in first aid and trained according to the local context. in the wpr, the leading causes of death of people aged 5–49 years are violence and injury, which claim the lives of 1 million people each year.1 emerging data highlight the burden of violence and injury in the region,1 but there are no reliable data to indicate the potential benefits of having community first responders. community first responders might make a significant difference in the rates of mortality and morbidity associated with injury and with other health issues for which timely, effective first aid could help. in lmics in the wpr, the recognition and initiation of basic first-aid measures fall to the community because of limited access to formal health services.2 in this region, cardiovascular disease, complications of diabetes and respiratory diseases account for the majority of adult deaths, contribute to an increasing burden on the health systems and slow development.3 community first responders who are trained to identify these medical conditions could start targeted primary management and provide early reports to formal health service providers. potentially, first responders could significantly reduce the harm of delayed treatment of diseases and injuries in their communities. community first responders: a missing key to reducing the impact of injury and illness in lowand middle-income countries in the western pacific? andrew hodgetts,a peter massey,b michelle redman-maclarenc and roxanne bainbridgea correspondence to andrew hodgetts (email: a.hodgetts@cqu.edu.au) wpsar vol 12, no 2, 2021 | doi: 10.5365/wpsar.2020.11.1.003 https://ojs.wpro.who.int/2 hodgetts et alcommunity responders for reducing injury and illness in the western pacific region sustainable development goals.12 the potential of locally designed and developed community first responder programmes to reduce the burden of injury and illness in the wpr is untapped. a first step could be to work with local communities to understand how best to conduct training that is culturally relevant, acceptable and effective. if lives are to be saved and disability reduced, lmics in the region must find ways to provide effective training for community first responders, systems to sustain training and monitoring and optimal incorporation of social and cultural contexts into training. acknowledgement andrew hodgetts would like to acknowledge his colleagues in vanuatu for their invaluable insights and teaching about life and the delivery of health care in vanuatu. conflict of interest all authors declare no conflicts of interest. funding no funding to declare. references 1. regional action plan for violence and injury prevention in the western pacific: 2016–2020. manila: who regional office for the western pacific; 2016. available from: https://apps.who.int/iris/ handle/10665/208322, accessed 26 april 2021. 2. understanding health labour markets in the western pacific region. manila: who regional office for the western pacific; 2014. available from: https://apps.who.int/iris/handle/10665/208140, accessed 26 april 2021. 3. noncommunicable diseases in the western pacific region: a profile. manila: who regional office for the western pacific; 2012. available from: https://apps.who.int/iris/handle/10665/207510, accessed 26 april 2021. 4. sun jh, wallis la. the emergency first aid responder system model: using community members to assist life-threatening emergencies in violent, developing areas of need. emerg med j. 2012;29(8):673– 8. doi:10.1136/emermed-2011-200271 pmid:22011973 5. olumide ao, asuzu mc, kale oo. effect of first aid education on first aid knowledge and skills of commercial drivers in south west nigeria. prehosp disaster med. 2015;30(6):579–85. doi:10.1017/ s1049023x15005282 pmid:26507384 6. murad mk, issa db, mustafa fm, hassan ho, husum h. prehospital trauma system reduces mortality in severe trauma: a controlled study of road traffic casualties in iraq. prehosp disaster med. 2012;27(1):36–41. doi:10.1017/s1049023x11006819 pmid:22591929 affecting their future, which in turn can negatively affect the family unit and the community. trained community first responders could reduce this burden. additional benefits of community first responders stem from their intimate knowledge of the culture, assets and needs of the community. an example is the work of community rangers in the treaty village resilience program in papua new guinea.8 the rangers work with local nurses to deliver health and nutrition programmes and provide birthing assistance. all rangers complete first aid training and collaborate with villages to deliver projects to improve health, including water and sanitation. not only must community first responders understand the culture and needs of communities, but the community must trust the first responder programme and its participants. trust in community first responders was a key factor in a study in the united republic of tanzania of the perceptions of trauma patients to the introduction of community first responders.9 family members and neighbours were trusted most to deliver first aid, and taxi drivers and police officers were considered the least trustworthy. members of religious groups were also identified as a potential source of first responders, but this recommendation was not tested. trust in community first responders is poorly understood in the wpr. community first responders can also monitor and report important diseases in communities, as evidenced in a recent outbreak of ebola virus disease in west africa. contact tracing and reporting of early symptoms at district and local levels by community and religious leaders helped to identify and contain the outbreak in some communities.10 community and religious leaders also disseminated information and improved community cooperation in reporting disease presentations.10 this experience shows the importance of local training and capacity-building and of tailoring programmes to the local context.11 high-income countries in the wpr, such as australia, have a responsibility to support lmics in improving their health systems and training community first responders as they move towards achievement of the wpsar vol 12, no 2, 2021 | doi: 10.5365/wpsar. 2020.11.1.003https://ojs.wpro.who.int/ 3 community responders for reducing injury and illness in the western pacific regionhodgetts et al 10. ebola response. what needs to happen in 2015. geneva: world health organization; 2015. available from: https://www.who.int/csr/disease/ebola/one-year-report/responsein-2015/en/, accessed 27 january 2019. 11. dickmann p, kitua a, apfel f, lightfoot n. kampala manifesto: building community-based one health approaches to disease surveillance and response-the ebola legacy – lessons from a peer-led capacity-building initiative. plos negl trop dis. 2018;12(4):e0006292. doi:10.1371/journal.pntd.0006292 pmid:29608561 12. the sustainable development agenda. new york city: united nations; 2015. available from: https://www.un.org/sustainabledevelopment/development-agenda/, accessed 27 january 2019. 7. western pacific regional action plan for the prevention and control of noncommunicable diseases (2014–2020). manila: who regional office for the western pacific; 2014. available from: https://apps.who.int/iris/handle/10665/208175, accessed 26 april 2021. 8. johnson j, morris s, rutherford d, spencer w. treaty village resilience program annual report 2016–2017. cairns: reef and rainforest research centre. 9. kuzma k, lim ag, kepha b, nalitolela ne, reynolds ta. the tanzanian trauma patients’ prehospital experience: a qualitative interview-based study. bmj open. 2015;5(4):e006921. doi:10.1136/ bmjopen-2014-006921 pmid:25916487 https://ojs.wpro.who.int/ 1wpsar vol 12, no 1, 2021 | doi: 10.5365/wpsar.2019.10.2.002 lesson from the field a communicable disease control branch, south australia department for health and wellbeing, adelaide, south australia, australia. b country health sa local health network, south australia department for health and wellbeing, adelaide, south australia, australia. c ceduna koonibba aboriginal health service, ceduna, south australia, australia. d media and communications branch, south australia department for health and wellbeing, adelaide, south australia, australia. published: 8 march 2021 doi: 10.5365/wpsar.2019.10.2.002 problem: from december 2016 to february 2017, two cases of invasive meningococcal disease and one case of meningococcal conjunctivitis, all serogroup w, occurred in aboriginal children in the ceduna region of south australia. the clustering of cases in time and place met the threshold for a community outbreak. context: the ceduna region is a remote part of south australia, with more than 25% of the population identifying as aboriginal or torres strait islander. action: as part of the outbreak response, a community-wide meningococcal vaccination programme against serogroups a, c, w and y was implemented in a collaboration among different agencies of the south australia department for health and wellbeing, aboriginal health and community services providers, and other local service providers and government agencies. the programme comprised an outbreak vaccination schedule, targeting all people aged ≥ 2 months residing in the cases’ places of residence or in towns with close links. outcome: between march and june 2017, 3383 persons were vaccinated, achieving an estimated coverage of 71–85% of the target population, with 31% (n = 1034) of those vaccinated identifying as aboriginal or torres strait islander. no local cases of serogroup w occurred during the vaccination programme, but two further cases were notified by the end of 2018. discussion: the participation of a large number of local and non-health-sector stakeholders in programme planning and implementation, a clear response management structure and high community acceptability were identified as key factors that contributed to the programme achieving high vaccination coverage. the need to develop standard operating procedures for community-based outbreak response interventions to ease logistical challenges was considered an important lesson learnt. n eisseria meningitidis is a gram-negative diplococcus and the causative agent of invasive meningococcal disease (imd). imd commonly presents with meningitis and septicaemia.1,2 long-term sequelae may include limb amputation, hearing loss and neurological impairment.2 six serogroups account for nearly all human cases globally;1 in some reports, serogroup w is associated with higher case fatality rates and more frequent atypical presentations.3,4 worldwide, an estimated 10–20% of people asymptomatically carry n. meningitidis in their upper respiratory tract,1 with the highest carriage rates found in adolescents and young adults.5 imd is a notifiable disease in all australian jurisdictions. meningococcal conjunctivitis may precede imd in cases or contacts and is usually notified.6 nationally, the epidemiology of imd has changed markedly in the past several years, with serogroup w replacing serogroup b as the most common serogroup since 2016.7 by contrast, in south australia (sa), serogroup b was responsible for 81% (22/27) of notifications in 2016 and serogroup w lessons from a community vaccination programme to control a meningococcal disease serogroup w outbreak in remote south australia, 2017 louise flood,a matthew mcconnell,b luda molchanoff,b zell dodd,c jana sisnowski,a melissa fidock,a tina miller,c karli borresen,d hannah vogt,a and andrew laneb correspondence to jana sisnowski (email: jana.sisnowski@sa.gov.au) wpsar vol 12, no 1, 2021 | doi: 10.5365/wpsar.2019.10.2.002 https://ojs.wpro.who.int/2 flood et allessons from a meningococcal w vaccination programme in remote south australia action programme design and setting at the time of programme inception and implementation, publicly funded health services in regional and remote sa were provided by the country health sa local health network (chsalhn), which was part of sa health. in addition, aboriginal community controlled health services operate across sa. multiple national, state and local organizations were involved in planning and implementing the vaccination programme (box 1). for the remainder. compared with non-indigenous australians, aboriginal and torres strait islander people have higher rates of imd, particularly serogroup w.8 several meningococcal vaccines against serogroups a, c, w and y are available for private purchase in australia and have been funded under the national immunisation program from july 2018 for infants and april 2019 for adolescents. problem from december 2016 to february 2017, the communicable disease control branch at the sa department for health and wellbeing (sa health) was notified of two cases of imd serogroup w and one case of meningococcal conjunctivitis serogroup w in the ceduna local government area. serogroup w had not been notified in this region since records started in 1990. all three cases occurred in aboriginal children aged 2 to 12 years, with no additional epidemiological links between the cases. fine typing was available for two of the three cases: both were p1.5,2:f1–1. as part of routine public health followup of sporadic cases, the communicable disease control branch directed that close contacts should receive clearance antibiotics, and approximately 300 contacts, including close contacts, were vaccinated in january and february 2017. the ceduna local government area is a remote part of australia, with an estimated resident population of 3716 persons as of 30 june 2016. approximately 25% of residents identify as aboriginal or torres strait islander. the estimated attack rate of 81 cases (or 54 invasive cases) per 100 000 population during the three months from december 2016 through february 2017 exceeded not only the threshold for defining a community outbreak of 10 cases per 100 000 population as defined by the national guidelines of the communicable diseases network australia, but also the lower thresholds for implementing population-wide disease control measures in remote aboriginal or torres strait islander communities.6 an outbreak response was commenced, and a community-wide vaccination programme was implemented to prevent the occurrence of further cases of imd serogroup w in the ceduna region. box 1. organizations involved in planning and implementing the ceduna community vaccination programme, south australia, 2017 commonwealth (national), state and local government entities • commonwealth department of the prime minister and cabinet, ceduna office • sa health, including: • country health sa local health network, eyre and far north region and corporate office • communicable disease control branch • media and communications branch • sa ambulance service • sa department for child protection, ceduna office • sa department for communities and social inclusion, housing sa and ceduna street beat • district council of ceduna aboriginal health and community services • ceduna koonibba aboriginal health service • tullawon health services, yalata • oak valley health services, maralinga tjarutja lands • aboriginal health council of south australia • pangula mannamurna aboriginal corporation • nunkuwarrin yunti of south australia inc. other community services • centacare catholic family services, ceduna office wpsar vol 12, no 1, 2021 | doi: 10.5365/wpsar.2019.10.2.002https://ojs.wpro.who.int/ 3 lessons from a meningococcal w vaccination programme in remote south australiaflood et al a steering committee was convened to coordinate the outbreak response and was composed of representatives from the communicable disease control branch, chsalhn and the media and communications branch of sa health; the aboriginal health council of south australia; and ceduna koonibba aboriginal health service. target population based on cases’ residence and known links between towns, the programme area (fig. 1) encompassed ceduna, thevenard, denial bay, koonibba, yalata, penong, oak valley in the maralinga tjarutja lands (lands owned by the aboriginal traditional owners and administered as an aboriginal council, or ac), the homeland property scotdesco (all of these are in postcode area 5690) and smoky bay (part of postcode area 5680). given a lack of knowledge of meningococcal w carriage rates and the likely extent of population mixing, all aboriginal and non-aboriginal persons aged ≥ 2 months were targeted for vaccination (meningococcal acwy vaccines are not licensed for individuals aged < 2 months). based on numbers from the australian bureau of statistics and local records, eligibility for vaccination was estimated at 4000–4500 individuals. vaccination schedule the dosing schedule recommended in the australian immunisation handbook for persons travelling to epidemic-prone areas or mass gatherings9 was used, that is, a primary vaccination course consisting of one to three doses, depending on the vaccine, age of the individual and their medical risk factors. at the time, menveo® (glaxosmithkline) was the only vaccine registered for use in infants younger than 12 months and was used to vaccinate children aged 2 months to < 12 months. nimenrix® (pfizer) was originally intended to be used in all persons aged ≥ 12 months because only one dose is required for all age groups in the absence of medical risk factors. however, due to limited vaccine supply following the concomitant introduction of adolescent meningococcal acwy vaccination programmes in other australian states, the vaccination schedule was altered to allow either nimenrix or menveo to be used in persons aged ≥ 2 years. because two doses of menveo are required in children aged 12–23 months, nimenrix was used exclusively in this age group. resources in order to staff vaccination clinics, additional clinical staff were made available from aboriginal health services, other chsalhn sites and regions, and from metropolitan areas. other government and nongovernmental organizations contributed non-clinical staff. standing medication orders for administering menveo and nimenrix had to be signed by each participating service. a communication campaign was developed and implemented within two weeks and delivered for less than 2000 australian dollars. paid communications included a facebook post, a local newspaper advertisement and a radio advertisement in english and pitjantjatjara (the local aboriginal language). posters and fact sheets were created for both the public and health-care workers, and three press releases featuring local spokespersons targeted local and state newspapers. all information was made available centrally on the sa health website. in addition to developing the schedule and standing medication orders for both vaccines, an immunization screening and consent form and a separate consent resource were developed for use on immunization day. programme data were entered into a database, and the vaccines administered were retrospectively entered onto the australian immunisation register for patients whose medicare numbers had been collected. ethics statement this article describes public health actions undertaken as part of an outbreak response under the south australian public health act 2011 that did not require ethics approval. outcomes the community vaccination programme commenced on 6 march 2017 and ran for two weeks at the ceduna town hall. it continued until 30 june 2017 at penong town hall (and included residents of scotdesco), the koonibba clinic, the smoky bay and districts community club, the tullawon health services clinic at yalata, the oak valley health clinic, the ceduna koonibba aboriginal health service and the ceduna family medical practice. a total of 3383 individuals received a meningococcal wpsar vol 12, no 1, 2021 | doi: 10.5365/wpsar.2019.10.2.002 https://ojs.wpro.who.int/4 flood et allessons from a meningococcal w vaccination programme in remote south australia acwy vaccination, with 87 individuals recorded as requiring follow-up vaccination due to their age or medical risk status. no serious side-effects were reported. data completeness exceeded 98% for the categories of indigenous status, gender and age. of those vaccinated, 52% (n = 1757) were female; 31% (n = 1034) identified as aboriginal or torres strait islander; and 91% (n = 3082) lived in a target suburb or one of the two postcodes containing those suburbs. the median age was 37 years (interquartile range: 17–55 years). inclusive of the contacts of the first two cases, the programme reached almost 3700 people, estimated to represent 71–85% of the target population (table 1). no cases of imd or meningococcal conjunctivitis caused by the quadrivalent vaccine serogroups were notified in either of the postcodes targeted by the programme during the duration of the vaccination campaign. overall, there have been 11 cases of serogroup w meningococcal disease in sa since the end of the programme in june 2017 until the end of 2018, including two cases in the ceduna area targeted by the vaccination programme: in july 2017, a case was notified in an adult male of nonaboriginal background who had declined vaccination in ceduna and whose three household contacts were also unvaccinated. in august 2018, another case was notified in an aboriginal child who had not been born at the time of the vaccination programme and was a household contact of a previous ceduna-area case. fine typing for the first case in the post-vaccination period showed the strain to be of the same type as two of the pre-vaccination cases. discussion and lessons learnt the ceduna community vaccination programme did not prevent the occurrence of further cases of imd serogroup w in the area. nevertheless, it demonstrated that community-wide vaccination is a useful public health response to a geographically limited outbreak of meningococcal disease. despite the considerable logistical effort required, the programme reached up to 85% of the target population. ongoing transmission was interrupted in the short term, and given the high vaccination coverage, the large majority of residents can be assumed to have achieved immunity even if the programme may have failed to sufficiently reduce carriage rates and provide herd immunity in the medium term to long term. given the large knowledge gaps in the community,10 the vaccination programme provided the additional benefit of educating the community about the signs and symptoms of imd. as meningococcal acwy vaccination has been funded under the national immunisation program from july 2018 for infants and april 2019 for adolescents, there may not be a need for ad hoc community vaccinafig. 1. map of the programme target area for vaccination with meningococcal acwy vaccine including australian bureau of statistics postal areas, state suburbs and the maralinga tjarutja aboriginal council (ac) local government area, south australia, 2017 wpsar vol 12, no 1, 2021 | doi: 10.5365/wpsar.2019.10.2.002https://ojs.wpro.who.int/ 5 lessons from a meningococcal w vaccination programme in remote south australiaflood et al tion programmes in ceduna and elsewhere in australia unless an outbreak specifically affects cohorts who were not eligible for vaccination. a post-response evaluation meeting identified three elements as critical to the successful implementation of the community vaccination programme. first, the response was locally driven, with a large number of healthand non-health-sector stakeholders involved in planning and implementing the programme. in particular, local community engagement ensured that clinics were appropriately staffed and vaccinations could be delivered in readily accessible community locations, such as the ceduna town hall, which had the most regularly visited clinic. second, the inclusion of a wide variety of stakeholders was supplemented with a clear response management structure, involving leads from all key agencies. the steering committee responded flexibly to external challenges, including the shortage of nimenrix and initial confusion about the relation of the meningococcal w vaccination programme to a concomitant state-wide adolescent meningococcal b vaccination a population estimates used as the denominator for both suburb total and the total for suburb and wider postcodes containing target suburbs are those used in programme planning (4000–4500 persons). the lower bounds of the coverage estimates are based on the higher population estimate, and the higher bounds are based on the lower population estimate. b these are the household or household-like contacts vaccinated as part of immediate case follow-up. study.11 third, the community was generally receptive to the meningococcal w vaccination programme, which may have been helped by the involvement of local staff familiar with the programme and attuned to identifying local solutions. for instance, local aboriginal health workers and aboriginal health practitioners were able to assist aboriginal participants in providing informed consent. while more than 90% of vaccinations were administered to persons known to reside in the target postcodes, no proof of address was required. as a result, data completeness and quality for addresses was poor for a subset of records, and the majority of the remaining 10% for whom their postcode could not be determined are likely to also reside in the target area. addresses given in surrounding areas, greater adelaide and other australian jurisdictions suggest that a small number of persons vaccinated were not considered residents from an administrative point of view. as this may reflect travel patterns and community ties in a mobile, remote population, the vaccination of additional persons table 1. number and overall coverage estimates of meningococcal acwy vaccination by suburb and postcode, south australia, 2017 location vaccination events (n) population denominatora estimated coverage total no. in target suburbs and case contactsb 3180 4000–4500 71–80% ceduna 1584 thevenard 352 denial bay 89 koonibba 129 smoky bay 182 yalata 315 oak valley 69 scotdesco 24 penong 135 case contacts 301 no. in postcode 5690 (other than target suburbs above) 145 no denominator available no separate estimate feasibleno. in postcode 5680 (other than target suburbs above) 58 total no. in wider target area (target suburbs and wider postcodes containing target suburbs) 3383 4000–4500 75–85% total no. with suburb or postcode not stated or from another area 306 no denominator available no separate estimate feasible wpsar vol 12, no 1, 2021 | doi: 10.5365/wpsar.2019.10.2.002 https://ojs.wpro.who.int/6 flood et allessons from a meningococcal w vaccination programme in remote south australia (sa department of child protection, ceduna office); clare huppatz (wa health); dr ann koehler and the staff of the communicable disease control branch at sa health. conflicts of interest the authors declare no conflicts of interest. funding information no funding was received. references 1. rosenstein ne, perkins ba, stephens ds, popovic t, hughes jm. meningococcal disease. n engl j med. 2001;344:1378–88. doi:10.1056/nejm200105033441807 pmid:11333996 2. heymann dl, editor. control of communicable diseases manual, nineteenth edition. washington, dc: american public health association; 2015. 3. wang b, santoreneos r, giles l, haji ali afzali h, marshall h. case fatality rates of invasive meningococcal disease by serogroup and age: a systematic review and meta-analysis. vaccine. 2019;37(21):2768–82. doi:10.1016/j.vaccine.2019.04.020 4. campbell h, parikh sr, borrow r, kaczmarski e, ramsay me, ladhani sn. presentation with gastrointestinal symptoms and high case fatality associated with group w meningococcal disease (menw) in teenagers, england, july 2015 to january 2016. euro surveill. 2016;21(12):30175. doi:10.2807/1560-7917. es.2016.21.12.30175 pmid:27035055 5. christensen h, may m, bowen l, hickman m, trotter cl. meningococcal carriage by age: a systematic review and meta-analysis. lancet infect dis. 2010;10(12):853–61. doi:10.1016/s14733099(10)70251-6 pmid:21075057 6. invasive meningococcal disease: cdna national guidelines for public health. canberra: australian government department of health; 2017. available from: http://www.health.gov.au/internet/ main/publishing.nsf/content/cdna-song-imd.htm, accessed 14 august 2018. 7. meningococcal disease (invasive): public dataset. canberra: australian government department of health; 2018. available from: http://www9.health.gov.au/cda/source/pub_menin.cfm, accessed 14 august 2018. 8. booy r. recent and current epidemiology of invasive meningococcal disease – vaccines & vaccine policy [slide presentation]. sydney: national centre for immunisation research and surveillance; 2018. available from: https://immunisationcoalition.org.au/wp-content/ uploads/2018/06/9.-booy-meningococcal-talk.pdf, accessed 14 august 2018. 9. australian technical advisory group on immunisation. australian immunisation handbook. canberra: australian government department of health; 2018. available from: https://immunisationhandbook.health.gov.au, accessed 14 august 2018. 10. wang b, clarke m, afzali hh, marshall h. community, parental and adolescent awareness and knowledge of meningococcal disease. vaccine. 2014;32(18):2042–9. doi:10.1016/j.vaccine.2014.02.054 pmid:24593997 11. marshall hs, mcmillan m, koehler a, lawrence a, maclennan jm, maiden mcj, et al. b part of it protocol: a cluster randomised controlled trial to assess the impact of 4cmenb vaccine on pharyngeal carriage of neisseria meningitidis in adolescents. bmj open. 2018;8(7):e020988. doi:10.1136/bmjopen-2017-020988 pmid:29991629 who may be de facto members of the target community is likely to have aided the response. the programme encountered several logistical challenges. estimating the quantity of vaccine required at different sites was challenging due to a lack of current population data at the town level and considerable fluctuation of population numbers in aboriginal communities. nevertheless, there was minimal wastage of vaccines: 79 vaccine doses needed to be discarded due to cold chain breaches at two separate sites, and there was no surplus vaccine because several other acwy vaccination programmes were commenced simultaneously due to ongoing cases in other remote areas of sa. the vaccination programme at only one clinic had to be repeated due to an underestimation of population numbers at the site. areas for improvement were identified with regard to several operational aspects of the response. these are related to the overarching recommendation to develop standard operating procedures for community-based interventions for outbreak response that can be adapted for state-wide use. they include: 1. standardizing provisions to allow staff to move between different regions of the chsalhn and different departments of sa health and avoiding the use of separate standing medication orders; 2. designating a single point of contact for clinical enquiries and decision support during the entire vaccination period; 3. streamlining media communications to reduce delays and lead-in time, including critical assessment of the value added by translations; 4. maximizing the use of community venues and offering extended and weekend opening times, resources permitting; and 5. improving data collection during the outbreak response, including recording medicare numbers for the australian immunisation register and integrating clinical management software to enable follow-up of vaccinations. acknowledgements the authors would like to acknowledge the contributions of the following people to the successful conception and roll-out of the programme: tanya wolf, jenny fyfe, julia waddington powell (all chsalhn); jacqueline costanzo doi:10.2807/1560-7917.es.2016.21.12.30175 doi:10.2807/1560-7917.es.2016.21.12.30175 https://www.ncbi.nlm.nih.gov/entrez/query.fcgi?cmd=retrieve&db=pubmed&list_uids=27035055&dopt=abstract doi:10.1016/s1473-3099(10)70251-6 doi:10.1016/s1473-3099(10)70251-6 https://www.ncbi.nlm.nih.gov/entrez/query.fcgi?cmd=retrieve&db=pubmed&list_uids=21075057&dopt=abstract http://www.health.gov.au/internet/main/publishing.nsf/content/cdna-song-imd.htm http://www.health.gov.au/internet/main/publishing.nsf/content/cdna-song-imd.htm http://www9.health.gov.au/cda/source/pub_menin.cfm https://immunisationcoalition.org.au/wp-content/uploads/2018/06/9.-booy-meningococcal-talk.pdf https://immunisationcoalition.org.au/wp-content/uploads/2018/06/9.-booy-meningococcal-talk.pdf doi:10.1016/j.vaccine.2014.02.054 doi:10.1016/j.vaccine.2014.02.054 https://www.ncbi.nlm.nih.gov/entrez/query.fcgi?cmd=retrieve&db=pubmed&list_uids=24593997&dopt=abstract doi:10.1136/bmjopen-2017-020988 https://www.ncbi.nlm.nih.gov/entrez/query.fcgi?cmd=retrieve&db=pubmed&list_uids=29991629&dopt=abstract https://www.ncbi.nlm.nih.gov/entrez/query.fcgi?cmd=retrieve&db=pubmed&list_uids=29991629&dopt=abstract epidemiological update on the dengue situation in the western pacific region, 2012 regional analysis yuzo arima,a may chiewa and tamano matsuia on behalf of the emerging disease surveillance and response team, division of health security and emergencies, world health organization regional office for the western pacific a emerging disease surveillance and response, division of health security and emergencies, world health organization regional office for the western pacific, manila, philippines. correspondence to the emerging disease surveillance and response unit (e-mail:outbreak@wpro.who.int). to cite this article: arima y et al. epidemiological update on the dengue situation in the western pacific region, 2012. western pacific surveillance and response journal, 2015, 6(2):82–89. doi:10.5365/wpsar.2014.5.4.002 abstract dengue has caused a substantial public health burden in the western pacific region. to assess this burden and regional trends, data were collated and summarized from indicator-based surveillance systems on dengue cases and deaths from countries and areas in the western pacific region. in 2012, dengue notifications continued to increase with 356 838 dengue cases reported in the region (relative to 244 855 cases reported in 2011) of which 1248 died. in the asia subregion, the notification rate was highest in cambodia, the philippines and the lao people’s democratic republic (316.2, 198.9 and 162.4 per 100 000 population, respectively), and in the pacific island countries and areas, the notification rate was highest in niue, the marshall islands and the federated states of micronesia (8556.0, 337.0 and 265.1 per 100 000 population, respectively). all four serotypes were circulating in the region in 2012 with considerable variabilitiy in distribution. regional surveillance provides important information to enhance situational awareness, conduct risk assessments and improve preparedness activities. introduction in recent years, dengue has become a major public health concern in the western pacific region, resulting in substantial morbidity, mortality and economic cost.1–3 such public health and economic burdens have become clear not only from national surveillance data but also from operational research studies aimed at estimating the dengue disease burden.4 the epidemiology and virology of dengue continues to display complex behaviour with serotype interactions, antibody-dependent enhancement and cross-immunity, climate and notable gender and age distributions.5–8 notifications of dengue cases – most likely an underestimate of the true burden4,9 – have increased over the past decade, with more than 200 000 annual cases consistently reported in the western pacific region since 2007,1,2 and nearly 250 000 dengue cases reported in the region in 2011.2 this analysis reports the 2012 annual regional dengue surveillance data collated by the world health organization (who) western pacific regional office. methods regional dengue data for 2012 were collated from indicator-based surveillance systems from countries and areas in the region. data were either sent to who from the ministries of health or collected from their websites. additional data were provided from australia, cambodia, the lao people’s democratic republic, malaysia, the philippines, singapore and viet nam. a summary of the dengue surveillance systems, case definitions, laboratory sampling methods and serotype data are included. malaysia and the philippines were the only countries with changes since the 2011 annual report.2 for malaysia, all cases fulfilling the clinical criteria for dengue or those with a positive laboratory confirmation were reported; for the first time, ns1 antigen detection was included as a testing method. in the philippines, the 2009 dengue case classification system continued to be rolled out in 2012 following training at the regional, provincial and municipal/city health offices. training was ongoing at the end of 2012, and hence the new case definition was not applied nationwide by the year end. results dengue in the western pacific region in 2012, western pacific region member states reported a total of 356 838 dengue cases of which 1248 died for a case fatality rate of 0.34% (figure 1). in the asia subregion, both the notification rate and the absolute number of reported dengue cases were highest in the philippines (table 1). in the pacific subregion, there were large increases in notification rates in niue, fiji and new caledonia relative to 2011.2 while australia reported more than 1500 laboratory-confirmed cases (table 2), the majority were imported cases. figure 1. number of reported dengue cases and case fatality rates in the western pacific region, 2000 to 2012* click to download figure 1. jpg, 304kb source: world health organization regional office for the western pacific. * dengue surveillance and reporting systems vary by country. cfr, case fatality rate. table 1. cases of dengue, including imported cases, and dengue-attributed deaths reported in the western pacific region for 2012* click to download table 1. jpg, 663kb source: world health organization regional office for the western pacific. * dengue surveillance and reporting systems vary by country. † the following countries and territories did not report dengue data: american samoa, cook islands, french polynesia, guam, nauru, the commonwealth of northern mariana islands, palau, papua new guinea, pitcairn islands, samoa, solomon islands, tokelau, tonga, tuvalu, vanuatu and wallis and futuna. table 2 . reported number of dengue cases, deaths and case fatality rates from cambodia, the lao people’s democratic republic, malaysia, the philippines, singapore, viet nam and australia, 2008–2012* click to download table 2. jpg, 447kb source: world health organization regional office for the western pacific. * dengue surveillance and reporting systems vary by country. cfr, case fatality rate. while laboratory sampling schemes and confirmation methods vary by country, most of the countries in this report were using the updated (2009) dengue case classification system in 2012 (table 3). table 3. dengue case definitions, laboratory sampling and testing methods used for surveillance in cambodia, the lao people’s democratic republic, malaysia, the philippines, singapore, viet nam and australia, 2012* click to download table 3. jpg, 989kb * only the minimum criteria required for fulfilling a clinical dengue case definition are included here; additional signs and symptoms required for more severe forms (e.g. dengue haemorrhagic fever, dengue shock syndrome) are not listed here. † a probable dengue case is defined as any case with fever and two or more of the following: nausea, vomiting, rash, aches and pains, positive tourniquet test, leucopenia and any warning sign. a case with warning signs is defined as a clinically diagnosed case with any of the following: abdominal pain or tenderness, persistent vomiting, clinical fluid accumulation, mucosal bleed, lethargy, restlessness, liver enlargement > 2 cm and increase in haematocrit concurrent with rapid decrease in platelet count. severe dengue is defined as severe plasma leakage leading to any of the following: shock, fluid accumulation with respiratory distress or severe bleeding as evaluated by clinician or severe organ involvement of liver (aspartate amino transferase or alanine amino transferase ≥ 1000), central nervous system (impaired consciousness) or heart and other organs. for those countries providing additional data, all except for singapore reported a higher number of cases in 2012 compared with 2011 (table 2). overall, the number of cases reported in 2012 was more than 40% higher than in 2011.2 asia subregion cambodia in 2012, cambodia reported 42 362 clinical dengue cases (189 fatal), considerably more than the 15 980 cases reported in the previous year (table 3). notifications peaked in week 27 (n = 2447 cases) in july (figure 2), similar to 2011 (peak in july) and 2010 (peak in august). among those aged more than 15 years, there was a higher proportion of males (male-to-female ratio: 1.2 to 1). among the 500 laboratory-tested cases, 463 (93%) were confirmed. three serotypes circulated with the predominant serotype being den-1 (den-1 n = 368 [98%], den-2 n = 5 [1%] and den-4 n = 3 [1%]). figure 2. reported number of dengue cases by calendar week (cambodia, the lao people’s democratic republic, malaysia, new caledonia and singapore) and month (australia and the philippines), 2012 click to download figure 2. jpg, 317kb the lao people’s democratic republic in 2012, 9952 clinical dengue cases (22 fatal) were reported, more than double that of 2011 (table 2). notifications peaked in week 40 (n = 555 cases) in october (figure 2), later than in 2011 (peak in september) and 2010 (peak in august). among the 871 laboratory-tested cases, 449 (52%) were confirmed. while all four serotypes circulated, the predominant serotype was den-3 (den-3 n = 164 [80%], den-1 n = 23 [11%], den-2 n = 18 [9%] and den-4 n = 1 [ malaysia in 2012, malaysia reported 21 900 cases (35 fatal), similar to 2011 and relatively low compared to years before 2011 (table 3). however, this was the first year that those with a laboratory confirmation, regardless of clinical manifestation, were included (table 3). the highest number of cases (n = 602) was reported during week 8 in february; higher notifications were observed from december through february (figure 2), similar to 2011 when a peak was observed in january. among the 7797 laboratory-tested cases, 6506 (83%) were confirmed. all four serotypes were detected with an almost equal distribution (den-3 n = 263 [31%], den-1 n = 222 [26%], den-4 n = 185 [22%] and den-2 n = 184 [22%]). the philippines in 2012, the philippines reported 187 031 clinical cases (921 fatal), a 48% increase compared with 2011 (table 2), with a peak in the month of august (n = 31 999) (figure 2). those aged 5–14 years were the age group with the largest number of cases. among the 165 laboratory-tested cases, 142 (86%) were confirmed and among the serotyped cases, den-1 predominated (den-1 n = 128 [90%], den-2 n = 10 [7%] and den-3 n = 4 [3%]). singapore in 2012, singapore reported 4632 laboratory-confirmed cases of dengue (2 fatal), less than that reported in 2011 or 2010 (table 2), with a peak in week 26 (n = 152 cases) in june (figure 2), similar to 2011 which peaked in july. while all four serotypes were detected, the predominant serotype among 1333 serotyped cases was den-2 (den-2 n = 988 [74%], den-1 n = 258 [19%], den-3 n = 76 [6%] and den-4 n = 11 [1%]). viet nam in 2012, viet nam reported 86 026 clinical cases (79 fatal), greater than that reported in 2011 (table 3). among the 13 222 laboratory-tested cases, 5317 (40%) were confirmed. all four serotypes were detected with den-1 most common (den-1 n = 319 [32%], den-2 n = 262 [26%], den-4 n = 235 [23%] and den-3 n = 188 [19%]). pacific subregion australia in 2012, australia reported 1542 laboratory-confirmed dengue cases (0 fatal), the largest number reported in the past five years (table 2), with a peak in the month of january (n = 267 cases) (figure 2) similar to 2011. in north queensland, among 28 locally acquired dengue cases, the predominant serotype was den-1 (14 den-1, 7 den-3, 1 den-2 and 6 untyped); 13 of the 28 cases were male. among 41 imported cases, 22 were den-2, 13 were den-1, 3 were den-3, 1 was den-4 and 2 were not typed (personal communication, dr sonia harmen, tropical public health services cairns, division 1 family health and well-being cairns and hinterland hospital and health service, queensland government). from the pacific subregion, niue had the highest notification rate (8556 per 100 000 population; 128 cases), fiji reported more than 700 cases (82.6 per 100 000 population) and new caledonia had a large increase in notifications in the last quarter of 2012 (figure 2) with nearly 500 cases (194.3 per 100 000 population) reported compared with a single case in 2011 (table 1). in new zealand, where dengue is not endemic, 77 cases were reported in 2012 with 76 being classified as imported cases. discussion dengue continued to burden the western pacific region in 2012 with the overall number of notifications greater than previous years. more than 1000 cases were reported each from australia, cambodia, the lao people’s democratic republic, malaysia, the philippines, singapore and viet nam; except for singapore, they all reported an increase in cases compared with 2011. seasonally, dengue notifications followed historic patterns, increasing and peaking during the wet season in cambodia, the lao people’s democratic republic, the philippines and viet nam. while some countries had the same serotype predominate as in the previous year (cambodia, malaysia, singapore and viet nam), others saw a change, including australia and the lao people’s democratic republic. in the latter, den-3 became predominant in 2012 compared with den-1 during 20101 and 2011.2 in the pacific subregion, although large outbreaks were observed in the federated states of micronesia and the marshall islands in 2011, notifications were lower in 2012. however, fiji and niue experienced a high number of dengue notifications, and there was an increase in notifications observed in new caledonia that was the beginning of the largest outbreak ever reported in the territory.10 although dengue-specific surveillance is not conducted in papua new guinea, circulation of the virus there is well recognized from epidemiologic and phylogenetic analyses of imported cases in australia and elsewhere.11 the notable changes in notification rates and shifts in serotype distribution since 2011 highlight once again the need for ongoing surveillance, information-sharing and assessment. timely notification at the local level acts as a trigger for early response, such as vector control and outbreak investigations to interrupt transmission locally. at a country or regional level, routine and timely information-sharing enhances situational awareness and feeds into risk assessment and preparedness activities such as risk communication for neighbouring countries or those with close trade/travel links (e.g. dengue has been introduced from asia to isolated pacific islands12). importantly, since routine biweekly reporting of the regional dengue situation started in 2010, information has been regularly shared through wider public health surveillance networks such as promed13 and translated for local use by member states to raise awareness for travellers’ health.14 regional information-sharing activities to promote early response are in line with the who asia pacific strategy for emerging diseases framework to strengthen national and regional capacities for surveillance and response. as for previous regional analyses of dengue,1,2 there are important limitations in the surveillance data, both for interpreting the actual burden of dengue (e.g. underreporting) and trends over time (e.g. changes in disease awareness, diagnosis/testing/reporting behaviour). for example, in malaysia, ns1 antigen positive specimens were added as an approved laboratory testing method for surveillance, and regardless of clinical manifestation, patients with laboratory confirmation were included as cases in 2012. in the philippines, the 2009 dengue classification system continued to be rolled out to replace the clinical case definition that was still in much use during 2011. comparisons across countries also require caution, as australia and singapore report laboratory-confirmed cases only, while cambodia, the lao people’s democratic republic, malaysia, the philippines and viet nam primarily clinically suspected cases; such practices may lead to underor over-reporting. importantly, case fatality rates are affected not only by clinical management but also by health-care-seeking behaviour, reporting practices of clinicians, case definitions, timing of report, follow-up and verification procedures; these factors can also differ across member states and over time. sampling schemes for laboratory confirmation also differ across member states and may not be systematic or representative, potentially limiting the interpretability of the reported serotype distribution. lastly, the 2009 dengue case classification scheme became incorporated by many member states with dengue surveillance systems during 2011 and 2012, affecting comparability with previous years. while acknowledging these limitations, there will continue to be a need for region-wide sharing of dengue data on a routine and timely basis. direct comparisons of notification rates and case fatality rates between countries should be avoided; within countries, however, historic and consistent seasonal trends have been observed along with potentially important changes such as serotype distribution. such surveillance data can also be used for mathematical models6 and to provide baseline dengue surveillance data when a dengue vaccine enters the market. lastly, in this rapidly developing and interconnected region, the ever-increasing importation of cases into non-endemic areas signifies the importance of monitoring and sharing dengue information by all countries.15 conflicts of interest none declared. funding none. acknowledgements the authors would like to thank all the who country fffice staff and member states in the western pacific region for assisting with the surveillance data collection and reporting. references: arima y, matsui t. epidemiologic update of dengue in the western pacific region, 2010. western pacific surveillance and response journal, 2011, 2:4–8. doi:10.5365/wpsar.2011.2.2.005 pmid:23908882 arima y et al. epidemiologic update on the dengue situation in the western pacific region, 2011. western pacific surveillance and response journal, 2013, 4(2):47–54. doi:10.5365/wpsar.2012.3.4.019 pmid:24015372 shepard ds, undurraga ea, halasa ya. economic and disease burden of dengue in southeast asia. plos neglected tropical diseases, 2013, 7:e2055. doi:10.1371/journal.pntd.0002055 pmid:23437406 vong s et al. under-recognition and reporting of dengue in cambodia: a capture-recapture analysis of the national dengue surveillance system. epidemiology and infection, 2012, 140:491–499. doi:10.1017/s0950268811001191 pmid:21733251 duong v et al. complex dynamic of dengue virus serotypes 2 and 3 in cambodia following series of climate disasters. infection, genetics and evolution, 2013, 15: 77–86. doi:10.1016/j.meegid.2012.05.012 reich ng et al. interactions between serotypes of dengue highlight epidemiological impact of cross-immunity. journal of the royal society, interface, 2013, 10:20130414. doi:10.1098/rsif.2013.0414 pmid:2382511623825116 anker m, arima y. male-female differences in the number of reported incident dengue fever cases in six asian countries. western pacific surveillance and response journal, 2011, 2(2):17–23. doi:10.5365/wpsar.2011.2.1.002 pmid:23908884 prasith n et al. assessment of gender distribution in dengue surveillance data, the lao people’s democratic republic. western pacific surveillance and response journal, 2013, 4(2):17–24. doi:10.5365/wpsar.2012.3.4.020 pmid:24015367 undurraga ea, halasa ya, shepard ds. use of expansion factors to estimate the burden of dengue in southeast asia: a systematic analysis. plos neglected tropical diseases, 2013, 7:e2056. dupont-rouzeyrol m et al. epidemiological and molecular features of dengue virus type-1 in new caledonia, south pacific, 2001–2013. virology journal, 2014, 11:61. doi:10.1186/1743-422x-11-61 pmid:24684835 warrilow d, northill ja, pyke at. sources of dengue viruses imported into queensland, australia, 2002–2010. emerging infectious diseases, 2012, 18:1850–1857. doi:10.3201/eid1811.120014 pmid:23092682 wilder-smith a, gubler dj. geographic expansion of dengue: the impact of international travel. the medical clinics of north america, 2008, 92:1377–1390, x. doi:10.1016/j.mcna.2008.07.002 pmid:19061757 promed. published date: 2012–09–17 16:43:48. subject: pro/edr> dengue/dhf update 2012 (43): asia archive number: 20120917.1297396. available from: http://www.promedmail.org/direct.php?id=20120917.1297396 [accessed 26 february 2015]. quarantine information dengue situation updates – asia [in japanese]. tokyo, office ministry of health, labour and welfare japan, 2014. nakamura n et al. incidence of dengue virus infection among japanese travellers, 2006 to 2010. western pacific surveillance and response journal, 2012, 3(2):39–45. doi:10.5365/wpsar.2011.2.3.002 pmid:23908911 https://ojs.wpro.who.int/ 1wpsar vol 12, no 2, 2021 | doi: 10.5365/wpsar.2020.11.2.001 original research g lobally, seasonal influenza is estimated to be associated with severe respiratory illness in 3–5 million people1 and with 290 000–650 000 deaths from respiratory illness each year.2 although the majority of people infected with seasonal influenza recover, it can cause severe illness or death, particularly in high-risk groups, including pregnant women, children aged <5 years, older people and individuals with comorbidities.1 in lowand middle-income countries and countries in the tropics, the burden of influenza is poorly understood.3 in the lao people’s democratic republic (lao pdr), respiratory samples are collected to be tested for influenza at six sentinel sites monitoring severe acute respiratory infection (sari). aggregated a national center for laboratory and epidemiology, vientiane, lao people’s democratic republic. b who health emergencies programme, world health organization, vientiane, lao people’s democratic republic. c influenza division, thailand regional influenza program, united states centers for disease control and prevention, nonthaburi, thailand. d influenza division, united states centers for disease control and prevention, us embassy, vientiane, lao people’s democratic republic. e health emergency information and risk assessment, who health emergencies programme, world health organization, regional office for the western pacific, manila, philippines. f infectious hazards management, who health emergencies programme, world health organization, regional office for the western pacific, manila, philippines. g influenza division, united states centers for disease control and prevention, atlanta, ga, united states of america. h sanofi pasteur, lyon, france. i who collaborating centre for reference and research on influenza, royal melbourne hospital, melbourne, and the peter doherty institute for infection and immunity, university of melbourne, melbourne, australia. published: 22 june 2021 doi: 10.5365/wpsar.2020.11.2.001 objective: estimates of the burden of influenza are needed to inform prevention and control activities for seasonal influenza, including to support the development of appropriate vaccination policies. we used sentinel surveillance data on severe acute respiratory infection (sari) to estimate the burden of influenza-associated hospitalizations in the lao people’s democratic republic. methods: using methods developed by the world health organization, we combined data from hospital logbook reviews with epidemiological and virological data from influenza surveillance from 1 january to 31 december 2016 in defined catchment areas for two sentinel sites (champasack and luang prabang provincial hospitals) to derive population-based estimates of influenza-associated sari hospitalization rates. hospitalization rates by age group were then applied to national age-specific population estimates using 2015 census data. results: we estimated the overall influenza-associated sari hospitalization rate to be 48/100 000 population (95% confidence interval [ci]: 44–51) or 3097 admissions (95% ci: 2881–3313). sari hospitalization rates were estimated to be as low as 40/100 000 population (95% ci: 37–43) and as high as 92/100 000 population (95% ci: 87–98) after accounting for sari patient underascertainment in hospital logbooks. influenza-associated sari hospitalization rates were highest in children aged <5 years (219; 95% ci: 198–241) and persons aged ≥65 years (106; 95% ci: 91–121). discussion: our findings have identified age groups at higher risk for influenza-associated sari hospitalization, which will support policy decisions for influenza prevention and control strategies, including for vaccination. further work is needed to estimate the burdens of outpatient influenza and influenza in specific high-risk subpopulations. estimating the national burden of hospitalizations for influenza-associated severe acute respiratory infection in the lao people’s democratic republic, 2016 bouaphanh khamphaphongphane,a may chiew,b joshua a. mott,c sombandith khamphanoulath,a viengphone khanthamaly,d keooudomphone vilivong,a,d thongchanh sisouk,a leila bell,e erica dueger,f,g,h sheena sullivan,i angela daniella iuliano,g reiko tsuyuokab and onechanh keosavanha correspondence to bouaphanh khamphaphongphane (email: bkhamphaphongphane@gmail.com) wpsar vol 12, no 2, 2021 | doi: 10.5365/wpsar.2020.11.2.001 https://ojs.wpro.who.int/2 khamphaphongphane et alnational burden of influenza in lao people’s democratic republic data sources sari influenza surveillance system for hospitalized patients in lao pdr, patients are identified as having sari if they have a history of subjective or measured fever of ≥38 °c and cough, with onset occurring within the last 7 days, and if they required hospitalization. all patients at the sentinel sites who met the sari case definition were enrolled in the study, and nasal and throat swabs were collected. the data collected included information on the age, sex and clinical characteristics of the patient. specimens collected from sari patients were sent daily to the national influenza center at the national center for laboratory and epidemiology in vientiane where they were tested by real-time reverse transcription–polymerase chain reaction (rt–pcr) for influenza viruses. health admission data we reviewed health admission data to estimate the catchment areas of sentinel hospitals and to estimate annual cases of influenza-associated sari in the country. estimating the catchment population of sentinel hospitals at the time of the study, sari sentinel surveillance in lao pdr did not capture information about case patients’ district of residence. to determine the catchment areas of the cps and lpb provincial hospitals, we used data from an unpublished review of all hospital admission records from 2014 (khampapongpane b, musto j, phengxay m, ketmayoon p, khamising a, souphatsone houatthongkham s, et al., unpublished data, 2017). the catchment area for each hospital was defined as the districts of residence from which ≥80% of sari patients sought care, as guided by the who’s manual for estimating the influenza disease burden.7 the catchment areas for the two sites are shown in fig. 1. the catchment area for cps provincial hospital covered nine districts: eight districts in cps province (bachiangchaleunsook, champasack, khong, pakse, pathoomphone, paksong, phonthong and sanasomboon) and one district in saravane province (khongxedone). data at these sentinel sites are also collected by age and sex. at present, sari sentinel surveillance operates in one central hospital in vientiane, the capital, and five provincial hospitals that represent the central, northern and southern regions of the country. influenza viruses have been found to circulate year-round in the country, with typical epidemic peaks from july to december.4 this trend is consistent with trends seen in neighbouring countries with similar environments, such as cambodia.5 in 2012, lao pdr introduced a national seasonal influenza vaccination policy. since then, the country has implemented this programme through a public–private partnership that offers influenza vaccine to pregnant women, persons aged ≥50 years, persons with chronic diseases and health-care workers. although 90% of health-care workers are currently vaccinated, due to limited availability of the vaccine, coverage is only 35% among pregnant women and 12% among elderly people with chronic conditions.6 estimating the burden of people hospitalized with influenza is a key step towards building the evidence base to inform decisions about influenza prevention and control policies. at present, the burden of people hospitalized with influenza is not well understood in the country. our study aimed to estimate the burden of influenza-associated sari hospitalizations to inform the evidence base for future decision-making about strategies to prevent and control influenza. methods we used the world health organization (who) manual for estimating influenza disease burden7 to identify a method to generate estimates of influenza-associated sari hospitalizations. following an assessment of all six sari sentinel sites, we selected two: champasack (cps) provincial hospital and luang prabang (lpb) provincial hospital. we selected these two hospitals because they had catchment areas that were well circumscribed to allow their service populations to be assessed through hospital logbook reviews to obtain denominators for estimating hospitalization rates. these hospitals also represented populations in the northern and southern parts of the country. wpsar vol 12, no 2, 2021 | doi: 10.5365/wpsar.2020.11.2.001https://ojs.wpro.who.int/ 3 national burden of influenza in lao people’s democratic republickhamphaphongphane et al in the catchment areas. hospitalized patients who met the sari case definition based on signs and symptoms were considered sari patients. from the logbooks, we collected demographic data, the dates of admission and discharge, signs and symptoms, onset date, admitting diagnosis, discharge diagnosis and outcomes. to determine the proportion of total inpatient visits that were associated with sari at lpb and cps hospitals, we divided the total number of sari patients identified by the logbook reviews by the total number of inpatient visits at the hospitals during the same period as was recorded in the district health information system. estimating annual cases of influenza-associated sari, and correcting for missing records we obtained monthly age-specific numbers of sari patients from the two sentinel sites and combined them. to account for variation in influenza circulation by month, we then divided the monthly sari patient counts for each age group by the overall annual percentage of specimens testing positive for influenza at the two sentinel sites because there were too few for lpb provincial hospital, the catchment area covered five districts. all of the districts were part of lpb province (chomphet, luang prabang, nambak, ngoi and park ou). all patients living outside these districts were excluded from the subsequent reviews of hospital admission logbooks. identifying sari patients residing within the catchment populations we visited all health facilities that admit patients with respiratory illness within the identified catchment areas. at those facilities, we obtained and reviewed hospital admission logbooks from wards that admitted patients with respiratory illness (that is, internal medicine, inpatient, intensive care and paediatric units). we included admissions from 1 january to 31 december 2016. in lao pdr, the international classification of diseases, tenth revision (icd-10), is not used at the subnational level, including at health facilities in the catchment areas. therefore, we recorded the clinical signs and symptoms from free-text entries in the admission and discharge logbooks to identify sari patients residing luang prabang sentinel site luang prabang ngoi khongxedone sanasomboon phonthong champasack khong pathoomphone paksong bachiangchaleunsook pakse nambak park ou chomphet luang prabang saravane champasack saravane champasack + + + fig. 1. map of lao people’s democratic republic and the catchment areas of champasack provincial hospital (blue) and luang prabang provincial hospital (green), by district wpsar vol 12, no 2, 2021 | doi: 10.5365/wpsar.2020.11.2.001 https://ojs.wpro.who.int/4 khamphaphongphane et alnational burden of influenza in lao people’s democratic republic we adjusted the numbers and rates of influenzaassociated sari hospitalizations by applying the three correction factors for logbook underascertainment. to derive estimates of the national burden, we used the pooled hospitalization rates from the two sentinel site catchment areas and extrapolated these rates to the national 2015 census population. we calculated 95% confidence intervals by applying an error factor, as outlined in the who manual,7 to account for variance in the percentage of cases positive for influenza and in the monthly sari patient counts. results the hospital logbook review was conducted in 8 of the 12 health facilities in the catchment area of lpb provincial hospital (that is, the provincial hospital, one private hospital, one military hospital and five district hospitals) and in 9 of the 10 health facilities in the catchment area of cps provincial hospital (that is, the provincial hospital and eight district hospitals). from january through december 2016, 2060 sari patients were identified from the review of logbooks, of whom 1513 were from the cps catchment area and 547 were from the lpb catchment area. of the 1513 sari patients in the cps catchment area, 823 (54%) were <5 years; 265 (18%) were 5 to <15 years; 270 (18%) were 15 to <65 years; and 155 (10%) were ≥65 years. within this catchment area, 746 (49%) sari patients were identified from logbooks at cps provincial hospital and 767 (51%) were identified from logbooks at district hospitals. of the 746 cases identified in the cps provincial hospital logbooks, the median length of stay at the hospital was 2 days. of the 547 sari patients in the lpb catchment area, 313 (57%) were <5 years; 55 (10%) were 5 to <15 years; 126 (23%) were 15 to <65 years; and 53 (10%) were ≥65 years. within this catchment area, 124 (23%) sari patients were identified from logbooks at lpb provincial hospital; 329 (60%) were identified in logbooks at district hospitals; 66 (12%) were identified in logbooks at military hospitals; and 28 (5%) were identified in logbooks at private hospitals. of the 124 sari cases identified in the logbooks at lpb provincial hospital, the median length of stay at the hospital was also 2 days. age-specific data by month. from these calculations, we obtained estimates of the number of cases of influenzaassociated sari by month. to assess the completeness of the identification of sari patients in the logbooks, we compared the number of sari patients detected from prospective sentinel surveillance data in 2016 to the number of sari patients identified through logbook reviews at both sentinel sites. this was an aggregate-level comparison as it was not possible to link individual patients identified in logbook entries with those identified through sari sentinel surveillance. based on pooled results of record reviews from both sites, we calculated a correction factor to account for an underascertainment of sari patients in the logbook reviews and applied it to the number of patients with influenza-associated sari by age and month. due to the absence of links between individual patients in the logbooks and in surveillance data, 95% confidence intervals (95% cis) could not be estimated for each correction factor. however, as there was variability between the sites in the number of missing logbook records, we also calculated lowerand upper-bound correction factors based on the missing logbook data from each site. estimating the national burden of influenza-associated sari we estimated age-specific populations for each district within the catchment areas using provincial-level age distributions from the 2015 population census (<5 years: 12.6%; 5 to <15 years: 23.3%; 15 to <65 years: 59.8%; and ≥65 years: 4.3%).8 we then calculated the adjusted population denominator by multiplying the population of the catchment area of each sentinel site by the proportion of sari patients that presented to that site compared with other health facilities in the catchment area, by age group. we estimated monthly influenza-associated hospitalizations due to sari by combining estimated sari patient counts (the numerator) at the two sites. we divided these combined sari patient counts by the sum of the adjusted catchment populations for both sentinel sites (the denominator) and multiplied by 100 000. to create annual rates, we aggregated these monthly rates and weighted them by the proportion of sari patients identified in the logbook review that occurred within a given month of the calendar year. wpsar vol 12, no 2, 2021 | doi: 10.5365/wpsar.2020.11.2.001https://ojs.wpro.who.int/ 5 national burden of influenza in lao people’s democratic republickhamphaphongphane et al factor of 1.44 (1253/870). at cps provincial hospital, a total of 908 sari patients were detected through active sentinel surveillance compared with 746 identified through logbook review. at lpb provincial hospital, the numbers of sari patients identified through prospective surveillance and logbook review were 345 and 124, respectively. therefore, we also applied the site-specific lowerand upper-bound correction factors for missing logbook data of 1.22 (908/746) and 2.78 (345/124) to the number of sari patients identified from the logbooks at all hospitals within the catchment areas. the estimated rate of influenza-associated sari hospitalization was 48/100 000 population (95% ci: 44–51) (table 2). however, given the variability in sari patient underascertainment in hospital logbooks, we estimated these overall sari hospitalization rates to be as low as 40/100 000 population (95% ci: 37–43) and as high as 92/100 000 population (95% ci: 87–98). our the number of sari patients identified, the estimated percentage testing positive for influenza by age, the estimated population of the catchment areas and the population denominators are summarized in table 1. compared with the lpb catchment area, in the cps catchment area there was a greater number of sari patients (746 versus 124), a higher percentage testing positive for influenza viruses (18% versus 6%) and a larger adjusted population denominator (325 671 versus 55 850). based on inpatient data from the district health information system, the proportion of inpatient visits due to sari was approximately 5% (746/15 144) in the cps provincial hospital catchment area and approximately 1% (124/9172) in the lpb provincial hospital catchment area. a total of 1253 sari patients were detected from active sentinel surveillance compared with 870 identified by the logbook reviews, resulting in a correction table 1. patients with severe acute respiratory illness identified from reviews of hospital logbooks, and catchment area populations, for champasack provincial hospital and luang prabang provincial hospital, lao people’s democratic republic, january to december 2016 hospital age group <5 years 5 to <15 years 15 to <65 years ≥65 years total* champasack provincial hospital number of sari patients identified through logbook review 344 81 202 119 746 percentage of sari patients positive for influenza at sentinel surveillance site 16% 34% 14% 9% 18% population of catchment area 78 188 140 672 411 078 30 579 660 510 percentage of sari patients in the catchment area admitted to the sentinel site 42% 31% 75% 77% 49% adjusted population denominator 32 681 42 998 307 547 23 477 325 671 luang prabang provincial hospital number of sari patients identified through logbook review 32 19 43 30 124 percentage of sari patients positive for influenza at sentinel surveillance site 5% 6% 9% 5% 6% population of catchment area 31 067 57 404 147 329 10 569 246 370 percentage of sari patients in the catchment area admitted to the sentinel site 10% 35% 34% 57% 23% adjusted population denominator 3176 19 830 50 279 5982 55 850 sari: severe acute respiratory illness. * not all row totals equal the sum of columns. wpsar vol 12, no 2, 2021 | doi: 10.5365/wpsar.2020.11.2.001 https://ojs.wpro.who.int/6 khamphaphongphane et alnational burden of influenza in lao people’s democratic republic underascertainment, this number was estimated to be as low as 2623 (2431–2816) and as high as 5978 (5625–6331) (table 3). nearly half of these influenzaassociated sari hospitalizations were estimated to occur in children aged <5 years. discussion our findings are the first to estimate the national burden of influenza-associated sari hospitalizations in lao pdr and are important in understanding the health impact of influenza within the country. we found that children aged <5 years and adults aged ≥65 years had the highest rates of hospitalization for influenzaprimary pooled incidence rates for the two catchment areas suggested that rates of influenza-associated sari hospitalization per 100 000 population were highest in children aged <5 years (219; 95% ci: 198–241). the rates followed a u-shaped curve, declining to 33/100 000 (95% ci: 28–39) for the 5 to <15 year age group and to 14/100 000 (95% ci: 13–16) for the 15 to <65 year age group, but increasing to 106/100 000 among persons aged ≥65 years (95% ci: 91–121). applying these rates to the total population of the country gives the estimated number of influenzaassociated sari hospitalizations in 2016 as 3097 (95% ci: 2880–3313). accounting for hospital logbook table 2. national incidence estimates of rates of hospitalization for severe acute respiratory infection due to influenza in the lao people’s democratic republic, by age group, with adjustments to lower and upper bounds for underascertainment of the illness in hospital logbooks, january to december 2016 ci: confidence interval; sari: severe acute respiratory illness. * the multiplier for case underascertainment was 1.44. the estimate of the lower bounds used a multiplier of 1.22, and the estimate of the upper bounds used a multiplier of 2.78. age group (years) rate of influenza-associated sari hospitalizations per 100 000 population (95% ci)* corrected rate lower bound of estimate upper bound of estimate <5 219 (198–241) 186 (166–205) 423 (390–457) 5 to <15 33 (28–39) 28 (23–33) 64 (56–72) 15 to <65 14 (13–16) 12 (11–13) 28 (25–30) ≥65 106 (91–121) 90 (76–103) 204 (183–226) all ages 48 (44–51) 40 (37–43) 92 (87–98) table 3. national estimated number of hospitalizations for severe acute respiratory infection due to influenza in the lao people’s democratic republic, by age group, with adjustments to lower and upper bounds for underascertainment of the illness in hospital logbooks, january to december 2016 age group (years) population of lao pdr, 2015 number of influenza-associated sari hospitalizations (95% ci) corrected lower bound of estimate upper bound of estimate <5 681 983 1496 (1349–1642) 1267 (1135–1400) 2888 (2661–3115) 5 to <15 1 397 815 465 (386–545) 394 (322–467) 898 (784–1013) 15 to <65 4 137 333 593 (531–654) 502 (446–558) 1144 (1052–1236) ≥65 275 097 291 (250–332) 247 (209–284) 562 (503–621) all ages 6 492 228 3097 (2880–3313) 2623 (2431–2816) 5978 (5625–6331) ci: confidence interval; lao pdr: lao people’s democratic republic; sari: severe acute respiratory illness. * the multiplier for case underascertainment was 1.44. the estimate of the lower bounds used a multiplier of 1.22, and the estimate of the upper bounds used a multiplier of 2.78. wpsar vol 12, no 2, 2021 | doi: 10.5365/wpsar.2020.11.2.001https://ojs.wpro.who.int/ 7 national burden of influenza in lao people’s democratic republickhamphaphongphane et al while our estimates will contribute to local and global efforts to estimate the burden of influenza, particularly in asia, it is also important to acknowledge some limitations. perhaps most importantly, data from other countries suggest that the sari case definition used for these analyses may miss a substantial portion of influenza-associated illnesses and may be better suited to virus detection than burden estimation.14 the inclusion of fever in the case definition may be one reason why these estimates are lower than those observed in viet nam11 and why only half the burden was seen in children, for whom fever may be a more specific symptom.15 regardless of the case definition used, prospective sentinel surveillance also will not capture patients in whom an earlier influenza infection may have indirectly caused decompensation of another underlying chronic illness that leads to hospitalization and in whom nucleic acid from influenza viruses can no longer be detected with real-time rt–pcr. this could produce an underestimate of the influenza burden in certain populations, particularly older adults with underlying conditions.16 it was not possible to calculate rates of influenza-associated sari hospitalization among other recognized high-risk groups, such as pregnant women or patients with underlying conditions, due to the nature of the health systems and because the wards under surveillance in the sari sentinel system do not necessarily admit those patients. because only two sentinel sites served wellcircumscribed at-risk populations, these data also may not be fully representative of the national population. the variability of missing logbook data, coupled with the absence of icd-10 coding, also complicated our ability to estimate the national burden of influenza-associated sari, and these issues created uncertainty about the degree to which missing logbook data impacted these national estimates. we attempted to address this issue using sensitivity analyses. we are also uncertain of how many people living in the catchment areas travel to other countries, such as thailand, for medical treatment. previous studies have demonstrated that people from lao pdr seek health care in thailand.17 furthermore, a study examining the characteristics of lao nationals seeking health care in thailand found that from 2009 through 2011, the diagnosis of unspecified pneumonia was one of the top five inpatient conditions for which lao nationals were associated sari. while every influenza season is different, our results suggest that influenza-associated sari hospitalization rates for children aged <5 years in lao pdr are higher than what has been documented in who’s western pacific region. in a recent systematic review and meta-analysis of the global burden of influenza in paediatric respiratory hospitalizations,9 the pooled influenza-associated hospitalization rate among children aged <5 years was 150/100 000 population (95% ci: 105–216) compared with our estimate of 220/100 000 population. these findings are also similar to the results of a published study in cambodia that estimated national rates of severe influenza were 323/100 000 population in infants aged <1 year and 196/100 000 population in children aged 1–4 years.10 in contrast, the incidence of hospitalized patients with acute respiratory infection associated with influenza a in viet nam from 2007 through 2008 in children aged <5 years was much higher, at 870/100 000 population.11 in the viet nam study, the case definition included all children presenting with cough or difficulty breathing, or both, with or without fever,11 while our case definition was less sensitive and more specific. however, caution is required in comparing hospitalization rates across countries as case definitions, health-seeking behaviour, admission practices, logbook and medical charting, the methods of calculating population denominators, influenza vaccine policy, the general health of the population and influenza activity vary between countries and over time. our estimates suggest that in 2016 influenza represented a significant burden to hospitalizations in lao pdr. currently, the government is procuring seasonal influenza vaccine annually, using its own budget, with support from the partnership for influenza vaccine introduction.12,13 these burden estimates will be useful for understanding the impact of influenza by age group. ongoing work incorporating these estimates is exploring the economic costs of influenza and the cost–effectiveness of influenza vaccines. understanding the impact of influenza virus infection on the population can support the expansion of influenza vaccine policies in lao pdr in conjunction with national immunization laws and existing influenza vaccine policies.13 these estimates can also support the government’s decisions to purchase influenza vaccine in the future. wpsar vol 12, no 2, 2021 | doi: 10.5365/wpsar.2020.11.2.001 https://ojs.wpro.who.int/8 khamphaphongphane et alnational burden of influenza in lao people’s democratic republic 2. iuliano ad, roguski km, chang hh, muscatello, dj, palekar r, tempia s, et al. estimates of global seasonal influenza-associated respiratory mortality: a modelling study. lancet. 2018;391:1285–300. doi:10.1016/s0140-6736(17)33293-2 pmid:29248255 3. lee vj, ho zjm, goh eh, campbell h, cohen c, cozza v, et al. advances in measuring influenza burden of disease. influenza other respir viruses. 2018;12(1):3–9. doi:10.1111/irv.12533 pmid:29460425 4. khamphaphongphane b, ketmayoon p, lewis hc, phonekeo d, sisouk t, xayadeth s, et al. epidemiological and virological characteristics of seasonal and pandemic influenza in lao pdr, 2008-2010. influenza other respir viruses. 2013;7(3):304–11. doi:10.1111/j.1750-2659.2012.00394.x pmid:22716289 5. hirve s, newman lp, paget j, azziz-baumgartner e, fitzner j, bhat n, et al. influenza seasonality in the tropics and subtropics – when to vaccinate? plos one. 2016;11(4):e0153003. doi:10.1371/journal.pone.0153003 pmid:27119988 6. phengxay m, mirza sa, reyburn r, xeuatvongsa a, winter c, lewis h, et al. introducing seasonal influenza vaccine in low-income countries: an adverse events following immunization survey in the lao people’s democratic republic. influenza other respir viruses. 2015;9(2):94–8. doi:10.1111/irv.12299 pmid:25598475 7. a manual for estimating disease burden associated with seasonal influenza. geneva: world health organization; 2015. available from: https://apps.who.int/iris/handle/10665/178801, accessed 17 february 2021. 8. results of population and housing census 2015 [website]. vientiane: laosis; 2019. available from: https://laosis.lsb.gov.la/ tblinfo/tblinfolist.do, accessed 17 february 2021. 9. lafond k, nair h, rasooly m, valente f, booy r, rahman m, et al. global role and burden of influenza in pediatric respiratory hospitalizations, 1982–2012: a systematic analysis. plos med. 2016;13(3):e1001977. doi:10.1371/journal.pmed.1001977 pmid:27011229 10. ieng v, tolosa mx, tek b, sar b, sim k, seng h, et al. national burden of influenza-associated hospitalizations in cambodia, 2015 and 2016. western pac surveill response j. 2018;9(5 suppl. 1):44–52. doi:10.5365/wpsar.2018.9.5.011 pmid:31832253 11. yoshida lm, suzuki m, yamamoto t, nguyen ha, nguyen cd, nguyen at, et al. viral pathogens associated with acute respiratory infections in central vietnamese children. pediatr infect dis j. 2010;29(1):75–7. doi:10.1097/inf.0b013e3181af61e9 pmid:19907358 12. bresee js, lafond ke, mccarron m, azziz-baumgartner e, chu sy, ebama m, et al. the partnership for influenza vaccine introduction (pivi): supporting influenza vaccine program development in low and middle-income countries through public-private partnerships. vaccine. 2019;37(35):5089–95. doi:10.1016/j. vaccine.2019.06.049 pmid:31288998 13. xeuatvongsa a, mott ja, khanthamaly v, patthammavong c, phounphenghak k, mckinlay m, et al. progress toward sustainable influenza vaccination in the lao peoples’ democratic republic, 2012-2018. vaccine. 2019;37(23):3002–5. doi:10.1016/j. vaccine.2019.04.047 pmid:31027926 14. marcone dn, durand lo, azziz-baumgartner e, vidaurreta s, ekstrom j, carballal g, et al. incidence of viral respiratory infections in a prospective cohort of outpatient and hospitalized children aged £5 years and its associated cost in buenos aires, argentina. bmc infect dis. 2015;15(1):447. doi:10.1186/ s12879-015-1213-4 pmid:26497393 treated each year.18 these findings could contribute to our conservative estimates. given these additional areas of uncertainty, we should note that the 95% confidence intervals presented here (and suggested in the who manual)7 account for only random sampling variation and do not account for classification errors and other possible sources of bias. indeed, many of the limitations discussed here apply to similar, if not most, national estimates of influenza burden and meta-analyses globally. notwithstanding, the estimated burden of hospitalizations for influenzaassociated sari in lao pdr is comparable to those from other countries and highlights the need to maintain and further strengthen influenza surveillance systems. with proper consideration of these data and the case definition used, these findings contribute to understanding the potential impact of influenza in the country. these data can inform prioritization for influenza control and response activities, including vaccination programmes, in lao pdr when combined with data on the costs of hospitalization, burden, cost of outpatient influenza, and data on vaccine effectiveness and costs. acknowledgements we thank the staff of champasack provincial hospital and luang prabang provincial hospital for supporting the collection of medical records and hospital admission logbooks. we also thank provincial and district health offices and field epidemiology training program trainees from cohort 9 for supporting the logbook reviews at health facilities. additionally, we thank mr anton perez and mr don rivada from the who health emergencies programme in the who regional office for the western pacific for assisting us in creating the map for the manuscript. conflicts of interest the authors of this manuscript have indicated no conflicts of interest. references 1. troeger ce, blacker bf, khalil ia, zimsen srm, albertson sb, abate d, et al. mortality, morbidity, and hospitalisations due to influenza lower respiratory tract infections, 2017: an analysis for the global burden of disease study 2017. lancet respir med. 2019;7(1):69–89. doi:10.1016/s2213-2600(18)30496-x pmid:30553848 https://doi.org/10.1111/irv.12533 https://www.ncbi.nlm.nih.gov/entrez/query.fcgi?cmd=retrieve&db=pubmed&list_uids=29460425&dopt=abstract https://www.ncbi.nlm.nih.gov/entrez/query.fcgi?cmd=retrieve&db=pubmed&list_uids=29460425&dopt=abstract https://doi.org/10.1111/j.1750-2659.2012.00394.x https://www.ncbi.nlm.nih.gov/entrez/query.fcgi?cmd=retrieve&db=pubmed&list_uids=22716289&dopt=abstract https://doi.org/10.1371/journal.pone.0153003 https://www.ncbi.nlm.nih.gov/entrez/query.fcgi?cmd=retrieve&db=pubmed&list_uids=27119988&dopt=abstract https://doi.org/10.1111/irv.12299 https://www.ncbi.nlm.nih.gov/entrez/query.fcgi?cmd=retrieve&db=pubmed&list_uids=25598475&dopt=abstract https://apps.who.int/iris/handle/10665/178801 https://laosis.lsb.gov.la/tblinfo/tblinfolist.do https://laosis.lsb.gov.la/tblinfo/tblinfolist.do https://www.ncbi.nlm.nih.gov/entrez/query.fcgi?cmd=retrieve&db=pubmed&list_uids=31832253&dopt=abstract https://www.ncbi.nlm.nih.gov/entrez/query.fcgi?cmd=retrieve&db=pubmed&list_uids=31832253&dopt=abstract https://doi.org/10.1097/inf.0b013e3181af61e9 https://www.ncbi.nlm.nih.gov/entrez/query.fcgi?cmd=retrieve&db=pubmed&list_uids=19907358&dopt=abstract https://www.ncbi.nlm.nih.gov/entrez/query.fcgi?cmd=retrieve&db=pubmed&list_uids=19907358&dopt=abstract https://doi.org/10.1016/j.vaccine.2019.06.049 https://doi.org/10.1016/j.vaccine.2019.06.049 https://www.ncbi.nlm.nih.gov/entrez/query.fcgi?cmd=retrieve&db=pubmed&list_uids=31288998&dopt=abstract https://doi.org/10.1016/j.vaccine.2019.04.047 https://doi.org/10.1016/j.vaccine.2019.04.047 https://www.ncbi.nlm.nih.gov/entrez/query.fcgi?cmd=retrieve&db=pubmed&list_uids=31027926&dopt=abstract https://doi.org/10.1186/s12879-015-1213-4 https://doi.org/10.1186/s12879-015-1213-4 https://www.ncbi.nlm.nih.gov/entrez/query.fcgi?cmd=retrieve&db=pubmed&list_uids=26497393&dopt=abstract https://doi.org/10.1016/s2213-2600(18)30496-x https://www.ncbi.nlm.nih.gov/entrez/query.fcgi?cmd=retrieve&db=pubmed&list_uids=30553848&dopt=abstract https://www.ncbi.nlm.nih.gov/entrez/query.fcgi?cmd=retrieve&db=pubmed&list_uids=30553848&dopt=abstract wpsar vol 12, no 2, 2021 | doi: 10.5365/wpsar.2020.11.2.001https://ojs.wpro.who.int/ 9 national burden of influenza in lao people’s democratic republickhamphaphongphane et al 17. bochaton a. cross-border mobility and social networks: laotians seeking medical treatment along the thai border. soc sci med. 2015;124:364–73. doi:10.1016/j.socscimed.2014.10.022 pmid:25454637 18. charoenmukayananya s, sriratanaban j, hengpraprom s, trarathep c. factors influencing decisions of laotian patients to use health care services in thailand. asian biomed. 2014;8(5):665–71. doi:10.5372/1905-7415.0805.342 15. hirve s, chadha m, lele p, lafond ke, deoshatwar a, sambhudas s, et al. performance of case definitions used for influenza surveillance among hospitalized patients in a rural area of india. bull world health organ. 2012;90(11):804–12. doi:10.2471/ blt.12.108837 pmid:23226892 16. gordon a, reingold a. the burden of influenza: a complex problem. curr epidemiol rep. 2018;5(1):1–9. doi:10.1007/s40471018-0136-1 pmid:29503792 https://doi.org/10.5372/1905-7415.0805.342 https://doi.org/10.2471/blt.12.108837 https://doi.org/10.2471/blt.12.108837 https://www.ncbi.nlm.nih.gov/entrez/query.fcgi?cmd=retrieve&db=pubmed&list_uids=23226892&dopt=abstract https://doi.org/10.1007/s40471-018-0136-1 https://doi.org/10.1007/s40471-018-0136-1 https://www.ncbi.nlm.nih.gov/entrez/query.fcgi?cmd=retrieve&db=pubmed&list_uids=29503792&dopt=abstract viral load suppression and acquired hiv drug resistance in adults receiving antiretroviral therapy in viet nam: results from a nationally representative survey original research vu quoc dat,a bui duc duong,b do thi nhan,b nguyen huu hai,b nguyen thi lan anh,c huynh hoang khanh thu,d tran ton,d luong que anh,d nguyen tuan nghia,c nguyen vu thuong,d khuu van nghia,d tran thi minh tam,c tran phuc hau,d nguyen duy phuc,d vu xuan thinh,d nguyen tran hien,c truong thi xuan lien,d silvia bertagnolio,e nguyen thi thuy vanf and masaya katof a department of infectious diseases, hanoi medical university, hanoi, vietnam. b vietnam authority of hiv/aids control, hanoi, vietnam. c national institute of hygiene epidemiology (nihe), hanoi, vietnam. d pasteur institute of ho chi minh city, ho chi minh city, vietnam. e world health organization, geneva, switzerland. f world health organization viet nam country office, hanoi, vietnam. correspondence to vu quoc dat (email:datvq@hmu.edu.vn). to cite this article: dat vq, duong bd, nhan dt, hai nh, ntl anh, thu hhk, et al. viral load suppression and acquired hiv drug resistance in adults receiving antiretroviral therapy in viet nam: results from a nationally representative survey. western pac surveill response j. 2018 august;9(3). doi:10.5365/wpsar.2018.9.1.008 abstract objective: the purpose of this survey was to estimate the prevalence of viral load (vl) suppression and emergence of hiv drug resistance (hivdr) among individuals receiving antiretroviral therapy (art) for 36 months or longer in viet nam using a nationally representative sampling method. methods: the survey was conducted between may and august 2014 using a two-stage cluster design. sixteen art clinics were selected using probability proportional to proxy size sampling, and patients receiving art for at least 36 months were consecutively enrolled. epidemiological information and blood specimens were collected for hiv-1 vl and hivdr testing; hivdr was defined by the stanford university hivdr algorithm. results: overall, 365 eligible individuals were recruited with a mean age of 38.2 years; 68.4% were men. the mean time on art was 75.5 months (95% confidence interval [ci]: 69.0–81.9 months), and 93.7% of the patients were receiving non-nucleoside reverse transcriptase inhibitor-based regimens. of the 365 individuals, 345 (95.1, 95% ci: 92.3–96.9) had vl below 1000 copies/ml and 19 (4.6%, 95% ci: 2.8–7.5) had hivdr mutations. discussion: our nationally representative survey found a high level of vl suppression and a low prevalence of hivdr among individuals who received art for at least 36 months in viet nam. continued surveillance for hivdr is important for evaluating and improving hiv programs. introduction there were an estimated 250 000 people living with hiv in viet nam in 2016.1 the hiv epidemic in viet nam remains concentrated primarily among people who inject drugs (pwid), female sex workers (fsw) and men who have sex with men (msm). according to hiv sentinel surveillance, the hiv prevalence was 11.0% in pwid, 2.7% in fsw and 8.2% in msm in 2016.2 antiretroviral therapy (art) was first introduced in viet nam in the mid-1990s and has been rapidly scaled up since 2005, with a total of 115 927 people receiving art at the end of 2016.2,3 however, the prevalence of viral load (vl) suppression and hiv drug resistance (hivdr) patterns at the national scale were unknown. there have been several hivdr surveys undertaken in viet nam in the past decade. however, no study provided a nationally representative estimate of vl suppression and acquired hiv drug resistance (adr). prior to 2011, the world health organization (who) recommended the prospective cohort studies of patients in conveniently selected sentinel sites to assess the emergence of adr.4 however, considerable financial and human resources are required for the recruitment and maintenance of a prospective cohort. moreover, due to the nature of the survey design, the delay between the initiation of the survey and the dissemination of the results was longer than 24 months, preventing the use of this information for timely public health action. to address these implementation challenges and to ensure findings fully reflect the situation in the national programme, who developed a new survey method using a cross-sectional approach to estimate the level of vl suppression and adr using a nationally representative sample of people receiving art in the country.5 the survey can be implemented quickly and the results are nationally representative; thus, it has greater potential to inform the public health response in timely manner. in 2014, viet nam became one of the first countries in the world to conduct an adr survey using the new who guidance. the study aimed to determine the prevalence of vl suppression and hivdr among individuals who had been receiving art for ≥36 months in viet nam. methods study design and sampling in line with who guidance, this cross-sectional survey used a two-stage cluster design.5 in the first stage, 201 clinics that had provided art for at least three years by the end of 2013 composed the sampling frame. clinic-level information on the number of patients starting art and on art for at least 36 months was not available; however, viet nam had reliable site-level data on the number of patients on art. we used probability proportional to proxy size (ppps) sampling in which the probability that a clinic was sampled is proportional to the size of the proxy patient population. the selected clinics were sampled through systematic ppps sampling.5 the number of persons receiving art at the end of 2013 at each clinic was used as the proxy size of patients on art at each clinic. in the second stage, a sample of eligible patients was consecutively recruited from each of the selected clinics. the sample size for 16 representative clinics without stratification was calculated following the formula for a wald-type confidence interval as recommended in who guidance.5 to estimate the required sample size, the following assumptions were made: vl suppression prevalence of 70% for those receiving art for ≥36 months, expected amplification failure rate at 15%,5 expected proportion of individuals sampled still receiving first-line art at 95% and expected proportion of individuals sampled on first-line art receiving non-nucleoside reverse transcriptase inhibitor (nnrti)-based regimens at 100%. based on these assumptions and a desired confidence interval of ±7%, it was estimated that a sample size of 368 persons was required, resulting in the enrolment of 23 eligible persons at each of the 16 selected clinics. participant recruitment individuals with hiv aged 18 years or older who had been on art for at least 36 months at the time of the clinic visit were eligible for inclusion. who guidance suggests conducting the survey at two treatment time points (12 ± 3 months and ≥48 months after initiation);5 however, viet nam started planning the survey in late 2013, before the who guidance was finalized. we used the inclusion criteria listed in the draft recommendation, which was to survey adults who had received art for ≥36 months. to estimate the size of the clinic population and allow adjustments during the analysis, survey sites recorded all eligible patients who attended the clinic during the first three months of the study. at each clinic, eligible patients were enrolled consecutively until 23 patients were enrolled or until the maximum enrolment period of three months had passed, whichever came earlier. following patient consent, blood specimens were drawn for vl measurement and genotyping. on the day of specimen collection, clinical data were also collected from the patient's medical record by art clinic staff, including age, sex, date of art start and art regimen and cd4 counts before art initiation and the most recent results before enrolment. specimen shipment and laboratory testing plasma specimens were tested for vl and hivdr in two laboratories designated by who as national hivdr laboratories: the national institute for hygiene and epidemiology (nihe), which tested specimens from eight outpatient clinics in the north of the country, and the pasteur institute in ho chi minh city (pi hcmc), which tested specimens from eight outpatient clinics in the south of the country. hiv-1 rna viral quantification was conducted using the automated abbott real-time hiv-1 assay (in nihe) and the automated roche cobas ampliprep/cobas taqman hiv-1 assay (in pi hcmc) with detection limits of 20 copies/ml. hivdr genotypic test was conducted on the pol gene with the abi 3130xl system using the big-dye terminator v3.1 cycle sequencing kit (applied biosystem, california, usa). hivdr was interpreted using the hivalg program on the stanford university hiv drug resistance database website.6 hivdr was defined as low-level, intermediate or high-level resistance to one or more of the following drugs: nevirapine (nvp), efavirenz (efv), any nucleotide reverse transcriptase inhibitors ntrti, atazanavir (atv), darunavir (drv) or lopinavir (lpv). nnrti resistance was defined as resistance to nvp or efv, nrti resistance was defined as resistance to any ntrti, including abacavir (abc), zidovudine (zdv), emtricitabine (ftc), lamivudine (3tc), tenofovir (tdf), stavudine (d4t) and didanosine (ddi). protease inhibitor (pi) resistance was defined as resistance to atv, drv or lpv. estimates were weighted for study design. data entry and statistical analysis data were entered using epi data 3.0 (epidata software, odense, denmark) and statistical analysis was performed using stata version 11 (stata corp., texas, usa). standard descriptive statistics were calculated for categorical and continuous variables. data analysis for prevalence of vl suppression was conducted in stata using the survey (svy) suite of commands. data were weighted by clinic size (i.e. the number of eligible patients screened at a clinic during the three months after the survey start date, the number of patients with vl suppression and the number of individuals with sequences genotyped).5 a 95% confidence interval was calculated using a standard wald formula or by a logit transformation. the fasta files were submitted to the stanford university hiv drug resistance database for interpretation.7 a detailed description of the technical data analysis has been described elsewhere.5 ethics and permissions the study protocol was reviewed and approved by the institutional review board of hanoi university of public health, hanoi, viet nam (approval no: 210/2014/ytcc-hd3). results characteristics of study participants during the enrolment period, a total of 6920 patients were screened at 16 sampled clinics, from which 368 eligible patients were recruited. three patients were excluded because the duration of art was less than 36 months; therefore, 365 persons were included in the final analysis. their baseline characteristics are summarized in table 1. the study-design-weighted mean age was 38.2 years (95% confidence interval [ci]: 37.0–39.4) and 68.4% were males. at the time of study enrolment, 93.7% of the participants were on a first-line nnrti-based regimen, 77.8% (273/351) had advanced hiv infection (cd4 < 100 cells/ml) and the mean duration on art was 75.5 months (95% ci: 69.0–81.9). of the 365 patients, 55.9% (204) were on a zdv-containing regimen, 54% (197) on a nvp-containing regimen, 40.3% (147) on an efv-containing regimen and 8.4% (140) on a tdf-containing regimen. the adjusted proportions are presented in table 1. table 1. characteristics of individuals on current art regimen for at least 36 months (n = 365) click to download table 1. jpg, 461kb viral load suppression among the 365 participants with vl testing, 345 (95.1%) achieved vl suppression (defined as vl <1000 copies/ml). the prevalence of vl suppression among individuals on first-line art was 94.8% (95% ci: 92.1-96.6%) (table 2). table 2. prevalence of vl suppression (<1000 copies/ml) for individuals on art for at least 36 months click to download table 2. jpg, 309kb hiv drug resistance the study-design-weighted prevalence of any hiv drug resistance among patients on art was 4.6% (95% ci: 0.28–0.75) and among persons with vl >1000 copies/ml was 94.7% (95% ci: 64.1–99.4%) (table 3). of the 20 (14.5%) persons with a detectable vl, 19 carried a virus with mutations associated with hivdr (five persons with vl between 1000 and 5000 copies/ml and 14 persons with vl >5000 copies/ml). table 3. prevalence of hivdr among individuals on art for at least 36 months click to download table 3. jpg, 550kb all the detected mutations were associated with resistance to reverse transcriptase inhibitors, and no major mutations associated with resistance to pi were found (fig. 1). in the 19 cases with drug resistance mutations, one case (5.3%) had mutations associated with only nrti resistance, another one (5.3%) had mutations associated with only nnrti resistance, and the remaining 17 cases (89.4%) had mutations associated with both nrti and nnrti resistance. in cases with drug-resistance mutations to both nrti and nnrti, the mean viral load was 45 556 copies/ml (95% ci: 16 603–74 509). among the 20 patients with a detectable vl, the most common nnrti mutations were y181c (10/20, 50%), k103n (7/20, 35%), v106i (7/20, 35%) and g190a (7/20, 35%). for nrti resistance, the most common resistance mutations were m184v (16/20, 80%); v75m (5/20, 25%); and thymidine analogue mutations (tams), consisting of t215f/i/y (12/20, 60%), k219e/q (9/20, 45%), k70r (9/20, 45%), d67n (8/20, 40%), m41l (7/20, 35%) and l210w (4/20, 20%). there were 45% (9/20) of patients harbouring viruses with three or more tams. of the 20 patients failing art, 75% (15) had mutations that predict resistance to tenofovir, while 85% (17) and 70% (14) had mutations that predict resistance to either lamivudine (3tc) or emtricitabine (ftc) and zdv, respectively (fig. 1). prevalence of nnrti resistance ranged from 70% (14/20) for etravirine (etr) to 90% (18/20) for efv and/or nvp (fig. 1). fig. 1. frequency of mutations conferring resistance to nrtis click to download figure 1. jpg, 247kb association between cd4 count and hivdr mutations table 4 shows the results of bivariate analysis and multivariate analysis assessing the relationship between cd4 counts with the presence of hivdr mutations. bivariate analysis showed that cd4 counts <100 cells/mm3 or between 100 and 350 cells/µl were associated with hivdr mutations. in multivariate analysis, these two conditions were independently associated with the presence of hivdr mutations: adjusted odds ratio (aor) = 98.3 (95% ci: 10.9–888.2) for cd4 <100 cells/mm3 and aor = 11.4 (95% ci: 2.51–51.9) for cd4 between 100 and 350 cells/µl. table 4. correlates of hivdr mutation (any mutation) click to download table 4. jpg, 809kb discussion this study was the first survey of adr in viet nam following the who guidance for adr surveillance released in 2014,5 and viet nam was one of the first countries in the world to adopt the new who adr survey protocol.8 the new who protocol is aimed at obtaining nationally representative estimates of vl suppression and adr using a cross-sectional design in contrast to the previous prospective cohort method that focused on sentinel art clinics.4 our survey proved that the new cross-sectional who approach is feasible to implement in viet nam and is able to generate important information that could be used to optimize art programmes. in our survey, the level of vl suppression was one of the highest and the adr level the lowest among the four countries that have reported the results of an adr survey using the new who protocol.8 in the past decade, various surveys of hivdr were conducted in viet nam that reported levels of transmitted hiv drug resistance (tdr), pre-treatment hiv drug resistance (pdr) and adr. in a study among 70 newly diagnosed hiv-positive clients aged 18–24 years in hanoi in 2006, the prevalence of tdr was at a low level (<5% to all drugs),9 while a moderate resistance prevalence (5–15%) of tdr to nnrtis was observed among similar clients (aged 18–21 years at voluntary counselling and testing sites) in ho chi minh city in 2007–2008.10 a five-year study (2008–2012) among 1426 art-naïve patients in a single hospital in southern viet nam indicated that the annual prevalence of tdr remained low to moderate (2.4–5.48%).11 a prospective cohort study of adr conducted between 2009 and 2012 at four treatment clinics (two clinics in ho chi minh city and two clinics in northern viet nam) showed that pdr to the drugs used in the first-line art regimen was 2.7% (95% ci: 1.6–4.4%) (13/490 participants).12 this study also showed 91.3% (ci 95%: 87.0–97.9%) of patients achieved vl suppression at 12 months after art initiation, 2.9% of patients had developed an hivdr to nnrtis or nrtis at 12 months after art initiation and no patients had developed detectable pi resistance.13 a cross-sectional study at three clinics in ho chi minh city in 2009–2011 reported the level of adr among those receiving art for 12 ± 2 months and 24 ± 2 months were 22/296 patients (7.4%) and 25/300 patients (8.3%), respectively.14 these previous studies in viet nam did not use a nationally representative sample and thus were limited by potential site selection bias. at the same time, these results suggest that hivdr has been at a low level in viet nam, and the results of the present survey are in line with these previous findings. however, it should also be noted that tdr10 and adr14 surveys conducted in ho chi minh city report somewhat higher (moderate) levels of hivdr compared to the rest of the country. while it is important to generate nationally representative estimates, future studies may also require stratification of sampling to understand potential geographical differences. the present survey also showed that over 95% of people with hiv who are receiving art for more than three years have suppressed vl (<1000 copies/ml). this study result is also in line with other studies showing that viet nam's programmes are achieving a high level of vl suppression (<1000 copies/ml) at 12 months as reported from cohort studies13,15 and a cross-sectional survey.16 our study found a strong association between vl and drug-resistance mutations among patients receiving art for at least 36 months. hivdr mutations to nnrti were detected in 19 out of 20 (95%) patients with vl >1000 copies/ml supporting the notion that a prompt switch to second line therapies is needed in people with detectable virus despite treatment. because hivdr is associated with a low level of adherence (more importantly with nnrti resistance emergence)17 in settings with low levels of nnrti resistance on art,8 strategies to improve art adherence are critical to prevent widespread reliance on alternate treatment regimens. in the above-mentioned study among vietnamese adults initiating first-line art, the percentages of patients with virologic failure (vl >1000 copies/ml) were 11.5% (95% ci: 7.8–15.1) at 10–14 months and 10.3% (95% ci: 6.9–13.8) at 22–24 months. the percentages of patients with detectable vl that had drug-resistance mutations were 75.9% at 10–14 months and 86.2% at 22–24 months.14 it is possible the presence of drug-resistance mutations is correlated with time on art.18 following the who recommendation to conduct the adr survey at two time points would enable comparisons of the level of vl suppression and patterns of hivdr between patients found to be failing art in the shortand long-term. the 2010 pre-treatment hivdr study found that the major drug-resistance mutations to the available first-line arts were k103n, y181c, y188c, g190a (nnrti resistance), v75m and m184v (nrti resistance).12 due to the limitations of cross-sectional design, it was not possible in our current study to determine whether the hivdr mutations stemmed from insufficient drug pressure during art treatment or had pre-existed from transmitted resistance before art initiation. the mutation pattern in our study was similar to the results of an adr survey at three clinics in ho chi minh city in 2009–2010. among the 22 patients with hivdr mutations at 12 months, resistance to nrtis, nnrtis and to both classes were reported as 4.5%, 9% and 90%, respectively. at 24 months following art initiation, there were 25 cases with hivdr mutations: 96% were resistant to both nrtis and nnrtis, 0% were resistant to nrtis alone and 4% were resistant to nnrtis alone.14 in conclusion, this is the first survey to describe nationally representative levels of vl suppression and adr in adults receiving art for at least 36 months in viet nam. the survey found high levels of vl suppression, low levels of adr among people on art and high levels of hivdr among people failing art, suggesting that viet nam had successfully managed its programme quality to maintain adr at a low level at the time the survey was conducted in 2014. conflicts of interest the authors declare that they have no competing interests. funding this work is supported by the bill & melinda gates foundation through the world health organization. acknowledgements we wish to thank the study participants, data collectors and leaders at 16 study sites from provinces of thanh hoa; quang ninh; yen bai; thai nguyen; dong thap; vinh long; outpatient clinics of viet nam-sweden hospital; dong da; tu liem; thanh xuan; binh thanh, and phu nhuan districts; district 6 and staff at the pi hcmc, and nihe. we also would like to thank amandine cournil (institut de recherche pour le développement unité mixte internationale [ird umi 233] transvihmi) for her support on data analysis. references know your epidemic. hanoi: the joint united nations programme on hiv/aids (unaids) viet nam; 2017 (http://unaids.org.vn/en/know-your-epidemic/, accessed 19 november 2017). vaac. global aids monitoring 2017 report from viet nam. hanoi: viet nam authority of hiv/aids control; 2017. reporting on hiv/aids prevention in 2015 and important mission in 2016. hanoi: viet nam ministry of health; 2016 (http://vaac.gov.vn/cms_data/contents/vaac/folders/solieubaocao/solieu/~contents/bcg2dgp6nq77kbcx/bao-cao-hiv_aids-nam-2015-va-nhiem-vu-trong-tam-nam-2016_final.pdf) (in vietnamese). jordan mr, bennett de, bertagnolio s, gilks cf, sutherland d. world health organization surveys to monitor hiv drug resistance prevention and associated factors in sentinel antiretroviral treatment sites. antivir ther. 2008;13 suppl 2:15–23. pmid:18575188 who. surveillance of hiv drug resistance in adults receiving art (acquired hiv drug resistance). geneva: world health organization; 2014. liu tf, shafer rw. web resources for hiv type 1 genotypic-resistance test interpretation. clin infect dis. 2006 jun 1;42(11):1608–18. doi:10.1086/503914 pmid:16652319 hivdb program: genotypic resistance interpretation algorithm [database on the internet]. palo alto: stanford university hiv drug resistance database; 2015 (http://hivdb.stanford.edu/index.html, accessed 15 may 2015). world health organization uscfdcap, the global fund to fight aids, tuberculosis and malaria. hiv drug resistance report 2017. geneva: world health organization; 2017 (http://www.who.int/hiv/pub/drugresistance/hivdr-report-2017/en/). nguyen ht, duc nb, shrivastava r, tran th, nguyen ta, thang ph, et al. hiv drug resistance threshold survey using specimens from voluntary counselling and testing sites in hanoi, vietnam. antivir ther. 2008;13 suppl 2:115–21. pmid:18575200 duc nb, hien bt, wagar n, tram th, giang t, yang c, et al. surveillance of transmitted hiv drug resistance using matched plasma and dried blood spot specimens from voluntary counseling and testing sites in ho chi minh city, vietnam, 2007-2008. clin infect dis. 2012 may;54 suppl 4:s343–7. doi:10.1093/cid/cir1049 pmid:22544201 tanuma j, quang vm, hachiya a, joya a, watanabe k, gatanaga h, et al. low prevalence of transmitted drug resistance of hiv-1 during 2008-2012 antiretroviral therapy scaling up in southern vietnam. j acquir immune defic syndr. 2014 aug 1;66(4):358–64. doi:10.1097/qai.0000000000000196 pmid:24815852 pham qd, do nt, le yn, nguyen tv, nguyen db, huynh tk, et al. pretreatment hiv-1 drug resistance to first-line drugs: results from a baseline assessment of a large cohort initiating art in vietnam, 2009-10. j antimicrob chemother. 2015 mar;70(3):941–7. doi:10.1093/jac/dku473 pmid:25433009 road map for surveillance and monitoring of hiv drug resistance in the western pacific region 2014–2018. manila: who regional office for the western pacific region; 2018 (http://www.wpro.who.int/hiv/documents/docs/hivdr_roadmap/en/). aghokeng af, monleau m, eymard-duvernay s, dagnra a, kania d, ngo-giang-huong n, et al.; anrs 12186 study group. extraordinary heterogeneity of virological outcomes in patients receiving highly antiretroviral therapy and monitored with the world health organization public health approach in sub-saharan africa and southeast asia. clin infect dis. 2014 jan;58(1):99–109. doi:10.1093/cid/cit627 pmid:24076968 do d, agneskog e, nguyen t, santacatterina m, sönnerborg a, larsson m. monitoring the efficacy of antiretroviral therapy by a simple reverse transcriptase assay in hiv-infected adults in rural viet nam. future virol. 2012;7(9):923–31. doi:10.2217/fvl.12.83 rangarajan s, donn jc, giang t, bui dd, hung nguyen h, tou pb, et al. factors associated with hiv viral load suppression on antiretroviral therapy in vietnam. j virus erad. 2016 april 1;2(2):94–101. pmid:27482442 sethi ak, celentano dd, gange sj, moore rd, gallant je. association between adherence to antiretroviral therapy and human immunodeficiency virus drug resistance. clin infect dis. 2003 oct 15;37(8):1112–8. doi:10.1086/378301 pmid:14523777 stadeli km, richman dd. rates of emergence of hiv drug resistance in resource-limited settings: a systematic review. antivir ther. 2013;18(1):115–23. doi:10.3851/imp2437 pmid:23052978 factors affecting vaccine hesitancy among families with children 2 years old and younger in two urban communities in manila, philippines original research julius migriño, jr.,a,b billy gayados,a karen rachel joyce birol,a lorelie de jesus,a christopher willis lopez,a winona colleen mercado,a jan-mark caezar tolosa,a joeylyn torredaa and glaze tulagana a college of medicine, san beda university, manila, philippines. b school of medicine and public health, ateneo de manila university, pasig city, philippines. correspondence to julius migriño (email: jrmjrmd-1@yahoo.com). to cite this article: migriño, jr j, gayados b, birol rj, de jesus l, lopez cw, mercado wc, et al. factors affecting vaccine hesitancy among families with children 2 years old and younger in two urban communities in manila, philippines. western pac surveill response j. 2020 jun;10(2). doi:10.5365/wpsar.2019.10.2.006 objective: the study aimed to determine the factors that influence vaccine hesitancy among parents and caregivers of children 2 years old and younger in selected urban communities in manila, philippines. methodology: the study used a cross-sectional study design with a modified questionnaire adapted from the sage working group on vaccine hesitancy. self-administered surveys were conducted in two highly urbanized barangays (smallest administrative divisions) in manila, philippines. results: the survey was completed by 110 respondents, comprised mostly of 20–39-year-old mothers. most respondents (95.5%) believed that vaccines are protective however vaccine hesitancy rates among the respondents reached 36.4%. respondents who believed in the protective nature of vaccines were less likely to report vaccine hesitancy and were nine times less likely to refuse vaccination for their children because of negative media exposure. the main reasons identified for vaccine hesitancy were exposure to negative media information and concerns about vaccine safety. the main negative media information identified by the respondents was related to the dengue vaccine, dengvaxia®. health-care workers and political leaders were the main supporters of vaccination in the community. discussion: the recent events surrounding the dengvaxia® controversy contributed to a decrease in vaccine confidence. the role of mass media in vaccine hesitancy was highlighted in this study, supporting previous evidence that vaccine-hesitant parents tend to be more susceptible to media reports. the lack of association between sociodemographic factors and vaccine hesitancy implies that the determinants of vaccine hesitancy can be highly varied depending on context and setting. immunization has been one of the most important strategies in public health, and it is one of the most cost-effective interventions that lead to improvement of global health outcomes. childhood mortality from measles and tetanus has drastically decreased through effective national immunization programmes,1 and it is estimated that 2–3 million deaths per year are prevented through vaccination.2 however, for immunization strategies to make significant strides in curbing morbidity and mortality, uptake rates for vaccines need to reach critical levels. measles vaccination, for example, needs to reach a population rate of around 83–94% to elicit herd protection and prevent outbreaks.3,4 while global trends show an increase in the vaccination rates for specific antigens, there have been resurgences or increases in the rates of some vaccine-preventable diseases (e.g. measles, circulating vaccine-derived poliovirus) in the past few years.5 beginning in early 2019 in the philippines, the department of health (doh) declared measles outbreaks in at least six regions – davao region, metro manila, central luzon, calabarzon, western visayas and central visayas.6 there was a staggering eight-fold increase in the incidence rate from late 2017 to 2018, and the trend continued with more cases of measles reported in the first quarter of 2019 compared to all of 2018.7 in november 2017, a media frenzy erupted. one year after the philippines initiated a mass vaccination campaign with the first licensed dengue vaccine (dengvaxia®) that reached around 800 000 schoolchildren, sanofi pasteur, the manufacturer of dengvaxia®, revealed that the vaccine potentially increased the risk of severe dengue in children who had never been infected with dengue prior to vaccination.8 the doh and several studies identified the controversy that arose as one of the probable reasons for the loss of vaccine confidence in the philippines,8–11 which could have contributed to the rise in measles cases in 2018.8–10 vaccine hesitancy is defined as a “delay in acceptance or refusal of vaccines despite availability of vaccination services.”12 while the reasons for delays or refusals to accept vaccines are complex, the strategic advisory group of experts (sage) technical working group has accepted two working models regarding the determinants of vaccine hesitancy.12 the 3cs model, composed of complacency, convenience and confidence, is a simpler intuitive model. the working group matrix (“matrix”) is more comprehensive and aims to categorize the determinants of vaccine hesitancy into three major groups: contextual influences (influences arising due to historic, sociocultural, environmental, health system/institutional, economic or political factors); individual and group influences (influences arising from personal perception of the vaccine or influences of the social/peer environment); and vaccine/vaccination-specific issues (issues directly related to vaccines or vaccination).12,13 it is clear that vaccine hesitancy is a problem, and addressing its determinants using either model is key at the policy level to prevent vaccine hesitancy and the emergence of outbreaks of vaccine-preventable diseases in groups with low vaccination rates.14 evidence about factors associated with vaccine hesitancy in the philippines is lacking. the subject is timely due to the recent dengvaxia® controversy, a subsequent decrease in vaccine confidence and the more recent outbreak of measles in the country. the objective of this study was to determine the factors associated with vaccine hesitancy in urban communities in manila, philippines. identifying and understanding these factors are crucial to inform interventions that can address the issues and lead to increased vaccination rates. methods we developed a survey that was adapted from a previous vaccine hesitancy survey.15 the revised questionnaire consisted of 10 core closed questions to assess vaccine hesitancy of parents and caregivers at a community level (fig. 1). probe questions were also included for questions 4, 7, 8 and 10 to determine specific reasons respondents answered “yes” to these questions (table 1). the questionnaire was translated into filipino and was back-translated into english for the purposes of content validation and pretesting before administration. data were collected using self-administered questionnaires. click to download figure 1. jpg, 396kb click to download table 1. jpg, 397kb the study sites were two small and highly urbanized barangays (smallest administrative divisions) situated in the district of san miguel in manila, philippines. these sites were purposively selected based on ongoing health services collaboration between san beda university college of medicine and the barangays. a sample size of 109 was calculated using openepi16 based on the estimated number of families with children 2 years old or younger from the study sites (n = 154, sample proportion = 0.32, confidence level = 95%, α = 0.05).17 purposive recruitment of eligible respondents was done with the help of barangay health workers, as well as snowball sampling from previous respondents, until the minimum sample size was accomplished. sampling was started at the house nearest the health centre and then at the nearest house with an identified eligible respondent. parents and caregivers aged 18 years or older of at least one child 2 years old or younger who had lived in the study sites for at least one year were eligible to be included in the study. written informed consent containing the study’s brief introduction, nature of risks and benefits, provision for confidentiality and voluntary nature was collected from each participant before the survey. parents and caregivers of children who had contraindications to routine vaccinations (e.g. severe allergic reactions to previous exposure, immunocompromised status) were excluded from the study. ethical approval of the study was provided by san beda university office for research and innovation. all data were entered in microsoft excel and then coded and analysed using statacorp. 2013. (stata statistical software: release 13. college station, tx) categorical variables were summarized using frequencies and percentages; χ2 analyses with phi coefficient post-hoc tests were used to determine correlations with and among the factors associated with vaccine hesitancy and refusal. binary logistic regression was used to determine the odds ratio (or) and 95% confidence intervals (ci). ethics statement the study was reviewed and approved on 18 january 2019 by the san beda university office for research and innovation. permission and approval were obtained from the division of planning and coordination, manila health department, city of manila, approval number 8159759. results a total of 150 houses were identified with eligible respondents; 31 of them were excluded from the sampling frame (either nobody was home or the children were older than 2 years). a total of 119 respondents completed the survey (100% response rate); however, only 110 responses were included in the final data due to incomplete survey or informed consent information. table 2 summarizes the demographic characteristics of the respondents. most of the respondents were women (81.8%), and most were the mothers (73.6%). fathers accounted for 17.3% of the total respondents. the median age of the respondents was 29 years old (interquartile range = 25–33). almost 65% of the respondents finished at least some high school education, and 34.6% had some college-level education. the predominant religion was roman catholic (76.4%). the reported monthly household incomes varied, but 87.3% reported that their monthly household income was less than 20 000 philippine pesos. click to download table 2. jpg, 290kb fig. 1 summarizes the answers of the respondents to the survey questionnaire. almost all (95.5%) respondents believed that vaccines are protective to children, and many (84.6%) believed that most parents have their children vaccinated with recommended vaccines. ninety-six per cent of respondents reported that financial and logistical concerns have not prevented them from getting their children vaccinated; 92.7% mentioned that other pressures in life have not prevented them from getting their children vaccinated on time. almost 11% of respondents believed that there could be reasons why children should not be vaccinated; 41.7% of them believed that they can choose not to vaccinate. the majority (72.2%) of respondents had heard negative information about vaccinations, and of these, 75.6% reported hearing negative information about dengvaxia®. despite this, 88.0% of respondents who reported receiving negative information about vaccinations said that they would still take their children to get vaccinated. a large majority (95.0%) agreed that community leaders support child vaccination. health-care workers and political leaders were identified as top vaccination advocates (76.8% and 68.7%, respectively) followed by teachers and religious leaders (23.2% and 18.2%, respectively). thirty-one per cent reported hesitating to give at least one vaccination to their children, and 23.7% outright refused at least one vaccination for their children. cumulatively, 36.4% of the respondents either hesitated or refused to give at least one vaccination (or both) to their children. respondents who hesitated to have their children receive at least one vaccination were also 16.7 times more likely to have refused least one vaccination for their children (or = 16.7, 95% ci = 5.7-49.0, p 2 analysis with phi coefficient post-hoc test revealed that respondents who have hesitated to have their child vaccinated were (1) less likely to believe that vaccines protect children from serious diseases (χ2(1) = 9.2, p 2(1) = 9.7, p the main reasons for refusing to have their child vaccinated are shown in table 1. the primary reason for vaccine refusal was negative information from the media (69.2%), followed by concerns about the safety of vaccines (46.2%). there was a strong association between these reasons (χ2(1) = 68.8, p p p other reasons for refusing to have their children vaccinated at least once included the beliefs that vaccines were not effective (19.2%) and that vaccines were not safe (19.2%), doubts about the need for vaccination (15.4%), someone telling them about adverse reactions following vaccinations (11.5%), having a bad experience during previous vaccinations (3.8%) and not knowing where to get reliable information (3.8%). there were no significant associations between reasons for vaccine refusal and respondent’s age, gender, educational attainment, religion, income bracket and relationship to child. discussion this study identified the presence of vaccine hesitancy in about one third of the respondents from two highly urbanized communities in manila, philippines. the main reasons for refusing at least one vaccination for their children were negative media information and concerns about the safety of vaccines and their side-effects; the main negative media information identified by the respondents was related to the dengavaxia® vaccine. vaccine hesitation is a threat to individuals and also to public health. in the philippines, it has been suggested that the recent events surrounding the dengue vaccine dengvaxia® has contributed to a decrease in vaccine confidence;9,18 however, data supporting this contention are lacking particularly in many lowand middle-income countries. many reasons have been identified as potential sources of vaccine hesitancy, and beliefs and attitudes towards vaccine efficacy and safety are among them.14,15 one study reported that vaccine hesitancy was found to be low in parents who perceive vaccination as important.19 this is consistent with the results of our study that showed respondents who believe in the protective nature of vaccines were less likely to have hesitated or refused vaccination for their child. circumstantial life events surrounding vaccination have also been identified in literature as potential factors of vaccine hesitancy, where parents attach significance to events such as their child’s birth timing, sleep patterns or behaviour, rather than rely on a science-based approach to health care, including immunization.14 this was consistent with our study findings: respondents with some form of significant event during vaccination periods were more likely to be vaccine-hesitant. mass media, such as newspapers, television, radio, the internet and social media, has contributed to the growing problem of vaccine distrust primarily by over-reporting adverse events of immunization.20–22 a compounding factor is that vaccine-hesitant parents tend to be more susceptible to media reports, whether verified or not,21,23 and they frequently rely on the internet as their source for vaccination information.14 this phenomenon has been characterized in this study: there was a significant positive association between exposure to negative media information about vaccines and vaccine hesitancy among the study population. negative media information was positively correlated with safety concerns that correlated with refusal to have children vaccinated at least once in the past. the dengvaxia® issue in the philippines was propagated in all types of media beginning in late 2017, and three quarters of study respondents who reported having heard negative information about vaccines said they had heard negative information about dengvaxia®. most of the media information was reported on internet news sites, newspapers and social media that contained reports of adverse events during or after the vaccination campaign, including official statements on fatalities and growing distrust of the vaccine.10,24–26 these events are not unique to the philippines. in 2013, viet nam experienced a similar story surrounding quinvaxem® (diphtheria, tetanus, whooping cough, hepatitis b, haemophilus influenzae type b pentavalent vaccine), where some young infants allegedly had allergies, seizures or reduced muscle tone shortly after receiving the vaccine. vaccine hesitancy and refusal, and the resulting decrease in vaccine coverage, were linked to extensive print and online media campaigns of the adverse effects of immunization.20 the controversy led to loss of public trust, and parents had to wait for another pentavalent vaccine to become available.20 the results of our study suggest vaccine hesitancy is an issue for parents and caregivers of children 2 years old and younger regardless of age, gender, educational attainment, religion, income bracket or relationship to the children. some international effects of gender inequality27 on vaccination attitudes and practices (including vaccine hesitancy), such as men’s purported distrust towards vaccinations and women’s greater motivation to access health services for their children, did not seem to be present in the study population. one study suggested that educational levels and religious affiliations of caregivers may influence vaccine hesitancy; however, we did not find this in our study. the sage working group study12 noted that the level of education may both promote and impede vaccine acceptance depending on the setting. because the determinants of vaccine hesitancy can be highly varied, contextualization of determinants in each setting (and not general assumptions) is advised by the experts before interventions can be devised.12 the purposive nature of the study site and convenience sampling method in respondent selection limits the generalizability of the study to similar study sites (i.e. small, highly urbanized communities); however, literature suggests that different communities have different determinants of vaccine hesitancy. there is always the need to identify these determinants that collectively influence vaccination beliefs and practices and not solely rely on generalizations.12 another limitation of the study is the exclusion of parents and caregivers of children who have any contraindications to routine vaccination; contraindication to one vaccine does not necessarily mean contraindication to all vaccines, and this important population subgroup might have been missed in the study. potential biases that may have affected the results include recall bias and social desirability bias. the results of this study suggest that vaccine hesitancy might be addressed by a multi-stakeholder approach in the community. the role of political and religious community leaders in supporting vaccination strategies appears to be evident. the role of health workers needs to be re-emphasized and strengthened; they were the most commonly cited advocates for vaccination in this study. in a previous study, they were found to be the most influential persons addressing vaccine hesitancy. empowering and mobilizing health workers to take an active role in promoting accurate and timely information on the benefits of immunization and allaying the community’s fears and distrust of vaccines is still the most important strategy.21 acknowledgements the authors would like to acknowledge dr roberto ruiz (deceased) for his valuable comments in the writing of the proposal and early versions of the manuscript. references greenwood b. the contribution of vaccination to global health: past, present and future. philos trans r soc lond b biol sci. 2014 may 12;369(1645):1–9. doi:10.1098/rstb.2013.0433 pmid:24821919 ten threats to global health in 2019. geneva: world health organization; 2019. available from: https://www.who.int/emergencies/ten-threats-to-global-health-in-2019, accessed 9 may 2019. doherty m, buchy p, standaert b, giaquinto c, prado-cohrs d. vaccine impact: benefits for human health. vaccine. 2016 dec 20;34(52):6707–14. doi:10.1016/j.vaccine.2016.10.025 pmid:27773475 andre fe, booy r, bock hl, clemens j, datta sk, john tj, et al. vaccination greatly reduces disease, disability, death and inequity worldwide. bull world health organ. 2008 feb;86(2):140–6. doi:10.2471/blt.07.040089 pmid:18297169 global and regional immunization profile. geneva: world health organization; 2018. available from: https://www.who.int/immunization/monitoring_surveillance/data/gs_gloprofile.pdf?ua=1, accessed 9 may 2019. doh expands measles outbreak declaration to other regions. manila: department of health; 2019. available from: https://www.doh.gov.ph/node/16647, accessed 9 may 2019. situation report 9: measles outbreak philippines. manila: unicef-who; 2019. available from: https://reliefweb.int/sites/reliefweb.int/files/resources/unicef%20who%20phl%20sitrep9_measles%20outbreak_14apr2019.pdf, accessed 9 may 2019. fatima k, syed ni. dengvaxia controversy: impact on vaccine hesitancy. j glob health. 2018. available from: https://www.ncbi.nlm.nih.gov/pmc/articles/pmc6214489/, accessed 8 may 2019. doh identifies vaccine hesitancy as one of the reasons for measles outbreak. manila: department of health; 2019. available from: https://www.doh.gov.ph/node/16721, accessed 8 may 2019. tomacruz s. parents still scared of govt’s free vaccines a year after dengvaxia scare. rappler. 27 september 2018. available from: https://www.rappler.com//nation/212927-child-vaccination-rate-philippines-as-of-september-2018, accessed 8 may 2019. larson hj, hartigan-go k, de figueiredo a. vaccine confidence plummets in the philippines following dengue vaccine scare: why it matters to pandemic preparedness. hum vaccin immunother. 2019;15(3):625–7. doi:10.1080/21645515.2018.1522468 pmid:30309284 report of the sage working group on vaccine hesitancy. geneva: world health organization; 2014. available from: https://www.who.int/immunization/sage/meetings/2014/october/sage_working_group_revised_report_vaccine_hesitancy.pdf?ua=1, accessed 8 may 2019. vaccine hesitancy survey questions related to sage vaccine hesitancy matrix. geneva: world health organization; 2018. available from: https://www.who.int/immunization/programmes_systems/survey_questions_hesitancy.pdf, accessed 19 nov 2018. yaqub o, castle-clarke s, sevdalis n, chataway j. attitudes to vaccination: a critical review. soc sci med. 2014 jul;112:1–11. doi:10.1016/j.socscimed.2014.04.018 pmid:24788111 larson hj, jarrett c, schulz ws, chaudhuri m, zhou y, dube e, et al.; sage working group on vaccine hesitancy. measuring vaccine hesitancy: the development of a survey tool. vaccine. 2015 aug 14;33(34):4165–75. doi:10.1016/j.vaccine.2015.04.037 pmid:25896384 dean ag, sullivan km, soe mm. openepi: open source epidemiologic statistics for public health, version 3.01, updated 2013/04/06. available from: www.openepi.com, accessed 19 nov 2018. indexmundi. philippines demographics profile 2018. indexmundi; 2018. available from: https://www.indexmundi.com/philippines/demographics_profile.html, accessed 10 may 2019. montemayor mat. measles outbreak due to vaccine hesitancy: doh. philippine news agency; 2019. available from: https://www.pna.gov.ph/articles/1061526, accessed 8 may 2019. dubé è, farrands a, lemaitre t, boulianne n, sauvageau c, boucher fd, et al. overview of knowledge, attitudes, beliefs, vaccine hesitancy and vaccine acceptance among mothers of infants in quebec, canada. hum vaccin immunother. 2019;15(1):113–20. doi:10.1080/21645515.2018.1509647 pmid:30095325 tran bx, boggiano vl, nguyen lh, latkin ca, nguyen hlt, tran tt, et al. media representation of vaccine side effects and its impact on utilization of vaccination services in vietnam. patient prefer adherence. 2018 sep 6;12:1717–28. doi:10.2147/ppa.s171362 pmid:30233151 vaccine hesitancy: a generation at risk. lancet child adolesc health. 2019 may;3(5):281. doi:10.1016/s2352-4642(19)30092-6 pmid:30981382 dubé e, gagnon d, nickels e, jeram s, schuster m. mapping vaccine hesitancy–country-specific characteristics of a global phenomenon. vaccine. 2014 nov 20;32(49):6649–54. doi:10.1016/j.vaccine.2014.09.039 pmid:25280436 vrdelja m, kraigher a, verčič d, kropivnik s. the growing vaccine hesitancy: exploring the influence of the internet. eur j public health. 2018 oct 1;28(5):934–9. doi:10.1093/eurpub/cky114 pmid:29982349 punzalan j. pao sees “pattern” in deaths of 4 dengvaxia recipients. abs-cbn news; 2018. available from: https://news.abs-cbn.com/news/01/10/18/pao-sees-pattern-in-deaths-of-4-dengvaxia-recipients, accessed 13 may 2019. geronimo jy. doh: over 3,000 students hospitalized after dengvaxia shot. rappler. 13 april 2018. availabe from: https://www.rappler.com//nation/200187-doh-students-hospitalized-dengvaxia, accessed 9 may 2019. aurelio jm. doh says 62 kids may have died after receiving dengvaxia. philippine daily inquirer. 7 april 2018. available from: https://newsinfo.inquirer.net/980755/doh-says-62-kids-may-have-died-after-receiving-dengvaxia, accessed 13 may 2019. merten s, martin hilber a, biaggi c, secula f, bosch-capblanch x, namgyal p, et al. gender determinants of vaccination status in children: evidence from a meta-ethnographic systematic review. plos one. 2015 aug 28;10(8):e0135222. doi:10.1371/journal.pone.0135222 pmid:26317975 investigating an outbreak of acute fever in chuuk, federated states of micronesia original research damian hoy,a yoster yichiro,b kasian otoko,b helden heldart,b andita meyshine,b prisca assito,b moses pretrick,c yvan souares,a thane hancock,d mark durande and adam rotha a secretariat of the pacific, noumea, new caledonia. b chuuk epinet team, department of health, chuuk, federated states of micronesia. c national epinet team, department of health, pohnpei, federated states of micronesia. d yap epinet team, department of health, yap, federated states of micronesia. e pacific island health officers association, hawaii, united states of america. correspondence to damian hoy (e-mail: damehoy@yahoo.com.au). to cite this article: hoy d et al. investigating an outbreak of acute fever in chuuk, federated states of micronesia. western pacific surveillance and response journal, 2014, 5(4):5–12. doi:10.5365/wpsar.2014.5.3.005 abstract objective: in september 2012, there was an unexpected increase of acute febrile illness (afi) in chuuk state of the federated states of micronesia. at the same time, dengue outbreaks were occurring in two of the federated states of micronesia’s other three states. the cause of afi was suspected to be dengue; however, by the end of october, only one of 39 samples was positive for dengue. the objective of the investigation was to establish the cause of the outbreak. methods: a line list was created and data analysed by time, place, person and clinical features. reported symptoms were compared with the published symptoms of several diagnoses and laboratory testing undertaken. results: of the 168 suspected cases, 62% were less than 20 years of age and 60% were male. the clinical features of the cases were not typical for dengue but suggestive of respiratory illness. nasopharyngeal swabs were subsequently collected and found to be positive for influenza. public health measures were undertaken and the afi returned to expected levels. discussion: clinical diagnosis of acute febrile illness (afi) can often be difficult and misleading. this can mean that opportunities for preventive measures early on in an outbreak are missed. in any outbreak, descriptive epidemiological analyses are valuable in helping to ascertain the cause of the outbreak. introduction the federated states of micronesia is an independent nation in free association with the united states of america, consisting of more than 600 islands extending across four states in the north pacific ocean: pohnpei, kosrae, chuuk and yap.1 chuuk state, made up of chuuk lagoon and a series of outer islands, has a population of approximately 53 000 people and the federated states of micronesia’s highest population density.1 many of the outer islands are several hundred kilometres from chuuk lagoon, and weno island is the main island of chuuk state (figure 1). the hospital in weno, the state’s only hospital, has 150 beds and houses the state’s only laboratory. each of the other islands in the state has at least one dispensary; some have up to four. each dispensary is run by a health assistant. chuuk state hospital has a dispensary coordinator who calls each dispensary health assistant on a weekly basis to monitor their activities and detect any unusual disease occurrences. figure 1. map of chuuk state and sequence of events in acute fever outbreak, 2012 click to download figure 1. jpg, 786kb afi, acute febrile illness. source: chuuk state map was reproduced from wikimedia commons, the free media repository (http://commons.wikimedia.org/wiki/file:chuuk.png), and the inset map of the federated states of micronesia was reproduced from who division of pacific technical support (http://www.wpro.who.int/southpacific/pacelf/countries/fsm/en/). on 9 august 2012, an 18-year-old male from weno island presented to chuuk state hospital after experiencing three days of fever. a rapid diagnostic test for dengue was performed and was negative; however, the same sample was shipped to brisbane for polymerase chain reaction (pcr) testing and was positive for dengue virus serotype-4 (denv-4). in mid-september, hospital doctors noted an increase in the number of cases of acute febrile illness (afi). due to the increase of and concern over concurrent dengue outbreaks in other federated states of micronesia states, clinicians commenced filling in patient encounter forms for suspected dengue cases using a case definition of: acute fever of at least 38 °c with two or more of the following: nausea, vomiting, severe headaches, orbital pain, joint pain, rash, haemorrhage, signs of leucopoenia. in late september, a small number of cases of suspected dengue was reported in satawan, an outer island several hundred kilometres south-east of chuuk lagoon. then, on 3 october in onoun, an island several hundred kilometres north-west of chuuk lagoon, a two-year-old boy who reported experiencing a runny nose, cough and increased thirst for two weeks, suddenly developed a rash on his abdomen that moved up to the neck area within minutes. the child started to bleed from the corner of his eyes and his nose and died soon after. by 22 october, 137 cases of suspected dengue were reported with 39 blood samples sent to brisbane for pcr confirmation; however, only the initial sample was positive for dengue. as there was uncertainty as to the cause of the outbreak, an investigation was undertaken in chuuk state at the end of october 2012 to establish the cause of the acute febrile illness (afi) outbreak and ensure an appropriate response. methods from 31 october to 2 november, an investigation was undertaken to establish the cause of the afi outbreak. first, members of the epinet team, doctors, dispensary nurses, laboratory staff, the dispensary coordinator and a small number of patients were interviewed. a line list of all suspected dengue cases was developed in microsoft excel using the chuuk state hospital emergency department register and the inpatient, outpatient and laboratory registers together with the dispensary coordinator’s register. clinical symptoms were included from patient medical records where possible. the line list had the following fields: line number; hospital/clinic name; data source/register; hospital number; first name; last name; age; sex; residence (village, island, island group); date of onset; date of presentation to hospital/clinic; attending clinician; symptoms (acute fever, headache, joint pain, muscle pain, bone pain, eye pain, nausea, vomiting, diarrhoea, weakness, rash, cough, runny nose, sore throat, other main symptoms); and laboratory results. analysis analyses were undertaken to examine and describe the outbreak in terms of time, place, person and clinical features. an epidemic curve by location was constructed using ‘date of notification’ on the x-axis because of insufficient data on date of onset. attack rates and clinical features were compared across the three sites as was the distribution of cases by age and sex. attack rates were calculated using the chuuk state estimated population for 2012.2 there were 18 cases (17 from onoun and one from chuuk lagoon) that had no gender status indicated in their records; these were assumed to have a male-to-female ratio of 1:1, consistent with the ratio of cases with known sex in onoun. there were also 19 cases with no age indicated (17 from onoun and two from chuuk lagoon); these were assigned the same age distribution as the 149 cases for which age was known. information on clinical symptoms was extracted from the medical records for 55 (33%) of the 168 suspected cases. reasons for not being able to extract clinical symptoms were a poor patient history or illegible clinician handwriting. the age and sex distribution of all cases was compared with these 55 cases. the distribution of symptoms was compared with other studies that had assessed symptom distribution in particular disease outbreaks.3–6 control measures were implemented. laboratory investigation diagnostic efforts included nasopharyngeal (np) swabs for seven cases with a cough and/or a runny nose.these were tested by the reference laboratory in hawaii using pcr. the reference laboratory was unable to grow the viruses or a sufficient titre for the haemagglutination-inhibition test for antigenic analysis. results while the causative agent of the outbreak was unknown, the 18-year-old diagnosed with denv-4 in august was interviewed. it was revealed he had no history of travel and lived adjacent to a construction company headquarters undertaking major road works. there were reportedly many potential mosquito breeding sites in and around these headquarters. the road construction workers residing at the headquarters were primarily marshallese and filipino. the marshall islands was experiencing a denv-4 outbreak at the time, and dengue incidence peaks from july to september in the philippines, although it was unclear whether denv-4 was circulating at that time.7 the 18-year-old recovered and was discharged from hospital on 13 august. cases during the period 5 august to 4 november 2012, there were 168 cases of afi reported in chuuk state (table 1). of these, 62% were less than 20 years of age (34% less than five; 28% aged 5–19) and 60% were male (61% in chuuk lagoon, 53% in onoun and 62% in satawan). the highest attack rate was in the age group 0–4, followed by 60–64 and 15–19. the age group with the highest number of cases was 0–4, followed by 15–19, 5–9 and 20–24. a similar pattern by age was found by site, although in onoun, the 60–64 age group had the third highest number of suspected cases. table 1. age and sex distribution of acute febrile illness, chuuk state, federated states of micronesia, 5 august to 4 november 2012 (n = 168) click to download table 1. jpg, 812kb afi, acute febrile illness. * source of population data: national minimum development indicators.10 of all 168 cases, 128 (76%) were from chuuk lagoon, 32 (19%) were from onoun, and eight (5%) from satawan. onoun had a substantially higher attack rate of suspected cases, given its relatively small population (53 suspected cases/1000 population compared to 3.2/1000 in chuuk lagoon and 2.7/1000 in satawan). epidemic curve there were three peaks in weekly totals (30 september, 14 october and 4 november). in chuuk lagoon, there was a steady decline from 30 september. clinicians believed that this decline was a genuine decline in cases as opposed to less attention to case detection than in previous weeks. for the outer island of onoun, the first suspected case fell ill on approximately 19 september, and the weekly number of cases peaked on 14 october and 4 november. this second peak was at the time of the investigation; case numbers declined the following week. for the outer island of satawan, the first suspected case fell ill in late september, and the weekly number of cases peaked on 21 october and subsided after that (figure 2). figure 2. reported cases of acute febrile illness per week by affected island, 5 august to 4 november 2012, chuuk state, federated states of micronesia (n = 168) click to download figure 2. jpg, 348kb clinical features the age and sex distribution of cases with symptom information (n = 55) was similar to the age and sex distribution in all cases (n = 168). in total, there were 195 symptoms reported in the records from these 55 cases (table 2). eleven cases reported one or two symptoms, 36 cases reported three or four symptoms, and eight cases reported five or more symptoms. the most commonly reported symptoms were acute fever (96%), cough (82%), headache (67%) and runny nose (44%). rash was reported in only two of the 55 suspected cases, and eye pain and haemorrhage were reported once. table 2. proportion of patients presenting with described symptoms extracted from medical charts by affected island, chuuk state, federated states of micronesia, 5 august to 4 november 2012 (n = 55) click to download table 2. jpg, 541kb * source of population data: national minimum development indicators.10 twelve (7%) of the 168 suspected cases were hospitalized. information on clinical symptoms was available from nine of these. again, acute fever (100%), cough (78%) and headache (56%) were the most commonly reported symptoms. joint pain was reported in three cases (33%). the chuuk state hospital doctors who were interviewed stated that the typical symptoms they observed in the suspected dengue cases were flu-like symptoms: very high fever, muscle pain, severe headache, nausea, vomiting and some eye pain and joint pain. determining the cause of the outbreak the investigation revealed the average symptomatic presentation in the 55 cases was not typical for dengue3 (table 3). in the 55 cases, while fever and headache were common, there were very few cases with joint pain, eye pain, rash, nausea or vomiting and no cases with bone pain or body pain. also, cough, which was present in 82% of the sample, is not a typical symptom of dengue. rather the clinical presentation in the 55 cases was suggestive of a disease dominated by upper respiratory tract symptoms, so respiratory viruses, primarily influenza virus and corona virus, and bacterial infections such as mycoplasma pneumoniae were considered. measles virus infection seemed unlikely with the low frequency of rash8 and 91% measles immunization coverage.9 table 3. symptoms reported in acute febrile illness cases compared with dengue and influenza symptoms from other studies, chuuk state, federated states of micronesia, 5 august to 4 november 2012 (n = 55) click to download table 3. jpg, 498kb * feverishness † nasal congestion ‡ body pain typical symptoms for people having influenza are fever (90–100%), cough (82–93%), runny nose (39–91%), muscle pain (18–94%), and headache (17–91%).4–6 these were generally consistent with the symptomatic presentation of the 55 cases; the only exception was muscle pain, which was not reported, recorded or readable among the 55 cases. the influenza season in chuuk is reported by programme staff to be august to december. laboratory investigation three of the seven samples were positive for influenza a(h3). control measures following the epidemiological investigation, public health measures for the prevention and control of respiratory diseases were undertaken. this included triage of patients at health-care settings and ensuring all persons with symptoms of a respiratory infection adhere to respiratory hygiene, cough etiquette and hand hygiene. the incidence of afi returned to normal levels by the end of november. it is difficult to assess how much these control measures contributed to this. control measures would have had the greatest impact had they been introduced earlier in the outbreak. discussion this example demonstrated that outbreak investigations can be challenging, and unrelated cases, such as a laboratory-confirmed denv-4 case or outbreaks in surrounding areas, may affect clinical diagnoses. the application of descriptive epidemiology to characterize outbreaks by clinical features, time, place and person may help prevent mischaracterizations. it also shows the potential for concurrent outbreaks with very different etiologies but relatively similar clinical manifestations that can add further to the challenge of finding the cause. limited on-island laboratory capacity for confirmatory testing and the need to utilize off-island reference laboratories increase costs and introduce delays in obtaining definitive diagnoses in many pacific island settings. descriptive epidemiology can guide appropriate laboratory testing and reduce the resource burden of shipping specimens for reference testing. geographic remoteness, as was the case in the outer islands of chuuk, can lead to delays in taking blood samples; these may often be taken after the viraemic period, and tests aiming to find pathogens (culture, antigen or pcr tests) may thus be falsely negative. serological tests that rely on paired acute and convalescent specimens may be limited in this setting since very few patients return for a convalescent sample. investigation of respiratory disease outbreaks can be particularly challenging for a variety of reasons. the typical clinical presentation is often sufficiently indistinct and causes confusion as to the etiology. further, good quality specimens and the correct biological testing are often difficult to obtain in a timely manner.10,11 in chuuk, it was also reported that there was some resistance from patients to having a nasopharyngeal swab performed. while public health measures for the prevention and control of respiratory diseases were undertaken, the outbreak was largely over by the time these were implemented. early alert and investigation of outbreaks is important in identifying the source of the outbreak and essential for control measures to be directed at the most effective time of the outbreak.11 also, as many pathogens can be found only a short time after the onset of illness, patient consultation early in the course of the illness can help ensure the pathogen is still possible to detect in the clinical specimen.11 despite the outbreak being almost over by the time of the investigation, there were several benefits to undertaking it. these include: identifying strengths and weaknesses of the surveillance and response system; making recommendations to prevent and contain future outbreaks; understanding disease patterns in the state, country and region for informing policy and practice; building capacity among the investigation teams; and demonstrating to the public that the outbreak is being taken seriously.10 with increasing domestic and international travel, respiratory disease outbreaks such as influenza can spread rapidly.12 since the sars epidemic, researchers have found that air transportation is responsible for the global pattern of emerging diseases13 and that every person is potentially no more than 24 hours away from being affected by any epidemic happening somewhere in the world. outbreak surveillance and response is an essential process to limit the spread and impact of outbreaks. global and regional partners need to continue to invest in building the capacity of lowand middle-income countries in the surveillance and response of outbreak-prone diseases. syndromic surveillance in the pacific was established in 2010, whereby countries report syndromes using clinical signs and symptoms rather than laboratory confirmation. this is a very useful tool in resource-constrained and dispersed settings such as the pacific. while the syndromic surveillance systems have improved across the region, there is still substantial work to do to improve the utilization, accuracy and confidence in these systems.14 this will also assist countries to comply with the international health regulations (2005), which require countries to have the capacity to detect and notify public health events of international concern including infectious disease outbreaks.15 this is even more important given the current extent of international travel. since the outbreak reported in this paper, chuuk state has improved its syndromic surveillance system and now uses one integrated form that incorporates all four standard pacific syndromic surveillance syndromes and their respective case definitions. these forms are reviewed twice a week to improve early detection of outbreaks. ascertaining the cause of this outbreak in a timely manner was greatly limited by the logistical barriers, particularly the remoteness of chuuk, the limited on-island laboratory capacity and the cost and time required to obtain definitive diagnoses at reference laboratories. all of this meant the outbreak was largely over by the time the causative pathogen was identified. the low number of cases also limited the power of the investigation and the conclusions that can be drawn from it. patients who had stronger or a greater number of symptoms may have been more likely to have them recorded and therefore the sample of 55 may not have been representative of the 168 cases in terms of symptomatic distribution. also, some of the cases that presented with afi in chuuk may have been influenced by anxiety stemming from the concurrent dengue outbreaks in yap and kosrae states. it is important to note that illegible clinician hand-writing had a negative impact on the investigation. conversely, those doctors whose writing was legible had an important influence on identifying the cause of the outbreak. a substantial amount of research on this issue has been undertaken in other areas of the world and has found that the problem of illegible handwriting among clinicians is common and widespread.16–21 there is a need for research into approaches to solve this problem. some have suggested electronic records will assist,18 but this may not be feasible in the short term in many settings. other solutions need to be explored. conclusion clinical diagnosis of afi can often be difficult and misleading. this can mean that opportunities for preventive measures early on in an outbreak are missed. in any outbreak, health professionals should undertake prompt descriptive epidemiological analyses to help ascertain the cause of the outbreak. a line list using all available sources of information is a valuable tool in outbreak investigation, and analysis of the symptomatic presentation can greatly assist in finding the cause(s) of the outbreak. laboratory systems to collect, ship where required and analyse specimens need to be prompt, well rehearsed and resourced to aid outbreak investigation. conflicts of interest none declared. funding financial support for this work was provided by the secretariat of the pacific community. acknowledgements we greatly appreciate the assistance and useful input from the following individuals: lisa barrow, tai-ho chen, eric nilles, julio marar, vita skilling, marcus samo, mayleen ekiek and ilisapeci kubuabola. references: federated states of micronesia: people. palikir, government of the federated states of micronesia, 2014. available from: http://www.fsmgov.org/info/people.html [accessed 15 october 2014]. statistics for development. graphs 1900–2050 [graphiques 1900–2050] 2012. new caledonia, secretariat of the pacific community, 2014. available from: http://www.spc.int/sdp/index.php?option=com_docman&task=cat_view&gid= 104&itemid=42⟨=en [accessed 25 april 2014]. cobra c et al. symptoms of dengue fever in relation to host immunologic response and virus serotype, puerto rico, 1990–1991. american journal of epidemiology, 1995, 142:1204–1211. pmid:7485067 monto as et al. clinical signs and symptoms predicting influenza infection. archives of internal medicine, 2000, 160:3243–3247. doi:10.1001/archinte.160.21.3243 pmid:11088084 ong ak et al. improving the clinical diagnosis of influenza–a comparative analysis of new influenza a(h1n1) cases. plos one, 2009, 4:e8453. doi:10.1371/journal.pone.0008453 pmid:20041115 dai xq et al. clinical predictors for diagnosing pandemic (h1n1) 2009 and seasonal influenza (h3n2) in fever clinics in beijing, china. biomedical and environmental sciences, 2012, 25:61–68. pmid:22424628 disease surveillance. manila, department of health, 2014. available from: http://www.doh.gov.ph/disease-surveillance.html [accessed 8 july 2014]. jamrozik e, musk aw. respiratory health issues in the asia-pacific region: an overview. respirology (carlton, vic.), 2011, 16:3–12. doi:10.1111/j.1440-1843.2010.01844.x pmid:20920119 walsh ee. pleuropulmonary and bronchial infections. in: gl m, editor. mandell, douglas and bennetts. principles and practice of infectious diseases 7th ed. philadelphia, churchill livingstone elsevier, 2010. national minimum development indicators database. new caledonia, secretariat of the pacific community, 2012. available from: http://www.spc.int/nmdi/ [accessed 18 december 2013]. reingold al. outbreak investigations–a perspective. emerging infectious diseases, 1998, 4:21–27. doi:10.3201/eid0401.980104 pmid:9452395 centers for disease control and prevention (cdc). unexplained respiratory disease outbreak working group activities worldwide, march 2007-september 2011. morbidity and mortality weekly report, 2012, 61:480–483. pmid:22763885 colizza v et al. the role of the airline transportation network in the prediction and predictability of global epidemics. proceedings of the national academy of sciences of the united states of america, 2006, 103:2015–2020. doi:10.1073/pnas.0510525103 pmid:16461461 paterson bj et al. sustaining surveillance: evaluating syndromic surveillance in the pacific. global public health, 2012, 7:682–694. doi:10.1080/17441692.2012.699713 pmid:22817479 what are the international health regulations? geneva, world health origanization, 2008. available from: http://www.who.int/features/qa/39/en/index.html [accessed 12 august 2012]. attena f et al. quality improvement of medical records in a teaching hospital. journal of preventive medicine and hygiene, 2010, 51:53–56. pmid:21155405 bates k et al. determining the frequency of prescription errors in an irish hospital. irish journal of medical science, 2010, 179:183–186. doi:10.1007/s11845-010-0474-6 pmid:20191327 di paolo er et al. outpatient prescriptions practice and writing quality in a paediatric university hospital. swiss medical weekly, 2012, 142:w13564. pmid:22495667 job o, bachmann lm, schmid mk, thiel ma, ivic s. assessing the efficacy of the electronic patient record system eder: implementation study–study protocol. bmj open, 2013, 3(4). doi:10.1136/bmjopen-2012-002478 pmid:23576684 khoo em et al. medical errors in primary care clinics–a cross sectional study. bmc family practice, 2012, 13:127. doi:10.1186/1471-2296-13-127 pmid:23267547 phalke vd et al. prescription writing practices in a rural tertiary care hospital in western maharashtra, india. the australasian medical journal, 2011, 4:4–8. doi:10.4066/amj.2011.515 pmid:23393497 drug-resistant tuberculosis in the who western pacific region regional analysis tauhid islam,a tom hiatt,a cornelia henniga and nobuyuki nishikioria a stop tb and leprosy elimination, division of communicable diseases, world health organization regional office for the western pacific, manila, philippines. correspondence to tauhid islam(e-mail: islamt@wpro.who.int). to cite this article: islam t et al. drug-resistant tuberculosis in the who western pacific region. western pacific surveillance and response journal, 2014, 5(4):34–46. doi:10.5365/wpsar.2014.5.4.007 abstract objective: to review the latest information about tuberculosis (tb) drug resistance and programmatic management of drug-resistant tb in the western pacific region of the world health organization (who). methods: we analysed routine data reported by countries to who from 2007 to 2013, focusing on data from the following: surveillance and surveys of drug resistance, management of drug-resistant tb and financing related to multidrug-resistant tb (mdr-tb) management. results: in the western pacific region, 4% (95% confidence interval [ci]: 3–6) of new and 22% (95% ci: 18–26) of previously treated tb cases were estimated to have mdr-tb; this means that in 2013, there were an estimated 71 000 (95% ci: 47 000–94 000) mdr-tb cases among notified pulmonary tb cases in this region. the coverage of drug susceptibility testing (dst) among new and previously treated tb cases was 3% and 20%, respectively. in 2013, 11 153 cases were notified—16% of the estimated mdr-tb cases. among the notified cases, 6926 or 62% were enrolled in treatment. among all enrolled mdr-tb cases, 34% had second-line dst and of these, 13% were resistant to fluoroquinolones (fq) and/or second-line injectable agents. the 2011 cohort of mdr-tb showed a 52% treatment success. over the last five years, case notification and enrolment have increased more than five times, but the gap between notification and enrolment widened. discussion: the increasing trend in detection and enrolment of mdr-tb cases demonstrates readiness to scale up programmatic management of drug-resistant tb at the country level. however, considerable challenges remain. introduction globally an estimated 1.6 million people develop tuberculosis (tb), and 110 000 die from this curable illness annually.1 tb concentrates in vulnerable populations such as migrants, children, the elderly and the poor. the western pacific region of the world health organization (who) has made substantial progress and reached the tb-related millennium development goals and associated international targets in advance of the 2015 goal year: tb prevalence and mortality are below half of 1990 levels, and case detection and treatment success remain high.1 despite these gains, multidrug-resistant tuberculosis (mdr-tb) caused by mycobacterium tuberculosis that is resistant to isoniazid and rifampicin (two of the first-line drugs used for treatment) poses a formidable challenge to controlling tb. mdr-tb cases can either be previously treated tb cases that develop resistance due to inadequate, incomplete or poor treatment quality (secondary drug resistance) or newly diagnosed tb cases infected with a drug-resistant tb strain (primary drug resistance). in 2013, among patients notified with pulmonary tb, a total of 300 000 (range: 230 000–380 000) people globally were estimated to have developed mdr-tb.1 among them, approximately one quarter occurred in countries of the who western pacific region. in fact, every year, an estimated 71 000 mdr-tb cases are added to the region’s mdr-tb burden.1 most (more than 94%) of the mdr-tb cases in the region live in three countries: china, the philippines and viet nam. mdr-tb is a public health challenge for several reasons: treatment duration is very long, up to two years, and complex due to severe side-effects of second-line drugs;2,3 high management costs may contribute to the increased economic burden and catastrophic patient expenditures;4 treatment outcome is poor;1 and mdr-tb poses a huge burden on health systems in lowand middle-income countries where human resources are scarce and technical capacity is lacking to cope with the challenge.5 to address the challenge of drug resistance in the who western pacific region, the regional strategy to stop tuberculosis in the western pacific 2011–20156 declared scaling up the programmatic management of drug-resistant tb (pmdt) as one of its five objectives. this requires improvements in the following critical steps of the cascade of services: (1) step-wise increase of the proportion of tb cases who receive drug susceptibility testing (dst), (2) all diagnosed patients are promptly notified and enrolled in treatment, and (3) all enrolled patients complete their treatment with effective patient-centred support. in 2011, the western pacific regional green light committee was established to assist member states with a rational pmdt scale-up. this article is the second in a series of regional tb reports after ‘epidemiology and control of tuberculosis in the western pacific region: analysis of 2012 case notification data’.7 in this current article, we reviewed the latest available data on tb drug resistance in the who western pacific region and the status of its programmatic implementation. this analysis of mdr-tb case detection, notification, enrolment into treatment and outcome of treatment data will provide valuable information on programmatic progress and future direction. methods in this report, the data reported to who by countries and areas from 2007 to 2013 were used. in 2013, 32 of the 37 countries and areas of the who western pacific region reported data to who, representing more than 99.9% of the total population. data collection covers the following areas: tb case notification and treatment outcomes, diagnostic and treatment services, drug management, surveillance and surveys of drug-resistance, information on tb/hiv coinfection, infection control, engagement of all care providers and budgets and expenditures for tb control. the estimated burden of drug-resistant tb by country was sourced from the global tb database,where the proportion of new and previously treated tb cases with mdr-tb from the latest available information from routine surveillance or a survey of drug resistance were used to estimate the total caseload of drug-resistant tb. the full description of these methods is available in the global tuberculosis report 2014,1 and the data sets can be downloaded from the who global tb database (www.who.int/tb/data). this report describes the available data on tb drug resistance and progress in programmatic response for those countries and areas of the region where at least one mdr-tb case was notified in 2013. trends of mdr-tb rates over time were assessed for countries and areas with more than one survey or surveillance data points since 1996. a special focus was maintained on seven countries considered priority countries due to their high burden of tb: cambodia, china, the lao people’s democratic republic, mongolia, papua new guinea, the philippines and viet nam. in 2013, who published revised tb case definitions and introduced a case definition for tb cases resistant to rifampicin only (rr-tb).8 a new rapid diagnostic technology, xpert mtb/rif assay (cepheid, sunnyvale, ca, usa), endorsed by who in 2010,9 tests for rr-tb. rr-tb cases identified by the xpert mtb/rif test are recommended to start second-line tb treatment10 and require similar management to mdr-tb cases. in this report, we included rr-tb cases with the confirmed mdr-tb cases. treatment outcomes are reported for the 2011 cohort, the most recent year for which there are data. analysis was conducted using the statistical package r (r core team, 2013, vienna, austria, www.r-project.org). for transparent and reproducible research,11,12 we have published the programme code for generating the entire contents of this article using the r knitr package. results coverage of drug resistance surveillance estimates of the mdr-tb burden depend on the availability of drug resistance data from either continuous surveillance or surveys. drug resistance data were available from 25 of the 36 countries and areas of the who western pacific region (figure 1); 19 rely on routine surveillance and six rely on periodic surveys of representative samples of patients (cambodia, china, mongolia, malaysia, the philippines and viet nam). figure 1. year of most recent data on tb drug resistance by country, who western pacific region, 1997–2014 click to download figure 1. jpg, 447kb national representative drug resistance survey (drs) data are available from five out of seven priority countries of the region (cambodia, china, mongolia, the philippines and viet nam). among them, cambodia, mongolia, the philippines and viet nam have at least two national representative survey data points, and china is currently conducting its second national drs. malaysia’s 1997 data originated from geographical areas that were not considered representative of the country as a whole. two countries with outstanding drs data are papua new guinea and the lao people’s democratic republic. subnational drs in papua new guinea is ongoing and results are expected to be available in 2015. estimated mdr-tb burden: cases and rates overall in the region in 2013, 4% (95% confidenc interval [ci]: 3–6) of new and 22% (95% ci: 18–26) of previously treated tb cases were estimated to have mdr-tb: 71 000 in total, 53 000 (75%) among new cases and 18 000 (25%) among previously treated tb cases (table 1). the proportion of new tb cases with mdr-tb ranged from 0% to 6%. china had the highest proportion at 6% (95% ci: 5–7) of mdr-tb among new cases. the proportion of previously treated tb cases with mdr-tb ranged from 0% to 34%. mongolia had the highest estimated proportion at 34% (95% ci: 29–38) of mdr-tb among previously treated tb cases. countries with more than 20% mdr-tb among previously treated tb cases were china (26%), mongolia (34%), the philippines (21%) and viet nam (23%). although the highest proportion of mdr-tb was observed among previously treated tb cases, the absolute number of estimated mdr-tb cases is higher among new cases. table 1. estimated number and proportion of mdr-tb cases among new and previously treated tb cases by selected country,* who western pacific region click to download table 1. jpg, 812kb source: global tb database. ci, confidence interval; mdr-tb, multidrug-resistant tuberculosis. * countries that reported at least one mdr-tb case in 2013. † estimates of the proportion of new and previously treated tb cases that have mdr-tb were produced using modelling (including multiple imputation) that was based on data from countries that were considered to be similar in terms of tb epidemiology for which data do exist. there was a positive correlation between the proportion of mdr-tb among new and previously treated tb cases (intercept 0.08%, coefficient 3.1%, f-statistics 3.84, p = 0.123; figure 2), although this was not statistically significant. most countries and areas fell within 95% confidence limits of the linear regression line except for mongolia and the philippines. both had a higher proportion of mdr-tb among previously treated tb cases in relation to new cases. australia, hong kong special administrative region and singapore, had a lower proportion of mdr-tb among previously treated tb cases relative to new cases. figure 2. correlation* between the estimated proportion of mdr-tb cases among new and previously treated tb cases respectively by selected country,† who western pacific region, 2013 click to download figure 2. jpg, 449kb mdr-tb, multidrug-resistant tuberculosis. * line represents the linear regression and the grey band represents 95% ci. † countries that reported their own mdr-tb estimates for new and previously treated cases in 2013. estimated mdr-tb burden over time among 25 countries with drug resistance data, 22 countries have more than one data point (direct measurement) either from continuous surveillance or from repeat surveys. four scenarios are observed when comparing rates per 100 000 population of new tb cases with the estimated rate of mdr-tb among new tb cases from six countries in the western pacific region (figure 3). for mongolia and viet nam, both the reported notification rate of new tb cases and estimated rate of mdr-tb increased over time (7% and 4% per year from 1999 to 2007 and 1997 to 2012, respectively). in australia and the philippines, tb notification rates increased while the rate of mdr-tb decreased (–4% and –10% per year from 2004 to 2012 and 2010 to 2012, respectively). in hong kong special administrative region, both the tb notification rate and estimated rate of mdr-tb decreased (–8% for both from 1996 to 2012). in the republic of korea, tb case notification decreased, but the estimated rate of mdr-tb increased by 2% from 1996 to 2005. these findings need to be interpreted with caution as sufficient data points are not available for all of the countries to identify trends with confidence. figure 3. rates per 100 000 population of new tb cases (black) and estimated mdr-tb cases among new tb cases (green) by selected countries, who western pacific region, 1996–2012 click to download figure 3. jpg, 373kb mdr-tb, multidrug-resistant tuberculosis. drug susceptibility testing (dst) dst data were reported from 18 countries in 2013. only 3% of new bacteriologically confirmed tb cases and 20% of previously treated tb cases were tested for mdr-tb or rr-tb (table 2). dst coverage for mdr-tb among new cases was less than 10% in china (3%), the lao people’s democratic republic (< 1%), the philippines (< 1%), the republic of korea (4%) and viet nam (3%) and among previously treated tb cases. dst coverage remained below 50% in china (20%), japan (43%), the lao people’s democratic republic (26%), malaysia (9%), the marshall islands (43%), the philippines (14%), the republic of korea (9%) and viet nam (45%). table 2. number and proportion of notified tb cases with dst results, confirmed mdr-tb and rr-tb cases and cases confirmed by xpert, by new and previously treated tb cases and selected country,* who western pacific region, 2013 click to download table 2. jpg, 677kb dst, drug susceptibility testing; mdr-tb, multidrug-resistant tuberculosis; prev, previously treated tuberculosis; rr-tb, rifampicin-resistant tuberculosis. * countries that reported at least one mdr-tb case in 2013. † rifampicin-resistant only cases are included whether confirmed by dst or xpert among cases tested in 2013, 8% were resistant to isoniazid only, 2% were resistant to rifampicin only and 11% were resistant to both (data not shown). the xpert mtb/rif test identified 17% of mdr-tb cases overall and was highest for viet nam at 81% and papua new guinea at 72% (table 2). in countries with a high burden of mdr-tb, the dst coverage among previously treated tb cases increased steadily while the mdr-tb positivity rate remained high (figure 4). in fact, there is a general paradoxical tendency for countries with a relatively higher dst coverage to detect a lower proportion of mdr-tb. figure 4. dst coverage among previously treated tb cases and mdr-tb and rr-tb positivity rate by year and selected countries, who western pacific region, 2007–2013 click to download table/figure 4. jpg, 457kb dst, drug susceptibility testing; mdr-tb, multidrug-resistant tuberculosis; rr-tb, rifampicin-resistant tuberculosis. mdr-tb notifications and enrolment in treatment there were 11 153 reported cases of mdr-tb and rr-tb in the region in 2013, representing 16% of the 71 000 estimated mdr-tb cases among pulmonary tb patients. of these, 2379 were reported among new tb cases, representing 4% of the estimated 53 000 mdr-tb cases among tb new cases; 5664 were reported among previously treated tb cases, representing 31% of the estimated 18 000 mdr-tb among previously treated tb cases. mongolia, the philippines and viet nam reported 84%, 33% and 47%, respectively, of their estimated mdr-tb among previously treated tb cases (table 3). table 3. number of estimated and notified mdr-tb and rr-tb cases, proportion notified among estimated mdr-tb and rr-tb cases and number and proportion of mdr-tb and rr-tb cases enrolled in treatment by selected country,* who western pacific region, 2013† click to download table 3. jpg, 924kb of those notified mdr-tb cases in 2013, only 62% (6926 of 11 153) were enrolled in treatment with second-line anti-tb drugs. for most countries, there has been a steady increase in enrolment in treatment over the years, especially since 2011; however, the gap between notified cases and enrolment in treatment for mdr-tb is widening in china, the philippines and viet nam (table 4, figure 5). table 4. number and proportion of mdr-tb and rr-tb cases resistant to second-line anti-tb drugs and xdr-tb, by selected country,* who western pacific region, 2013 click to download table 4. jpg, 453kb dst, drug susceptibility testing; fq, fluoroquinolones; mdr-tr, multidrug-resistant tuberculosis; rr-tb, rifampicin-resistant tuberculosis; xdr-tb, extensively drug-resistant tuberculosis. * countries that reported at least one mdr-tb case in 2013. figure 5. number of mdr-tb and rr-tb cases notified and enrolled in treatment by year and selected country,* who western pacific region, 2007–2013 click to download figure 5. jpg, 496kb mdr-tb, multidrug-resistant tuberculosis; rr-tb, rifampicin-resistant tuberculosis. * countries that reported at least 10 mdr-tb cases in 2013. mdr-tb treatment outcomes treatment for the 2011 cohort were reported from 15 countries. overall the proportion of mdr-tb cases who successfully completed treatment was 52%, with 21% lost to follow-up and 10% having died (figure 6). treatment success was 100% in macao special administrative region yet only 14% in papua new guinea. figure 6. treatment outcomes of mdr-tb and rr-tb cases by year and selected country,* who western pacific region, 2007–2011 click to download figure 6. jpg, 601kb mdr-tb, multidrug-resistant tuberculosis; rr-tb, rifampicin-resistant tuberculosis. * countries that reported at least one mdr-tb case in 2013 and reported treatment outcomes for 2011. in china, the treatment success rate was less than 50% between 2007 and 2011 with death and failure rates remaining high. malaysia, and the philippines showed a continuous decline of treatment success over the same time period; non-evaluation of cases is the main reason for malaysia while loss to follow-up plays a major role in the decreasing success rate in the philippines. among the priority countries, cambodia (86%) and viet nam (72%) had high treatment success for the 2011 cohort. second-line anti-tb dst and xdr-tb twelve countries reported testing data for the second-line anti-tb drugs in 2013, with 34% of enrolled mdr-tb cases having results for dst for the second-line anti-tb drugs. combining data from all 12 countries, 12% of tested cases had resistance to fluoroquinolones (fq), 8% to a second-line injectable and 13% to either a fq or a second-line injectable agent or both. extensively drug-resistant tb (xdr-tb) is a subset of mdr-tb that acquired additional resistance to fq and one or more of the second-line injectable agents. in 2013, the total number of reported xdr-tb cases was 107 (5% of tested mdr-tb cases) from six countries in the region (17% of all countries and areas). the highest rate was reported from the republic of korea where 10% of all mdr-tb cases were xdr-tb. expenditure for mdr-tb management expenditure for mdr-tb management has significantly increased over the years (figure 7). in 2013, a total of us $57.3 million was spent for mdr-tb management in the region; this was 10.9% of the total national tb programme expenditure. of the total funds reported, 18.4% was from domestic sources (government allocation) with the remaining 81.6% from external grants. second-line drugs comprised 27.8% of the total cost for mdr-tb management. figure 7. expenditure on mdr-tb and rr-tb by funding source, year and selected country*, who western pacific region, 2007–2013 click to download figure 7. jpg, 519kb mdr-tb, multidrug-resistant tuberculosis; rr-tb, rifampicin-resistance tuberculosis. * countries that reported at least 10 mdr-tb cases in 2013. discussion the western pacific region comprises countries with high mdr-tb caseloads, such as china, the philippines, viet nam, and several pacific island nations with very small, irregular caseloads. the member states are also at different stages of pmdt implementation. the first step for pmdt scale-up is to establish diagnostic capacity and increase the proportion of tb cases who receive dst. the global plan to stop tb13 set a target for dst at 100% of previously treated tb cases and 20% of new cases by 2015. overall dst coverage remained low with the current coverage for new cases at 3% and previously treated tb cases at 20%, both far below the global plan to stop tb target. the introduction of a rapid diagnostic tool has enabled a drastic increase in diagnostic capacity, as evidenced in viet nam, where 81% of notified mdr-tb cases were diagnosed by xpert mtb/rif in 2013. this analysis indicates that the expansion of dst coverage is still ongoing to cover the highest risk groups. most countries starting pmdt focus on previously treated tb cases first, as diagnosing mdr-tb cases among new tb cases is a huge challenge in this region. although the proportion of mdr-tb among new tb cases is low, the absolute numbers are very high. it is a challenge to identify effective and efficient strategies to identify mdr-tb cases among new tb cases considering current financial and human resource capacity. to identify potential high-risk groups that can be targeted for selective dst, surveillance systems need to be expanded and strengthened. xdr-tb is also a growing concern. currently, second-line dst coverage is low at 34% as reported from 12 countries, and the true magnitude of xdr-tb burden is unknown. as pmdt is expanded with increased second-line dst capacity, more xdr-tb patients will likely be diagnosed. programmes need to get ready to address xdr-tb with guidelines for the management of xdr-tb patients including policies for appropriate palliative care and infection control. it is also of paramount importance that all tb cases diagnosed with mdr-tb are quickly put on treatment. detection of mdr-tb cases is challenging and requires a lot of effort; if notified cases are not put on treatment, all these efforts will be in vain. it is alarming that overall in the region in 2013, 38% of the notified cases were not put on treatment (48% in china, 43% in the philippines and 21% in viet nam). as reported to the who regional office for the western pacific, reasons for this may be many-fold: some patients may be on the waiting list because of unavailability of treatment capacity including drugs, hospitalization and treatment support. rapid scale-up of diagnostic capacity especially with xpert mtb/rif may not be accompanied by an increased treatment capacity. another reason may be loss to follow-up of confirmed cases that can occur due to non-accessibility of pmdt centres; non-coordination between diagnostic and treatment sites; and economic burden to patients, including direct and indirect cost. instead, these patients return to their community and continue to spread their mdr-tb strain. increasing diagnostic capacity must be aligned with drug and treatment provision, and political commitment to coordinated treatment capacity to match diagnostic capacity is essential. in addition, underlying causes for the initial high loss to follow-up need to be identified and addressed. the call for integrated patient-centred tb care and prevention, and the bold policies and supportive systems in the who end tb strategy,14 need to be operationalized to address these issues. national tb programmes alone may not be able to address this misalignment between diagnostic capacity and treatment availability. it is also imperative that all enrolled mdr-tb patients complete their treatment. as shown, treatment success rates in the region are low at 52% for the 2011 cohort. this is similar to the global average of 48%.1 high proportions of mdr-tb cases lost to follow-up or not evaluated (21% and 17%, respectively) are part of this low success rates and result in continual transmission of drug-resistant tb strains. these low success rates challenge the usefulness of pmdt; however, cambodia and viet nam showed treatment success rates above 70% over several years, showing that increasing treatment success for mdr-tb is possible. the overall increase in notification and enrolment in treatment of mdr-tb cases demonstrates the readiness for pmdt scale-up at the country level. the results of this analysis showed that notification of tb cases is increasing; however, currently only 16% of the estimated mdr-tb among notified cases were reported under pmdt. considerable challenges remain for scaling up pmdt with serious concerns regarding national political commitment and the long-term sustainability of donor-funded programmes that provide more than 80% of funding for mdr-tb. the reader should note that the data reported in this analysis were not complete for all countries. as such, interpretation of the data should be made with caution. mdr-tb is a man-made phenomenon, and unless the underlying cause is addressed, control efforts will not be successful. prevention of mdr-tb including strengthening basic tb control needs to be at the centre of the strategy to address mdr-tb. scaling-up of pmdt has to progressively improve all critical steps of the cascade of services in a balanced manner. tb control has entered the most dynamic phase in decades with many opportunities. we have new diagnostic tools, new tb drugs and new strategies. it is therefore critical to invest both financial and technical resources to prevent mdr-tb and to scale up pmdt. funding none. conflict of interest none declared. acknowledgement the authors are very grateful to matteo zignol and anna dean for their comments on the draft publication. they also thank the national tuberculosis control programmes of the countries of the western pacific region. references: global tuberculosis report 2014. geneva, world health organization, 2014. available from: http://www.who.int/tb/publications/global_report/gtbr14_main_text.pdf [accessed 5 december 2014]. companion handbook to the who guidelines for the programmatic management of drug-resistant tuberculosis. geneva, world health organization, 2014. available from: http://apps.who.int/iris/bitstream/10665/130918/1/9789241548809_eng.pdf?ua=1 [accessed 5 december 2014]. nathanson e et al. adverse events in the treatment of multidrug-resistant tuberculosis: results from the dots-plus initiative. international journal of tuberculosis and lung disease, 2004, 8:1382–1384. pmid:15581210 wingfield t et al. defining catastrophic costs and comparing their importance for adverse tuberculosis outcome with multi-drug resistance: a prospective cohort study, peru. plos medicine, 2014, 11:e1001675. doi:10.1371/journal.pmed.1001675 pmid:25025331 abubakar i et al. drug-resistant tuberculosis: time for visionary political leadership. lancet, 2013, 13:529–539. doi:10.1016/s1473-3099(13)70030-6 pmid:23531391 regional strategy to stop tuberculosis in the western pacific 2011–2015. manila, world health organization regional office for the western pacific, 2011. available from: http://www.wpro.who.int/tb/documents/policy/2010/regional_strategy/en/ [accessed 5 december 2014]. hiatt t, nishikiori n. epidemiology and control of tuberculosis in the western pacific region: analysis of 2012 case notification data. western pacific surveillance and response journal, 2014, 5:25–34. doi:10.5365/wpsar.2014.5.1.013 pmid:24734214 definitions and reporting framework for tuberculosis – 2013 revision. geneva, world health organization, 2013. available from: http://apps.who.int/iris/bitstream/10665/ 79199/1/9789241505345_eng.pdf [accessed 5 december 2014]. automated real time nucleic acid amplification technology for rapid and simultaneous detection of tuberculosis and rifampicin resistance: xpert mtb/rif assay for the diagnosis of pulmonary and extrapulmonary tb in adults and children, policy update. geneva, world health organization, 2013. available from: http://apps.who.int/iris/ bitstream/10665/112472/1/9789241506335_eng.pdf [accessed 5 december 2014]. xpert mtb/rif implementation manual: technical and operational ‘how-to’: practical considerations. geneva, world health organization, 2014. available from: http://apps.who.int/iris/bitstream/10665/112469/1/9789241506700_eng.pdf [accessed 5 december 2014]. peng rd, dominici f, zeger sl. reproducible epidemiologic research. american journal of epidemiology, 2006, 163:783–789. doi:10.1093/aje/kwj093 pmid:16510544 groves t, godlee f. open science and reproducible research. bmj (clinical research ed.), 2012, 344:e4383. pmid:22736475 the global plan to stop tb 2011–2015. geneva, world health organization, 2010. available from: http://www.stoptb.org/assets/documents/global/plan/ tb_globalplantostoptb2011-2015.pdf [accessed 5 december 2014]. wha 67.1. global strategy and targets for tuberculosis prevention, care and control after 2015. geneva, world health organization, 2014. available from: http://apps.who.int/gb/ebwha/pdf_files/wha67/a67_r1-en.pdf [accessed 5 december 2014]. https://ojs.wpro.who.int/ 1wpsar vol 12, no 3, 2021 | doi: 10.5365/wpsar.2021.12.3.856 original research c oronavirus disease 2019 (covid-19), caused by severe acute respiratory syndrome coronavirus 2 (sars-cov-2), is associated with significant morbidity and mortality, especially among susceptible populations such as the elderly and those with comorbidities.1 co-infections have been reported in covid-19 patients and can lead to less favourable outcomes.2–5 to date, most studies have reported overall co-infection rates and have not distinguished between primary and later co-infections. primary or early co-infection is defined as any infection occurring simultaneously or detected soon after admission, usually within 48 or 72 h. any co-infection occurring after this period is regarded as secondary co-infection. brunei darussalam reported its first covid-19 case on 9 march 2020, and, as of 4 february 2021, had recorded 180 cases. the country remains at who level 2 of transmission,6 with sporadic imported cases and no local infection since 6 may 2020. all patients diagnosed with covid-19, regardless of symptoms, are admitted to the national isolation centre (nic) for isolation and treatment. we report our nationwide experience in screening for primary bacterial co-infection among patients treated for covid-19 in brunei darussalam. methods in this descriptive study, data were retrospectively retrieved from a prospectively maintained database. this excel® database was created at the start of the covid-19 outbreak to monitor patients and for situational management and analysis. the information collected includes demographic data, comorbidities, symptoms at admission and during hospitalization, investigations, treatment and outcomes. a department of medicine, pengiran muda mahkota pengiran muda haji al-muhtadee billah hospital, tutong, brunei darussalam. b department of medicine, raja isteri pengiran anak saleha hospital, bandar seri begawan, brunei darussalam. published: 8 september 2021 doi: 10.5365/wpsar.2021.12.3.856 objective: bacterial co-infections in cases of coronavirus disease 2019 (covid-19) can lead to less favourable outcomes. the aim of this study was to determine the prevalence of primary bacterial co-infections among patients with covid-19 in brunei darussalam. methods: seventy-one of 180 patients admitted to the national isolation centre between 9 march 2020 and 4 february 2021 were screened for primary bacterial co-infection (infection occurring ≤48 h from admission). we compared patients with a primary bacterial co-infection to those without. results: of the 71 screened patients, 8 (11.2%) had a primary bacterial co-infection (sputum 37.5% [6/16], blood 2.8% [1/36], urine 1.7% [1/60]), for a period prevalence rate of 4.4% (respiratory tract infection 3.3% [6/180], bloodstream 0.6% [1/180], urine 0.6% [1/180]) among all covid-19 patients. older age, presence of comorbidity, symptoms at admission (fever, dyspnoea, nausea/vomiting), abnormal chest x-ray (cxr) and more severe covid-19 (p < 0.05) were associated with primary bacterial co-infection. primary bacterial co-infection was also associated with development of secondary infection and death (all p < 0.05). only one patient with primary bacterial co-infection died (methicillin-sensitive staphylococcus aureus septicaemia and multiorgan failure). conclusions: our study showed that primary bacterial co-infection affected 4.4% of patients with covid-19 in brunei darussalam. older age, presence of comorbidity, symptoms and abnormal cxr at admission and more severe disease were associated with a primary bacterial co-infection. lower respiratory tract infection was the most common co-infection. prevalence of primary bacterial co-infections among patients with covid-19 in brunei darussalam aieman bashir,a muhammad syafiq abdullah,b natalie raimiza momin,b pui lin chong,b rosmonaliza asli,b babu mani ivana and vui heng chonga,b correspondence to vui heng chong (email: vuiheng.chong@moh.gov.bn) wpsar vol 12, no 3, 2021 | doi: 10.5365/wpsar.2021.12.3.856 https://ojs.wpro.who.int/2 bashir et alscreening for primary bacterial co-infection in covid-19 cases common respiratory viral pathogens, as no specific treatment is available. after investigations for primary bacterial co-infection, empiric antimicrobials were administered when indicated and later adjusted according to culture sensitivity patterns for those who screened positive. patients who developed or continued to have symptoms 48 h after admission were screened for secondary coinfections, defined as infection occurring more than 48 h after admission. clinical management was guided by the investigational results. data analyses data were anonymized and extracted from our excel® database for analysis with ibm spss version 23.0. in our management protocol, only patients who had symptoms or abnormal findings of investigations at admission were screened for primary bacterial co-infections. patients who were not screened were included in the group with no primary bacterial co-infections for analyses. we assessed factors associated with positivity for primary bacterial co-infection (demographic characteristics, symptoms, investigations, disease severity) and outcomes (screening and positivity for secondary co-infection, death) using the mann-whitney test for continuous variables and the fisher exact test for categorical variables. a p value of < 0.05 was considered statistically significant. results as of 4 february 2021, 180 patients (mean age, 35.3 ± 16.7 years; males, 62.2%) had been admitted to the nic with covid-19. among them, 28.9% (n = 52) had comorbidities, including hypertension (13.3%), dyslipidaemia (13.9%), diabetes mellitus (5.6%), pulmonary disease (4.4%) and cardiac disease (3.3%). overall, 56.1% (n = 101) were symptomatic, 6.7% (n = 12) were pre-symptomatic and 37.2% (n = 67) were asymptomatic. common symptoms included cough (33.9%), fever (23.3%) and rhinorrhoea (20.0%). an abnormal cxr at admission was noted in 15.3%, and the cycle threshold value was 27.2 ± 6.3. the majority of cases were categorized as mild, with 11.7% categorized as moderate and 2.7% as severe (table 1). primary bacterial co-infection was screened in 71 (39.4%) patients. of these, 80.3% (57 patients) were screened within 24 h and 19.7% (14 patients) 24–48 h after admission. of the 71 patients screened, 8 (11.2%) had a primary bacterial co-infection, usually in the lower covid-19 management and categorization in brunei darussalam, all patients who test positive for sars-cov-2 by reverse transcription polymerase chain reaction (rt-pcr) are admitted to the nic (designated hospital for covid-19 for the whole country) for isolation and treatment. patients were categorized as symptomatic if they had symptoms at admission, asymptomatic if they had no symptoms during their illness and pre-symptomatic if they were asymptomatic at admission but developed symptoms during hospitalization. management was based on the treatment protocol described in our previous publication.7 patients were categorized into three levels of disease severity: mild (asymptomatic or mild disease, i.e. with none of the features listed under the moderate and severe categories), moderate (fever with respiratory tract symptoms and pneumonia on imaging) and severe (respiratory rate > 30/min, oxygen saturation ≤ 93% at rest, pao2/fio2 ≤ 300 mm hg and progression of lung lesions > 50% within 24–48 h). patients categorized as having mild covid-19 were managed in the main isolation wards, and those with moderate or severe covid-19 were managed in the high-dependency or intensive-care setting. screening for primary bacterial co-infection primary bacterial co-infection was defined as infection diagnosed within 48 h of admission. screening for primary bacterial co-infection was carried out according to our management protocol.7 at admission, a detailed history and clinical examinations were carried out for all patients, and all had routine investigations (blood and chest x-ray [cxr]). patients with fever, rigor, cough, shortness of breath, dysuria, diarrhoea, abnormal investigational findings (leukocytosis, elevated inflammatory markers [c-reactive protein], elevated procalcitonin) and abnormal cxr were screened for primary co-infection by collection of sputum, urine and stool for gram staining, microscopy and culture, and blood for culture. management of co-infections as our management protocol included a 5-day course of oseltamivir to cover influenza a and b, we did not screen for influenza viruses. we also did not screen for other wpsar vol 12, no 3, 2021 | doi: 10.5365/wpsar.2021.12.3.856https://ojs.wpro.who.int/ 3 screening for primary bacterial co-infection in covid-19 casesbashir et al table 1. characteristics and outcomes of patients variable all patients (n = 180) n (%) positive for primary co-infection (n = 8) negative for primary co-infection (n = 172) p demography and characteristics mean age (years) 35.3 ± 16.7 50.6 ± 12.6 34.6 ± 16.5 0.007 median (range (years)) 33 (0.58–72) 53 (29–64) 32 (0.58–72) gender male 112 (62.2) 6 (75.0) 106 (61.6) 0.446 female 68 (37.8) 2 (25.0 66 (38.4) comorbidity (yes) 52 (28.9) 5 (62.5) 47 (27.3) 0.032 hypertension 24 (13.3) 4 (50.0) 20 (11.6) 0.002 diabetes 10 (5.6) 2 (25.0) 8 (4.7) 0.014 dyslipidaemia 25 (13.9) 5 (62.5) 20 (11.6) <0.001 cardiac disease 6 (4.3) 1 (12.5) 5 (2.9) 0.14 pulmonary disease 8 (4.4) 1 (12.5) 7 (4.1) 0.259 symptoms at admission (yes) 101 (56.1) 6 (75.0) 95 (55.2) 0.271 fever 42 (23.3) 5 (62.5) 37 (21.5) 0.007 cough 61 (33.9) 4 (50.0) 57 (33.1) 0.325 rhinorrhoea 36 (20.0) 2 (25.0) 34 (19.8) 0.718 diarrhoea 9 (5.0) 1 (12.5) 8 (4.7) 0.319 anosmia 2 (1.1) 0 (0.0) 2 (1.2) 0.759 myalgia 16 (8.9) 1 (12.5) 15 (8.7) 0.714 sore throat 12 (6.7) 0 (0.0) 12 (7.0) 0.439 headache 13 (7.2) 0 (0.0) 13 (7.6) 0.419 nausea/vomiting 3 (1.7) 1 (12.5) 2 (1.2) 0.014 dyspnoea 4 (2.1) 3 (37.5) 1 (0.6) <0.001 admission investigations chest x-ray* abnormal 26 (15.3) 4 (50.0) 22 (13.6) 0.005 investigations cycle threshold 27.2 ± 6.3 25.3 ± 6.8 27.2 ± 6.3 0.336 albumin 39.4 ± 3.9 38.3 ± 2.9 39.4 ± 3.97 0.314 neutrophil 3.8 ± 2.2 4.10 ± 2.93 3.82 ± 2.16 0.94 lymphocyte 2.0 ± 0.8 1.61 ± 0.66 1.97 ± 0.77 0.294 neutrophil-lymphocyte ratio 2.39 ± 2.39 3.17 ± 2.65 2.35 ± 2.38 0.429 outcomes disease category mild 154 (85.6) 4 (50.0) 150 (87.2) 0.012 for trendmoderate 21 (11.7) 3 (37.5) 18 (10.5) severe/critical 5 (2.7) 1(12.5) 4 (2.3) screened for secondary co-infection 20 (11.1) 3 (37.5) 17 (9.9) 0.015 developed secondary co-infection 10 (5.6) 2 (25.0) 8 (4.7) 0.014 death (mortality rate) 3 (1.7) 1 (12.5) 2 (1.2) 0.014 *ten patients did not undergo chest x-ray. wpsar vol 12, no 3, 2021 | doi: 10.5365/wpsar.2021.12.3.856 https://ojs.wpro.who.int/4 bashir et alscreening for primary bacterial co-infection in covid-19 cases septicaemia. this patient presented late (5 days after the onset of dyspnoea), was symptomatic at admission and deteriorated rapidly. the cxr was consistent with pneumonia. sputum gram staining was positive for gram-positive cocci, but no organism was isolated. all the other patients with primary bacterial co-infection recovered. discussion we assessed the period prevalence of primary bacterial co-infection, factors and outcomes among patients with covid-19 in brunei darussalam. the period prevalence was 4.4%, consistent with the results of other published studies. in one study in spain, 37 primary co-infections were reported in 31 (of 989) patients admitted with covid-19, a prevalence of 3.1%; 30 were bacterial coinfections (in 25 patients) and 7 were viral co-infections. two patients among those with bacterial co-infection were infected with two different organisms.8 a study in the united states of america found that 2.8% of covid-19 patients had primary respiratory tract co-infection and 1.1% had bacteraemia. the authors screened 80 (14.7%) of 542 patients with covid-19 for primary bacterial respiratory co-infection, of whom 15 (2.8%) were treated as having true primary respiratory co-infections, defined as any infection identified within 72 h of admission.9 although we did not screen patients for viral co-infection, the rate has been reported to be 1.5–3.0%.2,10,11 respiratory syncytial virus and influenza a are the two most common, with detection rates of 16.9% and 15.5%, respectively.2 most of the co-infections in our study were of the lower respiratory tract. as covid-19 is mainly a respiratory tract, for a period prevalence of 4.4% among all covid-19 patients. most of the positive samples were sputum (6/16 patients [37.5%]), followed by blood (1/36 patients [2.8%]) and urine (1/60 patients [1.7%]). stool assessment showed no bacteria. the bacteria isolated consisted of klebsiella species (2 patients), streptococcus spp. (2 patients), methicillin-resistant staphylococcus species (2 patients), enterobacter species (2 patients), rothia mucilaginosa (1 patient) and haemophilus influenzae (1 patient). two organisms were isolated from two patients (cases 3 and 4 in table 2). one patient (case 4) with methicillin-resistant staphylococcus aureus (mrsa) isolated from sputum had a history of clinic visits, and screening showed colonization only in the nose. the patient (case 2) with group b streptococcus isolated in urine reported no urinary symptoms but had fever, myalgia and nausea at admission. he was treated for urinary infection with a course of co-amoxiclav. blood and sputum cultures from this patient were negative. patients with primary bacterial co-infection tended to be older, had comorbidities (especially hypertension, diabetes mellitus and dyslipidaemia), reported symptoms at admission (fever, nausea/vomiting, dyspnoea), had abnormal cxr and were categorized as having moderate or severe disease (table 1). these patients were also more likely than those without primary bacterial coinfection to be screened for (37.5% vs. 9.9%, p = 0.015) and develop secondary co-infection (25% vs. 4.7%, p = 0.014) and to die (12.5% vs. 0.6%, p = 0.014). one of the patients with primary bacterial coinfection died 16 days after admission due to mrsa ards: acute respiratory distress syndrome; mrsa: methicillin-resistant staphylococcus aureus. table 2. details of screening and result for primary bacterial co-infections sample n (%) (n = 180) positivity rate n (%) case no. organism/s outcomes blood 36 (20.0) 1 (2.8) 1 methicillin-sensitive staphylococcus aureus died of septicaemia/ards urine 60 (33.3) 1 (1.7) 2 streptococcus group b treated and alive sputum 16 (8.9) 6 (37.5) 3 rothia mucilaginosa/enterobacter gergoviae all treated and alive 4 klebsiella pneumoniae/mrsa 5 haemophilus influenzae 6 streptococcus pneumoniae 7 klebsiella pneumoniae 8 enterobacter aerogenes stool 2 (1.1) 0 (0.0) negative wpsar vol 12, no 3, 2021 | doi: 10.5365/wpsar.2021.12.3.856https://ojs.wpro.who.int/ 5 screening for primary bacterial co-infection in covid-19 casesbashir et al pandemic. an important limitation is the small numbers of covid-19 patients and of primary bacterial coinfections, as small samples make the results liable to inherent errors in statistical analysis. another limitation is the evolving nature of our management protocol in the earlier phase of the outbreak. apart from normal symptom screening and investigations, some patients also underwent opportunistic screening of easily obtained samples, such as urine. furthermore, not all our patients were screened, and patients with mild or asymptomatic primary bacterial co-infection might have been missed. the proportion is, however, likely small. importantly, our study represents a real-world situation in which screening is conducted mainly when indicated. in conclusion, we have shown that primary bacterial co-infection, mostly in the respiratory tract, has affected 4.4% of covid-19 patients in brunei darussalam. the rate of primary bacterial co-infection was higher among older patients and those with comorbidities, symptoms at admission (particularly fever, nausea/vomiting and dyspnoea), an abnormal cxr and moderate or severe disease. primary bacterial co-infection was also associated with secondary co-infection and death. routine blood and urine screening for bacterial co-infection is not indicated and should be guided by clinical and laboratory indicators; however, primary co-infections should be identified early and treated appropriately to prevent complications. acknowledgements none conflicts of interest none for all authors ethics this study was conducted in accordance with the declaration of helsinki 2013 and data used for analyses were anonymized. funding none respiratory illness, primary and secondary bacterial co-infections can occur, as in other respiratory viral illnesses.2,3,8,9 therefore, it is not surprising that we found that the respiratory tract was the most common site of bacterial co-infection and that sputum samples had the highest proportion of positive results. overall, a wide spectrum of organisms has been found in covid-19 co-infections, with some patients having more than one co-infection. in a study in china, 24 types of respiratory pathogen were found in respiratory samples from patients with covid-19, of whom 94.2% were co-infected with one or more pathogens. common bacterial pathogens reported included s. pneumoniae, k. pneumoniae and h. influenzae.12 in our study, several organisms were isolated from two patients: r. mucilaginosa and e. gergoviae (case 3) and mrsa and k. pneumoniae (case 4), which are uncommon organisms. the reported spectrum of organisms in nosocomial co-infections among hospitalized covid-19 patients is similar to those encountered in clinical practice among non-covid-19 patients.13,14 although few bacterial and viral co-infections have been identified in covid-19 patients, vigilance must be maintained, with screening for both primary and secondary co-infections, as they have been associated with less favourable outcomes.9 in our study, covid-19 patients with primary bacterial co-infection were older, had comorbidities, presented with fever, dyspnoea and nausea/vomiting, had an abnormal cxr at admission and were categorized as having moderate or severe disease. covid-19 patients with primary bacterial co-infection were also more likely to be screened for and develop secondary infection and were more likely to die. one systematic review and meta-analysis showed that the odds of death were higher for patients with co-infections and superinfection than for those with only sars-cov-2 infection (odds ratio = 3.31; 95% confidence interval, 1.82–5.99).15 strengths and limitations of our study should be considered when interpreting the findings. the main strength of our study is that it included all covid-19 cases in the country and may therefore be applicable to countries or regions with similar demographics, healthcare infrastructure and management of the covid-19 wpsar vol 12, no 3, 2021 | doi: 10.5365/wpsar.2021.12.3.856 https://ojs.wpro.who.int/6 bashir et alscreening for primary bacterial co-infection in covid-19 cases 9. lardaro t, wang az, bucca a, croft a, glober n, holt db et al. characteristics of covid-19 patients with bacterial co-infection admitted to the hospital from the emergency department in a large regional healthcare system. j med virol. 2021;93(5):2883-9. doi:10.1002/jmv.26795 pmid:33448423 10. burrel s, hausfater p, dres m, pourcher v, luyt ce, teyssou e et al. co-infection of sars-cov-2 with other respiratory viruses and performance of lower respiratory tract samples for the diagnosis of covid-19. int j infect dis. 2021;102:10-3. doi:10.1016/j. ijid.2020.10.040 pmid:33115679 11. peci a, tran v, guthrie jl, li y, nelson p, schwartz kl et al. prevalence of co-infections with respiratory viruses in individuals investigated for sars-cov-2 in ontario, canada. viruses. 2021;13:130. doi:10.3390/v13010130 pmid:33477649 12. zhu x, ge y, wu t, zhao k, chen y, wu b et al. co-infection with respiratory pathogens among covid-2019 cases. virus res. 2020;285:198005. doi:10.1016/j.virusres.2020.198005 pmid:32408156 13. song jh, huh k, chung dr. community-acquired pneumonia in the asia-pacific region. semin respir crit care med. 2016;37(6):83954. doi:10.1055/s-0036-1592075 pmid:27960208 14. torres a, blasi f, peetermans we, viegi g, welte t. the aetiology and antibiotic management of community-acquired pneumonia in adults in europe: a literature review. eur j clin microbiol infect dis. 2014;33(7):1065-79. doi:10.1007/s10096-014-2067-1 pmid:24532008 15. musuuza js, watson l, parmasad v, putman-buehler n, christensen l, safdar n. prevalence and outcomes of co-infection and superinfection with sars-cov-2 and other pathogens: a systematic review and meta-analysis. plos one. 2021;16(5):e0251170. doi:10.1371/journal.pone.0251170 pmid:33956882 references 1. jordan re, adab p, cheng kk. covid-19: risk factors for severe disease and death. bmj. 2020;368:m1198. doi:10.1136/bmj.m1198 pmid:32217618 2. lansbury l, lim b, baskaran v, lim ws. co-infections in people with covid-19: a systematic review and meta-analysis. j infect. 2020;81(2):266-75. doi:10.1016/j.jinf.2020.05.046 pmid:32473235 3. rawson tm, moore lsp, zhu n, ranganathan n, skolimowska k, gilchrist m et al. bacterial and fungal co-infection in individuals with coronavirus: a rapid review to support covid-19 antimicrobial prescribing. clin infect dis. 2020;71(9):2459-68. doi:10.1093/cid/ ciaa530 pmid:32358954 4. cox mj, loman n, bogaert d, o’grady j. co-infections: potentially lethal and unexplored in covid-19. lancet microbe. 2020;1(1):e11. doi:10.1016/s2666-5247(20)30009-4 pmid:32835323 5. bardi t, pintado v, gomez-rojo m, escudero-sanchez r, azzam lopez a, diez-remesal y et al. nosocomial infections associated to covid-19 in the intensive care unit: clinical characteristics and outcome. eur j clin microbiol infect dis. 2021;40(3):495-502. doi:10.1007/s10096-020-04142-w pmid:33389263 6. coronavirus disease 2019 (covid-19). situation report 72. 1 april 2020. geneva: world health organization; 2020. available from: https://www.who.int/emergencies/diseases/novel-coronavirus-2019/situation-reports, accessed 10 june 2021. 7. chong vh, chong pl, metussin d, asli r, momin rn, mani bi et al. conduction abnormalities in hydroxychloroquine add on therapy to lopinavir/ritonavir in covid-19. j med virol. 2020;92(11):23224. doi:10.1002/jmv.26004 pmid:32401368 8. garcia-vidal c, sanjuan g, moreno-garcía e, puerta-alcalde p, garcia-pouton n, chumbita m et al. incidence of co-infections and superinfections in hospitalized patients with covid-19: a retrospective cohort study. clin microbiol infect. 2021;27(1):83-8. doi:10.1016/j.cmi.2020.07.041 pmid:32745596 high hepatitis c virus infection among female sex workers in viet nam: strong correlation with hiv and injection drug use original research linh-vi n le,a siobhan o’connor,b tram hong tran,c lisa maher,a john kaldor,a keith sabin,d hoang vu tran,e quang dai tran,f van anh thi hog and tuan anh nguyenc a kirby institute for infection and immunity, unsw sydney, australia. b united states centers for disease control and prevention, atlanta, ga, united states of america. c national institute of hygiene and epidemiology, hanoi, viet nam. d unaids, geneva, switzerland. e partners in health research, hanoi, viet nam. f general department of preventive medicine, ministry of health, hanoi, viet nam. g united states centers for disease control and prevention, hanoi, viet nam. correspondence to linh-vi n le (email: leli@who.int). to cite this article: le ln, o’connor s, tran tt, maher l, kaldor j, sabin k, et al. high hepatitis c virus infection among female sex workers in viet nam: strong correlation with hiv and injection drug use. western pac surveill response j. 2019 jul;10(2). doi:10.5365/wpsar.2019.10.1.002 abstract objective: the world health organization’s guidelines on viral hepatitis testing and treatment recommend prioritizing high prevalence groups. hepatitis c virus (hcv) infection disproportionately affects people who inject drugs and men who have sex with men, but data on female sex workers (fsw) are limited. the study aimed to determine active hcv infection and risk factors associated with hcv exposure among vietnamese fsw. methods: we surveyed 1886 women aged ≥ 18 years from haiphong, hanoi and ho chi minh city who had sold sex in the last month. we tested for hcv antibody and hcv core antigen as markers for exposure to hcv and active infection, respectively. results: across these provinces, high prevalence of hcv exposure (8.8–30.4%) and active infection (3.6–22.1%) were observed. significant associations with hcv exposure were hiv infection (aor = 23.7; 95% ci: 14.8–37.9), injection drug use (aor = 23.3; 95% ci: 13.1–41.4), history of compulsory detention (aor = 2.5; 95% ci: 1.4–4.2) and having more than 10 sex clients in the last month (aor = 1.9; 95% ci: 1.2–3.2). among fsw who reported never injecting drugs, hiv infection (aor = 24.2; 95% ci: 14.8–39.4), a history of non-injection drug use (aor = 3.3, ci: 1.8–5.7), compulsory detention (aor = 2.2; 95% ci: 1.2–4.0) and having over 10 sex clients in the last month (aor = 2.2, 95% ci: 1.3–3.7) were independently associated with hcv exposure. discussion: fsw have elevated hcv risks through sexand drug-related pathways. these findings highlight the need to offer fsw-targeted hcv interventions and ensure their access to hiv prevention and treatment. objective globally, an estimated 71 million people were living with chronic hepatitis c virus (hcv) infection, and 1.75 million were newly infected with hcv in 2015.1 approximately 75% of acute hcv infections result in chronic infections. in the absence of treatment, 15–30% of people develop cirrhosis within 20 years with subsequent increased risk of hepatocellular carcinoma and death.2 the estimated number of new hcv infections exceeds the estimated number of deaths and cures together,1 warranting rapid scale-up of both preventive and therapeutic interventions for viral hepatitis. the primary mode of hcv transmission is blood contact, frequently by reuse of injecting equipment or other skin-piercing devices.3 accordingly, 23% of new hcv infections occur in people who inject drugs (pwid), and 31% of deaths from chronic hcv infections are attributable to a history of injection drug use.4 interventions for prevention have focused on use of sterile equipment for skin-piercing procedures, including making clean equipment available to pwid. direct-acting antiviral (daa) medications providing effective cures for hcv infection are yet to become widely available in many lowand middle-income countries.1 until there is universal access to daas, national viral hepatitis responses may have to prioritize certain populations for testing and treatment; world health organization (who) guidelines recommend targeting populations with evidence of higher chronic hcv prevalence.5 greater understanding of the viral hepatitis epidemic is needed as global and national responses set strategic directions and priorities. countries of asia account for one third of global chronic hcv infections.1 in viet nam, mathematic modelling estimated 1 million people to be living with chronic hcv and 24 300 new annual hcv infections, 11% of which are attributed to injection drug use and 60% to blood transfusions or medical services.6 recent studies in viet nam documented high hcv infection prevalence among pwid, with up to 80% of pwid exposed to the virus.7,8 more recently, injection drug use also correlated with hcv infection among vietnamese men who have sex with men (msm).9 there is an assumption that female sex workers (fsw) have an elevated risk for blood-borne and sexually transmitted infections, potentially through dual sexual and drug use transmission pathways, but there is limited information on hcv in this population globally, including in viet nam. the current study aimed to address the global data gap for knowledge about hcv infection among fsw to inform the viral hepatitis response. methods data collection viral hepatitis investigation was added to the 2013 round of the routine integrated biological and behavioural surveillance (ibbs) conducted by the viet nam national institute of hygiene and epidemiology (nihe) and the united states centers for disease control and prevention (us cdc). we conducted separate cross-sectional surveys among street-based sex workers (ssw) and venue-based sex workers (vsw) from hanoi, haiphong and ho chi minh city (hcmc) using time-location sampling from june to october 2013. the survey consisted of interviews and hcv serological testing. women aged ≥ 18 years who sold sex in the last month (n = 1886) were eligible to be recruited. the sample sizes were calculated to detect 20% anti-hcv prevalence and expected prevalence based on the 2009 ibbs surveys10 with 95% confidence level, 2–5% targeted confidence interval width, and adjustment for design effect. for each province and population, we generated a sampling frame of locations where fsw were known to be present. locations for the ssw sampling frame were streets, parks and other openly public spaces; venues for the vsw sample were entertainment or service establishments. the number of sex workers present at each location was enumerated through field visits. locations were randomly selected with probability proportional to size. at each selected cluster, invitational coupons were provided to potential participants to enroll in the study conducted at health clinics. sample sizes were reached for all populations. women who fulfilled the eligibility criteria and provided written voluntary informed consent underwent individual face-to-face interviews conducted by trained interviewers. a structured questionnaire used in previous ibbs rounds was used to collect information on sociodemographic characteristics, sex work history, condom use behaviours, alcohol and drug use risks, sex partner drug use risks, incarceration history and access to health services. a series of questions were asked about different types of illicit drugs, including lifetime and recent drug use, injection drug use and sharing of needles and syringes. certified laboratory technicians collected venous blood by venipuncture. no personal identifying information was collected. the study protocol and data collection instruments were reviewed and approved by the ethics review board of nihe and the internal review board of the us cdc. laboratory tests the participants’ serum was tested using the abbott architect® automated immunologic assay platform and commercially available architect assay kits for hcv antibody (anti-hcv) and hcv core antigen (hcvcoreag), hepatitis b surface antigen (hbsag), hepatitis b e antigen (hbeag), and hepatitis b core antibodies (anti-hbc) (abbott laboratories, usa). specimens were initially screened for anti-hcv and hbsag and with subsequent testing of reactive specimens for hcvcoreag and hbeag, respectively. each run included standardized architect® controls. blood specimens were tested for hiv per national guidelines: screening for hiv antibody using genscreen ultra hiv ag/ab (bio-rad, usa) with confirmation of positive tests by determine hiv-1/2 (alere, japan) and murex hiv ag/ab combination (diasorin, united kingdom of great britain and northern ireland) testing. the national reference laboratory at nihe conducted external quality assurance on a randomly selected 10% of hiv-negative and 5% of hiv-positive screening samples. statistical analyses summary statistics were calculated by province and subpopulations. sampling weights were applied to adjust for sampling probabilities in prevalence estimation. all statistical analyses were performed using stata version 14,11 with adjustments for correlation between and within clusters. hcv infection status was classified as hcv exposure (anti-hcv-positive), active hcv infection (anti-hcv-positive and hcvcoreag-positive) or no evidence of hcv exposure (anti-hcv-negative). for hepatitis b virus (hbv), classifications were past or active hbv infection (hbsag-positive or anti-hbc-positive), active hbv infection (hbsag-positive) and hbeag-active hbv infection (hbsag-positive and hbeag-positive). univariable and multivariable analyses were conducted to determine factors associated with hcv exposure. we used pearson’s χ2 statistic to test the association between selected demographics and risk characteristics and hcv exposure. random effects logistic regression were used to account for intracluster correlation. independent variables associated with hcv infection at p p results sample characteristics and risk behaviours table 1 presents sociodemographic and behavioural indicators by province and subpopulation of fsw. across the subpopulations and provinces, the mean ages ranged from 28.9 to 35.4 years, and durations of sex work ranged from 4.9 to 7.4 years with ssw being older and working in the sex industry for a longer period of time than vsw. formal education beyond the sixth grade was attained by a large majority (> 85%) of fsw in hanoi and haiphong and by lower proportions in hcmc. the median total monthly income was higher for vsw (us$ 430–480) than ssw (us$ 290–380). a history of drug use was high across all subpopulations, ranging from 8.3% to 31.8%. a history of injection drug use reached 24.2% among haiphong ssw and ranged from 3.0% to 8.2% among other subpopulations. table 1. demographic characteristics and hiv, hbv and hcv prevalence among female sex workers in three urban provinces of viet nam, 2013 click to download table 1. jpg, 1.3mb in the multivariable analysis (table 2), over two fifths reported negotiating sex mainly on the street or in other public areas, and three quarters had sold sex to over 10 clients in the past month. consistent condom use, defined as condom use for every vaginal or anal sex act with clients in the past month, was reported by 71.7%. eight per cent of fsw had ever injected drugs, and 10.2% had been involuntarily detained in a rehabilitation centre. table 2. association between hcv exposure and selected characteristics of female sex workers in three urban provinces of viet nam, 2013 click to download table 2. jpg, 897kb prevalence of infection hcv, hbv and hiv prevalence are presented in table 1. twenty-four specimens for the hcmc ssw population and one specimen for the hanoi vsw were missing hbv and hcv results. exposure to hcv infection was highest among haiphong ssw (30.4%) and lowest among hcmc vsw (8.8%). in the remaining provinces and subpopulations, hcv exposure ranged from 12.4% to 15.6%. the prevalence of active hcv infection was highest among haiphong ssw (22.1%) and lowest among hcmc vsw (3.6%) and ranged from 5.6% to 9.4% in the remaining provinces and subpopulations. across the provinces and subpopulations, hbv exposure ranged from 55.9% to 84.1%, whereas active hbv infections ranged from 5.6% to 11.1%. hbeag-positive hbv infection ranged from 1.4% to 4.0%. there were no active hbv and hcv coinfections. hiv prevalence patterns were similar to hcv, with the highest observed among haiphong ssw (31.9%) and lowest among hcmc vsw (8.2%). coinfection with hcv and hiv ranged from 1.6% among hcmc ssw to 13.7% among haiphong ssw. predictors of hcv exposure in univariable analyses (table 2), sociodemographic factors associated with anti-hcv prevalence included older age and being separated, divorced or widowed. occupational characteristics showing significant crude associations were longer duration of sex work, negotiating sex mainly on the streets, selling sex in more than one province, having over 10 clients in the last month and ever having been confined in compulsory detention centres for sex workers. the sexual and drug use risk behaviours crudely associated with hcv exposure were ever using injection drugs and having a sex partner who had injected drugs in the last month or whose drug use status was unknown to the fsw. hiv infection was a strong predictor of hcv infection exposure. when adjusted for age and marital status in multivariable analysis, hiv seropositivity and injection drug use were the strongest predictors of hcv exposure (table 2). fsw who tested hiv-positive had 23.7 (95% ci: 14.8–37.9) times greater odds of having been exposed to hcv than those who tested hiv-negative. compared to fsw who had never injected drugs, those who had ever injected drugs had 23.3 (95% ci: 13.1–41.4) times the odds of hcv infection exposure. the par for ever having injected drugs was 64.3% (95% ci: 49.4–76.5). other independent predictors for hcv exposure were having over 10 sex clients in the last month and a history of compulsory detention. hiv seropositivity is also the strongest predictor of hcv exposure in the subpopulation of fsw who self-reported never having injected drugs (table 3). other factors significantly associated with hcv were lifetime non-injection drug use, compulsory detention and having over 10 sex clients in the last month. table 3. association between hcv exposure and selected characteristics of female sex workers who reported never having injected drugs in three urban cities of viet nam, 2013 click to download table 3. jpg, 902kb discussion we found high prevalence of hcv exposure (8.8–30.4%) and active hcv infection (3.6–22.1%) among fsw across all study provinces and subpopulations, an important finding with implications for hcv prevention and treatment. the small body of studies of hcv among fsw has documented exposure but not current infection. studies have shown lower anti-hcv prevalence ranging from 2.6% in india to 12% in china, taiwan.12,13 in contrast, a more recent study in canada found higher anti-hcv seropositivity (42.5%) among fsw.14 this is the first study in viet nam to examine risk factors for hcv exposure among fsw. injection drug use was the key driver of hcv infection among fsw as it is among msm and pwid in viet nam.8,9 although only 8% of fsw reported injection drug use, almost two thirds of hcv exposures were attributable to injection drug use. notably, hcv exposure was also high among fsw without a history of injection drug use. non-injection drug use was a significant factor for hcv exposure among fsw. we previously found similar correlations with hiv infection among fsw, in that hiv risk increased with the use of non-injection drugs, specifically amphetamine-type stimulants, which was high in hcmc and hanoi.10 in the context of these findings, it is important that viet nam’s hcv interventions address fsw vulnerabilities for infection. fsw and other women who inject drugs face gender-specific health risks that lead to increased levels of injection risk behaviour, yet among pwid, women are often overlooked by harm reduction programmes.15 compulsory detention was a predictor of hcv exposure among fsw, potentially due to hcv exposure at the detention centres, or fsw engaged in higher-risk activities that exposed them to hcv and led to incarceration. given that there is evidence of high hcv incidence in detained populations across the world,16 the 2012 closure of detention centres for fsw in viet nam is an important policy change that can reduce the risk of hcv infection, along with hiv infection, among fsw. the positive association of hcv exposure with having a greater number of clients indicates that fsw are vulnerable to infection through sexual risks. although sexual intercourse has relatively low efficiency in transmitting hcv, a history of multiple sex partners may increase the probability of having sex with an infectious partner during the acute phase of infection,3 and the use of stimulants potentially elevates risky sexual contact.17 fsw in this study reported low levels of consistent condom use, exposing them to hiv and potentially frequent sexually transmitted infections, which increases risk for hcv infection.18,19 even taking into account a history of injection drug use, hiv was independently associated with hcv, which is consistent with evidence establishing the role of viral sti in the transmission of hiv.20 since hcv and hiv share a parenteral route of transmission, the who-recommended approach to hiv prevention involving a comprehensive package that includes both harm reduction and condom interventions21 also applies to hcv prevention programmes. given high hcv and hiv coinfection among fsw, viet nam could leverage the resources and infrastructure available for hiv services to deliver hcv testing and treatment services to fsw and other key populations. hiv coinfection reduces the likelihood of spontaneous clearance of hcv infection and accelerates the progression of liver disease.22 hbv infection prevalence among fsw did not differ from that in the general population, estimated at 9.1%,6 a finding that is consistent with the primarily perinatal and childhood transmission of hbv in asia.23 prevalence of hbeag-active hbv infections among fsw was also similar to prevalence previously detected among vietnamese women of child-bearing age.24 hbeag positivity usually indicates viral replication and therefore high levels of infectiousness. yet in genotypes b and c, which are most common in viet nam,25 high viral replication can occur without the presence of hbeag due to mutations in the precore and basal core promoter regions. the mutations suppress hbeag synthesis while enhancing viral genome replication.26,27 nevertheless, as the vietnamese ministry of health expands treatment, targeted provision of routine hbv testing and treatment for active hbv infection would benefit fsw and other populations where stigma and discrimination impedes access to services. for example, high antenatal screening uptake would be difficult to achieve with few sex workers presenting to health-care services.28 increasing hcv prevalence from north to south had been expected given the older injection drug use epidemic in hcmc in the south of viet nam.29 instead, hcv infection was higher in the two northern provinces than in hcmc, a pattern observed also among msm in viet nam.9 the higher prevalence of reported injection drug use among ssw and vsw in haiphong may explain the higher hcv infection in the north, but it contrasts with lower reported injection drug use among msm in the north than in the south.9 further phylogenetic research may help to explain these infection patterns. our study has limitations, including potential misclassification of injection drug use status in that there is greater willingness to report non-injection drug use. this would lead to an overestimation of the association of hcv infection with non-injection drug use. however, our findings of additional sexual and non-injection drug use risks are consistent with studies reporting associations between hcv exposure and non-injection crack use in canada and with increased number of sex clients and duration of sex work in china.14,30 another limitation was that 35 of the 271 anti-hcv-positive samples tested for hcv core antigen returned reactive results in the grey zone, which indicates possible but not confirmed active hcv infection. almost all grey zone reactive results were from hanoi. inclusion of grey zone reactive results would have shown 4% and 5% higher viraemic hcv infection among hanoi ssw and vsw, respectively. furthermore, as a limitation of the cross-sectional survey design, the analysis could not assess temporal relationships between risk behaviour with hcv acquisition. being able to monitor infections and risks across time would help to better target interventions, including understanding the extent to which incarceration contributed to hcv transmission. the 2013 vietnamese ibbs round represents the first routine integration of hcv core antigen into national viral hepatitis surveillance, of which we are aware. in contrast to most population or risk group–based estimates of hcv infection, the inclusion of hcv core antigen testing provided data on active hcv infection. hcv core antigen testing is sensitive and specific and is a reasonable alternative to hcv nucleic acid testing, providing similar accuracy without the additional logistic requirements and cost of nucleic acid testing.31 assay-based, population-based estimates of both active hcv infection and past hcv exposure are needed to forecast national prevention and diagnostic and treatment needs. in the absence of such data, estimates have been derived from external estimates through mathematic modelling of the relationship between the prevalence of active infection and exposure. as daas become increasingly accessible, targeting testing and treatment services to populations at higher risk of hcv infection will be the most effective way to reduce the chronic hcv morbidity and prevent further transmission. the study showed high past and active hcv infection prevalence and hcv/hiv coinfection among vietnamese fsw, a vulnerable population historically characterized by low hiv service uptake. results have the potential to inform national responses designed to address dual sexual and drug-related risks for hcv infection among fsw while highlighting the need to ensure fsw access to hiv prevention and treatment services. acknowledgements the authors are indebted to the study participants and would like to thank the directors and research staff of the provincial aids haiphong, hanoi and ho chi minh city. we are grateful to abbott laboratories for donating assays for anti-hcv and hbv serology and to the department of viral hepatitis at the united states centers for disease control and prevention for providing the hcv core antigen assays. we acknowledge also the dedicated efforts of the ibbs research and laboratory team members from nihe and family health international. lisa maher and john kaldor are supported by the award of australian national health and medical research fellowships. the kirby institute is affiliated with the faculty of medicine, university of new south wales. funding the research has been supported by the president’s emergency plan for aids relief through the united states centers for disease control and prevention under the terms of 5u2ggh000116. conflicts of interest all authors declared no conflict of interest. references global hepatitis report 2017. geneva: world health organization; 2017 (https://www.who.int/hepatitis/publications/global-hepatitis-report2017/en/). hajarizadeh b, grebely j, dore gj. epidemiology and natural history of hcv infection. nat rev gastroenterol hepatol. 2013 sep;10(9):553–62. doi:10.1038/nrgastro.2013.107 pmid:23817321 alter mj. epidemiology of hepatitis c virus infection. world j gastroenterol. 2007 may 7;13(17):2436–41. doi:10.3748/wjg.v13.i17.2436 pmid:17552026 degenhardt l, charlson f, stanaway j, larney s, alexander lt, hickman m, et al. estimating the burden of disease attributable to injecting drug use as a risk factor for hiv, hepatitis c, and hepatitis b: findings from the global burden of disease study 2013. lancet infect dis. 2016 dec;16(12):1385–98. doi:10.1016/s1473-3099(16)30325-5 pmid:27665254 who guidelines on hepatitis b and c testing. geneva: world health organization; 2017 (https://www.who.int/hepatitis/publications/guidelines-hepatitis-c-b-testing/en/). vietnam general department of preventive medicine, center for disease analysis, world health organization. estimates and projection of disease burden and investment case for hepatitis b and c in viet nam. hanoi: ministry of health; 2017. duong ht, jarlais dd, khuat oht, arasteh k, feelemyer j, khue pm, et al.; drive study group. risk behaviors for hiv and hcv infection among people who inject drugs in hai phong, viet nam, 2014. aids behav. 2018 jul;22(7):2161–71. doi:10.1007/s10461-017-1814-6 pmid:28612212 nadol p, o’connor s, duong h, le lv, thang ph, tram th, et al. findings from integrated behavioral and biologic survey among males who inject drugs (mwid) vietnam, 2009-2010: evidence of the need for an integrated response to hiv, hepatitis b virus, and hepatitis c virus. plos one. 2015 feb 18;10(2):e0118304. doi:10.1371/journal.pone.0118304 pmid:25692469 nadol p, o’connor s, duong h, mixson-hayden t, tram th, xia gl, et al. high hepatitis c virus (hcv) prevalence among men who have sex with men (msm) in vietnam and associated risk factors: 2010 vietnam integrated behavioural and biologic cross-sectional survey. sex transm infect. 2016 nov;92(7):542–9. doi:10.1136/sextrans-2015-052518 pmid:27044267 le lv, nguyen ta, tran hv, gupta n, duong tc, tran ht, et al. correlates of hiv infection among female sex workers in vietnam: injection drug use remains a key risk factor. drug alcohol depend. 2015 may 1;150:46–53. doi:10.1016/j.drugalcdep.2015.02.006 pmid:25765480 statacorp. stata statistical software: release 14. college station (tx): statacorp lp; 2014. sandesh k, varghese t, harikumar r, beena p, sasidharan vp, bindu cs, et al. prevalence of hepatitis b and c in the normal population and high risk groups in north kerala. trop gastroenterol. 2006 apr-jun;27(2):80–3. pmid:17089617 wu jc, lin hc, jeng fs, ma gy, lee sd, sheng wy. prevalence, infectivity, and risk factor analysis of hepatitis c virus infection in prostitutes. j med virol. 1993 apr;39(4):312–7. doi:10.1002/jmv.1890390410 pmid:8492103 goldenberg sm, montaner j, braschel m, socias e, guillemi s, shannon k. dual sexual and drug-related predictors of hepatitis c incidence among sex workers in a canadian setting: gaps and opportunities for scale-up of hepatitis c virus prevention, treatment, and care. int j infect dis. 2017 feb;55:31–7. doi:10.1016/j.ijid.2016.12.019 pmid:28027990 iversen j, page k, madden a, maher l. hiv, hcv, and health-related harms among women who inject drugs: implications for prevention and treatment. j acquir immune defic syndr. 2015 jun 1;69 suppl 2:s176–81. doi:10.1097/qai.0000000000000659 pmid:25978485 larney s, kopinski h, beckwith cg, zaller nd, jarlais dd, hagan h, et al. incidence and prevalence of hepatitis c in prisons and other closed settings: results of a systematic review and meta-analysis. hepatology. 2013 oct;58(4):1215–24. doi:10.1002/hep.26387 pmid:23504650 maher l, phlong p, mooney-somers j, keo s, stein e, couture mc, et al. amphetamine-type stimulant use and hiv/sti risk behaviour among young female sex workers in phnom penh, cambodia. int j drug policy. 2011 may;22(3):203–9. doi:10.1016/j.drugpo.2011.01.003 pmid:21316935 thomas dl, zenilman jm, alter hj, shih jw, galai n, carella av, et al. sexual transmission of hepatitis c virus among patients attending sexually transmitted diseases clinics in baltimore–an analysis of 309 sex partnerships. j infect dis. 1995 apr;171(4):768–75. doi:10.1093/infdis/171.4.768 pmid:7535827 marx ma, murugavel kg, tarwater pm, srikrishnan ak, thomas dl, solomon s, et al. association of hepatitis c virus infection with sexual exposure in southern india. clin infect dis. 2003 aug 15;37(4):514–20. doi:10.1086/376639 pmid:12905135 ward h, rönn m. contribution of sexually transmitted infections to the sexual transmission of hiv. curr opin hiv aids. 2010 jul;5(4):305–10. doi:10.1097/coh.0b013e32833a8844 pmid:20543605 implementing comprehensive hiv/sti programmes with sex workers: practical approaches from collaborative interventions. geneva: world health organization; 2013 (https://www.who.int/hiv/pub/sti/sex_worker_implementation/en/). sulkowski ms. management of hepatic complications in hiv-infected persons. j infect dis. 2008 may 15;197(s3) suppl 3:s279–93. doi:10.1086/533414 pmid:18447614 hipgrave db, nguyen tv, vu mh, hoang tl, do td, tran nt, et al. hepatitis b infection in rural vietnam and the implications for a national program of infant immunization. am j trop med hyg. 2003 sep;69(3):288–94. doi:10.4269/ajtmh.2003.69.288 pmid:14628946 nguyen vt, mclaws ml, dore gj. highly endemic hepatitis b infection in rural vietnam. j gastroenterol hepatol. 2007 dec;22(12):2093–100. doi:10.1111/j.1440-1746.2007.05010.x pmid:17645465 truong bx, seo y, yano y, ho pt, phuong tm, long dv, et al. genotype and variations in core promoter and pre-core regions are related to progression of disease in hbv-infected patients from northern vietnam. int j mol med. 2007 feb;19(2):293–9. pmid:17203204 parekh s, zoulim f, ahn sh, tsai a, li j, kawai s, et al. genome replication, virion secretion, and e antigen expression of naturally occurring hepatitis b virus core promoter mutants. j virol. 2003 jun;77(12):6601–12. doi:10.1128/jvi.77.12.6601-6612.2003 pmid:12767980 lin cl, kao jh. risk stratification for hepatitis b virus related hepatocellular carcinoma. j gastroenterol hepatol. 2013 jan;28(1):10–7. doi:10.1111/jgh.12010 pmid:23094699 pinkham s, malinowska-sempruch k. women, harm reduction and hiv. reprod health matters. 2008 may;16(31):168–81. doi:10.1016/s0968-8080(08)31345-7 pmid:18513618 sievert w, altraif i, razavi ha, abdo a, ahmed ea, alomair a, et al. a systematic review of hepatitis c virus epidemiology in asia, australia and egypt. liver int. 2011 jul;31 suppl 2:61–80. doi:10.1111/j.1478-3231.2011.02540.x pmid:21651703 zhang gq, chen sd, lian jh. [seroepidemiological study of hbv and hcv infection in sexually promiscuous groups]. zhonghua liu xing bing xue za zhi. 1995 aug;16(4):213–6. (in chinese) pmid:7585900 freiman jm, tran tm, schumacher sg, white lf, ongarello s, cohn j, et al. hepatitis c core antigen testing for diagnosis of hepatitus c virus infection: a systematic review and meta-analysis. ann intern med. 2016 sep 6;165(5):345–55. doi:10.7326/m16-0065 pmid:27322622 https://ojs.wpro.who.int/ 1wpsar vol 13, no 1, 2022 | doi: 10.5365/wpsar.2022.13.1.873 perspective s tudies of the first few “x” (ffx) – formerly known as “first few 100” – cases involve rapid collection of data and specimens from the cases of a novel pathogen or emerging variants and their close contacts. collection of standardized high-quality clinical, epidemiological, virological and serological data in ffx studies can provide insight into transmission dynamics, severity, risk factors for severe disease and the clinical spectrum of disease. these data can be used in risk assessment and modelling studies, to forecast potential impact and guide preparedness planning and public health interventions. independent studies of coronavirus disease 2019 (covid-19), caused by severe acute respiratory syndrome coronavirus 2 (sars-cov-2), have provided insights into key transmissibility and severity parameters.1 although these studies are valuable in contributing to the growing body of scientific evidence on covid-19 epidemiology, there is need for a greater number of harmonized studies (e.g. ffx studies) that can be rapidly implemented in early epidemic phases.2 in early january 2020, the world health organization (who) adapted and added to existing pandemic influenza and middle east respiratory syndrome coronavirus (mers-cov) protocols for covid-19 and rebranded them as unity studies – a global sero-epidemiological standardization initiative. unity protocols aim to increase evidence-based knowledge for action, and are an invaluable tool for improving equity by providing harmonized and fit-for-purpose protocols for all income and resource settings.3 unity studies allow for timely comparison and aggregate analysis of data across countries and regions, to contextualize data to different settings and offer a depth of understanding that is not readily available using other platforms. who solicited interest in implementing these protocols during the covid-19 pandemic from partners to address knowledge gaps and inform public health response measures.4 despite being in an unprecedented pandemic, many countries were able to leverage existing infrastructure to implement unity studies. insights from participating countries are centrally reported to who headquarters and regional offices, and include contributions from 98 who member states (including australia, mongolia, the philippines and singapore in the western pacific region).4,5 more in-depth understanding of the epidemiology of covid-19 gained through such studies can be used to inform adaptive and ongoing control strategies. for example, in early 2020, a study aligned with ffx and unity conducted in china showed that most secondary cases were probably infected around the time of symptom onset of the primary cases.6 this highlighted the need for household infection control measures, given that immediate intervention by local health authorities following symptom onset of the primary case is difficult to achieve. data from another aligned study conducted in the united kingdom of great britain and northern ireland a the university of melbourne, melbourne, victoria, australia. b victorian infectious diseases reference laboratory, peter doherty institute for infection and immunity, melbourne, victoria, australia. c hunter new england local health district, population health, wallsend, new south wales, australia. d menzies school of health research, charles darwin university, darwin, northern territory, australia. e college of medicine and dentistry, james cook university, cairns, queensland, australia. f hunter new england local health district, population health, tamworth, new south wales, australia. g world health organization regional office for the western pacific, manila, philippines. h world health organization, geneva, switzerland. i peter doherty institute for infection and immunity at the university of melbourne and the royal melbourne hospital, melbourne, victoria, australia. j murdoch children’s research institute, melbourne, victoria, australia. published: 24 march 2022 doi: 10.5365/wpsar.2022.13.1.873 the ongoing value of first few x studies for covid-19 in the western pacific region adrian j marcato,a james e fielding,b kristy crooks,c,d peter d massey,e,f linh-vi le,g isabel bergerih and jodie mcvernona,i,j correspondence to jodie mcvernon (email: j.mcvernon@unimelb.edu.au) wpsar vol 13, no 1, 2022 | doi: 10.5365/wpsar.2022.13.1.873 https://ojs.wpro.who.int/2 marcato et alffx studies for covid-19 linguistically diverse communities and workers who were unable to work from home have been disproportionately infected.9,10 existing ffx study populations can be expanded into longitudinal cohorts with extended follow-up to address questions regarding persistence of immunity following both natural and vaccine-induced immunity, and its effectiveness in preventing infection and disease upon re-exposure. these data will be critical in informing future control measures, particularly with the emergence of new variants and the commencement of vaccination campaigns. for maximum utility, countries should exercise or pilot these studies in advance of future outbreaks – for example, at the beginning of influenza seasons – to facilitate timely implementation during emergencies. piloting will allow countries to consider data collection and management, laboratory testing and capacity, ethics and governance approvals, identify a suitable workforce and develop workflows in advance of outbreaks, to ensure that they are effective. piloting should also consider developing scalable, feasible and culturally appropriate methods for collecting data and specimens, to improve equity and health outcomes for the vulnerable and those at greater risk of disease. these methods should be developed with communities for communities.11 historical evidence shows that previous pandemics have disproportionately impacted first nations peoples.12–15 adapting ffx and unity studies within a first nations context can lead to a deeper understanding of the experience of families, explore household transmission in different types of households and improve understanding of how studies can be operationalized to inform culturally appropriate and safe disease control strategies. ffx studies and the broader suite of unity studies remain incredibly useful in the current regional and global context, and they could provide ongoing robust and comparable evidence of covid-19 epidemiology in low and middle-income countries as the pandemic evolves. investing in unity studies, readiness and preparedness planning will better support the ongoing covid-19 response and help to ensure research equity and improve capacity to respond rapidly to future emerging pathogens. (united kingdom) established a sensitive and specific symptom profile of covid-19, including the reporting of anosmia in patients. this symptom was later added to the united kingdom’s covid-19 symptom list.7 there is also continuing uncertainty about the role of children in spreading covid-19 and the extent of true asymptomatic and pre-symptomatic transmission. although the spread appears to be influenced by social settings and household structures, public health interventions (e.g. test, trace and isolate; spontaneous and imposed behavioural and distancing measures and mobility restrictions; communication campaigns; and varying degrees of community engagement and cohesion in response) have led to differing rates of transmission within and between countries. ffx studies can provide opportunities to explore transmission dynamics and severity during all epidemic phases, provided that contacts of cases can still be traced. ffx and other unity studies are well placed to provide information on sars-cov-2 variants such as alpha, beta and delta, which are marked by different biological characteristics to those previously observed in epidemiological studies.8 pooling of data from ffx studies may help us to understand how sars-cov-2 could behave in the western pacific, particularly in settings that have not yet experienced uncontrolled epidemics and in populations with low vaccination coverage or low levels of natural immunity. areas with limited resources to conduct intensive surveillance studies would benefit from globally standardized data collection and analysis to assist with more nuanced planning for future outbreaks. ffx studies provide a platform to compare epidemiology between waves and jurisdictions and can be used to inform targeted and context-specific public health interventions. for example, australia and singapore – countries in the western pacific – experienced subsequent waves of epidemic activity that exhibited different epidemiological patterns to earlier waves. the first wave in australia predominantly featured cases acquired overseas or their close contacts, whereas the second wave was amplified in aged-care and health-care setting outbreaks that led to community transmission.9 singapore’s initial epidemic was characterized by outbreaks in migrant workers residing in dormitories, with low-level community transmission. in late 2021, singapore experienced an epidemic wave of the delta variant with widespread community transmission.10 in both settings, culturally and wpsar vol 13, no 1, 2022 | doi: 10.5365/wpsar.2022.13.1.873https://ojs.wpro.who.int/ 3 ffx studies for covid-19marcato et al 5. pung r, park m, cook ar, lee vj. age-related risk of household transmission of covid-19 in singapore. influenza other respir viruses. 2021;15(2):206–8. doi:10.1111/irv.12809 pmid:32990399 6. wu j, huang y, tu c, bi c, chen z, luo l, et al. household transmission of sars-cov-2, zhuhai, china, 2020. clin infect dis. 2020;71(16):2099–108. doi:10.1093/cid/ciaa557 pmid:32392331 7. boddington nl, charlett a, elgohari s, byers c, coughlan l, vilaplana tg, et al. epidemiological and clinical characteristics of early covid-19 cases, united kingdom of great britain and northern ireland. bull world health organ. 2021;99(3):178–89. doi:10.2471/blt.20.265603 pmid:33716340 8. tracking sars-cov-2 variants. geneva: world health organization; 2021. available from: https://www.who.int/en/activities/trackingsars-cov-2-variants/, accessed 12 october 2021. 9. covid-19 national incident room surveillance team. covid-19, australia: epidemiology report 23 (fortnightly reporting period ending 16 august 2020). commun dis intell (2018), 2020;44. doi:10.33321/cdi.2020.44.70 pmid:32847492 10. covid-19 situation report. singapore: ministry of health; 2021. available from: https://covidsitrep.moh.gov.sg/, accessed 26 october 2021. 11. crooks k, massey pd, taylor k, miller a, campbell s, andrews r, et al. planning for and responding to pandemic influenza emergencies: it’s time to listen to, prioritize and privilege aboriginal perspectives. western pac surveill response j. 2018;9(5 suppl 1):5−7. doi:10.5365/wpsar.2018.9.5.005 pmid:31832246 12. flint sm, davis js, su jy, oliver-landry ep, rogers ba, goldstein a, et al. disproportionate impact of pandemic (h1n1) 2009 influenza on indigenous people in the top end of australia’s northern territory. med j aust. 2010;192(10):617–22. doi:10.5694/j.1326-5377.2010. tb03654.x pmid:20477746 13. boggild ak, yuan l, low de, mcgeer aj. the impact of influenza on the canadian first nations. can j public health. 2011;102(5):345– 8. doi:10.1007/bf03404174 pmid:22032099 14. verrall a, norton k, rooker s, dee s, olsen l, tan ce, et al. hospitalizations for pandemic (h1n1) 2009 among maori and pacific islanders, new zealand. emerg infect dis. 2010;16(1):100–2. doi:10.3201/eid1601.090994 pmid:20031050 15. centers for disease control and prevention (cdc). deaths related to 2009 pandemic influenza a (h1n1) among american indian/ alaska natives 12 states, 2009. mmwr morb mortal wkly rep. 2009;58(48):1341–4. pmid:20010508 pandemic-ready, flexible systems are paramount to support an equitable, proportionate and informed emergency public health response. conflicts of interest all authors declare no conflicts of interest. ethics statement ethics approval was not required for this perspective piece. funding all work was undertaken as part of the authors’ regular employment. references 1. global research on coronavirus disease (covid-19). geneva: world health organization; 2021. available from: https://www.who.int/ emergencies/diseases/novel-coronavirus-2019/global-research-onnovel-coronavirus-2019-ncov, accessed 12 october 2021. 2. van kerkhove md, broberg e, engelhardt og, wood j, nicoll a; consise steering committee. the consortium for the standardization of influenza seroepidemiology (consise): a global partnership to standardize influenza seroepidemiology and develop influenza investigation protocols to inform public health policy. influenza other respir viruses. 2013;7(3):231–4. doi:10.1111/irv.12068 pmid:23280042 3. coronavirus disease (covid-19) technical guidance: the unity studies: early investigation protocols. geneva: world health organization; 2021. available from: https://www.who.int/emergencies/ diseases/novel-coronavirus-2019/technical-guidance/early-investigations, accessed 19 february 2021. 4. bergeri i, lewis hc, subissi l, nardone a, valenciano m, cheng b, et al. early epidemiological investigations: world health organization unity protocols provide a standardized and timely international investigation framework during the covid-19 pandemic. influenza other respir viruses. 2022;16(1):7–13. doi:10.1111/ irv.12915 pmid:34611986 learning from recent outbreaks to strengthen risk communication capacity for the next influenza pandemic in the western pacific region perspective lauren j o’connor,a lisa petersa and rose aynsleyb a who regional office for the western pacific, division of health security and emergencies. b who regional office for the western pacific, division of pacific technical support. correspondence to lauren o’connor (email:oconnorl@who.int). to cite this article: o’connor lj, peters l, aynsley r. learning from recent outbreaks to strengthen risk communication capacity for the next influenza pandemic in the western pacific region. western pac surveill response j. 2019 feb;9(5). doi:10.5365/wpsar.2018.9.5.013 when an influenza pandemic swept the globe in 1918, it was nicknamed the “spanish flu” despite evidence of circulation in other countries. this was because the spanish press were free to publish stories about the outbreak that peers in neighbouring countries were not due to wartime censors.1 other governments hid negative news about the pandemic and over-reassured the public. attempts to prevent panic backfired, and the resulting breakdown in trust “threatened to break the society apart”.1 the 1918 pandemic illustrates the consequences of failing to transparently and effectively communicate risks to the public during a public health event. this article discusses the lessons learnt in risk communication during the response to recent outbreaks in the world health organization’s western pacific region. these lessons can inform preparedness for pandemic influenza and other public health threats. risk communication is defined as “the real-time exchange of information, advice and opinions between experts, community leaders, or officials and the people who are at risk”.2 the outbreak of severe acute respiratory syndrome (sars) in china in 2002 in particular highlighted the importance of open risk communication – a lesson that was reiterated once more during the outbreak of middle east respiratory syndrome in the republic of korea in 2015. effective risk communication during a public health emergency can be difficult, especially in the early stages when many of the facts may be uncertain. health authorities can be reluctant to proactively communicate as they are apprehensive of saying the wrong thing, creating panic or looking like they do not have all the answers. however, delaying communication can result in the public listening to rumours or relying on less accurate sources of information,3 or can lead to the very panic authorities were trying to prevent.4 done correctly, however, risk communication can calm fears, facilitate the acceptance of containment measures, curtail the spread of unhelpful rumours and engage affected communities in control measures. in the wake of sars, risk communication was included as a core capacity required of member states under the international health regulations (2005).5 guidance on how to implement and build risk communication capacity has also been part of the asia pacific strategy for emerging diseases (apsed) since the first 2005 edition.6 it has long been recognized that national risk communication plans, supported by trained risk communication personnel, adequate financial allocations, clear internal procedures and mechanisms for coordination, are essential for effective risk communication and should be established before the onset of a public health emergency. advance preparation, including building an understanding of prevailing cultural practices and establishing relationships with community influencers, is central to ensuring that risk communication efforts are tailored to the local context. the 2009 influenza a(h1n1) pandemic highlighted some further lessons that apply specifically to influenza and need to be considered ahead of the next influenza pandemic. for example, perceptions of the severity of the disease varied widely. many people confused it with seasonal influenza and therefore thought the risk to their health was low, while others expressed a high level of concern about the virus.7 some people also had immense distrust in the vaccine, because of perceived conflicts of interest between pharmaceutical companies and health authorities.7 research published following the h1n1 pandemic indicated that countries should be prepared to address rumours and misconceptions about vaccine safety, to carefully communicate the severity of disease and to enlist the support of trusted members of the community.7 the role of social media also needed to be considered.8 after the 2009 pandemic, it was recognized that risk communication approaches could be tested and honed during seasonal influenza outbreaks.9 ten years after sars, china proactively informed the public and international community about human cases of avian influenza (h7n9), demonstrating the benefit of timely and transparent risk communication.10 chinese focus group participants were reassured by this increase in transparency, with one participant stating, “i am quite positive that our government absolutely has the capability to control this disease”.11 another study found that discussion of h7n9 on sina weibo, a popular chinese social media platform, dropped following several formal announcements, potentially indicating reduced public concern about the outbreak.10 while social media was used to listen to the public following the discovery of human cases of h7n9, the response to an outbreak of influenza-associated severe acute respiratory infections (sari) in fiji in 2016 showed that more traditional means of communication still have a place in effective risk communication. health authorities worked with religious leaders, women’s groups and youth networks to engage vulnerable groups, particularly pregnant women, encouraging vaccination and adoption of protective behaviours.12,13 for communities in remote areas and outer islands, where communication is often limited, authorities shared health messages via radio, reaching an estimated 90% of the population.14 unfortunately, while much progress has been achieved in risk communication under apsed, other core public health capacities for pandemic preparedness and response continue to be prioritized over risk communication. results from joint external evaluations of ihr core capacities in the western pacific region show that countries score far higher on traditional public health capacities, such as surveillance and laboratory networks, than they do on risk communication.15 countries are encouraged to learn from recent outbreaks and emergencies and to invest in their internal capacity for risk communication as per the asia pacific strategy for emerging diseases and public health emergencies (apsed iii).16 this includes integrating risk communication into outbreak preparedness, planning and response, communicating quickly and transparently, using a mixture of channels to best reach their target audience (including social media, where appropriate) and actively engaging communities in the response. the vision laid out in apsed iii is one where risk communication moves from being purely an art to also a science, as risk communication becomes more professionalized and evidence-based. risk communication professionals should come to be recognized as social scientists conducting work that is as important to the success of emergency preparedness and response as the work of epidemiologists, laboratory experts and other public health personnel. in prioritizing and strengthening risk communication, countries will be better placed to limit the health, social and economic impacts of the next influenza pandemic. references barry j. the great influenza, the epic story of the deadliest plague in history. new york, ny: viking books; 2004. communicating risk in public health emergencies: a who guideline for emergency risk communication (erc) policy and practice. geneva: world health organization; 2017 (http://apps.who.int/iris/bitstream/handle/10665/259807/9789241550208-eng.pdf?sequence=2, accessed 23 march 2018). fung ich, tse zth, chan bsb, fu kw. middle east respiratory syndrome in the republic of korea: transparency and communication are key. west pac surveill response. 2015 aug 7;6(3):1–2. doi:10.5365/wpsar.2015.6.2.011 pmid:26668758 huang y. the sars epidemic and its aftermath in china: a political perspective. in: institute of medicine; knobler s, mahmoud a, lemon s, et al., editors. learning from sars: preparing for the next disease outbreak: workshop summary. washington, dc: national academies press; 2004 (https://www.ncbi.nlm.nih.gov/books/nbk92479/, accessed 2 april 2018). international health regulations (2005). third edition. geneva: world health organization; 2016 (http://apps.who.int/iris/bitstream/handle/10665/246107/9789241580496-eng.pdf;jsessionid=911704af9cb220dff2729886edf9feea?sequence=1). asia pacific strategy for emerging diseases (2005). manila: who regional office for the western pacific; 2005 (http://iris.wpro.who.int/bitstream/handle/10665.1/14080/9290612096-eng.pdf). barrelet c, bourrier m, burton-jeangros c, schindler m. unresolved issues in risk communication research: the case of the h1n1 pandemic (2009-2011). influenza other respir viruses. 2013 sep;7 suppl 2:114–9. doi:10.1111/irv.12090 pmid:24034495 itzwerth r, moa a, macintyre cr. australia’s influenza pandemic preparedness plans: an analysis. j public health policy. 2018 feb;39(1):111–24. doi:10.1057/s41271-017-0109-5 pmid:29176589 2009 h1n1 influenza improvement plan. washington, dc: us department of health and human services; 2012 (https://www.phe.gov/preparedness/mcm/h1n1-retrospective/documents/2009-h1n1-improvementplan.pdf, accessed 26 march 2018). vong s, o’leary m, feng z. early response to the emergence of influenza a(h7n9) virus in humans in china: the central role of prompt information sharing and public communication. bull world health organ. 2014 apr 1;92(4):303–8. doi:10.2471/blt.13.125989 pmid:24700999 li r, xie r, yang c, frost m. perceptions on the risk communication strategy during the 2013 avian influenza a/h7n9 outbreak in humans in china: a focus group study. west pac surveill response. 2016 jul 11;7(3):21–8. doi:10.5365/wpsar.2016.7.1.005 pmid:27757257 collins j, biaukula v, faktaufon d, flint j, fullman s, jalava k, et al. an outbreak investigation of paediatric severe acute respiratory infections requiring admission to intensive care units fiji, may 2016. west pac surveill response. 2018 jun 21;9(2):4–8. doi:10.5365/wpsar.2017.8.4.009 pmid:30057852 analysis fahs. suva: fiji ministry of health and medical services; 2016 (https://www.aidsdatahub.org/sites/default/files/fiji_adolescent_health_situational_analysis_2016.pdf, accessed 29 october 2018). health and nutrition cluster bulletin #8. suva: fiji ministry of health; 2016 (http://www.health.gov.fj/wp-content/uploads/2016/03/20160613_hnc_bulletin8_final.pdf). who western pacific region: jee mission reports. geneva: world health organization; 2018 (http://www.who.int/ihr/procedures/mission-reports-western-pacific/, accessed 2 november 2018). asia pacific strategy for emerging diseases and public health emergencies (apsed iii). manila: who regional office for the western pacific; 2017 (http://iris.wpro.who.int/bitstream/handle/10665.1/13654/9789290618171-eng.pdf, accessed 5 november 2018). https://ojs.wpro.who.int/ 1wpsar vol 12, no 3, 2021 | doi: 10.5365/wpsar.2021.12.3.831 original research a novel coronavirus that causes severe respiratory symptoms was first detected in patients in wuhan city, hubei province, china in december 2019. the world health organization declared the outbreak of coronavirus disease 2019 (covid-19) caused by severe acute respiratory syndrome coronavirus 2 (sars-cov-2)1 to be a public health emergency of international concern on 30 january 2020, and declared a pandemic on 11 march 2020. as of 22 august 2021, the philippines’ department of health (doh) had tallied 1 839 635 total cases, 125 900 of which were active cases; there have been 1 681 925 recoveries and 31 810 deaths.2 at that date, the virus had infected more than 209.9 million people and claimed more than 4.4 million lives worldwide.3 sars-cov-2 infection can cause a range of symptoms, from a common cold-like illness presenting with cough, dyspnoea, dysgeusia and fever to severe respiratory symptoms causing shock and multiorgan failure.1 cases in the philippines are classified as mild, moderate, severe or critical.4 according to urwin, kandola and graziado (2020),5 a community-friendly prognostic clinical risk prediction score for covid-19 mortality, severity and complications and triage recommendations can be determined from current signs and symptoms, comorbidities, medical history and demographics. in that study, the demographic factors of risk included age, sex, country and partial postcode. predictive modelling could greatly help lowand middle-income countries such as the philippines to address the covid-19 pandemic by increasing the accuracy of diagnosis and prognosis of patients.6,7 this may help in determining the outcomes and factors indicative of outcomes for patients with covid-19. predictive modelling may also aid policy-makers in determining which strategies are more effective, so that allocation of limited resources can be targeted to possible target populations more efficiently and cost-effectively, especially during a a san beda university college of medicine, manila, philippines. b school of medicine and public health, ateneo de manila university, pasig city, philippines. published: 14 september 2021 doi: 10.5365/wpsar.2021.12.3.831 objective: the aim of this study was to create a decision tree model with machine learning to predict the outcomes of covid-19 cases from data publicly available in the philippine department of health (doh) covid data drop. methods: the study design was a cross-sectional records review of the doh covid data drop for 25 august 2020. resolved cases that had either recovered or died were used as the final data set. machine learning processes were used to generate, train and validate a decision tree model. results: a list of 132 939 resolved covid-19 cases was used. the notification rates and case fatality rates were higher among males (145.67 per 100 000 and 2.46%, respectively). most covid-19 cases were clustered among people of working age, and older cases had higher case fatality rates. the majority of cases were from the national capital region (590.20 per 100 000), and the highest case fatality rate (5.83%) was observed in region vii. the decision tree model prioritized age and history of hospital admission as predictors of mortality. the model had high accuracy (81.42%), sensitivity (81.65%), specificity (81.41%) and area under the curve (0.876) but a poor f-score (16.74%). discussion: the model predicted higher case fatality rates among older people. for cases aged >51 years, a history of hospital admission increased the probability of covid-19-related death. we recommend that more comprehensive primary covid-19 data sets be used to create more robust prognostic models. using machine learning to create a decision tree model to predict outcomes of covid-19 cases in the philippines julius r. migriño, jra,b and ani regina u. batangana correspondence to julius r. migriño, jr (email: jrmjrmd-1@yahoo.com) wpsar vol 12, no 3, 2021 | doi: 10.5365/wpsar.2021.12.3.831 https://ojs.wpro.who.int/2 migriño et aldecision tree for covid-19 cases in the philippines least one positive reverse transcription-polymerase chain reaction test of a respiratory swab. the raw data set was filtered to include only resolved cases (i.e. cases with an entry under the attribute removaltype), as unlabelled cases are still active. removaltype was defined as the outcome for the patient and was coded as either “recovered” or “died.” descriptive statistics, i.e. means, standard deviations, case fatality rates (cfr), t tests (for continuous variables) and pearson’s χ2 tests (for nominal variables) were generated with statacorp 2013 (stata statistical software, release 13; college station, tx). we conducted an exploratory analysis to screen cases and attributes in the raw data set. the attribute agegroup was recoded to reclassify age (age of patient, in years) into nine ranges according to the classification of the united states centers for disease and control and prevention.20 pregnanttab was defined as a binary variable representing whether a patient was pregnant at any time during covid-19 infection, with male cases coded as missing values. missing values for citymunres (patient’s city of residence) and provres (patient’s province of residence) were recoded as “repatriate” for all cases with regionres (patient’s region of residence) = “repatriate”. the data set was then filtered to select only cases with no other missing values to generate the final data set. details of the data pre-processing can be found in supplementary information a. attribute selection, random undersampling, hyperparameter optimizations, model generation, crossvalidation and performance calculations were done in rapidminer studio 9.7.002 (rev. db1bb6, platform: win64) (see supplementary information c). the attribute removaltype was labelled as the outcome in the data set. attributes were selected with feature weights operators (weightbyginiindex, weightbyinformationgain, weightbyinformationgainratio) to determine those appropriate for model generation. the subprocess optimizeparameters(grid) was used to perform grid optimization of the hyperparameters for the decision tree operator decisiontree and the threshold operator createthreshold. the subprocess ran a fivefold crossvalidation operator to train and validate the data set with the decision tree model and the optimized decisiontree and createthreshold hyperparameters generated for each fold. random undersampling was done only on pandemic.6 predictive modelling may also help to inform patients about the possible course of their illness and help both patients and health-care workers to draw up diagnostic and therapeutic plans.8 machine learning and artificial intelligence have been used to automate the detection of patterns in large data sets, especially in dealing with the massive amounts of data generated during a global event such as the current pandemic. decision trees, a specific type of machine learning, are based on covariates to create a model for predicting outcomes.9 currently, artificial intelligence, including decision tree modelling, is being used in the covid-19 pandemic for early detection and diagnosis, monitoring treatment, tracing contacts, developing drugs and vaccines, predicting cases and fatalities and even identifying the most vulnerable groups.10–13 machine learning has been used to identify demographic and clinical predictors of disease progression, which include age, sex, body temperature, associated signs and symptoms, minimum oxygen saturation, computed tomography scan features, c-reactive protein and lactic dehydrogenase levels and lymphocyte counts.12,14 in the philippines, studies on covid-19 modelling have been limited to compartmental models, such as “susceptible–infectious–recovered/removed” or “susceptible–exposed–infectious–recovered/removed” models,15,16 usually for tracking epidemiological trajectories. other types of models being used in the philippines include regression analysis models to estimate case fatality rates17 and to determine socioeconomic indicators of the number of cases.18 the aim of this study was to create a decision tree model with machine learning to predict outcomes (i.e. recovery or death) of covid-19 cases based on publicly available data from the doh covid data drop. methods we used the publicly available doh covid data drop database for 25 august 2020.19 this database is extracted from the covid-19 information system by the doh epidemiology bureau and is updated daily. the data are obtained from paper-based case investigation forms from all the regional epidemiology surveillance units in the country. the raw data set comprised 197 164 cases, which represented all reported covid-19 cases with at cfr (%)= number of reported covid-19 deaths number of reported covid-19 cases x 100 wpsar vol 12, no 3, 2021 | doi: 10.5365/wpsar.2021.12.3.831https://ojs.wpro.who.int/ 3 decision tree for covid-19 cases in the philippinesmigriño et al disaggregation of male and female cases showed similar patterns of cases by age group (table 2). the highest notification rates of covid-19 cases were from the national capital region, followed by regions vii and iv-a (590.20, 285.70, 121.08 per 100 000, respectively). the highest cfr was observed in region vii (5.83%), followed by regions i (4.09%) and ix (4.00%). the lowest cfr was observed among repatriates (0.23%), followed by regions viii (0.61%) and ii (0.62%). although the national capital region and region iv-a had the most cases, they had low case fatality rates (1.88% and 1.45%, respectively) (table 1). outcomes from machine learning models of the three feature weighting operators, only the attributes age and admitted were included in the final model. the decision tree model was trained and cross-validated with the following optimized hyperparameters: criterion = information_gain, maximal_depth = 8, minimal_gain = 0.0, minimal_leaf_size = 10, minimal_size_for_split = 100. the comparator naïve bayes model used the same optimized hyperparameters in model training and crossvalidation and had a higher auc (0.881 ± 0.006), accuracy (81.68% ± 0.05%), f-score (16.75% ± 0.33%) and specificity (81.71% ± 0.52%) and a better receiver operating characteristic (roc) curve. the decision tree model had greater sensitivity (81.65% ± 1.64%) (table 3; fig. 1). the decision tree had seven levels, with each node splitting into two branches or leaves (fig. 2; supplementary information b5 provides other details of the decision tree, including the actual number of cases and outcomes per leaf). the primary (root) node was age, with the split criterion being a cut-off of 51.5 years, based on the average of the split criterion of the values age = 51 and age = 52. the attribute admitted split the lower branches further, with further splits according to age. the majority of all cases in the model (53.54%) were <51.5 years and had no history of hospital admission, and most recovered (85.46%). similarly, the majority of cases aged 51.5–57.5 years with no history of hospital admission recovered (55.14%). there were increasing proportions of deaths with increasing age, with the highest death rates among those >63.5 years (81.98%). a high proportion (93.33%) of people aged >51.5 years with a history of hospital admission died. the training data set for each fold in the cross-validation operator, with the sample operator to (i) select all cases with removaltype = died and (ii) randomly select cases with removaltype = recovered using stratified sampling to achieve a 1:1 recovered:died ratio. stratified sampling generated two subsets from the modelling data set that ensured similar removaltype case distribution (i.e. recovered and died) between the two subsets by simple random sampling. all cases in the testing data set were used to validate the model for each fold in the cross-validation. the decision tree model generated by the cross-validation training data set was also extracted. performance metrics such as area under the curve (auc), accuracy, f-score, sensitivity and specificity were extracted from the cross-validation with the positive class set as removaltype = died. similar cross-validation operators were used to train and validate a naïve bayes model for comparison. details of the model generation can be found in supplementary information b. the study adhered to the tripod checklist for prediction model development.21 ethics statement the study was reviewed and approved on 19 august 2020 by the san beda university research ethics board under the study protocol code sbu-reb 2020–017. the study adhered to the tripod checklist for prediction model development. results description of cases the final data set was a list of 132 939 resolved covid-19 cases (98.16% of all resolved cases and 67.43% of total reported cases from the raw data set). of the reported cases, 97.7% recovered and 2.3% died. there were more covid-19 cases among males than females (145.67 per 100 000 vs 118.10 per 100 000; p < 0.001). cfrs were also higher among males than females (2.46% vs 1.97%; p < 0.001). the most resolved cases were among people aged 18–29 years. cases aged ≥85 years had the highest cfr (22.57%), followed by those aged 75–84 years (17.99%) and 65–74 years (12.01%). the age group 18–29 years had the lowest cfr, at 0.27% (table 1). wpsar vol 12, no 3, 2021 | doi: 10.5365/wpsar.2021.12.3.831 https://ojs.wpro.who.int/4 migriño et aldecision tree for covid-19 cases in the philippines table 1. demographic characteristics of resolved cases (recovered or died) from the philippines covid data drop from 25 august 2020 recovered died cfr (%) p < 0.001 sex, n = 135 434 male 73 919 1863 2.46 female 58 477 1175 1.97 age, n = 133 097 < 0.001 mean age (years) 38.05 (± 15.93) 61.33 (± 16.73) age group (years), n = 133 097 < 0.001 0–4 1830 32 1.72 5–17 5563 26 0.47 18–29 37 080 100 0.27 30–39 32 632 147 0.45 40–49 22 315 294 1.30 50–64 21 907 995 4.34 65–74 6148 839 12.01 75–84 2092 459 17.99 ≥ 85 494 144 22.57 region, n = 131 614 < 0.001 barmm 455 11 2.36 car 370 8 2.12 caraga 297 4 1.33 ncr 74 572 1430 1.88 repatriate 6586 15 0.23 region i: ilocos region 609 26 4.09 region ii: cagayan valley 483 3 0.62 region iii: central luzon 3850 81 2.06 region iv-a: calabarzon 17 201 253 1.45 region iv-b: mimaropa 396 7 1.74 region v: bicol region 773 22 2.77 region vi: western visayas 1865 48 2.51 region vii: central visayas 16 256 1006 5.83 region viii: eastern visayas 1302 8 0.61 region ix: zamboanga peninsula 889 37 4.00 region x: northern mindanao 766 16 2.05 region xi: davao region 1480 56 3.65 region xii: soccsksargen 429 4 0.92 barmm: bangsamoro autonomous region in muslim mindanao; car: cordillera administrative region; caraga: caraga administrative region; ncr: national capital region; calabarzon: batangas, cavite, laguna, quezon, rizal and lucena; mimaropa: mindoro, marinduque, romblon and palawan; soccsksargen: south cotabato, cotabato, sultan kudarat, sarangani and general santos. wpsar vol 12, no 3, 2021 | doi: 10.5365/wpsar.2021.12.3.831https://ojs.wpro.who.int/ 5 decision tree for covid-19 cases in the philippinesmigriño et al had noticeably higher mortality rates, regardless of hospital admission status. these findings are consistent with the current international literature20,30–32 as well as locally reported data.2 the age cut-off of 51.5 years determined in the decision tree model was, however, lower than the current age cut-off used in most philippine medical4 or policy guidelines, suggesting that age cut-offs (both lower and upper bounds) for guidelines should be re-evaluated continually. the youngest age group in this study (0–17 years old) had higher case fatality rates than the baseline (18–29 years old), which was consistent even for cases <19 years of age with a history of hospital admission, who had a high death rate. this finding is inconsistent with the available literature but may be due to the relative paucity of confirmed cases and studies in younger covid-19 cases. alternatively, it may be due to the fact that age-differentiated studies have been conducted with data from developed countries, such as china, england and wales, france, the republic of korea and spain,30,33 and may not be comparable to the situation in the philippines. a history of hospital admission was another strong predictor of mortality from covid-19, especially in cases discussion using a decision tree model, we generated a simple seven-level, multinodal decision tree to predict covid19-related outcomes of reported cases in the philippines on the basis of the attributes of age and hospital admission. tree-based methods in the classification and regression tree paradigm are increasingly used and “have become one of the most flexible, intuitive, and powerful data analytic tools for exploring complex data structures.”22 modern programming software and applications have enabled the use of machine learning algorithms such as decision trees to process large sets of data23,24 and are widely used in health care, including as prediction models.9,25–27 decision trees are also easy to understand and interpret,13,28 which is useful for both health workers and policy-makers, and are flexible enough to handle non-parametric class densities such as data from covid-19 databases.29 our decision tree model indicated age as the main predictor of clinical outcomes for covid-19. in both the descriptive analysis and the decision tree model, younger cases had higher recovery rates, while older age groups table 2. resolved cases (recovered or died) from the philippines covid data drop from 25 august 2020 by age group and sex (n = 133 097) a cfr ratio is computed as a highest values for each metric across all models cfr males cfr females age group (years) males (n = 74 395) females (n = 58 702) cfr ratioa recovered died cfr (%) recovered died cfr (%) 0–4 978 18 1.81 852 14 1.62 1.12 5–17 2848 12 0.42 2715 14 0.51 0.82 18–29 19 967 61 0.30 17 113 39 0.23 1.30 30–39 18 995 97 0.51 13 637 50 0.37 1.38 40–49 13 397 191 1.41 8918 103 1.14 1.24 50–64 12 001 647 5.12 9906 348 3.39 1.51 65–74 3157 506 13.81 2991 333 10.02 1.38 75–84 1012 266 20.81 1080 193 15.16 1.37 ≥ 85 178 64 26.45 316 80 20.20 1.31 table 3. performance metrics for the two machine learning models: decision tree and naïve bayes using the modelling data set and optimized hyperparameters model auc accuracy f-score sensitivity specificity decision tree 0.876 ± 0.010 81.42% ± 1.01% 16.74% ± 0.55% 81.65%a ± 1.64% 81.41% ± 1.07% naïve bayes 0.881a ± 0.006 81.68%a ± 0.05% 16.75%a ± 0.33% 80.63% ± 1.17% 81.71%a ± 0.52% wpsar vol 12, no 3, 2021 | doi: 10.5365/wpsar.2021.12.3.831 https://ojs.wpro.who.int/6 migriño et aldecision tree for covid-19 cases in the philippines fig. 1. receiver operating characteristic (roc) curves for the two machine learning models: decision tree and naïve bayesa fig. 2. decision tree for predicted outcomes of resolved cases (recovered or died) from the philippines covid data drop from 25 august 2020a a the roc curve plots a model’s sensitivity, or true positive rate, versus its false positive rate (one minus the specificity or true negative rate) as its discrimination threshold is varied. generally, the closer the roc curve (red curve) is to the top left corner of the graph, the better the model. the shaded regions represent the standard deviations. a relevant attributes identified by the process are shown inside the branches. the predominant outcome per leaf node is identified (either recovered or died), with the coloured bars below illustrating horizontal stacked bars of the predominant outcome per leaf (recovered=blue, died=red). the width of the bars represents the relative number of cases in each leaf as compared with the total cases in the modelling dataset, while the thickness of each arrow illustrates the relative number of cases on each branch as compared with the total cases in the modelling dataset. decision tree model naïve bayes model wpsar vol 12, no 3, 2021 | doi: 10.5365/wpsar.2021.12.3.831https://ojs.wpro.who.int/ 7 decision tree for covid-19 cases in the philippinesmigriño et al were therefore not included in our model. furthermore, the doh covid data drop reported multiple instances of duplicate and missing entries19 on different dates. additionally, a potentially relevant attribute, healthstatus (defined as “asymptomatic”, “mild”, “severe”, “critical”, “recovered” or “died”), was not included in the model, as its values change constantly, with no time stamp. we suggest that future studies use primary covid-19 data sets that include these parameters for more robust prognosis modelling, such as case investigation forms from the doh epidemiology bureau or from hospital records (e.g. philhealth claim form 4). the model generally had high-performance metrics: auc, accuracy, sensitivity and specificity were reasonably high; however, its calculated f-score was low due to poor model precision. in classification trees for disease diagnostics and prognostics, high sensitivity is preferred to accuracy,25 especially in inherently imbalanced data sets such as covid-19 prognosis databases. we tried to control for this imbalance by undersampling, which is more resistant to overestimation of predictive accuracy than oversampling techniques.36,37 other model limitations include the inherent propensity of decision trees for “over-fitting”, which often occurs in highly complex models for relatively simple data, which often capture too much noise from the data set.25,38 we tried to reduce over-fitting with the following strategies: (i) conducting exploratory data set analysis to remove ambiguous, highly correlated or incompletely filled attributes; (ii) enabling pre-pruning and pruning during model training to limit the complexity of the model; and (iii) running decision tree grid optimization to determine which hyperparameter values would net the highest auc. another limitation of the model is sampling bias, in which active cases are excluded from the analysis. this limitation is related to the cross-sectional design of the study and the continuing evolution of covid-19 in the philippines. comparable performance metrics in our study indicate that other classification models, such as naïve bayes, random forest or deep learning, might be considered for future prognostic models. in conclusion, our study showed that increasing age and history of hospital admission are important predictors of covid-19 prognosis, consistent with the current literature. we were able to generate a sensitive, specific decision tree model with a high auc and with age and admission as the main predictors of covid-19 prognosis using a publicly available data set. we recom>51 years of age. rationally, this is to be expected, as current national guidelines for hospitalization of covid-19 patients are for those risk-stratified as moderate, severe or critical.4 our study affirms the use of the current guidelines in the philippine setting. although sex was not a predictor in the decision tree model, males had a statistically significantly higher cfr fatality rate than females in the descriptive analysis. this difference in the adult population is consistent with that found in an international study by bhopal and bhopal using pooled data from multiple countries, with higher male:female cfrs for age groups ≥40 years (range: 1.65–2.6).33 sex differentials in covid-19 mortality have been extensively documented in multiple studies,32–34 and our study confirmed these findings in the philippine setting. proposed mechanisms for a sex differential include the fact that males generally have more pre-existing comorbidities like hypertension, cardiovascular disease and chronic obstructive pulmonary disease; poorer health behaviours (e.g. smoking and drinking alcoholic beverages); and even biological differences, such as specific receptor regulation, chromosomal variation and differences in interferon and hormone levels.34 despite differences in responses to covid-19, notification rates and cfrs in different geopolitical classifications (i.e. city/municipality, province or region) were not seen in the model. supplementary information b2 provides details of the feature weights for city/municipality, province and region as attributes. this result suggests that guidelines can be national, albeit with a subgroup-targeted approach, for clinical and public health management, primarily based on disease interaction with age and sex,1,33–35 and specifically focusing on the increased risk of males and older age groups for death from covid-19.33,35 our study has two types of limitations: the quality of the data set and model limitations. the quality of the data set was compromised mainly by availability and data points from the raw data set. as the doh covid data drop is publicly available, measures are in place to protect the privacy and confidentiality of sensitive patient information. thus, some useful information potentially associated with covid-19 mortality, such as presence of comorbidities, smoking history, travel history, exposure history to a confirmed covid-19 patient, clinical signs and symptoms of disease processes and poor laboratory findings,1,11 were not included in the initial data set and wpsar vol 12, no 3, 2021 | doi: 10.5365/wpsar.2021.12.3.831 https://ojs.wpro.who.int/8 migriño et aldecision tree for covid-19 cases in the philippines 8. moons kgm, royston p, vergouwe y, grobbee de, altman dg. prognosis and prognostic research: what, why, and how? bmj. 2009 feb 23;338;b375. doi:10.1136/bmj.b375 pmid:19237405 9. venkatasubramaniam a, wolfson j, mitchell n, barnes t, jaka m, french s. decision trees in epidemiological research. emerg themes epidemiol. 2017 sep 20;14(1):11. doi:10.1186/s12982017-0064-4 pmid:28943885 10. vaishya r, javaid m, khan ih, haleem a. artificial intelligence (ai) applications for covid-19 pandemic. diabetes metab syndr. 2020 jul aug;14(4):337–9. doi:10.1016/j.dsx.2020.04.012 pmid:32305024 11. debnath s, barnaby dp, coppa k, makhnevich a, kim ej, chatterjee s et al. northwell covid-19 research consortium. machine learning to assist clinical decision-making during the covid-19 pandemic. bioelectron med. 2020 jul 10;6(1):14. doi:10.1186/ s42234-020-00050-8 pmid:32665967 12. wynants l, van calster b, collins gs, riley rd, heinze g, schuit e et al. prediction models for diagnosis and prognosis of covid-19: systematic review and critical appraisal. bmj. 2020 apr 7;369:m1328. doi:10.1136/bmj.m1328 pmid:32265220 13. yan l, zhang ht, goncalves j, xiao y, wang m, guo y et al. an interpretable mortality prediction model for covid-19 patients. nat mach intell. 2020;2(5):283–8. doi:10.1038/s42256-020-0180-7 14. yadaw as, li yc, bose s, iyengar r, bunyavanich s, pandey g. clinical features of covid-19 mortality: development and validation of a clinical prediction model. lancet digit health. 2020 oct;2(10):e516–25. doi:10.1016/s2589-7500(20)30217-x pmid:32984797 15. abrigo mrm, uy j, haw nj, ulep vgt, francisco-abrigo k. projected disease transmission, health system requirements, and macroeconomic impacts of the coronavirus disease 2019 (covid-19) in the philippines. manila: philippine institute for development studies; 2020. available from: https://pidswebs.pids.gov.ph/cdn/publications/pidsdps2015.pdf, accessed 6 june 2021. 16. bongolan vp, minoza jma, de castro r, sevilleja je. age-stratified infection probabilities combined with a quarantine-modified model for covid-19 needs assessments: model development study. j med internet res. 2021 may 31;23(5):e19544. doi:10.2196/19544 17. medina ma. preliminary estimate of covid-19 case fatality rate in the philippines using linear regression analysis (report no.: id 3569248). rochester (ny): social science research network; 2020. available from: https://papers.ssrn.com/sol3/papers. cfm?abstract_id=3569248, accessed 10 june 2020. 18. alipio m. do socio-economic indicators associate with covid-2019 cases? findings from a philippine study. germany: university library of munich; 2020. available from: https://ideas.repec.org/p/ pra/mprapa/99583.html, accessed 10 june 2020. 19. department of health covid data drop. manila: department of health; 2020. available from: https://drive.google.com/drive/folder s/10vkiua8x7ts2jkibhszk1gmwxfm-eozp, accessed 30 august 2020. 20. covid-19 hospitalization and death by age. coronavirus disease 2019 (covid-19). atlanta (ga): centers for disease control and prevention; 2020. available from: https://www.cdc.gov/ coronavirus/2019-ncov/covid-data/investigations-discovery/hospitalization-death-by-age.html, accessed 28 september 2020. 21. collins g, reitsma j, altman d, moons k. transparent reporting of a multivariable prediction model for individual prognosis or diagnosis (tripod): the tripod statement. oxford: equator network; 2015. available from: https://www.equator-network.org/reportingguidelines/tripod-statement/, accessed 25 may 2020. mend adaptation of our model with more comprehensive primary covid-19 data sets to create robust covid-19 prognostic models that could contribute to a review of clinical and public health guidelines. acknowledgements we would like to acknowledge the following people who contributed to the study: tm for overall support and sg and ms of rapidminer community for methodology guidance. conflicts of interest the authors have no conflicts of interest to declare. funding a financial grant for the study was provided by the san beda university office of research and innovation under the study protocol code sbu-reb 2020-017. the manuscript was not developed through a field epidemiology training program (fetp) and/or during a wpsar scientific writing workshop. references 1. beeching n, fletcher t, fowler r. coronavirus disease 2019 (covid-19). in: bmj best practice [website]. london: bmj; 2020. available from: https://bestpractice.bmj.com/topics/en-gb/3000168, accessed 6 june 2021. 2. cases information. covid-19 tracker philippines. manila: department of health; 2020. available from: https://doh.gov.ph/covid19tracker, accessed 23 august 2021. 3. who coronavirus disease (covid-19) dashboard. geneva: world health organization; 2020. available from: https://covid19.who.int, accessed 23 august 2021. 4. interim guidance on the clinical management of adult patients with suspected or confirmed covid-19 infection (version 3.1). manila: philippine society for microbiology and infectious diseases, inc.; 2020. available from: https://www.psmid.org/interim-management-guidelines-for-covid-19-version-3-1/, accessed 30 october 2020. 5. urwin s, kandola g, graziadio s. what prognostic clinical risk prediction scores for covid-19 are currently available for use in the community setting? oxford: centre for evidence-based medicine; 2020. 6. why predictive modeling is critical in the fight against covid-19? (report no. 8). washington dc: pan american health organization; 2020. available from: https://iris.paho.org/bitstream/ handle/10665.2/52276/pahoeihiscovid-19200007_eng. pdf?sequence=5&isallowed=y, accessed 6 june 2021. 7. deo rc. machine learning in medicine. circulation. 2015 nov 17;132(20):1920–30. doi:10.1161/circulationaha.115.001593 pmid:26572668 https://doh.gov.ph/covid19tracker https://doh.gov.ph/covid19tracker wpsar vol 12, no 3, 2021 | doi: 10.5365/wpsar.2021.12.3.831https://ojs.wpro.who.int/ 9 decision tree for covid-19 cases in the philippinesmigriño et al 31. verity r, okell lc, dorigatti i, winskill p, whittaker c, imai n et al. estimates of the severity of coronavirus disease 2019: a model-based analysis. lancet infect dis. 2020 jun;20(6):669–77. doi:10.1016/s1473-3099(20)30243-7 pmid:32240634 32. jin jm, bai p, he w, wu f, liu xf, han dm et al. gender differences in patients with covid-19: focus on severity and mortality. front public health. 2020 apr 29;8:152. doi:10.3389/ fpubh.2020.00152 pmid:32411652 33. bhopal ss, bhopal r. sex differential in covid-19 mortality varies markedly by age. lancet. 2020 aug 22;396(10250):532–3. doi:10.1016/s0140-6736(20)31748-7 pmid:32798449 34. haitao t, vermunt jv, abeykoon j, ghamrawi r, gunaratne m, jayachandran m et al. covid-19 and sex differences: mechanisms and biomarkers. mayo clin proc. 2020 oct;95(10):2189–203. doi:10.1016/j.mayocp.2020.07.024 pmid:33012349 35. griffith dm, sharma g, holliday cs, enyia ok, valliere m, semlow ar et al. men and covid-19: a biopsychosocial approach to understanding sex differences in mortality and recommendations for practice and policy interventions. prev chronic dis. 2020 jul 16;17:e63. doi:10.5888/pcd17.200247 pmid:32678061 36. blagus r, lusa l. joint use of overand under-sampling techniques and cross-validation for the development and assessment of prediction models. bmc bioinformatics. 2015 nov 4;16(1):363. doi:10.1186/s12859-015-0784-9 pmid:26537827 37. santos ms, soares jp, abreu ph, araujo h, santos j. cross-validation for imbalanced datasets: avoiding overoptimistic and overfitting approaches [research frontier]. ieee comput intell mag. 2018;13(4):59–76. doi:10.1109/mci.2018.2866730 38. van calster b, mclernon dj, van smeden m, wynants l, steyerberg ew, bossuyt p et al. topic group ‘evaluating diagnostic tests and prediction models’ of the stratos initiative. calibration: the achilles heel of predictive analytics. bmc med. 2019 dec 16;17(1):230. doi:10.1186/s12916-019-1466-7 pmid:31842878 22. banerjee m, reynolds e, andersson hb, nallamothu bk. tree-based analysis. circ cardiovasc qual outcomes. 2019 may;12(5):e004879. doi:10.1161/circoutcomes.118.004879 pmid:31043064 23. sharma a. decision tree split methods | decision tree machine learning. gurgaon: analytics vidhya; 2020. available from: https:// www.analyticsvidhya.com/blog/2020/06/4-ways-split-decisiontree/, accessed 26 october 2020. 24. khanday amud, rabani st, khan qr, rouf n, mohi ud din m. machine learning based approaches for detecting covid-19 using clinical text data. int j inf technol. 2020 jun 30;12(3):1–9. doi:10.1007/s41870-020-00495-9 pmid:32838125 25. serrano l. grokking machine learning. meap edition (version 13). manning publications; 2021. 26. rajkomar a, dean j, kohane i. machine learning in medicine. n engl j med. 2019 apr 4;380(14):1347–58. doi:10.1056/nejmra1814259 pmid:30943338 27. sidey-gibbons jam, sidey-gibbons cj. machine learning in medicine: a practical introduction. bmc med res methodol. 2019 mar 19;19(1):64. doi:10.1186/s12874-019-0681-4 pmid:30890124 28. song yy, lu y. decision tree methods: applications for classification and prediction. shanghai arch psychiatry. 2015 apr 25;27(2):130– 5. pmid:26120265 29. sánchez-montañés m, rodríguez-belenguer p, serrano-lópez aj, soria-olivas e, alakhdar-mohmara y. machine learning for mortality analysis in patients with covid-19. int j environ res public health. 2020 nov 12;17(22):8386. doi:10.3390/ijerph17228386 pmid:33198392 30. liu y, mao b, liang s, yang j, lu h, chai y et al. association between ages and clinical characteristics and outcomes of coronavirus disease 2019. eur respir j. 2020;55(5):2001112. doi:10.1183/13993003.01112-2020 pmid:32312864 description of social contacts among student cases of pandemic influenza during the containment phase, melbourne, australia, 2009
original research
caroline van gemert,a,b emma s mcbryde,c isabel bergeri,a rachel sacks-davis,a,d hassan vally,e tim spelman,a brett suttonf and margaret hellarda,b
a burnet institute, melbourne, victoria, australia.
b department of epidemiology and preventative medicine, monash university, alfred hospital, commercial road, melbourne, victoria, australia.
c centre for biosecurity in tropical infectious diseases, james cook university.
d department of medicine, university of melbourne.
e school of psychology and public health, la trobe university, melbourne.
f victorian department of health and human services.
correspondence to caroline van gemert (email:caroline.vangemert@burnet.edu.au).
to cite this article:
van gemert g, mcbryde es, bergeri i, sacks-davis r, vally h, spelman t, et al. description of social contacts among student cases of pandemic influenza during the containment phase, melbourne, australia, 2009. western pac surveill response j. 2018 sep;9(5). doi:10.5365/wpsar.2018.9.5.003
abstract
introduction: students comprised the majority of early cases of influenza a(h1n1)pdm09 in melbourne, australia. students and school settings were targeted for public health interventions following the emergence of ph1n1. this study was conducted to describe changes in social contacts among the earliest confirmed student cases of ph1n1 in melbourne, australia, to inform future pandemic control policy and explore transmission model assumptions.
methods: a retrospective cross-sectional behavioural study of student cases with laboratory-confirmed ph1n1 between 28 april and 3 june 2009 was conducted in 2009. demographics, symptom onset dates and detailed information on regular and additional extracurricular activities were collected. summary measures for activities were calculated, including median group size and median number of close contacts and attendance during the students' exposure and infectious periods or during school closures. a multivariable model was used to assess associations between rates of participation in extracurricular activities and both school closures and students' infectious periods.
results: among 162 eligible cases, 99 students participated. students reported social contact in both curricular and extra-curricular activities. group size and total number of close contacts varied. while participation in activities decreased during the students' infectious periods and during school closures, social contact was common during periods when isolation was advised and during school closures.
discussion: this study demonstrates the potential central role of young people in pandemic disease transmission given the level of non-adherence to prevention and control measures. these finding have public health implications for both informing modelling estimates of future pandemics and targeting prevention and control strategies to young people.
introduction
initial reports of confirmed cases of pandemic influenza a(h1n1) 2009 (ph1n1) in australia and internationally suggested that students comprised the majority of early cases.1-7 this may have been due to numerous and prolonged contacts in classroom settings, heterogeneous mixing across age groups and both casual and sustained social contacts in non-school settings.8-12 consequently, students and school settings were targeted by a suite of public health interventions to contain community transmission during the immediate period following ph1n1 detection in melbourne, the capital city of the australian state of victoria (population >3.5 million). such interventions included school closures, use of antiviral treatment and masks, isolation of cases and quarantine of contacts.13,14
an important driver of infectious disease transmission is the contact pattern and subsequent transmission of infection between and within groups of individuals, which may differ among different age groups. however, there is a lack of data for which key parameters, such as the number and frequency of contacts, as well as mixing between people according to age, can be estimated.8,12,15 further, decision-making about implementing pandemic influenza management plans are generally guided by mathematical models that compare the potential impact of prevention and control measures such as school closures, provided there is adequate information on the effect of these interventions on contact and transmission patterns within and across groups involved in the intervention.12 in this study we collected empirical data to quantify social interactions of students and to describe changes in activity participation and social contacts following symptom onset and during school closures to inform future pandemic influenza policy and infectious disease transmission models assumptions.
methods
study design, recruitment and data collection
a retrospective cross-sectional behavioural survey was conducted. eligible cases were students notified with laboratory-confirmed ph1n1 between 28 april and 3 june 2009 who attended primary or secondary schools in melbourne, australia with 10 or more confirmed cases notified during the same period. this period corresponded to the "delay" (28 april to 21 may 2009) and "contain" (22 may to 3 june 2009) phases of the australian health management plan for pandemic influenza. during these phases, the emphasis was on active case-finding and slowing community transmission of pandemic influenza through prevention and control measures.13,16,17
cases were recruited by mail and telephone; up to five calls were attempted. interviews were conducted either face to face at the students' schools or households or by telephone between 18 november and 21 december 2009. data collected, described in detail previously,18 included demographic and case details, as well as specific information on social contacts between 11 may and 14 june 2009. this five-week period included all of the dates of symptom onset reported by the victorian department of health and human services and was sufficient to capture activities during cases' exposure and infectious periods.
participants retrospectively completed a health diary that included information about their illness; the date of symptom onset, symptoms and measures taken to reduce symptoms or prevent transmission; their activities; and group contact. written consent was obtained from each participant or their parent/guardian if the participant was younger than 18 years.
measures
students were asked about their regular extracurricular activities, defined as regularly scheduled activities in addition to school. these included university classes (in australia, high-achieving students can complete university studies alongside their final year of high school), part-time employment, sporting activities and religious groups. for each group or activity, students reported the number of social contacts (defined as the number of people in the group or activity), number of close contacts (defined as individuals within 1 metre of a case for more than 15 minutes) and the dates that the group or activity took place. students were also asked to describe additional extracurricular activities, such as social events, private classes (or example, one-on-one classes for music) or school social events.
from this, it was determined if students attended school or participated in extracurricular activities during their potential exposure period (defined as up to seven days before symptom onset), during their infectious period (defined as one day before symptom onset to seven days after symptom onset) or during the period of school closure (including weekends when school closures extended through a weekend).
data analysis
the mean number of groups and activities reported for each student, the median group or activity size and the number of close contacts per group or activity was calculated. the total number of close contacts per student was calculated by combining the number of unique close contacts at school, university, part-time employment, and sporting, religious and additional extracurricular activities for each individual.
a multivariable model using a generalized estimating equations regression was developed to assess associations between rates of participation in extracurricular activities and both school closures and the students' infectious periods. the model used a negative binomial family function, a log link and an exchangeable within-participant correlation structure. the model was adjusted for school and potential interaction between the effect of school closures and infectious period. statistical analyses were conducted using stata version 15 (statacorp, college station, texas, usa) and microsoft excel (microsoft corporation, redmond, wa, usa).
ethical approval
ethical approval was obtained from the alfred hospital ethics committee and australian national university ethics committee.
results
there were seven schools in victoria with more than 10 confirmed cases of ph1n1. the 162 case-patients from these schools were invited to participate; 99 (61%) were interviewed, 38 (24%) were not contactable and 25 (15%) refused or were not available to participate. students that participated in the study were similar in age structure (p = 0.62) and in the schools attended (p = 0.42) to non-participants.
among the 99 respondents, there were more females than males (57% females). half (49%) were in year 9 or year 10 (aged approximately 14–16 years) (table 1). the earliest date of symptom onset was 16 may 2009 (this case was notified on 31 may 2009) (fig. 1).
table 1. description of student cases of ph1n1 that were notified between 28 april 2009 and 3 june 2009 and participating in ph1n1 study, melbourne, australia
fig. 1. epidemic curve of the date of symptom onset for student cases of ph1n1 that were notified between 28 april 2009 and 3 june 2009 and participating in ph1n1 study, melbourne, australia
five of the seven schools closed in response to ph1n1, and the earliest date of school closure was 25 may 2009. the number of days that schools closed ranged from three to nine days (not including weekends).
students reported that they regularly attended or participated in sports (n = 62), religious activities (n = 20), part-time employment (n = 18) and university classes (n = 10, table 2). among students that reported part-time employment, the most common workplaces were shops or department stores (n = 6, 33%), followed by supermarkets (n = 4, 22%), fast-food restaurants (n = 4, 22%) and cafes (n = 2, 11%). among students that reported participating in sports (n = 62), the majority (n = 34, 55%) played in indoor settings while the rest played in outdoor settings (n = 27, 44%) or both (n = 1, 2%, data not presented in tables). the majority of students (n = 81, 81%) also reported additional extracurricular activities, including attending a school disco (n = 33, 41%), private classes (n = 11, 14%), school excursions (n = 8, 10%), school camps (n = 6, 7%), youth groups (n = 5, 6%) and a carnival (n = 2, 2%). students reported varying levels of social contact in school and non-school settings. the median class size at school was 20 people. the median group size for non-school setting activities ranged from 12 (university class) to 175 (religious groups).

table 2. number of student cases of ph1n1 that were notified between 28 april 2009 and 3 june 2009 and participating in ph1n1 study that reported participation in school and extracurricular activities and groups and median group size
the median number of close contacts at school was three per class, and the median number of close contacts in non-school settings was similar, ranging from two (university class) to four (religious group, data not presented). the mean number of total close contacts was 45; distribution was highly dispersed and right tailed (fig. 2).
fig. 2. frequency of the total number of close contacts reported by student cases of ph1n1 that were notified between 28 april 2009 and 3 june 2009 and participating in ph1n1 study, melbourne, australia
participation in groups and activities was less during school closures and during the students' infectious periods compared to non-outbreak periods when schools were open and students were participating in regular activities. during their period of infectiousness, nearly all students attended school (n = 98, 99% of all students); however, no students attended university classes or work and there was reduced participation in sports (n = 28, 45% of the 62 students that regularly had sporting activities), religious (n = 8, 40%) and additional extracurricular activities (n = 35, 43%) (table 2).
during school closures, there was less participation reported for sports (n = 14, 23% of the 62 students that regularly had sporting activities), religious (n = 1, 5%) and additional extracurricular activities (n = 21, 26%). compared to non-outbreak periods, the incidence rate for participating in extracurricular activities was approximately one quarter during periods of school closures [incidence rate ratio (irr) 0.28, 95% confidence interval (ci):0.17–0.46] and approximately one half during the students' infectious periods (irr 0.56, 95% ci:0.44–0.71, table 3). there was no statistically significant interaction between the effect of infectious period and school closures.
table 3. adjusted incidence rate ratios for extra-curricular participation during students' infectious periods and school closure periods, among 98 students with ph1n1 notification between 28 april 2009 and 3 june 2009
discussion
several studies have demonstrated high transmission of ph1n1 in schools.7,11,19-23 this study provides novel evidence of the potential of ph1n1 transmission within school and non-school settings via student networks and shows that students engaged in multiple activities in a range of settings during the pandemic period, even when public health interventions were implemented. while participation was less, students continued to engage in non-school-based activities during their periods of infectiousness and school closures.
the structure of australian secondary schools, in which students move from class to class throughout a single school day, highlights how pandemic influenza can spread in school settings with relative ease. additional school-based non-curricular activities observed in this study, such as sports groups, choir, excursions, carnivals and school camps, potentially interlink students across year levels, providing additional mechanisms for the transmission of pandemic influenza in young people.
there was a diverse range of social contacts in non-school settings reported by students. that just under one fifth of students reported engaging in regular part-time employment provides a risk factor for exposure of secondary transmission that has not previously been highlighted in studies that explore transmission of ph1n1. this employment resulted in varied social contacts in settings that involved numerous instances of both random and non-random social contacts (i.e. customers versus work colleagues) and included supermarkets, cafes and fast-food restaurants. while comparative data are not currently available to assess the differences in social contacts in workplace settings between teenagers and adults, these findings identify an important non-school setting for ph1n1 transmission for consideration in pandemic planning.
similarly, information was captured on the level and type of sporting activities in which students engaged. that many students participated in sporting activities during their infectious period and during school closures is similar to that reported in western australia where sporting activities were commonly reported by students (cases and non-cases) over a longer period in 2009. this study also found that many team sports were played in an indoor setting, providing opportunities for disease transmission.6
social distancing recommendations, such as the isolation of cases during their infectious period, were poorly adhered to by our sample. students reported high levels of school attendance after symptom onset and while potentially infectious, thus further contributing to the evidence that schools are effective settings for the spread of pandemic influenza. anecdotal evidence from some students suggested they did not want to be absent from school because of senior-school examinations during the time period. while this provides some explanation for the high level of school attendance, it nonetheless highlights the need for improved communication at the individual level to prevent community transmission. this communication should be aimed at social isolation of symptomatic cases, including while schools remain open and pandemic influenza is potentially circulating within schools.
the participation levels of students in sporting, religious and additional extracurricular activities in the week following symptom onset and while potentially infectious decreased compared to the levels reported as a regular activity. while somewhat helpful, decreased attendance does not meet isolation recommendations during the potentially infectious period. this reduced participation is likely influenced by the presence of symptoms among the samples and possibly because some students were undertaking examinations at this time. participation in activities, especially while symptomatic, could potentiate transmission within and across social groups and hence be a bridge between young people and the wider community. other international studies have also documented that social events such as parties and religious activities were implicated in transmission of ph1n1.5,6 this reinforces the need for improved communication regarding social isolation to include extracurricular groups and activities to maximize the effect of social distancing measures in controlling pandemic influenza.
there was also lower participation in sporting, religious and additional extracurricular activities during school closures. this is similar to a study that compared the social contact patterns of students (ph1n1 cases and non-cases) before and after school closure that found that fewer students visited public places (such as shops, places of worship and playing fields) when school was closed than when open.22 however, in the western australian study, it was reported that almost three quarters of students (influenza cases and non-cases) left home at least once during school closures.6 this finding reinforces the need for strategies in the revised pandemic plan to ensure that the benefit of school closures – that is, reduced social contact between students – is realized and to prevent students' social contact with potentially broader and unexposed social networks.
the distribution of the total number of close contacts reported by students was highly dispersed and was skewed to the right with the majority of students having a small number of close contacts and a few having much larger numbers of contacts. this has ramifications for the control of disease spread, as containment is more difficult than for a random network of contact between people. targeted strategies aimed at those more central to the network or with a greater number of social ties may be more efficient than non-targeted strategies. although impractical to target individuals with many contacts, it may be possible to identify and target activities that lead to the skewed distribution such as religious gatherings or large gatherings.
this study has limitations, some of which have been documented previously,18 including issues relating to possible selection and recall bias. in addition, the number of social contacts reported here are likely to be an underestimation given that questions were asked about specific planned activities rather than incidental activities and that information was collected retrospectively. future research to enumerate interactions that are not class or group based would fill this gap in information. further, the number of contacts in this study was measured by recalling close contacts over a 35-day period, rather than daily, which is the norm in studies of social contacts.12,24 the relationship between contact ties and interactions is an emerging area of social network research and is likely to be a key determinant in infectious disease transmission.25
the results from this study have public health implications for both informing modelling estimates of future pandemics and targeting prevention and control strategies to young people. school closures can only prevent transmission between students that could occur at school or school-based activities such as school camps. young people participate in numerous activities outside of school hours and continue to engage with other young people via additional extracurricular activities during school closures. this study also identified the possibility of targeted strategies for transmission prevention given the highly dispersed nature of students' contact networks. young people are not a homogenous group and may play a central role in future influenza pandemics. therefore it is critical that any response to pandemic influenza considers the mechanisms of transmission through young people.
conflicts of interest
no author receives any financial support or has any financial involvement or affiliation with any organization whose financial interests may be affected by material in the manuscript or which might potentially bias it.
funding
this work was supported by an australian government national health and medical research council grant (application id 603753) for research on ph1n1 to inform public policy.
acknowledgements
the authors gratefully acknowledge the students and schools who participated in this study, as well as the victorian department of education and early childhood development and victorian catholic education office for providing permission to conduct this research within these schools. thank you also to the victorian department of health and human services that provided data on confirmed cases of ph1n1 in victoria. we acknowledge the work of data collectors and research assistants who worked on this project: a bowring, k hall, m lewis, p nguyen, a fegan, j mithen, c madsen and f kong. this work was supported by an australian government national health and medical research council (nhmrc) grant (application id 603753) for research on ph1n1 to inform public policy. this work was conducted while caroline van gemert was a masters of applied epidemiology scholar at the australian national university; the programme was funded by the australian department of health and ageing. margaret hellard is supported by an nhmrc senior research fellowship. the burnet institute gratefully acknowledges the contribution of the victorian operational infrastructure support program to this work.
references
- mcbryde e, bergeri i, van gemert c, rotty j, headley e, simpson k, et al. early transmission characteristics of influenza a(h1n1)v in australia: victorian state, 16 may 3 june 2009. euro surveill. 2009 10 22;14(42):19363. doi:10.2807/ese.14.42.19363-en pmid:19883544
- four new cases of human swine influenza in australia. canberra: australian government department of health and ageing; 2009 (https://web.archive.org/web/20090617192232/http://www.healthemergency.gov.au/internet/healthemergency/publishing.nsf/content/news-015).
- cauchemez s, donnelly ca, reed c, ghani ac, fraser c, kent ck, et al. household transmission of 2009 pandemic influenza a (h1n1) virus in the united states. n engl j med. 2009 dec 31;361(27):2619–27. doi:10.1056/nejmoa0905498 pmid:20042753
- calatayud l, kurkela s, neave pe, brock a, perkins s, zuckerman m, et al. pandemic (h1n1) 2009 virus outbreak in a school in london, april-may 2009: an observational study. epidemiol infect. 2010 feb;138(2):183–91. doi:10.1017/s0950268809991191 pmid:19925691
- kar-purkayastha i, ingram c, maguire h, roche a. the importance of school and social activities in the transmission of influenza a(h1n1)v: england, april june 2009. euro surveill. 2009 08 20;14(33):19311. doi:10.2807/ese.14.33.19311-en pmid:19712642
- effler pv, carcione d, giele c, dowse gk, goggin l, mak db. household responses to pandemic (h1n1) 2009-related school closures, perth, western australia. emerg infect dis. 2010 feb;16(2):205–11. doi:10.3201/eid1602.091372 pmid:20113548
- kawaguchi r, miyazono m, noda t, takayama y, sasai y, iso h. influenza (h1n1) 2009 outbreak and school closure, osaka prefecture, japan. emerg infect dis. 2009 oct;15(10):1685. doi:10.3201/eid1510.091029 pmid:19861075
- mikolajczyk rt, akmatov mk, rastin s, kretzschmar m. social contacts of school children and the transmission of respiratory-spread pathogens. epidemiol infect. 2008 jun;136(6):813–22. doi:10.1017/s0950268807009181 pmid:17634160
- germann tc, kadau k, longini im jr, macken ca. mitigation strategies for pandemic influenza in the united states. proc natl acad sci usa. 2006 apr 11;103(15):5935–40. doi:10.1073/pnas.0601266103 pmid:16585506
- glass lm, glass rj. social contact networks for the spread of pandemic influenza in children and teenagers. bmc public health. 2008 02 14;8(1):61. doi:10.1186/1471-2458-8-61 pmid:18275603
- cauchemez s, ferguson nm, wachtel c, tegnell a, saour g, duncan b, et al. closure of schools during an influenza pandemic. lancet infect dis. 2009 aug;9(8):473–81. doi:10.1016/s1473-3099(09)70176-8 pmid:19628172
- mossong j, hens n, jit m, beutels p, auranen k, mikolajczyk r, et al. social contacts and mixing patterns relevant to the spread of infectious diseases. plos med. 2008 mar 25;5(3):e74. doi:10.1371/journal.pmed.0050074 pmid:18366252
- australian government department of health and ageing. australian health management plan for pandemic influenza. in: protection oo h, editor. canberra: australian government department of health and ageing; 2008.
- fielding j, higgins n, gregory j, grant k, catton m, bergeri i, et al. pandemic h1n1 influenza surveillance in victoria, australia, april september, 2009. euro surveill. 2009 10 22;14(42):19368. doi:10.2807/ese.14.42.19368-en pmid:19883545
- edmunds wj, kafatos g, wallinga j, mossong jr. mixing patterns and the spread of close-contact infectious diseases. emerg themes epidemiol. 2006 08 14;3(1):10. doi:10.1186/1742-7622-3-10 pmid:16907980
- australia uiapp. canberra: australian government department of health and ageing; 2009 (https://web.archive.org/web/20090617192210/http://www.healthemergency.gov.au/internet/healthemergency/publishing.nsf/content/news-002).
- alert level raised to. ‘contain'. canberra: australian government department of health and ageing; 2009 (https://web.archive.org/web/20090617192221/http://www.healthemergency.gov.au/internet/healthemergency/publishing.nsf/content/news-022).
- van gemert c, hellard m, mcbryde es, fielding j, spelman t, higgins n, et al. intrahousehold transmission of pandemic (h1n1) 2009 virus, victoria, australia. emerg infect dis. 2011 sep;17(9):1599–607. doi:10.3201/eid1709.101948 pmid:21888784
- lessler j, reich ng, cummings da, nair hp, jordan ht, thompson n; new york city department of health and mental hygiene swine influenza investigation team. outbreak of 2009 pandemic influenza a (h1n1) at a new york city school. n engl j med. 2009 dec 31;361(27):2628–36. doi:10.1056/nejmoa0906089 pmid:20042754
- carrillo-santisteve p, renard-dubois s, cheron g, csaszar-goutchkoff m, lecuit m, lortholary o, et al. 2009 pandemic influenza a(h1n1) outbreak in a complex of schools in paris, france, june 2009. euro surveill. 2010 jun 24;15(25). pmid:20587360
- wu jt, cowling bj, lau eh, ip dk, ho lm, tsang t, et al. school closure and mitigation of pandemic (h1n1) 2009, hong kong. emerg infect dis. 2010 mar;16(3):538–41. doi:10.3201/eid1603.091216 pmid:20202441
- jackson c, mangtani p, vynnycky e, fielding k, kitching a, mohamed h, et al. school closures and student contact patterns. emerg infect dis. 2011 feb;17(2):245–7. doi:10.3201/eid1702.100458 pmid:21291596
- iuliano ad, dawood fs, silk bj, bhattarai a, copeland d, doshi s, et al. investigating 2009 pandemic influenza a (h1n1) in us schools: what have we learned? clin infect dis. 2011 jan 1;52 suppl 1:s161–7. doi:10.1093/cid/ciq032 pmid:21342889
- mccaw jm, forbes k, nathan pm, pattison pe, robins gl, nolan tm, et al. comparison of three methods for ascertainment of contact information relevant to respiratory pathogen transmission in encounter networks. bmc infect dis. 2010 06 10;10(1):166. doi:10.1186/1471-2334-10-166 pmid:20537186
- fefferman nh, ng kl. how disease models in static networks can fail to approximate disease in dynamic networks. phys rev e stat nonlin soft matter phys. 2007 sep;76(3 pt 1):031919. doi:10.1103/physreve.76.031919 pmid:17930283
https://ojs.wpro.who.int/ 1wpsar vol 11, no 4, 2020 | doi: 10.5365/wpsar.2020.11.1.012 outbreak investigation report a centre for health protection, department of health, hong kong sar (china). published: 13 november 2020 doi: 10.5365/wpsar.2020.11.1.012 objectives: an outbreak of coronavirus disease 2019 (covid-19) caused by severe acute respiratory syndrome coronavirus 2 (sars-cov-2) was first reported in wuhan, china, in december 2019, with subsequent spread around the world. hong kong sar (china) recorded its first confirmed cases on 23 january 2020. in this report, we describe a family cluster of 12 confirmed cases, with two additional confirmed cases from secondary transmission. methods: we reported the epidemiological, clinical and laboratory findings of the family cluster, as well as the public health measures instituted. results: all 12 confirmed covid-19 cases were among the 19 attendees of a three-hour chinese new year family dinner consisting of hotpot and barbecue dishes. environmental sampling of the gathering venue was negative. two additional confirmed cases, who were co-workers of two confirmed cases, were later identified, indicating secondary transmission. contact tracing, quarantine and environmental disinfection were instituted to contain further spread. discussion: our findings were highly suggestive of a superspreading event during the family gathering. the source was likely one of the cases during the pre-symptomatic phase. the event attested to the high infectivity of sarscov-2 through human-to-human transmission from social activities and argued for the necessity of social distancing in curtailing the disease spread. a n outbreak of coronavirus disease 2019 (covid-19), caused by severe acute respiratory syndrome coronavirus 2 (sars-cov-2),1 was first reported in wuhan, china, in december 2019. with its spread to other countries and areas, covid-19 was declared a public health emergency of international concern by the world health organization on 30 january 2020. current research suggests sars-cov-2 to be of zoonotic origin, with the capacity of human-to-human transmission.2 it is highly infectious,3,4 and can be transmitted via droplets and contact with contaminated surfaces. airborne transmission might take place during aerosol-generating procedures.5 some experts proposed that certain social activities involving water-vapour generation, such as hotpot meals and saunas, were associated with increased risk of transmission.6 transmission from asymptomatic contacts was also reported.7 hong kong sar (china), a metropolitan city located on china’s southern coast and with intimate economic and social ties with mainland china, reported its first confirmed cases of covid-19 on 23 january 2020. as of the end february 2020, hong kong sar (china) had recorded 95 confirmed cases of covid-19. twenty-six cases were local or possibly a locally acquired infection without identifiable sources. in this report, we described a family cluster of 12 confirmed cases, with two additional confirmed cases from secondary transmission. method case identification cases of covid-19 were identified from notification by medical practitioners in hong kong sar (china) to the centre for health protection (chp) under the department of health or from contact tracing of confirmed cases. a superspreading event involving a cluster of 14 coronavirus disease 2019 (covid-19) infections from a family gathering in hong kong sar (china) ho yeung lam,a tsz sum lam,a chi hong wong,a wing hang lam,a emily leung chi mei,a yonnie lam chau kuen,a winnie lau tin wai,a billy ho chi hin,a ka hing wonga and shuk kwan chuanga correspondence to dr lam ho-yeung (email: smo_epi4@dh.gov.hk) wpsar vol 11, no 4, 2020 | doi: 10.5365/wpsar.2020.11.1.012 https://ojs.wpro.who.int/2 lam et alsuperspreading of covid-19 during a family dinner developed symptoms between 28 and 31 january 2020, respectively. they were admitted for isolation and also tested positive for sars-cov-2 (patients 2 to 4). in view of the proximity of their symptom onset dates, a common source exposure was suspected. further enquiry revealed that they attended a chinese new year gathering with 15 other relatives on 26 january 2020 (fig. 1). at the time of the investigation, eight of them were found to be symptomatic from 30 january to 8 february 2020, and arrangements were made for hospital admission. seven tested positive for sars-cov-2 (patients 5 to 11). two of the attendees (a father and his son) were visitors from guangdong province, china, and had already returned home at the time of our investigation. we were later informed by the health commission of guangdong province that the son had developed a cough and runny nose on 2 february 2020 and had tested positive for sars-cov-2 on 10 february (patient 12). the father reported having had a cough for a few days beginning 20 january 2020, which had subsided during the gathering. his respiratory specimen collected on 9 february was negative for sars-cov-2. his serology remained negative for sars-cov-2 antibodies. family gathering the 19 attendees lived in several different residences, and the family gathering was the only occasion attended by all 12 confirmed cases during their incubation periods. it was held in a commercial party room during the evening and lasted for about three hours. the attendees had an indoor hotpot dinner and a barbeque held at an outdoor area. no game meat or wild poultry was consumed. they also played mah-jong and snooker. none of the attendees were symptomatic during the gathering. staff of the party room did not enter the room during the gathering, and there were no other patrons that evening. none of the staff and patrons who used the room in the following days reported symptoms. environmental investigations a site visit was conducted at the party room on 9 february 2020. environmental swabs were taken at 18 high-touch areas, including doorknobs, door handles, table surfaces and edges, and light switches. all tested negative for sars-cov-2. epidemiological investigation for each notification, chp initiated a case investigation, including source identification, contact tracing and additional case findings. the incubation period of covid-19 was defined as 1–14 days before symptom onset.8 we describe the course of our epidemiological investigation leading to the identification of this family cluster and present the clinical, epidemiological and laboratory findings of the cases. environmental investigation during the investigation, it was noted that all confirmed cases attended a family gathering before symptom onset. a site visit was conducted to the venue of the gathering with environmental swabs collected for examination. laboratory investigation all locally confirmed cases of covid-19 described in this report were laboratory confirmed by the positive detection of sars-cov-2 rna in the patient’s clinical specimens using real-time reverse transcription polymerase chain reaction. the same approach was used for environmental swabs. infection control measures we describe the various infection control measures instituted. results the index case and his family on 9 february 2020, chp received notification of a confirmed case of covid-19 involving a 24-year-old male (patient 1) who had developed a fever and a productive cough on 30 january 2020. he was admitted to a public hospital on 8 february 2020, and his nasopharyngeal aspirate tested positive for sars-cov-2. he did not travel outside hong kong sar (china) during the incubation period. he worked as a sales representative and denied having any contact with confirmed covid-19 cases. contact tracing revealed that his parents and maternal grandmother, who resided with him, also had wpsar vol 11, no 4, 2020 | doi: 10.5365/wpsar.2020.11.1.012https://ojs.wpro.who.int/ 3 superspreading of covid-19 during a family dinnerlam et al additional case finding and infection control measures extensive contact tracing was conducted for each individual patient confirmed in hong kong sar (china). all symptomatic contacts were isolated in a public hospital for treatment and sars-cov-2 testing. asymptomatic contacts were quarantined in quarantine facilities or put under medical surveillance, depending on the nature and duration of contact with the patient. forty-six close contacts and 166 other contacts were identified. among them, two contacts who were co-workers of patients 3 and 5 developed symptoms, one on 1 february and the other on 3 february, and tested positive for sars-cov-2 (patients 13 and 14). overall, the entire cluster of 14 confirmed cases consisted of seven males and seven females aged 22 to 91 (median: 51). all of them had a record of good health and had no history of travel outside hong kong sar (china) during the incubation period, except patient 12 who had been visiting from china. they all presented with upper respiratory symptoms and/or fever (fig. 2). environmental cleansing and disinfection were arranged for the party room, the residences of the cases and their workplaces. as of the end of february, all cases remained stable, and eight (patients 1, 3, 4, 5, 9, 10, 12 and 13) were discharged. no further cases related to this cluster were identified. discussion this was the largest covid-19 family cluster recorded in hong kong sar (china) at the time of our reporting. our epidemiological investigation suggested that primary transmission took place during the family gathering, with secondary transmission leading to the infection of two more cases. as none of the attendees were symptomatic during the gathering, it was likely that pre-symptomatic transmission from one of the attendees had occurred. our investigation supported and supplemented the current understanding of the covid-19 infection. in this cluster, the incubation periods ranged from 2–13 days, which is compatible with the current knowledge. nevertheless, those with a longer incubation period might represent secondary interfamilial transmission. our findings also supported human-to-human transmission of sars-cov-2. as the family gathering was the only occasion attended by the 12 patients during the incubation periods, it demonstrated the high infectivity of sarscov-2 (as 11 out of 17 susceptible attendees, excluding the potential source, were infected) and its ability to cause a superspreading event. environmental factors and behavioural factors have been proposed as risk factors of a superspreading event.9 for example, one study in japan demonstrated 18.7 times higher odds for transmission in a closed compared with an open-air environment.10 in our cluster, part of the fig. 1. the family tree of the cluster patient 13 f/60 onset: 1/2/2020 patient 4 f/57 onset: 28/1/2020 f/57 asymptomatic f/31 asymptomatic patient 5 f/55 onset: 30/1/2020 patient 2 f/91 onset: 31/1/2020 patient 6 f/51 onset: 8/2/2020 patient 8 f/25 onset: 8/2/2020 patient 10 f/50 onset: 2/2/2020 patient 3 m/68 onset: 29/1/2020 m/26 asymptomatic tested negative m/60 asymptomatic m/41 asymptomatic m/28 onset: 9/2/2020 tested negative m/49 from guangdong onset: 20/1/2020 tested negative patient 1 m/24 onset: 30/1/2020 patient 14 m/51 onset: 3/2/2020 patient 9 m/22 onset: 8/2/2020 patient 7 m/52 onset: 9/2/2020 patient 12 m/26 onset: 2/2/2020 patient 11 m/23 onset: 7/2/2020 co-worker c o-w orker confirmed case tested negative for sars-cov-2 asymptomatic and did not receive testing for sars-cov-2 attendees of the family gathering on 26 jan 2020 attendees of the family gathering visiting from guangdong province wpsar vol 11, no 4, 2020 | doi: 10.5365/wpsar.2020.11.1.012 https://ojs.wpro.who.int/4 lam et alsuperspreading of covid-19 during a family dinner our investigation had several strengths. our immediate investigation allowed identification of the possible sources and the establishment of the transmission chain. extensive contact tracing allowed swift identification of more confirmed cases and ensured contacts were quarantined and put under medical surveillance. the timely institution of these infection control measures allowed complete case ascertainment in this cluster and shed light on the transmission dynamic of covid-19. on the other hand, there were some limitations regarding our investigation. our environmental investigation was conducted two weeks after the family gathering, which might limit the positive yield of the environmental sampling. cases who remained asymptomatic might not be identified. in hong kong sar (china), family gatherings involving relatives from other extended families and friends are quite common during major festivities (e.g. chinese new year) and are considered an important local tradition. family gathering took place in a party room that was a closed environment. nevertheless, we were unable to determine the significance of environmental contamination in the transmission chain in this cluster. moreover, the transmission of sars-cov-2 could be enhanced through close and prolonged social contacts without wearing a mask, such as in the family gathering described above. although the family gathering involved a hotpot dinner, there was not enough information to support the expert hypothesis that it could enhance sars-cov-2 transmission through water-vapour generation. it is also noted that it took more than one week since symptom onset for most cases in this cluster to receive covid-19 testing. in fact, several cases had consulted primary care physicians, but they were not tested as tests were only available then in public hospitals and the chp laboratory. subsequently, covid-19 testing had been made available at the primary care level to allow earlier identification of cases in the community.11 npa = nasopharyngeal aspirate fig. 2. chart illustrating key events of patients 1 to 14 patient 1 m/24 patient 2 f/91 patient 3 m/68 patient 4 f/57 patient 5 f/55 patient 6 f/51 patient 7 m/52 patient 8 f/25 patient 9 m/22 patient 10 f/50 patient 11 m/23 patient 13 f/60 (co-worker of patient 3) patient 14 m/51 (co-worker of patient 5) patient 12 m/26 25 26 27 28 29 30 31 1 2 3 4 5 6 7 8 9 10 11 12 13 14 15 16 13 14 15 16 17 18 19 20 21 22 23 24 january february onset of cough & runny nose onset of fever npa positive onset of cough sputum positive npa positive npa positive npa positive onset of fever & cough onset of fever, cough & sore throat onset of fever & cough sputum positive npa positive npa & throat swab positive npa & throat swab positive npa & throat swab positive npa & throat swab positive npa, sputum & throat swab positive onset of cough and runny nose; npa, sputum & throat swab positive onset of fever & cough onset of fever onset of fever, cough & runny nose onset of fever & vomiting onset of fever & cough onset of fever, cough & sore throat onset of cough repiratory specimen positive date of symptom onset date of collection of positive specimen incubation period family gathering contact during work between patients 3 and 13 when former is infectious contact during work between patients 5 and 14 when former is infectious date of admission & isolation wpsar vol 11, no 4, 2020 | doi: 10.5365/wpsar.2020.11.1.012https://ojs.wpro.who.int/ 5 superspreading of covid-19 during a family dinnerlam et al 2. chan jf, yuan s, kok kh, to kk, chu h, yang j, et al. a familial cluster of pneumonia associated with the 2019 novel coronavirus indicating person-to-person transmission: a study of a family cluster. lancet. 2020 feb 15;395(10223):514–23. doi:10.1016/ s0140-6736(20)30154-9 pmid:31986261 3. tuite ar, fisman dn. reporting, epidemic growth, and reproduction numbers for the 2019 novel coronavirus (2019-ncov) epidemic. ann intern med. 2020 apr;172(8):567–8. doi:10.7326/m200358 pmid:32023340 4. wu jt, leung k, leung gm. nowcasting and forecasting the potential domestic and international spread of the 2019-ncov outbreak originating in wuhan, china: a modelling study. lancet. 2020 jan 31. pii: s0140–6736(20)30260–9. doi:10.1016/s01406736(20)30260-9 5. world health organization. q&a on infection prevention and control for health care workers caring for patients with suspected or confirmed 2019-ncov. 16 february 2020. available from: https:// www.who.int/news-room/q-a-detail/q-a-on-infection-preventionand-control-for-health-care-workers-caring-for-patients-with-suspected-or-confirmed-2019-ncov 6. pao j. hotpot diners ‘caught wuhan virus via droplets, not aerosols’. asia times. 2020 february 10. available from: https://asiatimes. com/2020/02/hotpot-diners-caught-wuhan-virus-via-droplets-notaerosols 7. rothe c, schunk m, sothmann p, bretzel g, froeschl g, wallrauch c, et al. transmission of 2019-ncov infection from an asymptomatic contact in germany. n engl j med. 2020;382(10):970–1. doi:10.1056/nejmc2001468 pmid:32003551 8. backer ja, klinkenberg d, wallinga j. incubation period of 2019 novel coronavirus (2019-ncov) infections among travellers from wuhan, china, 20-28 january 2020. euro surveill. 2020 feb;25(5). doi:10.2807/1560-7917.es.2020.25.5.2000062 pmid:32046819 9. frieden tr, lee ct. identifying and interrupting superspreading events-implications for control of severe acute respiratory syndrome coronavirus 2. emerg infect dis. 2020 jun;26(6):1059–66. doi:10.3201/eid2606.200495 pmid:32187007 10. hiroshi nishiura, hitoshi oshitani, tetsuro kobayashi. closed environments facilitate secondary transmission of coronavirus disease 2019 (covid-19). medrxiv. doi:10.1101/2020.02.28.20029272. 11. the government of hong kong special administrative region. hospital authority “enhanced laboratory surveillance programme” supplementary information. 2020 march 3. available from https:// www.info.gov.hk/gia/general/202003/03/p2020030300687. htm 12. ahmed f, zviedrite n, uzicanin a. effectiveness of workplace social distancing measures in reducing influenza transmission: a systematic review. bmc public health. 2018 apr 18;18(1):518. doi:10.1186/s12889-018-5446-1 pmid:29669545 these occasions offer good opportunities for superspreading of a highly infectious agent such as sars-cov-2. social distancing has been advocated as one of the community mitigation measures during influenza pandemics. it entails an increase in physical distances and a reduction of gatherings in dense social settings.12 with the continuing global spread of covid-19, apart from advocating personal hygiene and protection, social distancing might be necessary to curtail further disease spread in the community, especially for preventing occurrence of superspreading events. acknowledgements the authors would like to thank the staff members of the communicable disease branch and the public health laboratory services branch of the centre for health protection in hong kong sar (china) for their wholehearted dedication and valuable contribution to the outbreak investigation, colleagues at the hospital authority of hong kong sar (china) for their professional care of covid-19 patients, and colleagues at the health commission of guangdong province for their follow-up investigations and information sharing. funding none. conflicts of interest no potential conflicts of interest were reported by the authors. references 1. gorbalenya ae, baker sc, baric rs, de groot rj, drosten c. gulyaeva aa, et al. severe acute respiratory syndrome-related coronavirus: the species and its viruses—a statement of the coronavirus study group. biorxiv. 2020 feb 11. doi:10.1101/ 2020.02.07.937862 (preprint) https://doi.org/10.1016/s0140-6736(20)30154-9 https://doi.org/10.1016/s0140-6736(20)30154-9 https://www.ncbi.nlm.nih.gov/entrez/query.fcgi?cmd=retrieve&db=pubmed&list_uids=31986261&dopt=abstract https://doi.org/10.7326/m20-0358 https://doi.org/10.7326/m20-0358 https://www.ncbi.nlm.nih.gov/entrez/query.fcgi?cmd=retrieve&db=pubmed&list_uids=32023340&dopt=abstract https://www.thelancet.com/journals/lancet/article/piis0140-6736(20)30260-9/fulltext https://www.thelancet.com/journals/lancet/article/piis0140-6736(20)30260-9/fulltext https://www.who.int/news-room/q-a-detail/q-a-on-infection-prevention-and-control-for-health-care-workers-caring-for-patients-with-suspected-or-confirmed-2019-ncov https://www.who.int/news-room/q-a-detail/q-a-on-infection-prevention-and-control-for-health-care-workers-caring-for-patients-with-suspected-or-confirmed-2019-ncov https://www.who.int/news-room/q-a-detail/q-a-on-infection-prevention-and-control-for-health-care-workers-caring-for-patients-with-suspected-or-confirmed-2019-ncov https://www.who.int/news-room/q-a-detail/q-a-on-infection-prevention-and-control-for-health-care-workers-caring-for-patients-with-suspected-or-confirmed-2019-ncov https://asiatimes.com/2020/02/hotpot-diners-caught-wuhan-virus-via-droplets-not-aerosols https://asiatimes.com/2020/02/hotpot-diners-caught-wuhan-virus-via-droplets-not-aerosols https://asiatimes.com/2020/02/hotpot-diners-caught-wuhan-virus-via-droplets-not-aerosols https://doi.org/10.1056/nejmc2001468 https://www.ncbi.nlm.nih.gov/entrez/query.fcgi?cmd=retrieve&db=pubmed&list_uids=32003551&dopt=abstract https://doi.org/10.2807/1560-7917.es.2020.25.5.2000062 https://www.ncbi.nlm.nih.gov/entrez/query.fcgi?cmd=retrieve&db=pubmed&list_uids=32046819&dopt=abstract https://www.ncbi.nlm.nih.gov/entrez/query.fcgi?cmd=retrieve&db=pubmed&list_uids=32046819&dopt=abstract https://doi.org/10.3201/eid2606.200495 https://www.ncbi.nlm.nih.gov/entrez/query.fcgi?cmd=retrieve&db=pubmed&list_uids=32187007&dopt=abstract https://www.medrxiv.org/content/10.1101/2020.02.28.20029272v2 https://www.info.gov.hk/gia/general/202003/03/p2020030300687.htm https://www.info.gov.hk/gia/general/202003/03/p2020030300687.htm https://www.info.gov.hk/gia/general/202003/03/p2020030300687.htm https://doi.org/10.1186/s12889-018-5446-1 https://www.ncbi.nlm.nih.gov/entrez/query.fcgi?cmd=retrieve&db=pubmed&list_uids=29669545&dopt=abstract https://www.biorxiv.org/content/10.1101/2020.02.07.937862v1 https://ojs.wpro.who.int/ 1wpsar vol 12, no 2, 2021 | doi: 10.5365/wpsar.2020.11.3.017 perspective a department of entomology, faculty of crop and food sciences, pir mehr ali shah (pmas) arid agriculture university rawalpindi, shamsabad, pakistan. b marie bashir institute for infectious diseases and biosecurity, university of sydney, camperdown, australia. c 129 medical entomology laboratory, school of biological sciences, universiti sains malaysia, minden, penang, malaysia. published: 7 may 2021 doi: 10.5365/wpsar.2020.11.3.017 t he world is facing serious health and economic threats from the global coronavirus disease 2019 (covid-19) pandemic, caused by severe acute respiratory syndrome coronavirus 2 (sars-cov-2). the burden of disease has been significant, with tens of millions of cases and more than 1.5 million deaths reported globally.1 since its emergence in wuhan, china, in late 2019, covid-19 has spread around the world, affecting almost all countries. covid-19 is a highly contagious disease that is spread by direct contact and respiratory droplets, and patients can be infective while presymptomatic or asymptomatic.2 to reduce opportunities for transmission, most developed countries have implemented lockdowns, causing significant social and economic disruption. mosquitoborne diseases, such as malaria and dengue, are a substantial burden in many countries, especially those with developing economies. malaria is the most significant mosquito-borne disease, with about 228 million cases reported in 2018 and 231 million in 2017, and 405 000 deaths in 2018 and 416 000 in 2017.3 dengue is the most commonly reported arboviral disease internationally, with asia suffering a significant disease burden.4 in countries facing endemic and epidemic malaria and dengue, disruption to government services (in health and non-health sectors) and to public health services could severely impact the ability to implement strategic responses to mosquito-borne diseases. as of 30 june 2020, all malaria-endemic countries in asia had confirmed cases of covid-19, and those with developing economies face a particularly serious threat to malaria control efforts. in these countries, local authorities responsible for malaria and dengue control must make strategic preparations for continuing with control measures, both during and after the covid-19 pandemic. malaria and dengue control programmes in developing countries mainly focus on vector control by residual spraying of insecticides (other strategies include biological control of vectors and use of personal insect repellents and long-lasting insecticide-treated bed nets).5 between 2000 and 2015, malaria-endemic countries achieved remarkable success in malaria control, seeing about 60% reduction in malaria deaths and 37% reduction in cases. however, disrupting factors (e.g. war) can weaken malaria control programmes and result in a resurgent burden of malaria.6 currently, there is uncertainty about the potential effects of the covid-19 pandemic on existing malaria and dengue control programmes. for example, the dire global economic situation due to covid-19 may reduce the ability of donor countries to continue their support of malaria and dengue control programmes in developing countries. in recent years, donor countries have decreased their funding of malaria control programmes, prioritizing countries with higher disease burden; in addition, the resources available domestically for malaria and dengue control are limited. in many developing countries, malaria and dengue are major public health problems, with annual budgetary needs in the millions of dollars. however, control of these diseases is beneficial; for example, the 5-year growth of countries after malaria elimination is significantly more than in countries where malaria persists.7 there is a precedent for emerging epidemics disrupting the response to existing public health threats. for example, the emergence of dengue in malaria-endemic countries can adversely affect malaria control programmes (e.g. the 2010 outbreak of dengue in pakistan led to 702 000 more malaria prioritizing mosquito-borne diseases during and after the covid-19 pandemic shahmshad ahmed khan,a cameron ewart webbb and nur faeza abu kassimc correspondence to nur faeza abu kassim (email: nurfaeza@usm.my) wpsar vol 12, no 2, 2021 | doi: 10.5365/wpsar.2020.11.3.017 https://ojs.wpro.who.int/2 khan et alprioritizing mosquito-borne diseases during and after the covid-19 pandemic cases in 2011).8 it is already a challenge for countries to manage these two mosquito-borne diseases, with control often needing to be vector specific based on the distinct ecological requirements of the different mosquitoes.9 countries now face the challenge of focusing on dengue and malaria control during the covid-19 pandemic. there is some uncertainty regarding how the covid-19 pandemic will influence transmission rates of mosquito-borne pathogens. with the disruption to government services (e.g. through lockdowns or redeployment of government officials), control activities such as source reduction, community education and distribution of bed nets may cease or be significantly reduced. in residential and commercial buildings, efforts to reduce the risk of covid-19 by creating more outdoor facilities and increasing circulation of indoor air may increase exposure to mosquitoes. additionally, increased confinement at home during lockdowns, especially in metropolitan regions, may increase the risk of dengue virus transmission. if appropriate financial support is not maintained, the effectiveness of malaria and dengue control programmes will be compromised. recent outbreaks of dengue have demonstrated the importance of adequately funding and implementing response strategies. in 2019, numbers of confirmed dengue cases increased compared with previous years in many countries in asia and the pacific, including malaysia, the philippines and viet nam.10 there is a need to distribute resources to simultaneously control dengue, malaria and covid-19 in malaria-endemic countries. given the possibility of reduced funding from donor countries, governments should consider earmarking funds for the support of malaria and dengue control programmes, both during and after the pandemic. the covid-19 pandemic is likely to lead to strategic changes to public health policies in many countries, but prioritizing control of mosquitoborne diseases will remain critical. many aspects of integrated mosquito control can be incorporated into existing and future public health strategies. these include community and household efforts to increase the use of sanitary water storage practices in homes, use of personal protection measures (e.g. bed nets and repellents) and protection of vulnerable populations (e.g. pregnant women, young children and older people). there has been significant international collaboration to develop responses to covid-19. if the increased awareness of the importance of public health can lead to a greater focus on developing responses to mosquitoborne disease, there may be a positive outcome from the current situation. although there may be competing public health priorities, especially for covid-19, authorities must maintain the programmes designed to reduce the burden of malaria and dengue. references 1. coronavirus disease (covid-19) situation reports. geneva: world health organization; 2020. available from: https://www.who.int/ emergencies/diseases/novel-coronavirus-2019/situation-reports, accessed 4 november 2020. 2. hoehl s, rabenau h, berger a, kortenbusch m, cinatl j, bojkova d, et al. evidence of sars-cov-2 infection in returning travelers from wuhan, china. n engl j med. 2020 mar 26;382(13):1278–80. doi:10.1056/nejmc2001899, pmid:32069388 3. malaria. geneva: world health organization; 2020. available from: https://www.who.int/news-room/fact-sheets/detail/malaria, accessed 4 november 2020. 4. dengue and severe dengue. geneva: world health organization; 2020. available from: https://www.who.int/news-room/factsheets/detail/dengue-and-severe-dengue, accessed 4 november 2020. 5. wilson al, courtenay o, kelly-hope la, scott tw, takken w, torr sj, et al. the importance of vector control for the control and elimination of vector-borne diseases. plos negl trop dis. 2020 jan 16;14(1):e0007831. doi:10.1371/journal.pntd.0007831, pmid:31945061 6. cohen jm, smith dl, cotter c, ward a, yamey g, sabot oj, et al. malaria resurgence: a systematic review and assessment of its causes. malar j. 2012 apr 24;11(1):122. doi:10.1186/14752875-11-122, pmid:22531245 7. gallup jl, sachs jd. the economic burden of malaria. am j trop med hyg. 2001;64(1_suppl):85–96. doi:10.4269/ajtmh.2001.64.85 8. world malaria report 2019. geneva: world health organization; 2019. available from: https://www.who.int/publications/i/ item/9789241565721, accessed 4 november 2020. 9. islam mn, zulkifle m, sherwani am, ghosh sk, tiwari s. prevalence of malaria, dengue, and chikungunya significantly associated with mosquito breeding sites. j ima. 2011 jul;43(2):58–67. doi:10.5915/43-2-7871, pmid:23610486 10. dengue situation update 585. geneva: world health organisation; 2019. available from: https://iris.wpro.who.int/bitstream/ handle/10665.1/14461/dengue-20200102.pdf, accessed 4 november 2020. https://ojs.wpro.who.int/ 1wpsar vol 13, no 1, 2022 | doi: 10.5365/wpsar.2022.13.1.860 outbreak investigation report a n outbreak of food poisoning occurred during a mass gathering held on 6 october 2019 in petaling district, selangor, malaysia. the event was attended by about 20 000 people (politicians, members of the public and students from four public universities). at the event, pre-packaged food was provided by two caterers. the petaling district health office received an initial notification of food poisoning involving attendees of the event from a hospital in klang district. this report describes the outbreak investigation to identify cases, contaminated food items and the causative pathogen(s), to determine associated risk factors and to describe the prevention and control measures taken by the district health office to manage the outbreak. methods epidemiological investigation the case definition was any person who attended the mass gathering event in petaling district, consumed the pre-packaged food and subsequently developed abdominal pain, diarrhoea, vomiting or other constitutional symptoms (e.g. fever, nausea or dizziness) on 6 october 2019. active case finding was conducted by interviewing attendees of the mass gathering on site. passive case finding was encouraged by alerting all health facilities to report cases related to the outbreak. all cases identified a district health office of petaling, selangor, ministry of health malaysia. published: 10 february 2022 doi: 10.5365/wpsar.2022.13.1.860 objective: on 6 october 2019, petaling district health office received notification of a possible foodborne outbreak involving a mass gathering event. this report presents the processes of diagnosis verification, case identification, determination of associated risk factors and commencement of control measures in managing the outbreak. methods: cases were defined as those who attended the mass gathering event on 6 october 2019, consumed the prepackaged food and subsequently developed vomiting, abdominal pain, diarrhoea or other symptoms (e.g. fever, nausea and dizziness). epidemiological, environmental and laboratory investigations were performed. data were analysed using spss software (version 24.0). results: a total of 169 cases were identified. the attack rate was 7.2%, and cases ranged in age from 7 to 50 years, with a median of 20 years. a total of 156 (92.3%) cases had vomiting, 137 (81.1%) had abdominal pain and 83 (49.1%) had diarrhoea. consuming nasi lemak at the mass gathering was found to be significantly associated with developing illness (odds ratio: 9.90, 95% confidence interval: 6.46–15.16). the samples from suspected food, food handlers and the environment were positive for bacillus cereus, staphylococcus aureus or coliforms. discussion: the outbreak at this mass gathering was probably caused by food contaminated with b. cereus and s. aureus. to prevent future outbreaks, we recommend mass gathering events use certified catering services that have adequate food safety training. investigation of a foodborne outbreak at a mass gathering in petaling district, selangor, malaysia sudeash rajakrishnan,a muhd zulfadli hafiz ismail,a syed hafeez jamalulail,a norazmalia alias,a hassan ismail,a salina md taib,a lee soo cheng,a zazarida zakiman,a ong richai,a rubaan raj silverduraia and mohamad paid yusofa correspondence to sudeash rajakrishnan (email: sudeash27@gmail.com) wpsar vol 13, no 1, 2022 | doi: 10.5365/wpsar.2022.13.1.860 https://ojs.wpro.who.int/2 rajakrishnan et almass gathering foodborne outbreak in petaling district, malaysia results epidemiological results of the 2341 participants who were at risk of consuming the affected food, 169 were identified as cases for an attack rate of 7.2%. cases’ ages ranged from 7 to 50 years, with a median of 20 years. of the total cases, 161 were detected through active case finding and eight through passive case finding. a total of 156 (92.3%) cases complained of vomiting, 137 (81.1%) had abdominal pain, 83 (49.1%) had diarrhoea and 19 (11.2%) had fever (table 1). all cases sought treatment; 20 were admitted to hospital, and the remaining cases were treated as outpatients. no deaths were reported. the epidemic curve suggested a point-source outbreak, with a pattern showing a rapid increase, single peak and tapered decline in the number of cases (fig. 1). exposure time was about 07:00 on 6 october 2019. the onset of the index case was at 08:30, and the last case was at 18:30. the incubation period ranged from 1.5 to 11.5 hours, with a median of 6.5 hours. nasi lemak had the highest attack rate, at 89.6% (n = 169). the odds of cases having consumed nasi lemak (odds ratio [or]: 9.90, 95% confidence interval [ci]: 6.46–15.16) at the mass gathering were significantly higher than the odds of cases having consumed bread (or: 0.024, 95% ci: 0.010–0.059) or rice with chicken (or: 0.19, 95% ci: 0.14–0.27). bottled water also had a high attack rate, at 80.8% (n = 160), but this was probably due to the high overlap of cases who consumed both nasi lemak and bottled water. environmental examination the overall cleanliness rating of facility a was 48.8%. hazard analysis found poor general cleanliness and hygiene, evidenced by a congested food preparation area and dirty flooring, food preparation surfaces and sink floor. unsuitable, defective and dirty equipment, such as a dirty chiller with a suboptimal temperature (10 °c), were used during food preparation for the mass gathering. additionally, the components of the nasi lemak, which included rice, sambal and boiled egg, were cooked using the same pot. were interviewed using a standardized food poisoning questionnaire. data on sociodemographic characteristics, symptoms of food poisoning, onset of symptoms and food intake history during the event were gathered. environmental investigation an environmental investigation was conducted at the two kitchen facilities involved in preparing the pre-packaged food for the mass gathering. the parameters inspected were environmental hygiene, flow of food preparation including ingredients and their sources, handling of leftover foods and equipment hygiene. laboratory investigation rectal swabs from cases were taken at random, and environmental samples were collected focusing on suspected food and equipment used during its preparation. clinical samples were collected in labelled containers with caryblair medium. vomitus samples were collected in sterile containers. a 250 g sample of each leftover item of food or drink (nasi lemak, bread, rice with chicken, and bottled water) was collected in sterilized sampling bags. swab samples of food handlers’ hands and kitchen utensils (cutting boards, knives, rice cookers and food containers) were collected using 3m quick swabs. all samples were sent to the national public health laboratory within 24 hours of collection for culturing and sensitivity testing. analytical epidemiological investigation an unmatched case–control study was conducted to identify and confirm the food items and risk factors contributing to the outbreak. convenience sampling at a ratio of 1:0.3 was used, with 169 cases and 47 controls enrolled in the study. a case was defined as described above, while a control was defined as any asymptomatic individual who ate the food items provided during the event. probability values were obtained using fisher’s exact test. data management respondents’ identities were kept confidential. all data were collected, collated, verified and analysed using spss software (version 24.0). wpsar vol 13, no 1, 2022 | doi: 10.5365/wpsar.2022.13.1.860https://ojs.wpro.who.int/ 3 mass gathering foodborne outbreak in petaling district, malaysiarajakrishnan et al six food handlers worked at facility a. none had attended a food handling training course or had been vaccinated for typhoid. none had any acute gastroenteritis symptoms at the time of inspection. the preparation of the nasi lemak started 26 hours before consumption and the estimated holding time was up to 20 hours at room temperature. the overall general cleanliness and hygiene of facility b were satisfactory, with a rating of 86%. several control measures were taken to contain and eliminate the outbreak. the caterers’ activities at the facilities were suspended temporarily under the legal provisions of section 18(1)(d) infectious disease control act 1988, malaysia (cdc act 1988: act 342). this was to ensure that the caterers could take measures to comply with the requirements outlined under the food and hygiene regulation and prevent further outbreaks from occurring before resuming their activities. the caterers and food handlers also underwent food handling and health education, and they were urged to attend a food handling training course and obtain typhoid vaccinations. the organizer of the mass gathering was advised to liaise table 1. characteristics and symptoms of cases (n = 169) and controls (n = 47) cases, n (%) controls, n (%) sex male 25 (14.8) 3 (6.4) female 144 (85.2) 44 (93.6) age group (years) ≤15 2 (1.2) 0 (0) 16–25 163 (96.4) 47 (100) 26–35 1 (0.6) 0 (0) 36–45 2 (1.2) 0 (0) 46–55 1 (0.6) 0 (0) median age (range) 20 (7–50) 21 (19–23) affiliation of cases university a students 161 (95.3) 47 (100) general public 6 (3.6) 0 (0) university b students 2 (1.2) 0 (0) symptoms vomiting 156 (92.3) 0 (0) abdominal pain 137 (81.1) 0 (0) diarrhoea 83 (49.1) 0 (0) fever 19 (11.2) 0 (0) fig. 1. epidemic curve of the foodborne outbreak at a mass gathering in petaling district, selangor on 6 october 2019 c as es 30 25 20 15 10 5 0 06 :3 0 07 :0 0 07 :3 0 08 :0 0 08 :3 0 09 :3 0 10 :3 0 11 :3 0 12 :3 0 13 :3 0 14 :3 0 15 :3 0 17 :3 0 18 :3 0 19 :3 0 20 :3 0 21 :3 0 16 :3 0 09 :0 0 10 :0 0 11 :0 0 12 :0 0 13 :0 0 14 :0 0 15 :0 0 16 :0 0 17 :0 0 18 :0 0 19 :0 0 20 :0 0 21 :0 0 06 .1 0. 20 19 @ 0 6: 00 time wpsar vol 13, no 1, 2022 | doi: 10.5365/wpsar.2022.13.1.860 https://ojs.wpro.who.int/4 rajakrishnan et almass gathering foodborne outbreak in petaling district, malaysia food poisoning by b. cereus. the laboratory findings also strengthened the evidence for b. cereus as the causative pathogen because the pathogen was found in samples from the food handlers, food and environment. low bacterial load could explain the negative clinical samples and the mild symptoms exhibited by the cases. s. aureus is a gram-positive, sphere-shaped bacteria that is part of the normal flora of human skin and mucous membranes.7 poor hygiene practices by food handlers can increase the possibility of transferring s. aureus to prepared food,7 causing it to release enterotoxins that lead to the symptoms seen in this report.8 the possibility of s. aureus causing the foodborne outbreak was further strengthened by its presence in the tested sample of nasi lemak. additionally, the prolonged holding time of more than 4 hours increased the multiplication of the microorganisms leading to food poisoning.8 poor food safety and hygiene practices have been established as a major factor in foodborne outbreaks in malaysia and globally.9,10 regarding limitations, since food was only served after the mass gathering event was over, most participants had left the event site before investigation of the foodborne outbreak began. also, there was no official registry of event participants. this made it difficult to identify and interview participants, and explains the low number of participants in the study and the use of convenience sampling to identify controls. conclusion this report highlights the processes undertaken to identify cases and causative pathogens of a foodborne outbreak at a mass gathering, and measures taken to avoid future outbreaks. this study showed that the outbreak was preventable. recommendations to prevent future outbreaks include that organizers of mass gatherings engage with certified catering services only (e.g. by using the trust mycatering initiative established by the ministry of health malaysia, which provides certification to catering operators that comply with food safety requirements);11 that awareness campaigns, guidelines and policies be established to ensure that organizers of mass gatherings liaise with local health authorities to imwith the local health district authority before organizing future events, to ensure that preventive measures were taken, including inspection and sampling of food handling facilities. laboratory results a total of 77 samples were taken. none of the 33 rectal swabs or the nine vomitus samples tested positive for microorganisms. all five food samples were positive for at least one microorganism, namely bacillus cereus, staphylococcus aureus or coliforms. ten of the 22 environmental samples, and three of the eight hand swabs from the food handlers, tested positive for b. cereus and coliforms. discussion the outbreak of food poisoning at this mass gathering was probably caused by b. cereus and s. aureus. this was consistent with the symptoms and incubation period reported, and was further supported by the laboratory results from samples of suspected foods, kitchen equipment and food handlers, which isolated b. cereus and s. aureus. the combination of the ubiquitous nature of these organisms and their coexistence in food and the environment is a major concern for food safety. additionally, s. aureus food poisoning resembles that of b. cereus in terms of symptoms and incubation period.1,2 also, synergism has been observed between s. aureus sphingomyelinase and b. cereus phosphatidylcholine hydrolase.2 the most likely vehicle of the outbreak was the nasi lemak. the odds of its consumption in cases was 9.90 times that of controls, and this result was statistically significant. the other food items, despite being statistically significant, yielded odds of less than 1 (bread and rice with chicken), and the likely causative organisms are not commonly found in bottled water. b. cereus is a gram-positive rod that grows well in both aerobic and anaerobic environments. it produces an emetic toxin leading to the symptoms seen in these cases.3,4 plantbased foods – particularly rice, pasta and noodles – are common reservoirs for b. cereus.5,6 rice is the main ingredient in nasi lemak, enhancing the likelihood of wpsar vol 13, no 1, 2022 | doi: 10.5365/wpsar.2022.13.1.860https://ojs.wpro.who.int/ 5 mass gathering foodborne outbreak in petaling district, malaysiarajakrishnan et al references 1. elhabibi t, attia as, hashem a, ashour ms. characterization of bacillus cereus and staphylococcus aureus strains isolated from food and food products retailed in the egyptian markets. n egypt j microbiol. 2012;31:40–52. 2. kumar td, murali hs, batra hv. simultaneous detection of pathogenic b. cereus, s. aureus and l. monocytogenes by multiplex pcr. indian j microbiol. 2009;49(3):283–9. doi:10.1007/s12088-0090032-y pmid:23100783 3. dietrich r, jessberger n, ehling-schulz m, märtlbauer e, granum pe. the food poisoning toxins of bacillus cereus. toxins (basel). 2021;13(2):98. doi:10.3390/toxins13020098 pmid:33525722 4. granum pe, lund t. bacillus cereus and its food poisoning toxins. fems microbiol lett. 1997;157(2):223–8. doi:10.1111/j.1574-6968.1997.tb12776.x pmid:9435100 5. agata n, ohta m, yokoyama k. production of bacillus cereus emetic toxin (cereulide) in various foods. int j food microbiol. 2002;73(1):23–7. doi:10.1016/s0168-1605(01)00692-4 pmid:11883672 6. kramer jm, gilbert rj. bacillus cereus and other bacillus species. in: doyle mp, editor. foodborne bacterial pathogens. new york: marcel dekker, inc.; 1989. p. 21–70. 7. hennekinne ja, de buyser ml, dragacci s. staphylococcus aureus and its food poisoning toxins: characterization and outbreak investigation. fems microbiol rev. 2012;36(4):815–36. doi:10.1111/ j.1574-6976.2011.00311.x pmid:22091892 8. hennekinne ja. staphylococcus aureus as a leading cause of foodborne outbreaks worldwide. in: fetsch a, editor. staphylococcus aureus. london: london academic press; 2018. p. 129–46. 9. lema k, abuhay n, kindie w, dagne h, guadu t. food hygiene practice and its determinants among food handlers at university of gondar, northwest ethiopia, 2019. int j gen med. 2020;13:1129−37. doi:10.2147/ijgm.s262767 pmid:33235486 10. xu h, zhang w, guo c, xiong h, chen x, jiao x, et al. prevalence, serotypes, and antimicrobial resistance profiles among salmonella isolated from food catering workers in nantong, china. foodborne pathog dis. 2019;16(5):346–51. doi:10.1089/fpd.2018.2584 pmid:30657345 11. food safety and quality division. trust mycatering. federal territory of putrajaya: ministry of health malaysia; 2021. available from: http://fsq.moh.gov.my/v6/xs/page.php?id=12, accessed 4 november 2021. prove food handling and hygiene practices before events are held; and that stricter enforcement be considered for caterers and organizers that breach food handling and hygiene practices causing foodborne outbreaks. acknowledgements the authors would like to thank the director-general of health malaysia for permission to publish this paper. the authors give special thanks to all involved in the investigation and control of this outbreak, especially the food & waterborne unit, the disease control unit, the food safety and quality unit of petaling district health office, and the national public health laboratory and department of chemistry malaysia. our appreciation also goes to all the staff of the petaling district health office for their help and cooperation in giving general feedback to improve this paper. conflicts of interest the authors declare no conflicts of interest for this publication. ethics statement this study was approved by the medical research and ethics committee, ministry of health malaysia. funding the authors received no financial support for the research, authorship and/or publication of this article. https://ojs.wpro.who.int/ 1wpsar vol 13, no 1, 2022 | doi: 10.5365/wpsar.2022.13.1.889 surveillance system implementation/evaluation t he establishment of reliable and real-time epidemiological data on emerging and re-emerging infectious diseases is crucial for understanding transmission patterns and assessing the impact of public health intervention to mitigate outbreaks.1 however, during public health emergencies, routine surveillance channels can be overwhelmed; thus, realtime assessment may be hampered by insufficient information.2 in 1981, the government of japan established a laboratory-based surveillance system for infectious diseases. in 1999, this was expanded to include a system for patient reporting, and the act on the prevention of infectious diseases and medical care for patients with infectious diseases (hereafter, the infectious diseases control law) was enacted.3 collected data were integrated into this national surveillance system: the national epidemiological surveillance of infectious diseases (nesid) programme.3 to respond to emerging or reemerging diseases not defined in the surveillance system, surveillance of “undiagnosed serious infectious illness” is included in nesid to promote early detection of pathogens during public health emergencies.4 this surveillance system was used to detect and monitor coronavirus disease 2019 (covid-19) cases5 even before covid-19 was labelled as a “designated infectious disease” in japan by cabinet order on 28 january 2020.6 the designation mandated that health-care providers report all confirmed cases to public health centres in their local jurisdictions a data management team, the national covid-19 cluster taskforce, the ministry of health, labour and welfare, tokyo, japan. b graduate school of pharmaceutical sciences, the university of tokyo, tokyo, japan. c national institute of public health, saitama, japan. d jumonji university, saitama, japan. e department of virology, tohoku university graduate school of medicine, sendai, japan. f department of healthcare epidemiology, kyoto university, kyoto, japan. g center for surveillance, immunization and epidemiologic research, national institute of infectious diseases, tokyo, japan. h institute for frontier life and medical sciences, kyoto university, kyoto, japan. i hakubi center for advanced research, kyoto university, kyoto, japan. * these authors contributed equally. published: 31 march 2022 doi: 10.5365/wpsar.2022.13.1.889 in response to the outbreak of coronavirus disease 2019 (covid-19) in japan, a national covid-19 cluster taskforce (comprising governmental and nongovernmental experts) was established to support the country’s ministry of health, labour and welfare in conducting daily risk assessment. the assessment was carried out using established infectious disease surveillance systems; however, in the initial stages of the pandemic these were not sufficient for real-time risk assessment owing to limited accessibility, delay in data entry and inadequate case information. also, local governments were publishing anonymized data on confirmed covid-19 cases on their official websites as daily press releases. we developed a unique database for nationwide real-time risk assessment that included these case lists from local government websites and integrated all case data into a standardized format. the database was updated daily and checked systematically to ensure comprehensiveness and quality. between 15 january 2020 and 15 june 2021, 776 459 cases were logged in the database, allowing for analysis of real-time risk from the pandemic. this semi-automated database was used in daily risk assessments, and to evaluate and update control measures to prevent community transmission of covid-19 in japan. the data were reported almost every week to the japanese government advisory panel on covid-19 for public health responses. integration of publicly available case-based data for real-time coronavirus disease 2019 risk assessment, japan kota ninomiya,a,b,c* mariko kanamori,a* naomi ikeda,a,d* kazuaki jindai,e,f* yura k ko,g kanako otani,g yuki furuse,h,i hiroki akaba,e reiko miyahara,g mayuko saito,e motoi suzukig and hitoshi oshitanie correspondence to hitoshi oshitani (email: oshitanih@med.tohoku.ac.jp) wpsar vol 13, no 1, 2022 | doi: 10.5365/wpsar.2022.13.1.889 https://ojs.wpro.who.int/2 ninomiya et alpublicly available patient data for real-time coronavirus disease 2019 tion for more accurate situation analysis and rapid risk assessment to bolster public health decision-making. in this report, we describe the development of such a database that supported real-time risk assessment and its impact on policies for managing the covid-19 pandemic. database development the new database used publicly available data from daily press releases published on local government websites.9 each local government releases anonymized individual case data and aggregated daily case numbers on their website. although the cabinet secretariat (https://cio.go.jp/policy-opendata) recommended that local governments share data with the public in a universal format (e.g. a file of comma-separated values) in line with the five-star open data model,10 the press release format was not standardized or consistent across local governments, especially during the early phase of the pandemic. some press releases were published as pdf files or embedded directly in the html, whereas others described cases in text not in tables. therefore, the case information needed to be converted and integrated into a standardized data format within a single database. initially, we extracted the case information manually from each local government website with support from volunteers; however, this was labour-intensive and required significant resources. subsequently, we developed a programme written in python programming language11 to automate extraction of information directly from the websites and its conversion to tabular form. the database contained the following variables for each case: official reporting date, reporting prefecture, prefectural case identification number, reporting municipality, municipal case identification number, age, sex, occupation, residence (limited to prefecture and municipality), onset date, confirmation date, presence of symptoms at the time of confirmation, history of overseas travel, history of domestic travel and epidemiological link with other confirmed cases. database management initially, quality assurance of the data was performed manually, with an algorithm developed in python to detect possible data errors, including abnormal values, under the infectious diseases control law.3 thereafter, the collected data were confirmed by local governments and ultimately reported to the ministry of health, labour and welfare (mhlw). the government also established the national covid-19 cluster taskforce (comprising governmental and nongovernmental experts) on 25 february 2020, to support the mhlw’s efforts.7 the taskforce members analysed current case and cluster data, conducted daily risk assessments and provided technical advice for public health decision-making. the surveillance data from nesid were initially used for this analysis; however, the data were not available to nongovernmental experts owing to privacy issues. also, the surveillance data were inadequate for timely analyses of community transmission of this emerging infection because they were not designed to report cases on a day-to-day basis. the standard surveillance process involves health-care facilities that diagnose cases sending case information to the public health centre in their jurisdiction via fax for registration; at the health centre, the data are manually entered into the system for further verification and reporting.3 as the covid-19 case numbers grew, the reporting process became overwhelmed, leading to significant delays in reporting to public health authorities. also, the standard reporting form did not include variables essential for risk analysis of covid-19 transmission, such as history of contact with confirmed cases, being in a possible spreading event or travel history from an epidemic area or country. to alleviate these issues, the mhlw asked local governments to send daily case information in a spreadsheet directly to the mhlw via email.8 this updated surveillance process also had reporting delays and discrepancies between the number of cases reported by local governments and those reported by the mhlw as the pandemic unfolded throughout japan. the reporting delay by local governments to the mhlw could exceed 1 week in some instances. data entry errors such as spelling and typographical errors were also recognized. these shortcomings made it difficult for the national covid-19 cluster taskforce to analyse the epidemiological situation and conduct realtime risk assessment to inform decision-making. therefore, another system of data collection was urgently needed to collect and integrate case informawpsar vol 13, no 1, 2022 | doi: 10.5365/wpsar.2022.13.1.889https://ojs.wpro.who.int/ 3 publicly available patient data for real-time coronavirus disease 2019ninomiya et al fig. 1. daily operating procedures of the covid-19 database, japan most cases were younger and either pre-symptomatic or asymptomatic.14 epidemiological analysis and real-time risk assessment results based on this database have been presented to the japanese government advisory panel on covid-19 to evaluate the effectiveness of public health measures against covid-19. the government’s covid-19 dashboard (https://covid19.mhlw.go.jp), which uses data not accessible to the public, was also refined to be used for the visualization of epidemiological data in parallel with our database. because our database and the government’s database were not cross-checked or merged, the advisory panel analysed data summaries from both databases to identify discrepancies between them and improve their quality. furthermore, comparing analyses from both datasets provided a multifaceted perspective to help experts conduct risk assessments. discussion the development of a reliable database during a public health emergency is challenging. high numbers of cases can overwhelm pre-existing surveillance systems, necessitating an alternative system. basic demographic information derived from a reliable database is required for real-time risk assessment and policy-making. we successfully developed an integrated database platform missing data, inconsistencies in japanese characters (kanji) and categorical variables (e.g. occupation and place of residence). these errors were corrected daily. we developed a standard operating procedure for updating case information without errors (fig. 1). the database automatically collected press releases from websites in the morning, then a manual verification process was used to ensure the data entry was correct. next, we semi-automatically modified abnormal values before calculating epidemiological parameters, which were then used by the cluster taskforce for their risk assessment. close collaboration with data users, such as governmental officers and experts, allowed their feedback to improve database development and maintenance. results the database included 776 459 cases from 15 january 2020 to 15 june 2021 (table 1), from which daily epidemic curves and geographical maps were created.12 epidemiological information on the first few hundred cases was derived from the database.13 further epidemiological parameters (e.g. effective reproduction number, proportion of unlinked cases, age and sex distribution, symptom onset and confirmation delay) were derived from the database for real-time risk assessment. an analysis of clusters in the early phase showed that local governments report case information as of the previous day local governments report case information as of the current day automatically collect press releases and standardize case information manually correct mistakes that require human judgement 0:00 6:00 12:00 18:00 24:00 time semi-automatically modify abnormal values for quality assurance calculate epidemiological parameters make risk assessment wpsar vol 13, no 1, 2022 | doi: 10.5365/wpsar.2022.13.1.889 https://ojs.wpro.who.int/4 ninomiya et alpublicly available patient data for real-time coronavirus disease 2019 table 1. list of variables included in the covid-19 database from 15 january 2020 through 15 june 2021 (n = 776 459), japan balancing privacy protection with the need for granular personal data for public health analyses during health emergencies has been controversial. using press release data that do not include identifying information (as per local government policy) allowed for the sharing of outputs with nongovernmental officers with minimal risk to private information. the database provided consistent reporting of cases nationally, which in turn allowed for information to be shared among local governments, particularly where cases had travelled to multiple prefectures. that collected press release information from local government websites. similar processes have been used in other asian countries and regions, such as taiwan (china), hong kong special administrative region (china) and singapore, where data from governmentissued press releases on new covid-19 cases have been used for studies to investigate transmission patterns or to evaluate interventions.15,16 our database was used for conducting research activities, and also served as a real-time monitoring tool to support public health decision-making in the outbreak setting. variables description coverage, n (%) reporting prefecture name of the prefecture where the case was reported 776 459 (100) case identification number by prefecture serial number of the case in the reporting prefecture 720 726 (92.8) reporting municipality name of the municipality where the case was reported 275 149 (35.4) case id by municipality serial number of the case in the reporting municipality 263 564 (33.9) age age stratum by decade 668 250 (86.1) sex male or female 662 444 (85.3) occupation case’s occupation type: health-care professional, public servant, office worker, corporate executive, educational professional, self-employment, unemployment, other 386 874 (49.8) residential prefecture name of the prefecture where the case resides 692 084 (89.1) residential municipality name of the municipality where the case resides 506 075 (65.2) onset date date of illness onset 402 855 (51.9)a date of confirmation date that sars-cov-2 infection was confirmed 540 027 (69.5) date of official announcement date the case was announced by the prefecture or municipality 776 024 (99.9) presence of symptoms at the time of confirmation whether the case had any symptoms when sars-cov-2 infection was confirmed 416 837 (53.7) history of overseas travel whether the case had a history of overseas travel before the infection was confirmed 474 (0.1) history of domestic travel whether the case had a history of domestic travel before the infection was confirmed 13 558 (1.7) epidemiological link whether the case had a history of close contact with other positive cases or a history of staying in a clustered location known to be associated with more than one infected case before the infection was confirmed 326 693 (42.1) re-positive if an infected person tested positive again after testing negative 353 (0.05) a these calculations included asymptomatic cases. if asymptomatic cases were excluded (n = 710 553), the coverage of onset date would be 56.3% (n = 400 350). wpsar vol 13, no 1, 2022 | doi: 10.5365/wpsar.2022.13.1.889https://ojs.wpro.who.int/ 5 publicly available patient data for real-time coronavirus disease 2019ninomiya et al ethics approval this study was exempt from institutional review board approval because it involved secondary analysis of publicly available, de-identified data. funding this work was funded by research grants from the ministry of health, labour and welfare, japan (grant no. jmph20ha2007) and the japan agency for medical research development (grant no. jp19fk0108104). references 1. morgan ow, aguilera x, ammon a, amuasi j, fall is, frieden t, et al. disease surveillance for the covid-19 era: time for bold changes. lancet. 2021;397(10292):2317–9. doi:10.1016/ s0140-6736(21)01096-5 pmid:34000258 2. white lf, pagano m. reporting errors in infectious disease outbreaks, with an application to pandemic influenza a/h1n1. epidemiol perspect innov. 2010;7:12. doi:10.1186/1742-55737-12 pmid:21159178 3. infectious disease surveillance system in japan. tokyo: center for surveillance, immunization and epidemiologic research, national institute of infectious diseases; 2018. available from: https://www.niid.go.jp/niid/images/epi/nesid/nesid_en.pdf, accessed 18 november 2021. 4. 10th taskforce meeting for scientific innovation for tokyo 2020 olympic and paralympic games [in japanese]. tokyo: cabinet office, government of japan; 2019. available from: https:// www8.cao.go.jp/cstp/tyousakai/olyparasuishin/10kai/10kai. html, accessed 18 november 2021. 5. national institute of infectious diseases. demographics of the first 12 cases of covid-19 reported in japan [in japanese]. infectious agents surveillance report. 2020;41:48–9. available from: https://www.niid.go.jp/niid/ja/2019-ncov/2488-idsc/iasrnews/9387-481p01.html, accessed 18 november 2021. 6. japan: cabinet issues orders relating to infectious disease control act and quarantine act. washington, dc: library of congress; 2020. available from: https://www.loc.gov/item/global-legalmonitor/2020-03-11/japan-cabinet-issues-orders-relating-toinfectious-disease-control-act-and-quarantine-act/, accessed 29 march 2022. 7. oshitani h. expert members of the national covid-19 cluster taskforce at the ministry of health, labour and welfare, japan. cluster-based approach to coronavirus disease 2019 (covid-19) response in japan, from february to april 2020. jpn j infect dis. 2020;73(6):491–3. doi:10.7883/yoken.jjid.2020.363 pmid:32611985 8. notification by the ministry of health, labour and welfare. request of number of cases who visit covid-19 consultation centers [in japanese]. okayama prefecture: ministry of health, labour and welfare; 2020 feb 1. available from: https://www.pref. okayama.jp/uploaded/attachment/267818.pdf, accessed 18 november 2021. one of the limitations of this database is that the reporting format for some variables differed across local governments and phases. also, some variables were partially or entirely missing from the data recorded by some local governments,9 and local reporting forms were sometimes reformatted without notification, requiring updating of the database processes; hence, it was difficult to share consistent coding scripts for collecting information. furthermore, the quality of the data from each local government varied depending on workload, especially for data on epidemiological links from active surveillance at public health centres. detailed clinical data and disease outcomes were not publicly available. despite the limitations, this semi-automated database based on publicly available data was useful for monitoring pandemic trends, conducting real-time risk assessment and assessing the impacts of public health policies. no additional cost for computing resources or software was required apart from a few personal computers to manage our database; also, abstracting sufficient data from open-source data was technically straightforward. therefore, our method could be adapted for use in resource-constrained settings and could serve as a meaningful model for other countries to create similar databases during public health emergencies. based on this experience, we recommend that countries develop legislation and establish systems that can extract and store anonymized case information from publicly provided information to supplement routine surveillance systems. acknowledgements the authors thank the local governments, public health centres, public health institutes and the national institute of infectious diseases, japan, for their work on surveillance, laboratory testing, epidemiological investigations and data collection. we also thank all members of the national covid-19 cluster taskforce and volunteers in its data management team. conflicts of interest mariko kanamori was a research fellow of the japan society for the promotion of science. the other authors declare no conflicts of interest. wpsar vol 13, no 1, 2022 | doi: 10.5365/wpsar.2022.13.1.889 https://ojs.wpro.who.int/6 ninomiya et alpublicly available patient data for real-time coronavirus disease 2019 14. furuse y, sando e, tsuchiya n, miyahara r, yasuda i, ko yk, et al. clusters of coronavirus disease in communities, japan, january–april 2020. emerg infect dis. 2020;26(9):2176–9. doi:10.3201/eid2609.202272 pmid:32521222 15. summers j, cheng hy, lin hh, barnard lt, kvalsvig a, wilson n, et al. potential lessons from the taiwan and new zealand health responses to the covid-19 pandemic. lancet reg health west pac. 2020;4:100044. doi:10.1016/j.lanwpc.2020.100044 pmid:34013216 16. adam dc, wu p, wong jy, lau ehy, tsang tk, cauchemez s, et al. clustering and superspreading potential of sars-cov-2 infections in hong kong. nat med. 2020;26(11):1714–9. doi:10.1038/s41591-020-1092-0 pmid:32943787 9. notification by the ministry of health, labour and welfare (japan). disclosure of information for covid-19 outbreak [in japanese]. tokyo: ministry of health, labour and welfare; 2020. available from: https://www.mhlw.go.jp/content/000652973.pdf, accessed 11 july 2021. 10. berners-lee t. 5-star open data [internet]. available from: http://5stardata.info/, accessed 18 november 2021. 11. van rossum g, drake fl. python 3 reference manual. scotts valley, ca: createspace; 2009. 12. japan data. response covid-19; 2020. available from: https://www. responsecovid19.org/japan/data/, accessed 11 july 2021. 13. furuse y, ko yk, saito m, shobugawa y, jindai k, saito t, et al. epidemiology of covid-19 outbreak in japan, from january– march 2020. jpn j infect dis. 2020;73(5):391–3. doi:10.7883/ yoken.jjid.2020.271 pmid:32350228 https://ojs.wpro.who.int/ 1wpsar vol 11, no 4, 2020 | doi: 10.5365/wpsar.2020.11.3.001 surveillance report a university of sydney, concord repatriation general hospital, department of gastroenterology and liver services, hospital road concord, sydney, australia. b department of infection and tropical medicine, sheffield teaching hospitals, sheffield, united kingdom. c popondetta general hospital, popondetta, papua new guinea. d siroga clinic, new britain palm oil company, ltd, popondetta, papua new guinea. e hepatitis b free, sydney, australia. f departments of internal medicine and pediatrics and center for space medicine, baylor college of medicine, houston (tx), usa. published: 16 december 2020 doi: 10.5365/wpsar.2020.11.3.001 h epatitis b is a leading cause of morbidity and mortality worldwide; it is responsible for about 900 000 deaths annually, and nearly 300 million people suffer from chronic hepatitis b (chb).1 the prevalence of chb in papua new guinea (png) has been estimated to be 14.6%;2 however, numerous barriers hinder accurate country-wide accounting, as over 80% of the 8 million inhabitants of png live in geographically remote areas with limited access to health services, and strong beliefs in traditional healing foster a distrust of western medicine. chb is a major cause of morbidity and mortality in png and the leading cause of cirrhosis and hepatocellular carcinoma.3 complications of liver cirrhosis, including ascites and variceal bleeding, are reported by local physicians as among the most common reasons for hospital admission. as a result, populationwide screening is critical, with follow-up vaccination of those who are hepatitis b surface antigen (hbsag) negative and treatment for those who test positive. volunteers from hepatitis b free (hbf), an australian non-profit organization, were invited by community leaders and provincial health officials in oro province in png to address the gap in vaccination against hepatitis b in remote villages. in 2013, hbf donated rapid test kits for hbsag and began testing and vaccinating individuals in remote communities. volunteers from hbf travel regularly to png and have established a formal partnership with the oro provincial government, the provincial health department, popondetta general hospital and a private company, new britain palm oil ltd. the company is a large employer in oro province and provides health care to employees and families as well as to local nonaffiliated patients through a network of health clinics and aid posts. in 2019, tenofovir disoproxil fumarate (tdf), a drug with proven efficacy against chb, was approved for use by the national government, and the first patients have been started on tdf according to who treatment guidelines,4 while population screening continues in government hospitals, outreach health fairs and companyoperated clinics. this report describes surveillance of the large cohort of patients who have been tested since 2014. methods ethical approval for the hepatitis b testing and treatment programme was obtained from the medical research advisory committee of png (mrac no. 18–13). all people chronic hepatitis b (chb) affects over 250 million people worldwide. in papua new guinea, the prevalence of chb has been estimated to be over 8%, and it is a leading cause of death. to address this problem, an alliance was formed between the government of oro province, a large private employer and an australian nongovernmental organization, which established a chb test and treatment programme. between 2014 and 2019, rapid hepatitis b surface antigen testing was performed on 4068 individuals in oro province. the crude prevalence rate was 12.98% and was significantly higher in males (15.26%) than females (10.94%) (p < 0.001). the rate was 4.72% among children aged 10 years and under, 12.81% among women of childbearing age (19–35 years) and 18.48% among health-care workers. these results indicate that the rates of vaccination at birth and later among women of childbearing age and health-care workers must be improved to prevent transmission of chb. prevalence of chronic hepatitis b in oro province, papua new guinea alice unah lee,a luke mair,b bob kevin,c lily gandi,d olive tarumuri,d caroline lee,e sue huntleye and david carl hilmersf correspondence to david carl hilmers (email: dhilmers@bcm.edu) wpsar vol 11, no 4, 2020 | doi: 10.5365/wpsar.2020.11.3.001 https://ojs.wpro.who.int/2 hilmers et alprevalence of chronic hepatitis b in papua new guinea awareness. the overall prevalence of 12.98% is lower than previous estimates (14.6%).6 as seen elsewhere,7 we found higher rates among men than women, with the highest prevalence among men aged 36–49 years (21.90%). the three-dose hbv vaccine was included in the national immunization schedule in 1989, and vaccination at birth was added in 1992.8 a nationwide, four-stage cross-sectional cluster survey among 2109 children aged 4–6 years during 2012–2013 showed an hbv seroprevalence of 2.3%, which is higher than the who western pacific regional goal of <1% for children under 5 years.9 in our study, the prevalence was 3.29% among children under 5 years and 4.72% in children under 10 years, which are also higher than the who goal. the coverage of vaccination against hbv at birth in png is only 31% because of factors such as lack of vaccine and of adequate refrigeration.9 as many women give birth at home without a skilled attendant, timely delivery of a birth dose is difficult. another study concluded that lack of knowledge about the birth dose among health workers contributed to delay in giving the vaccine.10 the high prevalence of hbv among adolescent girls, women of childbearing age and health-care workers indicates that testing and vaccination should be improved. health-care workers are a priority, as they are at risk for both infection and transmission to patients. universal testing of pregnant women is essential, and antenatal treatment for chb with new protocols should be considered in order to decrease the risk of vertical transmission. other high-risk groups, including people with hiv and tuberculosis, are not routinely screened for hbv. the prevalence of hiv infection is 0.9% in the general adult population and higher in high-risk groups.3 it is presumed that co-infection with hbv is significant, but testing is often not performed because of lack of availability of rapid testing kits. it is unclear why chb appeared to be so prevalent (11.29%) among people who reported previous vaccination. some may have received fewer than the recommended three doses, mis-reported the type of vaccine administered or were vaccinated when they were already infected but did not know their status. some may have become infected despite having been vaccinated. attending routine visits to clinics, at community health fairs and during clinical evaluation of symptoms such as abdominal pain were considered eligible and were screened for hbsag during the period may 2014–october 2019. they were informed of the reason for screening by a health-care worker fluent in their native language and were given the opportunity to ask questions and refuse testing. those who tested positive were counselled about the risk of transmission, precautions to take and future treatment options and were referred to hepatitis clinics for evaluation. a who pre-approved rapid hbsag test, sd bioline (abbott corp., usa), was used. the reported sensitivity and specificity of this test are 100% and 98.7%, respectively.5 univariate analyses for gender and hbsag positivity were performed with χ2 tests, and p = 0.05 was considered significant. subgroup analyses were performed after stratification by age, gender and population. results between 2014 and the end of 2019, 4068 tests were performed. the refusal rate could not be calculated precisely but is estimated to be <10%. the overall prevalence of hbsag positivity was 12.98% (table 1). males were more likely than females to have positive results (x2 1, n = 4068) = 16.75, p < 0.001. the 36–49 years age group had the highest prevalence (16.90%), and that of men in this age range was 21.90%. the rate was 3.29% among children under 5 years, 4.72% for those under 10 years and 7.06% for those aged 5–15 years. the prevalence among women of prime childbearing age (19–35 years) was 12.81%, while that among women aged 36–49 years was 11.41%, and the rate among girls aged 11–18 years was 6.55%. of the 92 health-care workers tested, 17 had positive results (18.48%) (fig. 1). of 4068 individuals tested, only 1134 had either documentation of vaccination or could recall that they had been vaccinated. in this group of 1134, 256 (11.29%) were hbsag positive. among children under 5 years, 118 were known to have been vaccinated, but 5 (4.31%) were hbsag positive. discussion our results show high rates of chb in oro province, despite recent efforts to increase vaccination and public wpsar vol 11, no 4, 2020 | doi: 10.5365/wpsar.2020.11.3.001https://ojs.wpro.who.int/ 3 prevalence of chronic hepatitis b in papua new guineahilmers et al education, community hbsag screening and birth-dose vaccination, which have been prioritized in oro province, must be implemented nationwide to achieve the who goal of elimination of hepatitis b by 2030. conclusions we found high rates of chb in the general population, especially among children under 5 years, women of child-bearing age and health-care workers. the data should assist local and national stakeholders in designing policies and guidelines for therapy and for the prevention of chb, including vaccination of newborns and at-risk groups, and consideration of prophylactic treatment of hbsag-positive pregnant women to prevent vertical transmission of hepatitis b. the results should be used to inform policy-makers, mobilize resources and encourage funding from internal and external organizations to reduce the burden of chb in png. the strengths of this study include the large cohort, the inclusion of individuals in remote areas and use of a sensitive rapid test kit. the limitations include opportunistic testing, possible recall bias of vaccination status and lack of data on co-infection with hiv, hepatitis c virus or tuberculosis. the refusal rate was difficult to calculate; if it was high, the representativeness of the sample would have been biased. as testing was limited to a single province, the results cannot be generalized to the national population. an antiviral medication, tdf, has been approved for use in png. the first patients were started on treatment in oro province in november 2019 through the consortium described above. travel restrictions due to covid-19 and lack of reagents have slowed the required pre-treatment evaluations, and, thus far, only 20 patients are currently on medication. consideration should be given to extending treatment to hbv-positive pregnant women. public table 1. numbers and percentages of persons positive for hepatitis b surface antibody, by age and gender fig. 1. proportions of persons positive for hepatitis b surface antigen, by age and gender age range (years) positivity males females total (%) total (no.) positive (no. (%)) total (no.) positive (no. (%)) 0–10 233 14 (6.01) 233 8 (3.43) 4.72 11–18 131 14 (10.69) 229 15 (6.55) 8.06 19–35 934 146 (15.63) 1132 145 (12.81) 14.09 36–49 452 99 (21.90) 412 47 (11.41) 16.90 ≥50 170 20 (11.76) 142 20 (14.08) 12.82 total 1920 293 (15.26) 2148 235 (10.94) 12.98 male female 0–10 11–18 19–35 36–49 50+ age range (years) 25% 20% 15% 10% 5% 0% p os it iv e wpsar vol 11, no 4, 2020 | doi: 10.5365/wpsar.2020.11.3.001 https://ojs.wpro.who.int/4 hilmers et alprevalence of chronic hepatitis b in papua new guinea 4. guidelines for the prevention, care and treatment of persons with chronic hepatitis b infection. geneva: world health organization; 2015. 5. who prequalification of in vitro diagnostics. public report. product: sd bioline hbsag wb. geneva: world health organization; 2017. available from: https://www.who.int/diagnostics_laboratory/evaluations/pq-list/hbsag/171222_pq_final_report_pqdx_0219_012_00.pdf?ua=1#:~:text=in%20this%20 limited%20evaluation%20on,compared%20to%20the%20reference%20assays, accessed 19 march 2020. 6. global hepatitis report. geneva: world health organization; 2017. 7. ott jj, stevens ga, groeger j, wiersma st. global epidemiology of hepatitis b virus infection: new estimates of age-specific hbsag seroprevalence and endemicity. vaccine. 2012;30(12):2212– 9. 8. wiesen e, lagani w, sui g, arava j, reza s, diorditsa s, et al. assessment of the hepatitis b birth dose vaccination program, papua new guinea, 2014. vaccine. 2016;34(3):367–72. 9. kitau r, datta ss, patel mk, hennessey k, wannemuehler k, sui g, et al. hepatitis b surface antigen seroprevalence among children in papua new guinea, 2012–2013. am j trop med hyg. 2015;92(3):501–6. 10. downing sg, lagani w, guy r, hellard m. barriers to the delivery of the hepatitis b birth dose: a study of five papua new guinean hospitals in 2007. p n g med j. 2008;51(1–2):47–55. conflicts of interests none of the authors report a conflict of interest. data collection was not funded by any external organization. the manuscript was not prepared during a field epidemiology training programme or a western pacific surveillance and response scientific writing workshop. references 1. razavi-shearer d, gamkrelidze i, nguyen mh, chen ds, van damme p, abbas z, et al. global prevalence, treatment, and prevention of hepatitis b virus infection in 2016: a modelling study. lancet gastroenterol hepatol. 2018;3(6):383–403. 2. hepatitis data and statistics in the western pacific. geneva: world health organization; 2018. available from: https://www.who.int/ westernpacific/health-topics/hepatitis/regional-hepatitis-data, accessed 19 march 2020. 3. murthy dp, sen gupta sk, thurley jl, cooke ra. liver disease in papua new guinea 1981 to 1988, twenty years after the first surveys were done. p n g med j. 1995;38(1):6–15. https://www.who.int/diagnostics_laboratory/evaluations/pq-list/hbsag/171222_pq_final_report_pqdx_0219_012_00.pdf?ua=1#:~:text=in this limited evaluation on,compared to the reference assays https://www.who.int/diagnostics_laboratory/evaluations/pq-list/hbsag/171222_pq_final_report_pqdx_0219_012_00.pdf?ua=1#:~:text=in this limited evaluation on,compared to the reference assays https://www.who.int/diagnostics_laboratory/evaluations/pq-list/hbsag/171222_pq_final_report_pqdx_0219_012_00.pdf?ua=1#:~:text=in this limited evaluation on,compared to the reference assays https://www.who.int/diagnostics_laboratory/evaluations/pq-list/hbsag/171222_pq_final_report_pqdx_0219_012_00.pdf?ua=1#:~:text=in this limited evaluation on,compared to the reference assays https://www.who.int/diagnostics_laboratory/evaluations/pq-list/hbsag/171222_pq_final_report_pqdx_0219_012_00.pdf?ua=1#:~:text=in this limited evaluation on,compared to the reference assays https://www.who.int/westernpacific/health-topics/hepatitis/regional-hepatitis-data https://www.who.int/westernpacific/health-topics/hepatitis/regional-hepatitis-data https://ojs.wpro.who.int/ 1wpsar vol 12, no 3, 2021 | doi:10.5365/wpsar.2019.10.4.002 surveillance report t he world health organization (who) reported 413 308 confirmed measles cases in 187 member states as of 5 november 2019.1 this was the fourth successive yearly increase since 2016: a total of 353 236 cases were recorded in 2018, double the number reported in 2017.2 outbreaks were occurring in countries with low immunization coverage, as well as in countries with high national vaccination rates. the consecutive increases were a setback to the progress made towards measles elimination. the world health assembly endorsed the global vaccine action plan in 2012, and measles was targeted for elimination in five who regions by 2020.3 who defines measles elimination as the absence of endemic transmission in a defined geographical area for more than 12 months in the presence of a well-performing surveillance system. progress towards measles elimination has varied by who region. in the european region, 37 of 53 countries had eliminated measles by 2017.4 five of 11 countries in the south-east asia region and 9 of 37 countries in the western pacific region had also achieved elimination status by 2017.5,6 however, in the region of the americas, despite verification that measles had been eliminated in september 2016, the region reported its highest increase in cases in 2017, and endemic transmission of measles had been re-established in venezuela.7 no countries in the african region and the eastern mediterranean region were verified as having eliminated measles. who verified that singapore had eliminated endemic transmission of measles in october 2018. this paper documents the immunization and surveillance systems for measles and the evidence used to achieve elimination status. a communicable diseases division, ministry of health, singapore. b national public health laboratory, national centre for infectious diseases, singapore. c saw swee hock school of public health, national university of singapore, singapore. d infectious disease research and training office, national centre for infectious diseases, singapore. e public health group, ministry of health, singapore. published: 12 july 2021 doi:10.5365/wpsar.2019.10.4.002 the world health organization verified that singapore had eliminated endemic transmission of measles in october 2018. this report summarizes the evidence presented to the regional verification commission for measles and rubella elimination, comprising information about immunization schedules; laboratory testing protocols and the surveillance system; and data on immunization coverage and the epidemiology of cases. between 2015 and 2017, a total of 246 laboratory confirmed cases of measles were reported. the source or country of infection was unknown for most cases (195; 79.3%). there were 22 clusters, ranging from two to five cases. the most common genotypes detected were d8 and d9. transmission of b3 was interrupted in 2017, and h1 cases were sporadic and imported. phylogenetic analyses of the d8 isolates showed the existence of 13 lineages or clusters. although a few lineages were circulating concurrently, no lineage propagated continuously for a prolonged period, and transmission of each lineage eventually stopped. although cases and clusters were reported yearly, molecular data showed that none of the lineages resulted in prolonged transmission. there were fewer measles cases in 2017 compared with 2016. the higher number of clusters was likely due to the overall increase in cases because cluster sizes remained small. the occurrence of small clusters is not unexpected since measles is highly infectious. the majority of imported cases did not result in secondary transmission. with the global increase in the number of measles cases, singapore needs to stay vigilant and continue to promptly test suspected cases; vaccination is the key to preventing infection. singapore’s efforts to achieve measles elimination in 2018 wanhan see,a yi kai ng,b lin cui,b yuske kita,a steven peng-lim ooi,c,d vernon lee,a derrick mok kwee henge and raymond tzer pin linb correspondence to wanhan see (email: see_wanhan@moh.gov.sg) wpsar vol 12, no 3, 2021 | doi:10.5365/wpsar.2019.10.4.002 https://ojs.wpro.who.int/2 see et almeasles elimination, singapore with who’s guidance, the moh enhanced its measles surveillance in 2012 to proactively test clinical cases not swabbed by clinicians.15 medical practitioners are required to report suspected measles cases to the moh within 24 hours from the time of clinical suspicion, and laboratories are required to report within 24 hours of confirmation. all notifications (laboratory confirmed and clinically diagnosed) are investigated, and laboratory testing is offered to clinical cases if their symptoms fit the case definition.7 the clinical case definition of measles is fever and rash with cough or coryza or conjunctivitis. information is collected from cases during interview and includes the date of onset of symptoms, history of exposure, travel history and vaccination records. after the investigation and laboratory testing are completed, the case is classified as a confirmed case, clinical case or not a case. contact tracing is initiated if confirmed cases reside in dormitories or other institutions or attend school or childcare. public health advice is provided to all cases, and vaccination is recommended to unimmunized contacts. as per who’s recommendation,16 the moh ofmethods singapore followed who’s definition of measles elimination for the 2018 verification exercise. for verification purposes, countries need to provide evidence to fulfil who’s assessment criteria: documentation of the interruption of endemic measles and rubella virus transmission for a period of at least 36 months from the last known endemic case; the presence of verification standard surveillance; and genotyping evidence that supports the interruption of endemic transmission.8 this documentation was collated by the ministry of health (moh) for the period of 2015 to 2017, in consultation with singapore’s national verification committee, and included descriptions of the national immunization schedule, surveillance system and laboratory testing protocols as well as analysis of immunization coverage, the incidence and epidemiology of measles cases, and molecular analysis. these seven areas are presented in this paper. ethics statement no ethics approval was required. data were collected under the infectious diseases act of singapore (1976), and only unidentifiable data were used for analysis. results national immunization schedule measles vaccinations were first introduced in singapore for children in october 1976, becoming legally compulsory in 1985 for children aged 1–2 years under the infectious diseases act (1976). the cost of vaccination is covered by the moh at designated government healthcare facilities. in the 1990s, when the global numbers of measles cases were high and transmission occurred even in countries with high immunization rates, many countries, including singapore, adopted a two-dose schedule.11,12 the timeline of changes to singapore’s measles immunization schedule is summarized in table 1. surveillance system measles became a notifiable disease under the infectious diseases act (1976) in october 1980. in line table 1. timeline of changes to the measles vaccination schedule in singapore, 1976–2011 year changes 1976 introduction of the one-dose monovalent measles vaccine for children aged 12 to 24 months 1985 measles immunization becomes compulsory for entry into primary school 1990 monovalent measles vaccine is replaced with the trivalent mmr vaccine 1997 catch-up vaccination programme introduced in primary schools for unvaccinated children 1998 introduction of second dose of mmr vaccine to children in primary school at age 11 to 12 years 2008 the age for the second dose of mmr vaccine is lowered to 6 to 7 years 2011 the age for vaccination is lowered to 12 months for first dose and 15 to 18 months for second dose mmr: measles, mumps and rubella wpsar vol 12, no 3, 2021 | doi:10.5365/wpsar.2010.10.4.002https://ojs.wpro.who.int/ 3 measles elimination, singaporesee et al the overall seroprevalence for measles among the resident population aged 6 months to older than 45 years was 91.4% in 1989/1990, 91.5% in 1993 and 77.9% in 1998.14 incidence measles incidence is calculated using the number of confirmed cases among local residents that were notified to the moh, per 100 000 population. information on measles incidence and immunization rates includes historical data from 1981 to 2017. before 1985, when immunization coverage was low, measles incidence was as high as 88.5 cases/100 000. thereafter, incidence declined as vaccination uptake improved. however, whenever there was a drop in coverage, the incidence increased two to three years later, as demonstrated in 1992, 1993 and 1997 (fig. 1). following the introduction of the catch-up vaccination programme in 1997, measles incidence declined further to 2.9 cases/100 000 population in 1998. since then, the incidence has remained below 4.0 cases/ 100 000 (fig. 1). epidemiology of measles cases, 2015 to 2017 epidemiological information for measles cases notified to the moh from january 2015 to december 2017 was analysed. all notified cases were investigated, with specimens tested and classified according to the moh’s case definitions and who’s classification system.6,9 the source of infection was either imported if links were established with a case outside of singapore or had recent travel history, import-related if they had confirmed epidemiological links to an imported case or unknown if links were unable to be established to other confirmed cases. between 2015 and 2017, a total of 246 laboratory confirmed cases were reported, with the highest number of cases recorded in 2016 (table 2).17,18 during 2016, the number of cases increased from march and peaked in may, with a second peak observed in november (fig. 2). the age groups with the highest proportion of cases were those aged ≤4 years and 25–44 years fers post-exposure chemoprophylaxis in the form of the measles, mumps, rubella vaccine or immunoglobulin to high-risk contacts at designated hospitals. laboratory testing protocols after testing specimens and if the residual samples are sufficient, public hospital laboratories are required to send an aliquot of measles (blood or oral swab or both) tested by immunoglobulin m (igm) and polymerase chain reaction (pcr) to the national public health laboratory for testing for both measles and rubella. respiratory samples are tested concurrently for measles and rubella by pcr; if the sample is positive, this is followed by genotyping using the n-450 nucleocapsid region of the virus, as recommended by who. similarly, blood samples are concurrently tested for measles and rubella by igm. pcr testing is performed on blood samples that are igm positive if there is sufficient serum for rna extraction. for the cases not tested by clinicians, oral swabs are collected by the moh and dispatched to the national public health laboratory for testing. immunization coverage the yearly immunization rate refers to national coverage of dose 1 of measles vaccine for resident children at age 2 years. in 2011, delivery of dose 2 was lowered from age 12 years to age 15 to 18 months, in accordance with changes to the schedule. these data are collected through the national immunisation registry. when first introduced in the 1970s, the uptake rate of measles vaccination was low, as most people perceived that developing natural infection was an essential part of growing up.13 coverage gradually increased in the 1980s, especially after vaccination became compulsory in 1985, and it has been maintained at more than 90% since 1998 (fig. 1). coverage for the second dose has remained high since it was first rolled out. however, coverage decreased to below 90% in 2013, following a change in the schedule in 2011, which moved the first dose from being delivered at 12 to 24 months to being delivered at 12 months and the second dose from being delivered at age 6 to 7 years to being delivered at 15 to 18 months (table 1). the national immunisation registry, part of the health promotion board, sends reminder letters to parents of children who miss their scheduled vaccinations. wpsar vol 12, no 3, 2021 | doi:10.5365/wpsar.2019.10.4.002 https://ojs.wpro.who.int/4 see et almeasles elimination, singapore (fig. 3). the male to female case ratio was approximately 1:1 for all age groups. for most cases (195/246; 79.3%), the source or country of infection was unknown (table 2). three import-related cases were family members of a case, suggesting that most imported cases did not result in secondary transmission (fig. 2). of the 48 imported cases, the majority had travelled to or arrived from indonesia (21; 43.8%) or malaysia (9; 18.8%). a total of 22 clusters were reported, and the size of each cluster ranged from two to five cases (table 2). the largest cluster was reported in 2017, involving a french family of one adult and four children. all cases had similar onset dates and developed symptoms before arrival in singapore. the family had a history of exposure to a known measles case and either had not fig. 1. incidence of measles and vaccination coverage rates, singapore, 1981–2017a 0 10 20 30 40 50 60 70 80 90 100 0 10 20 30 40 50 60 70 80 90 19 8 1 19 8 2 19 8 3 19 8 4 19 8 5 19 8 6 19 8 7 19 8 8 19 8 9 19 9 0 19 9 1 19 9 2 19 9 3 19 9 4 19 9 5 19 9 6 19 9 7 19 9 8 19 9 9 20 0 0 20 0 1 20 0 2 20 0 3 20 0 4 20 0 5 20 0 6 20 0 7 20 0 8 20 0 9 20 1 0 20 1 1 20 1 2 20 1 3 20 1 4 20 1 5 20 1 6 20 1 7 v ac ci na tio n co ve ra ge o f b ot h do se s (% ) in ci de nc e/ 10 0 00 0 po pu la tio n year measles incidence immunization coverage (first dose) immunization coverage (second dose) before 2013 immunization coverage (second dose) 2013 onwards measles vaccination legally compulsory (august 1985) table 2. number of laboratory confirmed measles cases, clusters and genotypes reported in singapore, 2015–2017 a since june 2000, only laboratory confirmed cases have been reported. a import-related refers to a confirmed case with epidemiological links to an imported case. number of measles cases, clusters and genotypes year 2015 2016 2017 laboratory confirmed cases by source of infection 40 136 70 unknown 28 117 50 imported 11 18 19 import-relateda 1 1 1 clusters 3 14 5 samples genotyped 21 103 42 b3 1 37 0 d8 12 57 27 d9 7 8 14 h1 1 1 1 wpsar vol 12, no 3, 2021 | doi:10.5365/wpsar.2010.10.4.002https://ojs.wpro.who.int/ 5 measles elimination, singaporesee et al fig. 2. source of infection for laboratory confirmed measles cases, singapore, 2015–2017 0 5 10 15 20 25 30 35 ja nu ar y fe br ua ry m ar ch ap ril m ay ju ne ju ly au gu st se pt em be r o ct ob er n ov em be r d ec em be r ja nu ar y fe br ua ry m ar ch ap ril m ay ju ne ju ly au gu st se pt em be r o ct ob er n ov em be r d ec em be r ja nu ar y fe br ua ry m ar ch ap ril m ay ju ne ju ly au gu st se pt em be r o ct ob er n ov em be r d ec em be r 2015 2016 2017 n um be r of c as es date of notification by month and year unknown imported import-relateda a import-related refers to a confirmed case with epidemiological links to an imported case. a the numbers exclude cases in tourists. fig. 3. age distribution of laboratory confirmed measles cases, by age group, singapore, 2015–2017a 0 5 10 15 20 25 30 35 40 45 50 < 1 1–4 5–9 10–14 15–24 25–34 35–44 45–54 ≥ 55 n um be r of c as es age group (years) 2015 2016 2017 wpsar vol 12, no 3, 2021 | doi:10.5365/wpsar.2019.10.4.002 https://ojs.wpro.who.int/6 see et almeasles elimination, singapore 0 5 10 15 20 25 30 ja nu ar y fe br ua ry m ar ch a pr il m ay ju ne ju ly a ug us t s ep te m be r o ct ob er n ov em be r d ec em be r ja nu ar y fe br ua ry m ar ch a pr il m ay ju ne ju ly a ug us t s ep te m be r o ct ob er n ov em be r d ec em be r ja nu ar y fe br ua ry m ar ch a pr il m ay ju ne ju ly a ug us t s ep te m be r o ct ob er n ov em be r d ec em be r 2015 2016 2017 n um be r o f c as es onset of rash by month and year b3 source unknown b3 imported b3 import-relateda d8 source unknown d8 imported d9 source unknown d9 imported d9 import-relateda h1 imported fig. 4. distribution of measles genotypes by source of infection and date of onset of rash, singapore, 2015–2017 a import-related refers to a confirmed case with epidemiological links to an imported case. genotype was d8 (96; 57.8%), followed by d9 (29; 17.5%) (fig. 4). an increase in the b3 genotype was observed between february and may 2016, with no further cases in 2017. none of the imported h1 genotype cases resulted in secondary transmission. the maximum likelihood tree of measles genotypes is shown in fig. 5a. phylogenetic analyses of the d8 isolates showed that 13 lineages or clusters occurred from 2016 to mid-2018 (fig. 5b). the d8 phylogenetic tree clusters isolates from cases that were epidemiologically linked together. although the imported cases were found to be genetically clustered with cases from an unknown source, our investigations could not establish links between the cases.9 when the onset dates were compared, some of the imported cases occurred after the cases from an unknown source; hence, it is unlikely that these cases were directly linked (fig. 6). an analysis of cases from the 13 d8 lineages showed that although a few lineages were circulating concurrently at one point, no lineage propagated continuously for a prolonged period (>12 months) (fig. 6). been vaccinated or were unsure of their vaccination history. genotyping of the respiratory samples obtained from the family were positive for d8. molecular analysis genotypes were identified based on the n-450 sequences of measles specimens obtained from confirmed cases from 2015 to 2017. the sequences obtained from january 2016 to june 2018 were further analysed by constructing a maximum likelihood tree with 500 bootstraps using mega7 (molecular evolutionary genetics analysis, version 7.0).10 measles genotype d8 isolates from the same cluster or lineage were given a group number to distinguish them from other measles d8 clusters or lineages. no group number was given to d8 isolates that were phylogenetically distinct and did not form a cluster. molecular epidemiology was used to retrospectively chart the grouped clusters based on the date of onset of rash to identify the d8 lineages circulating between january 2017 and june 2018. genotype results were available for 166 cases (67.5%) (table 2), and the most commonly detected wpsar vol 12, no 3, 2021 | doi:10.5365/wpsar.2010.10.4.002https://ojs.wpro.who.int/ 7 measles elimination, singaporesee et al fig. 5a. maximum likelihood tree, measles genotypes, singapore, 2016 to mid-2018 wpsar vol 12, no 3, 2021 | doi:10.5365/wpsar.2019.10.4.002 https://ojs.wpro.who.int/8 see et almeasles elimination, singapore fig. 5b. maximum likelihood tree, measles genotype d8, singapore, 2016 to mid-2018 wpsar vol 12, no 3, 2021 | doi:10.5365/wpsar.2010.10.4.002https://ojs.wpro.who.int/ 9 measles elimination, singaporesee et al wpsar vol 12, no 3, 2021 | doi:10.5365/wpsar.2019.10.4.002 https://ojs.wpro.who.int/10 see et almeasles elimination, singapore however, this method does not provide the same phylogenetic resolution for the rest of the genotypes. hence, moving forward, it is recommended to consider sequencing the extended window of the m-f non-coding region of the measles genome or perform whole genome sequencing on other common genotypes to provide molecular evidence to support case investigations and trend analyses.20 the increase in cases observed in 2016 did not continue into 2017, and the higher number of clusters in 2016 was likely due to the increase in cases as cluster sizes remained small. the occurrence of small clusters is not unexpected since measles is highly infectious. in addition, most imported cases did not result in secondary transmission. the proportion of cases by age group did not differ greatly across the three years. the highest proportion of cases occurred among children aged ≤4 years. other discussion our analysis provides the evidence for singapore to be verified as having measles elimination status – there is a well-performing surveillance system for measles and an absence of endemic transmission for more than 12 months. although measles cases and clusters were reported yearly, molecular data suggested that none of the lineages resulted in prolonged transmission within singapore. a variety of genotypes were detected in singapore, similar to other countries in the western pacific region.12,19 supported by phylogenetic analysis of d8 lineages, our data show that endemic transmission of measles did not occur in singapore during 2015–2017. the n-450 nucleotide sequences from the nucleocapsid required by who’s measles nucleotide surveillance (or means) database provide adequate phylogenetic resolution to resolve the groupings or lineages for d8. fig. 6. distribution of measles d8 lineages by epidemiological week of onset of rash, singapore, 2016 to mid-2018 0 1 2 3 4 5 6 7 8 9 1 3 5 7 9 111315171921232527293133353739414345474951 1 3 5 7 9 111315171921232527293133353739414345474951 1 3 5 7 9 111315171921 2016 2017 2018 n um be r of is ol at es epidemiological week and year group 1 group 1 (import) group 2 group 3 (import) group 4 group 4 (cluster) group 5 group 5 (cluster) group 6 group 6 (import) group 7 group 8 group 8 (import cluster) group 9 group 9 (import) group 10 (cluster) group 10 (import) group 10 (import-related) group 11 group 3 group 5 (import) group 7 (import) group 10 group 11 (import) group 12 group 13 group 13 (cluster) a import-related refers to a confirmed case with epidemiological links to an imported case. a wpsar vol 12, no 3, 2021 | doi:10.5365/wpsar.2010.10.4.002https://ojs.wpro.who.int/ 11 measles elimination, singaporesee et al 2. immunization, vaccines and biologicals: new measles surveillance data from who. geneva: world health organization; 2019. available from: https://www.who.int/immunization/newsroom/new-measles-data-august-2019/en/, accessed 20 august 2019. 3. immunization, vaccines and biologicals: measles. geneva: world health organization; 2021. available from: https://www.who.int/immunization/diseases/measles/en/, accessed 10 november 2018. 4. seventh meeting of the european regional verification commission for measles and rubella elimination (rvc). copenhagen: world health organization, regional office for europe; 2018. available from: https://www.euro.who.int/en/health-topics/communicablediseases/measles-and-rubella/publications/2018/7th-meeting-ofthe-european-regional-verification-commission-for-measles-andrubella-elimination-rvc.-report, accessed 13 january 2021. 5. fourth meeting of the who south-east asia regional verification commission for measles elimination and rubella/congenital rubella syndrome control: kathmandu, nepal, 23–25 april 2019. new delhi: world health organization, regional office for southeast asia; 2019. available from: https://apps.who.int/iris/handle/10665/331223, accessed 13 january 2021. 6. world health organization: western pacific – measles and rubella. manila: world health organization, regional office for the western pacific; 2021. available from: https://www.who.int/westernpacific/ health-topics/measles, accessed 20 december 2018. 7. paho urges rapid increase in vaccination coverage to stop spread of measles in the americas. washington (dc): pan american health organization/world health organization; 2018. available from: https:// www.paho.org/hq/index.php?option=com_content&view=article& id=14582:paho-urges-rapid-increase-in-vaccination-coverage-tostop-spread-of-measles-in-the-americas&itemid=1926&lang=en, accessed 8 september 2020. 8. guidelines on verification of measles and rubella elimination in the western pacific region, second edition. manila: world health organization, regional office for the western pacific; 2018. available from: https://apps.who.int/iris/handle/10665/331139, accessed 10 january 2019. 9. see wh, ng yk, cui l, lin r, ooi spl. epidemiology and control of measles and rubella cases in singapore, 2017. epidemiol news bull. 2019;45(3):79–86. 10. kumar s, stecher g, tamura k. mega7: molecular evolutionary genetics analysis version 7.0 for bigger datasets. mol biol evol. 2016;33(7):1870–4. doi:10.1093/molbev/msw054. 11. rosenthal sr, clements cj. two-dose measles vaccination schedules. bull world health organ. 1993;71(3-4):421–8. pmid:8324862 12. measles vaccines: who position paper – april 2017. wkly epidemiol rec. 2017;92(17):205–27. pmid:28459148 13. goh d, chew f, khor s, lee b. resurgence of measles in singapore: profile of hospital cases. j paediatr child health. 1999;35(5):493– 6. doi:10.1046/j.1440-1754.1999.355407.x. 14. ho hj, low c, ang lw, cutter jl, tay j, chan kp, et al. progress towards measles elimination in singapore. vaccine. 2014;32(51):6927–33. doi:10.1016/j.vaccine.2014.10.046. 15. lin yj, ng yk, cui l, lin r, ooi spl. molecular epidemiology of measles viruses and characterisation of genotype d8 in singapore, 2016. epidemiol news bull. 2017;43(4):115–12. 16. progress towards regional measles elimination – worldwide, 2000– 2016. wkly epidemiol rec. 2017;92(43):649–58. available from: https://apps.who.int/iris/handle/10665/259370, accessed 12 december 2018. than those who were <12 months of age, and thus were below the recommended age for vaccination, the remaining cases had either received only one dose (50%) or did not receive any dose (50%). the herd immunity threshold for measles is estimated at 92% to 95%.9 although from 2013 to 2017 singapore’s immunization coverage for the first dose of vaccine remained high at 95% among children at 2 years of age, the coverage for the second dose was lower, at 86% to 90%. a high number of cases occurred in the 25–44 year age group who were born in the 1970s and 1980s. this group could be more susceptible due to low immunization coverage in the 1970s, missing out on the second dose of vaccine or a lack of immunity among unvaccinated foreign-born individuals. however, the adult seroprevalence survey conducted on citizens in 2005 (based on residual blood samples obtained from the national health survey 2004) revealed that the seropositivity for this age group was higher than 95.8%.14 because the global number of measles cases continues to increase and since singapore is a travel hub, having received 17 million international tourists in 2017, singapore needs to stay vigilant to detect and manage measles cases. the need for prompt testing of cases at the first suspicion should be reinforced among healthcare providers to ensure that true cases are identified early. this will allow for immediate implementation of public health measures, such as isolation in hospitals or physical distancing at home. furthermore, a higher testing rate may increase the sample size available for genotyping. because vaccination is the key to preventing infection, efforts to advocate for immunization among the general public and to ensure that parents follow the national childhood immunisation programme schedule need to be continued and strengthened. conflicts of interest none declared. references 1. emergencies preparedness, response: measles – global situation. geneva: world health organization; 2019. available from: https:// www.who.int/csr/don/26-november-2019-measles-global_situation/en/, accessed 8 september 2020. wpsar vol 12, no 3, 2021 | doi:10.5365/wpsar.2019.10.4.002 https://ojs.wpro.who.int/12 see et almeasles elimination, singapore 19. measles-rubella bulletin, volume 12. manila: world health organization, regional office for the western pacific; 2018. available from: https://iris.wpro.who.int/handle/10665.1/14006, accessed 21 november 2018. 20. bankamp b, liu c, rivailler p, bera j, shrivastava s, kirkness ef, et al. wild-type measles viruses with non-standard genome lengths. plos one. 2014;9(4):e95470. doi:10.1371/journal. pone.0095470. 17. communicable diseases surveillance in singapore, 2016. singapore: ministry of health; 2016. available from: https://www.moh. gov.sg/resources-statistics/reports/communicable-diseases-surveillance-in-singapore-2016, accessed 8 november 2018. 18. communicable diseases surveillance in singapore, 2015. singapore: ministry of health; 2015. available from: https://www.moh. gov.sg/resources-statistics/reports/communicable-diseases-surveillance-in-singapore-2015, accessed 8 november 2018. field epidemiology training programmes in the asia-pacific: what is best practice for supervision? original research owen forbes,a stephanie davis,a amalie dyda,b alexander rosewell,c stephanie williams,a martyn kirk,a maria concepcion roces,d maria consorcia lim-quizond and kerri vineya, e a national centre for epidemiology & population health, research school of population health, the australian national university, canberra, australia. b australian institute of health innovation/department of health systems and populations, macquarie university, sydney, australia. c school of public health and community medicine, university of new south wales, sydney, australia. d south asia field epidemiology and technology network, inc., tarlac city, philippines. e department of public health sciences, karolinska institutet, stockholm, sweden. correspondence to (email: stephanie.davis@anu.edu.au). to cite this article: forbes o, davis s, dyda a, rosewell a, williams s, kirk m, et al. field epidemiology training programmes in the asia-pacific: what is best practice for supervision?. western pac surveill response j. 2019 dec;10(4). doi:10.5365/wpsar.2019.10.1.07 introduction: field epidemiology training programmes (fetps) emphasize competency-based training and learning by doing. supervision of fetp trainees is critical for programmes to achieve learning outcomes. we sought to address a knowledge gap regarding what constitutes effective fetp supervision. methods: we investigated fetp supervision using a mixed-methods approach. quantitative data were collected through a survey of fetp directors. qualitative data included written feedback from the survey and a focus group discussion (fgd) conducted with fetp supervisors at the 8th south-east asia and western pacific bi-regional tephinet conference. fgd questions focused on effective supervisory qualities and activities and challenges to effective supervision. we calculated descriptive statistics for quantitative data and analysed qualitative data using a deductive content analysis approach. results: eleven fetp directors responded to the survey and 23 participated in the fgd. overall, supervision was seen as very important for trainee outcomes. participants identified the different roles of academic and field supervisors but emphasized the importance of an enabling and supporting attitude towards trainees. soft skills and interpersonal abilities were among the most important qualities identified for effective supervision. key challenges identified included a lack of consistency in supervisors’ technical knowledge and the difficulty of finding candidate supervisors with sufficient interest, availability and motivation for supervision. discussion: several practical recommendations arose from this study for supervision in fetps, including recruiting and training supervisors with a more holistic range of skills. our findings also provide key points for current fetp supervisors to consider to improve their own practice. field epidemiology is defined as the “the practice of epidemiology in real time and real place, which in turn involves both science and art”.1 field epidemiology is a key component of the response to some of the world’s major public health problems; it has been vital to detecting and controlling such large-scale outbreaks as the 2014 outbreak of ebola virus disease in west africa, the 2009 h1n1 influenza pandemic and the 2003 multicountry outbreak of severe acute respiratory (sars). adequate training of field epidemiologists is an indicator of country capacity in implementing the international health regulations (2005).2 field epidemiologists are frequently trained in dedicated on-the-job training programmes called field epidemiology training programmes (fetps).3 fetps aim to build the capacity of public health systems in the countries where they are implemented. they do this by recruiting health-care workers, scientists and others and building their competence in field epidemiology through on-the-job mentorship, supervision and training. several practices distinguish these programmes from academic education in public health. fetps use a service-based approach (where trainees support the host organization’s priorities), implementing competency-based training under the supervision of qualified mentors/supervisors and strengthening systems capacity using a learning-by-doing approach.3 following the establishment of the united states epidemic intelligence service as one of the first formal fetps in 1951, other fetps have been established worldwide.4 the training programs in epidemiology and public health interventions network (tephinet) reports that there are now 71 fetps operating in more than 100 countries globally.5 supervision of trainees in the field is a core component of fetps and one that is thought to facilitate learning and the application of that learning to promote and protect public health. supervisory structures vary according to the model of the fetp, the organization delivering the programme and the context. the fetp handbook identifies supervision as the responsibility of both technical leaders (typically resident advisers) and field supervisors.3 within this handbook, supervision is described as involving consultation on epidemiology methods, monitoring and evaluating trainee activities and mentoring and troubleshooting trainee projects. while terminology and models of supervision differ among programmes, it is typical for trainees to have a workplace or field supervisor who is based in their host organization in addition to an academic or programme supervisor who is a subject matter specialist affiliated with the fetp. for example, in many united states centers for disease control and prevention (cdc) programmes that provide support for fetps, resident advisers (cdc epidemiologists employed to provide technical support to fetps) and other programme staff provide additional scientific support to trainees, complementing day-to-day field supervision by a senior colleague in the workplace.3 (note that throughout this paper we use the term supervisor for anyone in a designated supervisory role of the trainee, whether this be a workplace/field supervisor or academic/programme supervisor. we recognize that in many programmes the term mentor is more frequently used for people in this role. trainees also have many other names, but we have used trainees throughout.) despite the central role of supervision in fetps, there is little published evidence on best practice in fetp supervision. existing fetp guidelines largely focus on the logistical aspects of supervision with limited consideration of the broader qualities and activities that are important for effective supervision.3,6 programme experiences from the asia-pacific and other regions highlight issues related to fetp supervision such as a lack of adequate epidemiology knowledge among workplace supervisors,6,7 and the interest in professional training in supervisory techniques.7 a more comprehensive body of peer-reviewed evidence exists for other professions where supervision is a key component, such as health-care worker training that takes place in clinical settings.8,9 some of this literature may also be applicable to the fetps, including the importance of integrating theoretical knowledge with practical experience10 and recognizing the value of a holistic supervisory role, including interpersonal skills, nurturing and guiding alongside teaching specific skills and content knowledge.8 however, none of the literature captures the particular needs and expectations of fetp supervisors. therefore, we undertook a mixed-methods study to determine the components and characteristics of effective supervision in the fetp context from the perspective of experienced fetp staff in the asia-pacific region. our aim was to provide information on best practice in fetp supervision to further strengthen fetps and the response to public health problems and threats. methods study design this study employed a mixed-methods design, combining focus group discussions (fgds) and a cross-sectional survey. study population and data collection fgd were held at a workshop for fetp supervisors titled “how to improve field epidemiology training in the asia-pacific” at the 8th south-east asia and western pacific bi-regional tephinet conference, in siem reap, cambodia from 28 november to 2 december 2016. the workshop was advertised as “of interest to fetp staff and supervisors” via materials sent to all attendees before the conference. two experienced facilitators from australia presented a summary of the literature on fetp supervision, including knowledge gaps; then, the facilitators guided fgd on the key themes outlined in box 1. these discussions were documented in detailed notes. click to download box 1. jpg, 79kb to obtain quantitative insights on different aspects of the key topic areas, fetp directors attending the same tephinet conference were invited to provide their views in a survey on various aspects of fetp supervision. the survey included 16 openand closed-ended questions about fetp supervision including the differing roles of programme and field supervisors, effective supervisory qualities and activities, and challenges to supervision. survey questions were based on key themes and findings about supervision in the literature review and informed by reports from the investigators who are experienced fetp supervisors.8,9,11 data analysis qualitative data from the workshop were analysed using a deductive content analysis approach.12 quantitative survey data were analysed using descriptive statistics. we calculated numbers and proportions of positive responses for questions with binary responses; likert scale questions were calculated using the numbers and proportions of positive, negative and neutral responses. data from open-ended questions were coded according to the framework of themes developed from workshop data (box 1). consent participants at the workshop signed consent forms to participate in the workshop and have the findings published. fetp directors provided implied consent by responding to the survey and were informed that the results of the survey would be published. ethics statement ethics approval for this study was provided by the australian national university (protocol 2016/420) and the university of new south wales human research ethics committees (protocol 15571). results results are organized into themes addressing the key study questions, shown in box 1. quantitative results from the survey are presented in tables 1 to 4. qualitative analyses of workshop discussions are available in box 2. the majority of survey and fgd questions did not distinguish between field and programme supervisors. other than in table 2, results describe a general perspective on good practice in supervision without reference to specific supervisory roles. click to download box 2. jpg, 571kb click to download table 1. jpg, 282kb click to download table 2. jpg, 387kb participation in the survey and workshop twenty-three participants attended the workshop. of the 19 total member countries represented in the western pacific and south-east asia regions of tephinet, participants were associated with programmes in 13 countries and identified themselves as supervisors, mentors and resident advisers. directors from 11 of these tephinet programmes responded to the survey (response rate of 58%). of these, 91% (n = 10) had a programme duration of 13–24 months. the majority of programmes (73%, n = 8) had been established for more than 10 years, 18% (n = 2) for 6–10 years and 9% (n = 1) for 4–5 years. what are the roles of an fetp supervisor? survey overall, fetp directors appeared to have a high degree of recognition of the value of supervisors for effective fetp training. the majority of fetp directors (55%) perceived the role of the supervisor as being “very effective” in facilitating the development of competent field epidemiologists; the remainder rated the supervisor’s role as “effective”. a wide range of activities were considered to be part of the supervisory role (tables 1 and 2). the activities rated as most important for effective supervision were those that emphasized an interpersonal connection between the supervisor and trainee to learn practical skills, including logistical arrangements to support these activities. comparing the roles of field and programme supervisors, the field supervisor was seen as having a more holistic role with more than 50% of participants rating each of the 18 activities outlined in table 2 as part of the field supervisor’s role. in contrast, many participants perceived the programme supervisor to have a more defined role that focused on transfer of technical skills and knowledge. one survey participant indicated that “daily discussions on outbreak investigation and feedback to the trainee” were a particularly effective supervisory activity, reflecting the strong emphasis on the value of interpersonal contact and soft skills developed through regular contact with field supervisors (table 2). workshop a key theme from the workshop was that the primary role of the supervisor was not to teach didactically, but instead to facilitate the trainee’s learning and to guide the trainee to ask the right questions. this was seen as fitting under the overall ethos of fetps, facilitating learning by doing, and was exemplified by one participant’s analogy of the supervisor as a midwife: the supervisor coaches and provides encouragement and expertise, but in the end, it is the trainee who has to do the work. another key theme from the workshop was the different supervisory roles played by programme and field supervisors. several participants highlighted that, in the classroom, supervisors should act mainly as instructors in specific technical areas. in the field, however, their role was to supervise the work of the trainee in outbreak investigations and to provide technical support, if needed. it was suggested that these differences could limit the capacity for programme supervisors to provide support on more holistic or interpersonal matters, while field supervisors held greater responsibility for supporting development of a different set of skills such as leadership and communication. what makes a good fetp supervisor? survey fetp directors perceived the supervisor’s level of public health knowledge as the most critical quality for effective supervision (table 3). similarly, their technical skills were also seen as highly important along with a range of more holistic qualities including enthusiasm, interpersonal skills, approachability and availability. click to download table 3. jpg, 199kb workshop the workshop discussion highlighted that good interpersonal skills, particularly mentoring and leadership skills, as well as high levels of patience were particularly important for effective supervision. good supervisors were seen as being committed and having passion and motivation to supervise. other participants viewed the supervisory relationship as a type of parental role in which the supervisor cared about and guided the trainee in a range of areas. workshop participants identified a supervisor’s level of availability and approachability as critical characteristics. in addition to their personal and interpersonal traits, the training background of the supervisor – specifically having a health-related profession – was seen as important. in addition to presumably conferring technical knowledge, having a health-related background was seen to confer credibility to the supervisor. it was also seen as critical that supervisors had a sound understanding of programme requirements so they knew what the trainee was expected to achieve. what are the challenges to supervision? survey a lack of interest in supervision and insufficient skills to provide effective feedback were perceived to be the greatest challenges to effective supervision (table 4). a survey participant noted that “not all can effectively teach, even though they may be able/competent”, suggesting that aptitude for and interest in supervision are important along with a supervisor’s level of knowledge and experience. click to download table 4. jpg, 203kb a lack of technical skills and relevant knowledge was seen as the next most critical barrier to good supervision (table 4). a supervisor’s lack of time was also noted as a challenge, and comments from survey participants also stated that supervisors often lacked time to support trainees. other comments identified the remoteness of programme supervisors and their lack of time spent face to face with trainees as a barrier to teaching technical competencies. the supervisor’s degree of seniority was seen as less important, with only 27% (n = 3) identifying this as a “very important” challenge for effective supervision (table 4). workshop it was deemed important to engage committed and motivated supervisors. however, identifying and finding these people was perceived to be challenging. this was linked to the issues of time and availability, as people who would make good supervisors may lack the time required for hands-on supervision. differing expectations between supervisors across contexts was a commonly reported issue. it was acknowledged that having multiple supervisors is sometimes necessary, but when supervisors disagree, it can be challenging for both trainees and supervisors. different expectations of the trainees can also be an issue when trainees are in employed positions and report to a superior who is not fetp trained and who may not fully understand the trainees’ projects and deliverables. participants identified various barriers and challenges to giving effective feedback to trainees. these included different expectations between supervisors and trainees, cultural and language barriers, availability of trainees and supervisors for meetings due to physical locations and time available from other responsibilities. professional reflective learning, clear expectations about required programme standards as well as operating within a trusting supervisory relationship were seen as important in trying to manage these barriers and challenges. discussion workshop and survey results indicated that fetp directors and supervisors had a high level of confidence in the value and effectiveness of fetp supervisors. participants identified several key components to effective supervision, including interpersonal and communication abilities, relevant training background and technical skills and time and availability for frequent in-person contact with trainees. we found several areas to improve the structure and practice of supervision in fetps. existing fetp guidelines often focus on the specific logistical and didactic responsibilities of supervisors and emphasize the need for strong technical skills.3,13 our results highlighted the importance of a holistic role for the supervisor, which includes mentoring the trainee in interpersonal and communication skills, alongside technical competencies and knowledge. these findings are consistent with the literature from other field-based training such as clinical settings where priority is placed on supervisor reassurance, role modelling, empathy and interpersonal skills (in addition to technical skills);8,14 the literature on academic supervision also emphasizes the importance of soft skills such as encouragement, empathy and supportiveness.15 the survey results highlighted important differences in the perceived roles of programme and field supervisors. one person can sometimes perform both roles and/or the roles may overlap; however, in our findings, the role of programme supervisor was seen to be more specific to teaching technical skills and knowledge. on the other hand, field supervisors were expected to provide practical, motivational and emotional support in addition to supporting learning. the many supervisory priorities reflect and are likely guided by existing fetp guidelines that outline the different roles of supervisor.3,13 however, the most critical activity for both types of supervisor was viewed as supporting the trainees to develop their own knowledge and abilities rather than trying to make them learn the right way. while this reflects a key ethos of fetps, i.e. learning by doing, it also reflects literature on best practice supervision in other areas. academic supervision literature provides similar guidance, suggesting the value of letting supervision be driven by the trainee’s needs15 and striking a balance between direction and self-direction based on a trainee’s level of familiarity and expertise.16 the literature on clinical supervision provides a similar view, suggesting that as trainees develop expertise they may benefit from independently directing their own learning and contribute to their own professional growth.9 overall, our study findings suggest that a key contribution of the supervisor is to enable trainees to identify and pursue areas for their own development, giving them opportunities to direct their own learning and to apply theoretical knowledge in practical scenarios10 rather than taking a purely instructive approach. our study participants identified a variety of challenges to effective field epidemiology supervision, including: a lack of commitment and interest in being a supervisor; and ineffective communication skills, including the inability to provide constructive feedback. another key challenge identified was that workplace supervisors could lack sufficient technical skills and knowledge, limiting their ability to provide adequate technical supervision. these experiences echo those reported from other programmes where poor training outcomes were reported from field supervisors who lacked any relevant background in public health or epidemiology.6,7 our findings on both the challenges of supervision as well as the role and quality of good supervision have practical implications. they suggest that the ideal supervisor has a relevant background; well-developed technical skills; good programme knowledge; is interested, warm, motivated and committed to fetp supervision; and has sufficient time to dedicate to these tasks. while this ideal may not be frequently realized, it is worthwhile for programmes to consider some of these qualities in supervisor recruitment. programmes should also consider these traits when conducting orientation and training of supervisors; such training should cover programme requirements and operation but also help supervisors improve technical competencies.7,17 as suggested in the clinical supervision literature,9 supervisor training should also include opportunities to assess and train new supervisors in areas of effective communication, giving feedback, building trusting relationships and empathetic mentoring with trainees. the similarities of good supervisors alongside the challenges of supervision were remarkably similar between the programmes represented in this study, suggesting the value of inter-fetp collaboration to develop role descriptions and training for fetp supervisors. these could then be adapted to the local context and be included in programme curricula and guidelines for each country to enable supervisors to have greater understanding and expectations of their role. a limitation to this study was that our sample was small and purposive. given the specific nature of our research question, this was deemed the most feasible and appropriate study design. we did not collect data from the participants to assess the extent to which each participant was involved with direct supervision. however, individuals in the director role would typically have frequent contact with programme supervisors and substantial exposure to supervision practices. another limitation was that we only considered the views of supervisors rather than trainees and that we relied on self-reported subjective data. while this method is commonly used to assess the effectiveness of supervision across a range of settings, more objective evidence could be obtained by targeting evaluation at the level of subsequent trainee behaviour in the workplace or public health outcomes resulting from the work of fetp graduates.18 studies of supervision in other contexts have assessed efficacy using measures such as trainees’ publication rates and job attainment in relevant specialist fields, which could be explored in developing indicators of supervisor performance in fetps.19 given the study’s sample from western pacific and south-east asian fetps, this may limit the generalizability of our findings to other regions, though comparison with other findings from african and asia-pacific fetps indicates similar experiences and challenges with regards to supervision.6,7 to conclude, supervision is a core component of fetps, and this study has identified some of the key elements and challenges of effective supervision in these programmes. our findings provide the basis for practical recommendations for fetp supervisory recruitment and training. the findings also provide material for fetp supervisors to consider in their own reflective practice, including practising empathy towards their trainee’s overall professional and personal development and being responsive to both their practical and emotional needs. to better understand what and how effective supervision occurs, it would be worthwhile conducting further research in this area, particularly incorporating trainee viewpoints as well as evaluating supervision via fetp trainee outcomes. acknowledgements the authors would like to thank matthew moore (resident advisor, united states centers for disease control and prevention viet nam), susan pennings (phd candidate, australian national university) and amy parry (phd candidate, australian national university). funding information this study was funded by a seed fund grant from the national health and medical research council centre of research excellence (cre): integrated systems for epidemic response (iser) (gnt: 1107393) conflicts of interest the authors declare that there is no conflict of interest regarding the publication of this article. references gregg mb. field epidemiology. 2nd ed. new york (ny): oxford university press; 2002. international health regulations (2005): ihr monitoring and evaluation framework. geneva: world health organization; 2018. available from: https://www.who.int/ihr/publications/who-whe-cpi-2018.51/en/. united states centers for disease control and prevention. field epidemiology training program development handbook. atlanta (ga); 2006. available from: https://www.cdc.gov/globalhealth/healthprotection/fetp/pdf/fetp_development_handbook_508.pdf. thacker sb, dannenberg al, hamilton dh. epidemic intelligence service of the centers for disease control and prevention: 50 years of training and service in applied epidemiology. am j epidemiol. 2001 dec 1;154(11):985–92. doi:10.10.1093/aje/154.11.985 pmid:11724713 training programs in epidemiology and public health inteventions network (tephinet). decatur, ga: training programs in epidemiology and public health inteventions network; 2019. available from: https://www.tephinet.org/. davila ep, suleiman z, mghamba j, rolle i, ahluwalia i, mmbuji p, et al. non-communicable disease training for public health workers in lowand middle-income countries: lessons learned from a pilot training in tanzania. int health. 2015 sep;7(5):339–47. doi:10.1093/inthealth/ihu090 pmid:25526907 world health organization regional office for the western pacific. third workshop on field epidemiology training programmes: opportunities to strengthen international collaboration. manila; 2012. available from: http://www.wpro.who.int/emerging_diseases/meetings/docs/3rd.fetp.rev2.25july2012.pdf. kilminster s, cottrell d, grant j, jolly b. amee guide no. 27: effective educational and clinical supervision. med teach. 2007 feb;29(1):2–19. doi:10.1080/01421590701210907 pmid:17538823 kilminster s, jolly b, van der vleuten cp. a framework for effective training for supervisors. med teach. 2002 jul;24(4):385–9. doi:10.1080/0142159021000000834 pmid:12193321 tynjälä p. perspectives into learning at the workplace. educ res rev. 2008;3(2):130–54. doi:10.1016/j.edurev.2007.12.001 cottrell d, kilminster s, jolly b, grant j. what is effective supervision and how does it happen? a critical incident study. med educ. 2002 nov;36(11):1042–9. doi:10.1046/j.1365-2923.2002.01327.x pmid:12406264 liamputtong p, ezzy d. qualitative research methods. 2nd ed. south melbourne (vic): oxford university press; 2005. ethiopia field epidemiology training program. manual for field supervisors and mentors. addis ababa; 2012. available from: http://www.etpha.org/publications/other-publications.html?download=384:other. kilminster sm, jolly bc. effective supervision in clinical practice settings: a literature review. med educ. 2000 oct;34(10):827–40. doi:10.1046/j.1365-2923.2000.00758.x pmid:11012933 lee am. developing effective supervisors: concepts of research supervision. south african journal of higher education. 2007;21(4):680–93. available from: https://www.ajol.info/index.php/sajhe/article/view/25690. subscription required. lee a, dennis c, campbell p. nature’s guide for mentors. nature. 2007 jun 14;447(7146):791–7. doi:10.1038/447791a pmid:17568738. available from: https://www.nature.com/articles/447791a. accreditation of fetps minimum indicators and standards. 2018. decatur (ga): training programs in epidemiology and public health interventions network (tephinet); 2019. available from: https://www.tephinet.org/sites/tephinet/files/content/attachment/2019-02-01/accreditation%20minimum%20indicators%20and%20standards_2019.pdf. kirkpatrick dl. evaluating training programs: evidence vs. proof. train dev j. 1977 nov; 31(11)9–12. soliman as, chamberlain rm. shortand long-term outcomes of student field research experiences in special populations. j cancer educ. 2016 jun;31(2):328–37. doi:10.1007/s13187-015-0800-9 pmid:25773133 https://ojs.wpro.who.int/ 1wpsar vol 11, no 4, 2020 | doi: 10.5365/wpsar.2020.11.3.002 regional analysis a end tb and leprosy unit, world health organization regional office for the western pacific, manila, philippines. b prevention, diagnosis, treatment, care and innovation unit, global tb programme, world health organization, geneva, switzerland. c centre for research excellence in tuberculosis and the marie bashir institute for infectious diseases and biosecurity, university of sydney, sydney, australia. d menzies school of health research, charles darwin university, darwin, australia. published: 28 december 2020 doi: 10.5365/wpsar.2020.11.3.002 t uberculosis (tb) continues to be a global public health problem, which disproportionately affects poor and marginalized populations who often have limited health care access. despite the continued global effort to end tb, the disease continues to be the leading infectious killer on the planet. in 2018, an estimated 10 million people fell ill with tb and 1.5 million died from the disease.1 geographically, over 85% of tb cases in 2018 occurred in three who regions: 44% in south-east asia, 24% in africa and 18% in the western pacific.1 in total, 30 countries with high burdens of tb accounted for 87% of the world’s cases.1 in 2014, the sixty-seventh world health assembly endorsed a global strategy, now commonly known as the end tb strategy,2 and targets for tb prevention, care and control after 2015. the strategy set the ambitious target of ending tb by 2035, by reducing the incidence rate by 90% and the number of deaths by 95% from those in 2015. interim 2020 milestones were defined as reductions of 20% of the incidence rate and 35% in the number of deaths, in addition to eliminating catastrophic costs incurred by tb.2 since 2014, two global high-level meetings (the who global ministerial conference on “ending tb in the sustainable development era”, held in moscow, russian federation, in 2017, and the first high-level meeting on tb at the united nations general assembly, in new york in 2018) created unprecedented political momentum to accelerate the global tb response.3 the world is, however, unlikely to achieve the 2020 milestones, with only a 6.3% reduction in tb incidence and a 5.2% reduction in tb deaths reported between 2015 and 2018.4 in addition, there is grave concern that the covid-19 pandemic will set back the modest gains made to date.5 since 2015, the end tb strategy and the regional framework for action on implementation of the end tb strategy in the western pacific 2016–2020 have guided national tuberculosis (tb) responses in countries and areas of the region. this paper provides an overview of the tb epidemiological situation in the western pacific region and of progress towards the 2020 milestones of the strategy. a descriptive analysis was conducted of tb surveillance and programme data reported to who and estimates of the tb burden generated by who for the period 2000–2018. an estimated 1.8 million people developed tb and 90 000 people died from it in the region in 2018. since 2015, the estimated tb incidence rate and the estimated number of tb deaths in the region decreased by 3% and 10%, with annual reduction rates of 1.0% and 3.4%, respectively. with current efforts, the region is unlikely to achieve the 2020 milestones and other targets of the strategy. major challenges include: (1) wide variation in the geographical distribution and rate of tb incidence among countries; (2) a substantial proportion (23%) of tb cases that remain unreached, undiagnosed or unreported; (3) insufficient coverage of drug susceptibility testing (51%) for bacteriologically confirmed cases and limited use of who-recommended rapid diagnostics (11 countries reported <60% coverage); (4) suboptimal treatment outcomes of tb (60% of countries reported <85% success), of tb/hiv co-infection (79%) and of multidrugor rifampicin-resistant tb (59%); (5) limited coverage of tb preventive treatment among people living with hiv (39%) and child contacts (12%); and (6) substantial proportions (35–70%) of tb-affected families facing catastrophic costs. for the region to stay on track to achieve the end tb strategy targets, an accelerated multisectoral response to tb is required in every country. epidemiology of tuberculosis in the western pacific region: progress towards the 2020 milestones of the end tb strategy fukushi morishita,a kerri viney,b,c chris lowbridge,a,d hend elsayed,a kyung hyun oh,a kalpeshsinh rahevar,a ben j maraisc and tauhid islama correspondence to fukushi morishita (email: morishitaf@who.int) wpsar vol 11, no 4, 2020 | doi: 10.5365/wpsar.2020.11.3.002 https://ojs.wpro.who.int/2 morishita et alepidemiology of tuberculosis in the western pacific region estimated number of incident multidrugor rifampicinresistant tb (mdr/rr-tb) cases, the case detection rate (the number of laboratory-confirmed mdr/rr-tb cases divided by the estimated number of incident cases) and the treatment enrolment rate (the number of cases enrolled in second-line treatment divided by the number of laboratory-confirmed cases) were provided for countries with the highest estimated numbers of mdr/rr-tb incidence. indicators of tb prevention and catastrophic costs due to tb were assessed where data were available. catastrophic costs for tb-affected families are defined as total costs (comprising direct medical and non-medical costs plus income losses) that represent 20% or more of annual household income. we also developed a colour-coded scorecard to summarize indicators of implementation of the end tb strategy for each country in the region. in this paper, “range” refers to the 95% uncertainty interval. all analyses were conducted with the statistical software package r 3.6.1 (comprehensive r archive network at https:// cran.r-project.org/). ethical clearance was not required, as this report was part of a regular evaluation of programme performance. results estimates of tb burden since 2000, the estimated incidence of tb in the region has decreased steadily, from 135 (range, 109–163) per 100 000 population (2.3 [range, 1.7–2.8] million cases) to 96 (range, 79–114) per 100 000 population (1.8 [range, 1.5–2.2] million cases) in 2018. the estimated number of tb deaths more than halved in the same period, from 209 000 (range, 178 000–242 000) (12 [range, 10–14] deaths per 100 000 population) in 2000 to 90 000 (4.7 [4.3–5.1] deaths per 100 000 population) in 2018 (fig. 1). since 2015, when the end tb strategy and the regional framework: 2016–2020 were endorsed, the estimated incidence rate and number of tb deaths have decreased by 3% and 10%, with annual reductions of 1.0% and 3.4%, respectively. the estimated tb incidence and mortality rates among people living with hiv (plhiv) have both remained low in the region (2.1 [range, 1.5–2.8] and 0.34 [range, 0.25–0.43] per 100 000 population in 2018, respectively). the who western pacific region is home to 1.9 billion people in 37 countries and areas. the region is diverse, comprising large countries with populations of more than 1 billion people and small pacific island countries with a few thousand residents, as well as countries with high and intermediate tb burdens and others in the pre-elimination stage. the regional framework for action on implementation of the end tb strategy in the western pacific 2016–2020 has guided national tb responses in countries and areas of the region by proposing actions for national tb programmes.6,7 this paper provides an overview of the epidemiology of tb in the region and of progress towards the 2020 interim milestones of the end tb strategy and the regional framework. methods we conducted a descriptive analysis of tb surveillance and programme data reported by countries and areas to who, and tb burden estimates generated by who for the western pacific region, for the period 2000–2018. countries and areas report data on tb to who annually via an electronic platform. the data are then verified and published in who’s global tb reports, in which who-generated estimates are also published. a full description of who’s data collection methods is available in the global tb report 2019;1 the methods used to estimate tb incidence and mortality are provided in an online technical appendix.8 we used the definitions of cases and treatment outcome given in the who reporting framework for tb.8 all data sets are available from the who global tb database.4 in 2019, data for 2018 were reported to who by 35 countries and areas in the region, accounting for 99.9% of the regional population. we reviewed trends in tb incidence and mortality, case notifications, indicators of collaborative tb/ hiv activities and treatment outcomes. in addition to regional analyses, we also reviewed national data from the seven countries with high burdens of tb in the region (cambodia, china, the lao people’s democratic republic, mongolia, papua new guinea, the philippines and viet nam), which have more than 95% of the region’s cases. the cascade of care for tb, drug-resistant tb (dr-tb) and tb/hiv co-infection was assessed to identify and quantify gaps in care delivery. for dr-tb, the wpsar vol 11, no 4, 2020 | doi: 10.5365/wpsar.2020.11.3.002https://ojs.wpro.who.int/ 3 epidemiology of tuberculosis in the western pacific regionmorishita et al in 2018, six countries had an estimated tb incidence rate of more than 300 cases per 100 000 population. the highest incidence rate was recorded in the philippines (554 [range, 311–866] cases per 100 000), followed by the marshall islands (434 [range, 332–549] cases per 100 000), papua new guinea (432 [range, 352–521] cases per 100 000), mongolia (428 [range, 220–703] cases per 100 000), kiribati (349 [267–441] cases per 100 000) and cambodia (302 [range, 169–473] cases per 100 000) (fig. 3). six countries and areas, american samoa, australia, cook islands, new zealand, samoa and wallis and futuna, had an estimated tb incidence rate of <10 cases per 100 000 population in 2018. tb case notifications the number of case notifications in the region rose sharply between 2000 and 2007, mainly reflecting increased reporting from china, but has since remained stable, with 1 416 729 new and relapse cases notithe decreasing trends in tb incidence and mortality observed in the region are broadly in line with global trends and are driven mainly by improvements in tb control in china. when data from china are excluded, the estimated tb incidence rate in 2018 doubles to 196 (range, 121–292) cases per 100 000 population. the estimated tb incidence rate was lower in the subregion of the pacific island countries than in other parts of the region, but there has been no decrease in incidence since 2000, the rate ranging from 54 (range, 43–66) per 100 000 population in 2002 to 75 (range, 58–94) per 100 000 population in 2016. the estimated incidence of tb varies widely among countries in the region (fig. 2). in 2018, nearly 80% of all estimated tb cases occurred in just two countries, china (47% or 866 000 [range, 740 000–1 000 000] cases) and the philippines (32% or 591 000 [range, 332 000–924 000] cases). a further 9% (174 000 [range, 111 000–251 000] cases) occurred in viet nam. fig. 1. trends in estimated tb incidence and total tb deaths at global and regional levels, 2000–2018 global western pacific region wpr without china pacific island countries 2000 2009 2018 2000 2009 2018 2000 2009 2018 2000 2009 2018 0 100 200 300 in ci de nc e ra te p er 1 00 0 00 p op ul at io n global western pacific region wpr without china pacific island countries 2000 2009 2018 2000 2009 2018 2000 2009 2018 2000 2009 2018 0.0 0.1 0.2 0.3 0 50 100 0 50 100 150 200 250 0 500 1000 1500 to ta l t b d ea th s (th ou sa nd s) estimated incidence and numbers of deaths are shown in blue and those among hiv-positive people in red. the horizontal dashed lines show the 2020 milestones of the end tb strategy. shaded areas represent uncertainty intervals. the grey solid lines show notifications of new and release tb cases for comparison with estimates of the totl incidence rate. wpr: western pacific region. wpsar vol 11, no 4, 2020 | doi: 10.5365/wpsar.2020.11.3.002 https://ojs.wpro.who.int/4 morishita et alepidemiology of tuberculosis in the western pacific region fig. 2. estimated tb incidence rates per 100 000 population in countries and areas in the western pacific region, 2018 © world health organization 2020. all rights reserved. asm: american samoa, cok: cook islands, fji: fiji, fsm: micronesia (federated states of), gum: guam, kir: kiribati, mhl: marshall islands, mnp: northern mariana islands (commonwealth of the), ncl: new caledonia, niu: niue, nru: nauru, plw: palau, pyf: french polynesia, slb: solomon islands, tkl: tokelau, ton: tonga, tuv: tuvalu, vut: vanuatu, wlf: wallis and futuna, wsm: samoa asm cok fji fsm gum kir mhl mnp ncl niu nru plw pyf slb tkl ton tuv vut wlf wsm incidence rate per 100 000 population 0−19 20−69 70−119 120−399 400+ not applicable fig. 3. estimated numbers of incident tb cases and tb incidence rates per 100 000 population in countries and areas in the western pacific region, 2018 61 554 182 302 432 66 92 14 428 162 67 47 6.6 54 74 349 60 7.3 68 434 46 108 49 22 95 15 270 109 6.4 10 54 71 0 0 31 0 0 100 200 300 400 500 600 1 10 100 1000 10 000 100 000 1 000 000 e st im at ed in ci de nc e ra te p er 1 00 0 00 p op ul at io n number rate per 100 000 population e st im at ed n um be r of c as es (l og s ca le ) la o p eo ple ’s de mo cra tic r ep ub lic no rth er n m ar ian a i sla nd s ( co mm on we alt h o f th e) w all is an d f utu na wpsar vol 11, no 4, 2020 | doi: 10.5365/wpsar.2020.11.3.002https://ojs.wpro.who.int/ 5 epidemiology of tuberculosis in the western pacific regionmorishita et al drug-resistant tb between 2015 and 2018, the numbers of laboratoryconfirmed mdr/rr-tb cases and of patients enrolled in second-line treatment increased by 50% and 47%, respectively. during the same period, drug susceptibility testing (dst) coverage of bacteriologically confirmed cases rose from 28% in 2015 to 51% in 2018 but still remains far below the 100% target. china had the highest estimated number of mdr/ rr-tb cases (66 000 [range, 50 000–85 000]) in 2018, followed by the philippines (n = 18 000 [range, 7700– 32 000]), viet nam (n = 8600 [range, 5400–13 000]), papua new guinea (n = 2000 [range, 1200–2900]), the republic of korea (n = 1500 [range, 1300–1700]), cambodia (n = 1000 [range, 460–1900]), mongolia (n = 720 [range, 340–1200]), japan (n = 510 [range, 220–930]), malaysia (n = 480 [range, 360–620]) and the lao people’s democratic republic (n = 160 [range, 65–280]) (fig. 5). these 10 countries accounted for fied in 2018 (a case notification rate of 74 per 100 000 population) (fig. 4a). trends in case notification from countries vary widely. during the past decade in the seven focus countries, decreasing case notification rates were observed in cambodia, china and mongolia, and increasing rates were reported in the lao people’s democratic republic, papua new guinea and the philippines (fig. 4b). in the region, the highest tb notification rate was for males aged ≥65 years (202 cases per 100 000 population), with a general tendency to higher case notification rates for older age groups (fig. 4c). the exceptions were mongolia and papua new guinea, where the proportions of younger people (0–24 years) among total cases were still high (32% and 46%, respectively), suggesting high rates of transmission in the general community. the male-to-female ratio of tb cases was high in adults (from 1.5 in those aged 15–24 years to 2.5 in those aged 45–54 years), with the largest differences being observed in older groups. fig. 4a and 4b show both total numbers of new and relapse cases and cases with an unknown tb treatment history. fig. 4c presents total numbers of new and relapse cases. pdr, people’s democratic republic. fig. 4. case notifications of all forms of tb in the western pacific region and in the seven focus countries, 2000–2018 cambodia china lao pdr mongolia papua new guinea philippines viet nam western pacific region 0 50 0 10 00 0 25 50 75 10 0 0 10 0 20 0 30 0 0 10 20 0 1 2 3 4 5 0 2 4 6 0 25 0 50 0 75 0 10 00 0 10 20 30 40 a bs ol ut e nu m be r ( th ou sa nd s) (4a) number of tb cases notified, 2000−2018 cambodia china lao pdr mongolia papua new guinea philippines viet nam western pacific region 2000 2009 2018 2000 2009 2018 2000 2009 2018 2000 2009 2018 2000 2009 2018 2000 2009 2018 2000 2009 2018 2000 2009 2018 10 0 20 0 30 0 r at e pe r 1 00 0 00 p op ul at io n (4b) tb case notification rate, 2000−2018 cambodia china lao pdr mongolia papua new guinea philippines viet nam western pacific region 0− 14 15 −2 4 25 −3 4 35 −4 4 45 −5 4 55 −6 4 65 + 0− 14 15 −2 4 25 −3 4 35 −4 4 45 −5 4 55 −6 4 65 + 0− 14 15 −2 4 25 −3 4 35 −4 4 45 −5 4 55 −6 4 65 + 0− 14 15 −2 4 25 −3 4 35 −4 4 45 −5 4 55 −6 4 65 + 0− 14 15 −2 4 25 −3 4 35 −4 4 45 −5 4 55 −6 4 65 + 0− 14 15 −2 4 25 −3 4 35 −4 4 45 −5 4 55 −6 4 65 + 0− 14 15 −2 4 25 −3 4 35 −4 4 45 −5 4 55 −6 4 65 + 0− 14 15 −2 4 25 −3 4 35 −4 4 45 −5 4 55 −6 4 65 + 0 50 10 0 15 0 20 0 0 10 0 20 0 30 0 40 0 0 50 0 1, 00 0 1, 50 0 0 10 0 20 0 30 0 40 0 0 50 10 0 15 0 20 0 0 20 0 40 0 60 0 0 50 10 0 15 0 0 25 0 50 0 75 0 r at e pe r 1 00 0 00 p op ul at io n female male(4c) ageand sex-specific tb case notification rate, 2018 wpsar vol 11, no 4, 2020 | doi: 10.5365/wpsar.2020.11.3.002 https://ojs.wpro.who.int/6 morishita et alepidemiology of tuberculosis in the western pacific region is also below the 100% target and does not include delays in initiation, as many countries still do not meet this reporting requirement. coverage of tb preventive treatment (tpt) in plhiv remains at <50% (based on reports from only eight countries). treatment outcomes a tb treatment success rate (new and relapse cases) of >90% has been maintained at regional level for over a decade (fig. 7). the rate is due mainly to high treatment success rates in a few countries with large tb caseloads, including china (93%) and viet nam (92%), which tends to hide poor rates in many smaller countries. overall, 20 of 32 reporting countries and areas (>60%) had treatment success rates of <85%, and success rates of <70% were reported by countries and areas such as hong kong sar (china) and japan, where tb predominantly affects the elderly, but also in some pacific island countries such as papua new guinea and tuvalu, which have younger populations. the treatment outcomes of patients with tb/hiv co-infection and mdr/rr-tb remain suboptimal in most countries and more than 99% of the total estimated mdr/rr-tb case load in 2018 (n = 99 000). importantly, case detection rates remained low in all these countries, ranging from 13% in cambodia to 52% in the republic of korea. the rates of enrolment in treatment after diagnosis were excellent in cambodia (100%), the republic of korea (100%) and viet nam (99%) but suboptimal in china (61%), japan (63%) and malaysia (71%). indicators of collaborative tb/hiv activities key indicators for tb-hiv care and collaborative activities have improved over time (fig. 6). the proportion of tb cases with known hiv status increased substantially, from 12% in 2009 to 54% in 2018, although the proportion remains well below the target of 100% and the global average of 64%. the hiv prevalence among tested tb cases fell from a high of 13% in 2006 to <3% in 2016, which has been maintained, reflecting more comprehensive screening. the proportion of tb/ hiv co-infected patients receiving antiretroviral therapy (art) has increased over time, reaching 84% in 2018 (based on reporting from 13 countries); however, this fig. 5. estimated numbers of mdr/rr-tb incidence and detection and treatment enrolment rates for mdr/ rr-tb in the 10 most-affected countries in the western pacific region, 2018 66 000 18 000 8600 2000 1500 1000 720 510 480 160 22% 40% 36% 22% 52% 13% 23% 18% 40% 33% 61% 82% 99% 83% 100% 100% 63% 71% 85% 0% 20% 40% 60% 80% 100% 0 20 000 40 000 60 000 80 000 china philippines viet nam papua new guinea republic of korea cambodia mongolia japan malaysia lao pdr d et ec tio n an d en ro lm en t ra te s (% ) e st im at ed n um be r o f r r /m d r -t b c as es estimated rr/mdr-tb detection rate (%) enrolment rate (%) “case detection rate” is defined as the number of laboratory-confirmed mdr/rr-tb cases divided by the estimated number of incident mdr/rr-tb cases. “treatment enrolment rate” is defined as the number of cases enrolled in second-line treatment divided by the number of laboratory-confirmed cases. pdr, people’s democratic republic. wpsar vol 11, no 4, 2020 | doi: 10.5365/wpsar.2020.11.3.002https://ojs.wpro.who.int/ 7 epidemiology of tuberculosis in the western pacific regionmorishita et al fig. 6. trends in key indicators of collaborative tb/hiv activities in the western pacific region, 2003–2018 fig. 7. trends in tb treatment success rates for different patient categories in the western pacific region, 2000–2017 art: antiretroviral therapy; tb: tuberculosis; tpt: tb preventive treatment. tpt: tb preventive treatment “known hiv status” is calculated as the number of patients with new and relapse tb patients and documented hiv status divided by the number of patients with new and relapse tb notified in the same year, expressed as a percentage. “hiv prevalence in tb patients” is the proportion of tb patients tested for hiv whose results were positive. as treatment outcomes for cases of drug-susceptible tb are reported to who 1 year after notification, data for 2017 were the latest available at the time this report was written. as treatment outcomes for cases of mdr/rr-tb and extensively drug-resistant (xdr) tb are reported to who 2 years after notification, data for 2017 were not available at the time this report was written. known hiv status hiv prevalence in tb patients art coverage in tb/hiv patients tpt coverage in hiv-positive people 2003 2006 2009 2012 2015 20182003 2006 2009 2012 2015 20182003 2006 2009 2012 2015 20182003 2006 2009 2012 2015 2018 0 25 50 75 100 p er ce nt ag e (% ) 0 25 50 75 100 2000 2005 2010 2015 p er ce nt ag e (% ) new and relapse retreatment, excluding relapse hiv−positive mdr/rr−tb xdr−tb wpsar vol 11, no 4, 2020 | doi: 10.5365/wpsar.2020.11.3.002 https://ojs.wpro.who.int/8 morishita et alepidemiology of tuberculosis in the western pacific region confirmed case of pulmonary tb was estimated to be very low (12%) from data for 14 countries. patient costs due to tb eight countries in the region have conducted national tb patient cost surveys and have established a baseline from which to monitor progress towards elimination of catastrophic costs due to tb. in the surveys, 35–70% of tb-affected families reported facing catastrophic costs. proposed “top-10” indicator scorecard table 1 represents a proposed colour-coded scorecard of the “top-10” tb indicators of programme performance towards the end tb strategy targets. in 2018, treatment coverage remained low (<60%) in some countries with a high tb burden (cambodia, lao people’s democratic republic, mongolia and viet nam), and low treatment success rates were reported in japan (68%), hong kong sar (china) (65%) and some pacific island countries, including papua new guinea (68%) and tuvalu (68%). the proportion of tb patients tested with a who-recommended rapid diagnostic test (molecular techniques to detect tb among people with signs or symptoms of tb, such as xpert mtb/rif®) at the time of diagnosis remained low in many countries (11 countries reported <60%). dst coverage was extremely low (<5% of bacteriologically confirmed tb cases) in cambodia, the philippines, papua new guinea and solomon islands, while many with successful xpert mtb/rif® roll-out programmes reported high coverage. at regional level (fig. 8), the proportions being 79% and 59%, respectively, in 2018 (reflecting the 2017 and the 2016 patient cohorts, respectively). tb care cascade fig. 9 shows gaps in the cascade of care for tb, dr-tb and tb/hiv co-infection in the western pacific region. of an estimated 1.8 million (range, 1.5–2.2 million) incident cases of tb in 2018, 5.4% (n = 99 228) were estimated to be mdr/rr-tb and 2.2% (n = 40 638) to be co-infected with hiv. gaps in the tb care cascade in the region remain substantial, especially for dr-tb and tb/hiv. treatment coverage was relatively high for tb, at 77.2% (range, 64.9–93.4%), but low for tb/hiv co-infection (38.9%, range [29.6–53.6%]) and mdr/rr-tb (27.2%, range [19.3–40.2%]). major gaps between the numbers of notified and confirmed mdr/ rr-tb cases and patients enrolled in second-line tb treatment and in initiation of art among hiv-positive tb patients are of particular concern. the proportions of estimated incident tb cases successfully treated for tb, mdr/rr-tb and tb/hiv co-infection were 66.4%, 8.6% and 23.7%, respectively. tb prevention tpt coverage among plhiv remained low, at 39%, in 2018. this figure is based on reports from eight countries, and coverage in non-reporting countries may be even lower. tpt coverage of children under 5 years who were household contacts of a bacteriologically fig. 8. tb treatment outcomes by patient category in the western pacific region, 2018 xdr−tb mdr/rr−tb new and relapse hiv−positive tb retreatment, excluding relapse new and relapse tb 0 25 50 75 100 percentage (%) not evaluated lost to follow−up died failure treatment success data from 2016 were used for mdr/rr-tb and xdr-tb and from 2017 for the other types of tb. wpsar vol 11, no 4, 2020 | doi: 10.5365/wpsar.2020.11.3.002https://ojs.wpro.who.int/ 9 epidemiology of tuberculosis in the western pacific regionmorishita et al from 1351 in 2015 to 1998 sites in 2018, based on reports from 15 countries and areas.4 increased case notification rates were reported in several high-burden countries (lao people’s democratic republic, papua new guinea and philippines), which may reflect intensified case detection in these countries. careful monitoring will be necessary to ensure that the numbers do not decrease over time. the same observation applies to pacific island nations, such as the marshall islands, where active case finding projects may transiently increase the case numbers; if the projects are successful, they should be followed by drastic reductions in case numbers. between 2015 and 2019, total funding, both domestic and international, for tb in countries and areas of the region increased by 67%, from us$ 504 million to us$ 843 million, although the funding gap remains large at us$ 249 million (23%).3,4 indications of increased resource allocation and service provision are encouraging, as they may reflect increased political commitment from governments in the region. overall progress in reducing the tb burden in the western pacific region is slow, as little progress has despite a long-standing policy to test all tb patients for hiv infection, the proportion of tb patients of known hiv status remained low in many countries. the case fatality ratios were high in japan (16%), lao people’s democratic republic (22%), papua new guinea (13%) and vanuatu (17%). contact investigation coverage and treatment coverage for new drugs were among the “top-10” tb indicators; however, data are not available. the 2020 end tb strategy milestones of reduced tb incidence rate and deaths were achieved by 2018 by only 19% (7/36) and 11% (4/36) of the countries in the region, respectively. discussion this epidemiological analysis shows regional progress over time in certain programmatic areas, including sustained, good treatment outcomes, improvements in tb/ hiv indicators and improved case detection and enrolment of mdr/rr-tb cases. programmes should continue to extend diagnosis and case finding, enhance service quality and increase resources for tb programmes. the number of sites in the region that provide tb diagnoses with xpert mtb/rif® increased by 48%, fig. 9. key gaps in the cascade of care for tb, mdr/rr-tb and tb/hiv co-infection in the western pacific region, 2018 data for 2017 were used for successfully treated cases of tb and tb/hiv co-infection and data for 2016 for successfully treated cases of mdr/rr-tb. ●● 100% 77.2% 66.4% 0 500k 1m 1.5m 2m estimated incidence notified successfully treated tb ●● 100% 27.2% 20% 8.6% 0 25k 50k 75k 100k 125k estimated incidence lab− confirmed enrolled in treatment successfully treated mdr/rr−tb ●● 100% 38.9% 32.4% 23.7% 0 10k 20k 30k 40k 50k estimated incidence notified enrolled in art successfully treated tb/hiv wpsar vol 11, no 4, 2020 | doi: 10.5365/wpsar.2020.11.3.002 https://ojs.wpro.who.int/10 morishita et alepidemiology of tuberculosis in the western pacific region our analyses signal several challenges for the region: (1) wide variation among countries in the geographical distribution and incidence of tb, including the fact that tb continues to largely affect younger age groups in several countries; (2) a sizeable proportion of tb cases remain unreached, undiagnosed or unreported; (3) insufficient coverage of dst and use of whorecommended rapid diagnostic tests; (4) suboptimal tb treatment success rates in some countries and poor been made in some countries. in 2018, the tb incidence rate was 96 per 100 000 population, whereas the 2020 milestone is 79 per 100 000 population, and an estimated 97 000 deaths from tb occurred, whereas the 2020 milestone is 70 200. in view of the current annual reductions in the tb incidence rate (1.0%) and the number of deaths (3.4%), the region is unlikely to achieve the 2020 milestones and other targets of the end tb strategy. table 1. proposed scorecard for assessing the “top-10” indicators for monitoring implementation of the end tb strategy in the western pacific region treatment coverage treatment success rate tb‐affected households with catastrophic costs due to tb tb patients tested using wrd at diagnosis ltbi treatment coverage (plhiv) ltbi treatment coverage (child contact) dst coverage for tb patients documentation of hiv status case fatality ratio estimated incidence rate estimated deaths recommendeed target† ≥90% ≥90% 0% ≥90% ≥90% ≥90% 100% 100% ≤5% ‐20% ‐35% american samoa* 80 100 australia 87 82 93 88 3 10 ‐3 brunei darussalam* 87 75 0 0 100 100 6 15 ‐4 china 92 93 15 63 60 5 ‐6 ‐5 cook islands* fiji* 80 81 40 95 100 109 89 9 4 11 micronesia (federated states of)* 80 88 86 0 11 ‐10 ‐7 guam* 87 89 69 100 96 8 ‐9 ‐7 china, hong kong sar 87 65 32 11 91 78 3 ‐7 ‐13 japan 87 68 62 74 8.3 16 ‐14 ‐8 cambodia 58 94 0 94 7 ‐18 ‐9 kiribati* 80 89 50 100 51 11 ‐38 1 republic of korea 94 83 26 60 84 7 ‐17 ‐9 lao people's democratic republic 57 89 63 63 18 52 81 22 ‐11 ‐33 china, macao sar* 87 82 68 20 99 92 8 ‐16 ‐12 marshall islands* 170 83 77 100 22 11 45 47 mongolia 29 91 70 39 0 7.4 79 70 3 0 ‐1 northern mariana islands (commonwealth of the)* 87 98 32 100 100 8 65 64 malaysia 87 81 38 88 78 82 5 3 1 new caledonia* 87 35 5.4 100 30 8 ‐36 ‐34 niue* 87 0 8 nauru* 87 78 0 0 8 ‐51 ‐50 new zealand* 87 82 100 0 0.3 4 1 3 philippines 63 91 35 36 52 9.4 4 27 5 1 ‐8 palau* 87 80 88 100 94 8 20 21 papua new guinea 75 68 54 21 27 0 55 13 0 12 french polynesia* 87 81 63 100 85 8 15 17 singapore 87 79 60 0 100 98 89 2 5 ‐11 solomon islands* 80 92 27 0 28 11 ‐14 ‐7 tokelau* 11 ‐85 ‐84 tonga* 87 82 89 100 100 8 ‐37 ‐36 tuvalu* 87 68 74 89 100 8 30 35 viet nam 57 92 63 20 39 22 84 85 8 ‐9 ‐24 vanuatu* 67 96 46 100 69 17 ‐27 17 wallis and futuna* samoa* 87 57 0 0 100 8 ‐43 ‐42 cutoff values for colour code green ≥85 ≥85 ≤29 ≥80 ≥70 ≥70 ≥80 ≥85 ≤5 < 0 < 0 yellow 60‐84 75‐84 30‐59 60‐79 50‐69 50‐69 60‐79 75‐84 6‐9 0‐5 0‐5 red ≤59 ≤74 ≥60 ≤59 ≤49 ≤49 ≤59 ≤74 ≥10 ≥6 ≥6 top indicators (%) % change from 2015 † the target levels are for 2025 for the “top indicators” and for 2020 for “% change from 2015” of estimated incidence and deaths. targets for contact investigation coverage and treatment coverage for new tb drugs, which are included in the top 10 indicators, are not available in the who global tb database. detailed definitions of each indicator are provided in the global tb report 2019, p. 15.1 * countries estimated to have fewer than 1000 cases, where the percentage change in estimated incidence and deaths may not reflect true trends because of possible large fluctuations. pitcairn islands is excluded from annual collection of data on tb. dst: drug susceptibility testing; ltbi: latent tuberculosis infection; plhiv: people living with hiv; tb: tuberculosis; wrd: who-recommended rapid diagnostic test. wpsar vol 11, no 4, 2020 | doi: 10.5365/wpsar.2020.11.3.002https://ojs.wpro.who.int/ 11 epidemiology of tuberculosis in the western pacific regionmorishita et al including cambodia, china, the lao people’s democratic republic, mongolia and papua new guinea.14 in the philippines, over-reliance on chest x-ray for diagnosis resulted in increased case notifications of clinically diagnosed tb in the 2010s. subsequently, the introduction of a mandatory tb notification policy increased reporting from the private sector, resulting in a sharp rise in case notifications in 2018, although a national survey demonstrated many unidentified cases. (epidemiological review for tuberculosis in the philippines. 2019, unpublished). the recent increase in tb case notifications in the lao people’s democratic republic can be attributed to intensified case-finding among high-risk populations (epidemiological review for tuberculosis in lao people’s democratic republic. 2019, unpublished), and a decrease in case notifications in cambodia is probably attributable to reduced community-based case-finding activities because of reduced external funding (epidemiological review for tuberculosis in cambodia. 2019, unpublished). trends in case notification should therefore be considered carefully in relation to any major programmatic changes. in most instances, an emphasis on “finding missing cases” is appropriate. furthermore, given the geographical variation in tb epidemiology within a country, monitoring and evaluation should be strengthened at subnational level to ensure better-targeted interventions guided by data.15 accurate diagnosis is a fundamental component of tb care. rapid molecular diagnostics ensure early detection and prompt treatment, while testing for drug resistance is essential to ensure appropriate treatment.1 as part of tb laboratory-strengthening in the end tb strategy, countries are encouraged to adopt a policy to use a who-recommended rapid diagnostic test as the initial test for all people with presumptive tb and to provide universal access to dst for patients with bacteriologically confirmed tb.1 in the region in 2018, only 25% of countries and areas (n = 9/36) had a policy to use a who-recommended rapid test at diagnosis, and only 39% (n = 14/36) had a policy of universal access to dst.4 this explains the insufficient dst coverage and use of who-recommended rapid diagnostic tests that we observed. adoption and implementation of such policies requires substantial investment, with sustainable financing for tb laboratory services. this remains a major challenge, but successful examples exist in other parts of the world16 to guide implementation. in-depth analysis of national networks for tb diagnosis and specimen transport to understand the levels of underutilization or treatment outcomes for plhiv and patients with dr-tb; (5) limited tpt coverage of plhiv and child contacts; and (6) a substantial proportion of tb-affected families facing catastrophic costs. the wide variation in tb epidemiology and contextual factors among countries poses a challenge for mounting a coordinated regional tb response. in countries with a low tb burden, such as australia and new zealand, >80% of the cases notified are in foreign-born individuals, and tb is essentially an imported disease.4 in countries and areas with ageing populations, such as japan and the republic of korea, tb occurs mainly in the elderly, people aged ≥65 years accounting for 66.7% of total case notifications in japan, 45.4% in the republic of korea and 43.7% in hong kong sar (china) in 2018.4 in lower-income high-burden countries, undernutrition is considered a major risk factor for tb,1 and high rates of cigarette smoking may contribute to over-representation of tb in men.9 in pacific island countries, diabetes is highly prevalent and considered a major driver of the tb epidemic.10,11 understanding of population-level risk factors for tb by analysis of routine surveillance data, survey results and facility records is important in order to design targeted interventions. the western pacific region therefore requires a tailored regional strategy to guide the response in various epidemiological and contextual settings, including for small pacific island countries with unique geographical challenges and high tb incidence rates per capita, such as kiribati, marshall islands and tuvalu. tb case notifications are affected by many factors, and careful analysis and interpretation are required to understand the strengths and weaknesses of national tb programmes. interventions such as community-based active case finding, facility-based systematic screening, increased use of sensitive screening and diagnostic tools and algorithms, improved referral mechanisms and specimen transport, engagement of private and other health sectors and mandatory notification policies can increase case notifications.12,13 although decreasing numbers of case notifications may represent a true decrease in tb incidence, they may be due to decreased case finding or reduced tb programme funding and functioning.12 in the region, significant funding for tb is provided by the global fund to fight aids, tuberculosis and malaria. over time, such funding has supported expansion of tb services and improved tb surveillance in many high-burden countries, wpsar vol 11, no 4, 2020 | doi: 10.5365/wpsar.2020.11.3.002 https://ojs.wpro.who.int/12 morishita et alepidemiology of tuberculosis in the western pacific region 4 million children under 5 years who are household contacts of people affected by tb and 20 million other household contacts of tb cases.1 at the current rate of treatment enrolment, the world will not reach the target for household contacts, and, in may 2020, global tb partners released a joint call to action to scale up access to tpt.22 in view of the low coverage of tpt in the region, rapid adoption and implementation of the recently published tpt guidelines23 is critical. in particular, a systems approach is necessary to make contact investigation and tpt integral parts of primary health care services as an essential public health function.24 tb patients continue to bear a heavy financial burden, despite the provision of free tb services in most countries in the region. national surveys of the cost of tb patients have provided solid evidence that tb-affected families face severe financial hardship, non-medical costs and income loss due to tb are major components, poor households get poorer due to tb and loss of jobs, and households of patients with dr-tb and tb/hiv co-infection face significantly higher costs.1,25 these results are powerful arguments for initiating policy dialogue with other programmes and sectors and as a basis for policies and strategies to optimize health care delivery and financing and increase social protection for tb patients.1 this analysis has several limitations. first, data for several indicators, such as tpt and dst coverage, were not complete, and therefore the regional averages are not always from all countries. second, regional averages of the indicators and estimated burden are driven largely by the numbers recorded in china and the philippines, where the numbers of cases are relatively large; therefore, the findings must be interpreted carefully. third, the number and proportion of successfully treated patients used in the analysis of the care cascade were for patient cohorts in previous years (2017 for tb and tb/hiv, 2016 for dr-tb); therefore, the gaps calculated for 2018 may not be accurate, although we believe them to be very close approximations of the complete data set. finally, in countries and areas with few cases, the percentage changes in estimated incidence and mortality shown on the scorecard may not reflect true trends because of possible large fluctuations. despite these limitations, our analysis provides comprehensive, useful insights into the regional tb situation based on access to existing diagnostic tools and investigation of opportunities for collaboration with other public health programmes and the private sector could pave the way for a massive roll-out of who-recommended rapid diagnostic tests and expanded dst. this will be essential to close the gap in case detection and improve treatment outcomes for patients with mdr/rr-tb. it could also reduce mdr/rr-tb transmission by prompt initiation of effective treatment. estimating longer-term population-level benefits of such policies could convince policy-makers to take action. treatment outcomes remain a challenge in many countries in the region, particularly for patients with drtb and tb/hiv co-infection. who recommends a wide range of interventions to facilitate early diagnosis and optimal treatment, including screening of plhiv for tb, early initiation of art, better infection control, provision of tpt, wider use of more effective mdr-tb treatment regimens, active tb drug-safety monitoring and management and more patient-centred models of care.1 digital technologies to support adherence to tb medication are becoming increasingly available.17 assessing and addressing gaps in such interventions and promoting the uptake of new tools and innovations should help to improve treatment outcomes. furthermore, risk groups and geographical areas in which poor treatment outcomes are reported should be identified to guide the most appropriate targeted responses. generally, treatment outcomes vary by geographical areas according to the local tb epidemiology and response.18 (epidemiological review for tuberculosis in the philippines. 2019, unpublished; epidemiological review for tuberculosis in lao people’s democratic republic. 2019, unpublished). in japan, the overall treatment success rate is low mainly because of a high mortality rate among the elderly, the population most affected by tb.19 other countries in which the population is ageing rapidly and the proportion of tb cases among the elderly is increasing may face a similar challenge in the future.20 global and regional tb programmes should be ready to address the issue of tb among the elderly on the basis of evidence-based guidance and effective interventions.21 tpt is an essential intervention for achieving the goals of the end tb strategy. the first united nations high-level meeting on tb, held in 2018, set a new global target, to provide tpt to at least 30 million people in the period 2018–2022, comprising 6 million plhiv, wpsar vol 11, no 4, 2020 | doi: 10.5365/wpsar.2020.11.3.002https://ojs.wpro.who.int/ 13 epidemiology of tuberculosis in the western pacific regionmorishita et al 4. global tuberculosis database. geneva: world health organization; 2020. available from: https://www.who.int/tb/country/data/download/en/. 5. glaziou p. predicted impact of the covid-19 pandemic on global tuberculosis deaths in 2020. medrxiv. doi:10.1101/2020.04.28. 20079582. 6. regional framework for action on implementation of the end tb strategy in the western pacific, 2016–2020. manila: world health organization regional office for the western pacific; 2016. available from: https://iris.wpro.who.int/bitstream/handle/10665.1/13131/9789290617556_eng.pdf. 7. rahevar k, fujiwara pi, ahmadova s, morishita f, reichman lb. implementing the end tb strategy in the western pacific region: translating vision into reality. respirology. 2018;23(8):735– 42. 8. definitions and reporting framework for tuberculosis – 2013 revision (updated december 2014 and january 2020). geneva: world health organization; 2013. available from: https://apps.who.int/ iris/bitstream/handle/10665/79199/9789241505345_eng. pdf?sequence=1. 9. marais bj, lönnroth k, lawn sd, migliori gb, mwaba p, glaziou p, et al. tuberculosis comorbidity with communicable and noncommunicable diseases: integrating health services and control efforts. lancet infect dis. 2013;13(5):436–48. 10. trinidad rm, brostrom r, morello mi, montgomery d, thein cc, gajitos ml, et al. tuberculosis screening at a diabetes clinic in the republic of the marshall islands. j clin tuberc other mycobact dis. 2016;5:4–7. 11. viney k, cavanaugh j, kienene t, harley d, kelly pm, sleigh a, et al. tuberculosis and diabetes mellitus in the republic of kiribati: a case–control study. trop med int health. 2015;20(5):650–7. 12. understanding and using tuberculosis data. geneva: world health organization; 2014. available from: https://apps.who.int/iris/bitstream/handle/10665/129942/9789241548786_eng.pdf;jse ssionid=a3e2f29ee3f8c50c70dc7d24ac58a7bd?sequen ce=1. 13. systematic screening for active tuberculosis; principles and recommendations. geneva: world health organization; 2013. available from: https://apps.who.int/iris/bits t r e a m / h a n d l e / 10 6 6 5 / 8 4 9 71 / 9 7 8 9 2415 4 8 6 01 _ e n g . pdf?sequence=1. 14. theglobalfund data explorer. geneva: global fund to fight aids, tuberculosis and malaria; 2020. available from: https://data.theglobalfund.org/investments/home. 15. nishikiori n, morishita f. using tuberculosis surveillance data for informed programmatic decision-making. west pac surveill response. 2013;4(1):1–3. 16. rehm m, de melo freitas m, van der land j. optimizing and understanding the use of xpert mtb/rif® testing (challenge tb technical brief). washington, dc: united states agency for international development; 2019. available from: https://www.challengetb.org/publications/tools/briefs/ctb_technical_brief_genexpert.pdf. 17. handbook for the use of digital technologies to support tuberculosis medication adherence [internet]. geneva: world health organization; 2017. available from: https://apps.who.int/iris/ bit stre am / handle /10665/2598 32 /9789241513456 eng. pdf?sequence=1. several years of data reported according to adopted, well-established case definitions from nearly all the countries in the region. if the region is to achieve the end tb strategy targets beyond the interim 2020 milestones, it must overcome several challenges. some of these challenges lie outside national tb programmes and even the health sector, requiring a multisectoral response.3 in addition, the covid-19 pandemic has disrupted health services worldwide and poses a considerable challenge for tb programmes and for tb patients; however, it also provides an opportunity to increase investment in health and to promote multisectoral responses to health system transformation, from which the tb programme can benefit and to which it can contribute. the who regional office for the western pacific will continue to provide data-driven, evidence-based regional guidance and will support member states on their journey towards ending tb. acknowledgements the authors wish to thank the national tb programmes in the countries and areas of the western pacific region. they are grateful to everyone involved in collecting and validating data and estimating burden, particularly who staff in the tb monitoring and evaluation team of the global tb programme at who headquarters and who country offices in the western pacific region. conflicts of interests the authors have no conflict of interests. funding none. references 1. global tuberculosis report 2019. geneva: world health organization; 2019. available from: https://apps.who.int/iris/bitstream/han dle/10665/329368/9789241565714-eng.pdf?ua=1. 2. sixty-seventh world health assembly. global strategy and targets for tuberculosis prevention, care and control after 2015. geneva: world health organization; 2014. available from: https://apps. who.int/gb/ebwha/pdf_files/wha67-rec1/a67_2014_rec1-en. pdf. 3. multisectoral accountability framework to accelerate progress to end tuberuculosis. geneva: world health organization; 2019. available here: https://www.who.int/tb/who_multisectoral_ framework_web.pdf?ua=1. wpsar vol 11, no 4, 2020 | doi: 10.5365/wpsar.2020.11.3.002 https://ojs.wpro.who.int/14 morishita et alepidemiology of tuberculosis in the western pacific region 22. overcoming key barriers to scale up tuberculosis preventive treatment (tpt); a call to action. geneva: world health organization; 2020. available from: https://www.who.int/tb/calltoactiontpt_scaleup.pdf?u=f093a7c38a3780cd9504f8d9d&id=1 35bdee6af&e=09bced52fa. 23. who operational handbook on tuberculosis, module 1: prevention, tuberculosis preventive treatment. geneva: world health organization; 2020. available from: https://apps.who.int/iris/bitstream/handle/10665/331525/9789240002906-eng.pdf. 24. reuter a, seddon ja, marais bj, furin j. preventing tuberculosis in children: a global health emergency. paediatric respir rev. 2020;s1526-0542(20)30023-3. 25. viney k, islam t, hoa nb, morishita f, lönnroth k. the financial burden of tuberculosis for patients in the western-pacific region. trop med infect dis. 2019;4(2):94. 18. aia p, wangchuk l, morishita f, kisomb j, yasi r, kal m, et al. epidemiology of tuberculosis in papua new guinea: analysis of case notification and treatment-outcome data, 2008–2016. west pac surveill response. 2018;9(2):9–19. 19. uchimura k, ngamvithayapong-yanai j, kawatsu l, ohkado a, yoshiyama t, shimouchi a, et al. characteristics and treatment outcomes of tuberculosis cases by risk groups, japan, 2007– 2010. west pac surveill response. 2013;4(1):11–8. 20. negin j, abimbola s, marais bj. tuberculosis among older adults – time to take notice. int j infect dis. 2015;32:135–7. 21. li j, chung ph, leung clk, nishikiori n, chan eyy, yeoh ek. the strategic framework of tuberculosis control and prevention in the elderly: a scoping review towards end tb targets. infect dis poverty. 2017;6(1):70. https://ojs.wpro.who.int/ 1wpsar vol 12, no 4, 2021 | doi: 10.5365/wpsar.2021.12.4.903 surveillance report d ue to the coronavirus disease 2019 (covid-19) pandemic, the tokyo 2020 olympic and paralympic games (the games) were rescheduled for 23 july to 5 september 2021. the attendance of spectators from abroad was not permitted; however, several tens of thousands of people associated with the games were expected to visit japan from more than 200 countries and regions. the visitors included national olympic and paralympic team members, media crews and sponsors. since international mass gatherings have high potential to disseminate communicable diseases to several countries,1 it was important during the games to monitor infectious diseases occurring overseas that have potential for importation. event-based surveillance (ebs) is the organized and rapid capture of information about events that are a potential risk to public health.2 official and unofficial information sources can be used for ebs, and the information obtained should be used to rapidly assess the risk that the event poses to public health, so that a timely response can be taken. as stated in the asia pacific strategy for emerging diseases and public health emergencies (apsed iii),3 various information sources for ebs are useful for assessing contextual vulnerabilities and creating risk assessments to develop response strategies. in the past, new ebs systems have often been created for international mass gatherings to respond to complex and evolving situations. however, this was not practical for the games, owing to the burden of the covid-19 pandemic on national surveillance and response teams. therefore, to address the high demand on local resources, we used external resources in our enhanced ebs for imported infectious diseases. this paper describes the methodology and preliminary results of the enhanced ebs for infectious diseases occurring overseas (excluding covid-19) that have potential for importation before and during the games. a field epidemiology training program, national institute of infectious diseases, tokyo, japan. b center for field epidemic intelligence, research and professional development, national institute of infectious diseases, tokyo, japan. c center for emergency preparedness and response, national institute of infectious diseases, tokyo, japan. published: 22 december 2021 doi: 10.5365/wpsar.2021.12.4.903 in 2021, the national institute of infectious diseases, japan, undertook enhanced event-based surveillance (ebs) for infectious diseases occurring overseas that have potential for importation (excluding coronavirus disease 2019 [covid-19]) for the tokyo 2020 olympic and paralympic summer games (the games). the pre-existing ebs system was enhanced using the world health organization epidemic intelligence from open sources system and the bluedot epidemic intelligence platform. the enhanced ebs before and during the games did not detect any major public health event that would warrant action for the games. however, information from multiple sources helped us identify events, characterize risk and improve confidence in risk assessment. the collaboration also reduced the surveillance workload of the host country, while ensuring the quality of surveillance, even during the covid-19 pandemic. enhanced event-based surveillance for imported diseases during the tokyo 2020 olympic and paralympic games ayu kasamatsu,a masayuki ota,a tomoe shimada,b munehisa fukusumi,b,c takuya yamagishi,b anita samuel,b manami nakashita,a tomohiko ukai,a katsuki kurosawa,a miho urakawa,a kensuke takahashi,a keiko tsukada,a akane futami,a hideya inoue,a shun omori,a miho kobayashi,a hiroko komiya,a takahisa shimada,a sakiko tabata,a yuichiro yahata,b hajime kamiya,b fumi yoshimatsu,c tomimasa sunagawab and tomoya saitoc correspondence to tomoe shimada (email: tomoes@niid.go.jp) wpsar vol 12, no 4, 2021 | doi: 10.5365/wpsar.2021.12.4.903 https://ojs.wpro.who.int/2 kasamatsu et alenhanced event-based surveillance for the tokyo 2020 games intelligence activities.6 it collects articles each day from a broad range of online official and unofficial sources and publishes the categorized information through its user interface, which is accessible only to authorized individuals. the who regional office for the western pacific conducted screening based on their standardized approach and emailed niid a list of detected signals once a day.4 this screening report provided a summary of signals, including the number of reports, affected population characteristics, reporting period, reporting region, baseline data and actions taken. the regional office also provided their qualitative assessment of the risk of importation into japan during the games and of further spread within the country, as well as the potential significant impact on society. these signals were defined as events. bluedot’s web-based ei platform shows quantitative risk assessments based on modelling that calculates the importation risk based on air travel data and local infectious disease epidemiological data.7,8 bluedot obtained local disease activity hourly from online sources such as international organizations and public health agencies, promed-mail and global database of events, language and tone. the information was first scanned by bluedot’s artificial intelligence system and then screened and verimethods the enhanced ebs for the games was conducted at the national institute of infectious diseases (niid), japan, which houses the country’s field epidemiology training programme (fetp). three staff members and 15 fetp fellows were engaged in ebs from 1 july to 19 september 2021, 7 days a week. the initial period (1–10 july) was a test run, during which ebs was conducted in the same way as for the actual operation (from 11 july). each day, two fellows and one staff member oversaw the daily ebs. concurrent national disease surveillance systems, including those for covid-19 and ebs for domestic events, are not described here. the enhanced ebs systems supplemented an existing surveillance system targeting 69 diseases in 80 countries, not including japan (table 1). the priority diseases were pre-selected based on their epidemic status, severity and unfamiliarity among physicians in japan (a factor that may cause delays in diagnosis and treatment). the countries and regions to be monitored were selected from among those that have previously participated in the games with the highest numbers of estimated participants and officials present. the enhanced ebs for infectious diseases occurring overseas (other than covid-19) comprised the pre-existing ebs system plus two external systems – the world health organization (who) epidemic intelligence from open sources (eios) system and the bluedot epidemic intelligence (ei) platform, a surveillance and risk assessment platform that leverages both artificial intelligence and human intelligence (fig. 1).4,5 pre-existing ebs sources included international health regulations (2005) notifications and information publicly available via the internet. sources included official information from international organizations such as who and national health authorities, and unofficial information from news aggregators, blogs, expert groups and other systems such as promed, the center for infectious disease research and policy at the university of minnesota and healthmap. from these sources, we screened for events each day based on our screening criteria (box 1). the who eios system is a web-based system designed to augment and accelerate global public health box 1. screening criteria for pre-existing eventbased surveillance, japan, 2021 • events related to emerging infectious diseases that should be monitored: • sustained human-to-human transmission of a known emerging infectious disease • outbreaks with undiagnosed symptoms. • events of concern that have potential impact on japan: • events with potential impact on japanese travellers • events with potential for disease importation (occurrence above baseline, unexpected outbreaks of fatal infectious diseases) • events with contaminated food distributed to japan • potential for dispatch of international emergency relief teams from japan • potential need to review response and countermeasures (e.g. update of case definitions, update of epidemiological investigation guidelines). • events posted on who event information site wpsar vol 12, no 4, 2021 | doi: 10.5365/wpsar.2021.12.4.903https://ojs.wpro.who.int/ 3 enhanced event-based surveillance for the tokyo 2020 gameskasamatsu et al fied by their experts. users could select a disease on the platform and see the risk of importation from every other country to japan. the risk of importation was defined by bluedot as at least one infected person entering japan by plane and was classified as high or higher risk if it was greater than 50%. we checked the platform for updates at a set time each day and defined events as those that were newly flagged as high or higher risk. for signals or events with uncertain information, verification was conducted by referring to official sources or by combining multiple sources. after verification, we recorded all events in the ebs database and conducted risk assessments to determine their risk of association with the games (box 2). first, we assessed the potential risk of importation of diseases to japan in relation to the games by referring to previous national surveillance data of imported cases to japan,9–11 who epidemiological reports, the number of previous visitors to japan12 and the number of estimated games participants. second, if an importation risk related to the games existed, the consequent risk of transmission among games personnel a diseases not included in the bluedot system. mode of transmission surveillance-priority infectious diseases human-to-human diphtheria, poliomyelitis, tuberculosis,a hepatitis b,a varicella, pertussis, measles, rubella, sexually transmitted infections (hiv, syphilis, chlamydia, gonorrhoea),a meningococcal disease, seasonal influenza, acute gastroenteritis, mumps, bacterial meningitisa foodborne enterohaemorrhagic escherichia coli infection,a cholera, shigellosis,a typhoid/ paratyphoid, hepatitis a, hepatitis e, botulism, amoebiasis,a cryptosporidiosis,a giardiasis,a listeriosis soil/waterborne coccidioidomycosis, leptospirosis, legionnaires’ disease, melioidosis, tetanus, cryptococcus gattii infection,a strongyloidiasis, histoplasmosis animal-borne middle east respiratory syndrome coronavirus, lassa fever, south american haemorrhagic fever, avian influenza, q fever, rabies, anthrax, hantavirus infection, brucellosis, hendra virus disease, rift valley fever, tularaemia, lyssavirus infectiona mosquito-borne japanese encephalitis, west nile virus infection, yellow fever, zika virus disease, chikungunya virus disease, western equine encephalitis, eastern equine encephalitis, dengue, malaria, st. louis encephalitis, la crosse encephalitis, ross river virus disease, barmah forest virus disease, oropouche fever tick-borne severe fever with thrombocytopenia syndrome virus infection, crimean-congo haemorrhagic fever, tick-borne encephalitis, lyme disease, omsk haemorrhagic fever, recurrent fever, kyasanur forest disease, colorado tick fever, rocky mountain spotted fever, african tick-bite fever,a queensland tick typhus,a mediterranean spotted fever, other spotted fever group rickettsioses,a powassan virus disease, anaplasmosis, ehrlichiosis other arthropod-borne plague, scrub typhus, leishmaniasis, chagas disease table 1. list of priority infectious diseases (other than coronavirus disease 2019) for event-based surveillance during the tokyo 2020 olympic and paralympic games, japan (n = 80) box 2. risk assessment criteria for publishing events in the daily national institute of infectious diseases report, japan, 2021 • does the event have a high probability of importation of infectious diseases? • do the infectious diseases have a high probability of transmission among games personnel? • do the infectious diseases have a high probability of transmission from games personnel to the community? • does the event have a reputational risk among games personnel and relevant stakeholders? and athletes was evaluated. we also assessed whether events posed a potential risk to the games. the level of risk was discussed between staff and fetp fellows and was qualitatively determined as high, medium or low by consensus. through these processes, events that were considered to pose a high risk to the games were posted wpsar vol 12, no 4, 2021 | doi: 10.5365/wpsar.2021.12.4.903 https://ojs.wpro.who.int/4 kasamatsu et alenhanced event-based surveillance for the tokyo 2020 games in daily reports with summaries and assessments. they were distributed to local governments and the tokyo organising committee of the olympic and paralympic games through the ministry of health, labour and welfare, to alert them and help them to respond in a timely manner. results overall, 140 events and 20 diseases were identified by the enhanced ebs system during the provisional period of 11 july to 8 august 2021; that is, from the end of the 10-day test run to the closing day of the olympics (table 2). a total of 17 events and 10 diseases were detected by the pre-existing system, 121 events and 11 diseases by the eios system, and two events and two diseases by the bluedot platform. the median number of events per day was 5 (range, 1–9). all identified events were evaluated for risk, with none meeting the high-risk criteria for publishing in the daily report (table 3). the time required to conduct ebs using the three systems was less than 60 minutes per fetp fellow per day. discussion enhanced ebs of infectious diseases occurring overseas that have potential for importation, other than covid-19, was conducted for the tokyo 2020 olympic and fig. 1. overview of event-based surveillance for infectious diseases occurring overseasa during the tokyo 2020 olympic and paralympic games, japan pre-existing ebs sources screening report from the who regional o�ce for the western paci�c signals events response alert/daily report veri�cation discarded discarded screening bluedot el platform reputation risk risk of spread among games personnel/athletes risk assessment risk of importation moderate/high high ebs: event-based surveillance; ei: epidemic intelligence; who: world health organization. a excludes coronavirus disease 2019. wpsar vol 12, no 4, 2021 | doi: 10.5365/wpsar.2021.12.4.903https://ojs.wpro.who.int/ 5 enhanced event-based surveillance for the tokyo 2020 gameskasamatsu et al ebs: event-based surveillance; ei: epidemic intelligence; who: world health organization. a excludes coronavirus disease 2019. ebs: event-based surveillance; ei: epidemic intelligence; usa: united states of america; who: world health organization. table 2. number of events and diseases detected by event-based surveillance of infectious diseases occurring overseasa before and during the tokyo 2020 olympic games, japan, 11 july to 8 august 2021 table 3. examples of risk assessment for events detected in event-based surveillance before and during the tokyo 2020 olympic games, japan, 11 july to 8 august 2021 pre-existing ebs screening report from the who regional office for the western pacific bluedot ei platform total number of events 17 121 2 140 number of diseases 10 11 2 20 disease avian influenza b virus infection, cyclospora infection, cholera, dengue, japanese encephalitis, middle east respiratory syndrome, monkeypox, plague, typhoid fever acute gastroenteritis, chikungunya, dengue, hepatitis a, hepatitis b, middle east respiratory syndrome, sexually transmitted infections, unknown disease, west nile virus infection, yellow fever, zika virus disease dengue, malaria date of recording ebs system/disease/ source event summary risk assessment 29 july eios/hepatitis a/ media 495 cases associated with a national hepatitis a outbreak have been reported in north carolina, usa, since 1 january 2021. the usa has been experiencing nationwide outbreaks of hepatitis a since 2017, spread through person-to-person contact. the number of imported cases detected in japan from the usa over recent years has been 0–2 per year. the number of people entering japan from the usa has significantly decreased, and the risk of travellers, including games personnel, importing the virus into japan is low. 29 july pre-existing ebs/ monkeypox/who disease outbreak news a patient who developed monkeypox travelled from the usa to nigeria on 25 june. he returned to the usa on 9 july after disease onset and was quarantined on 13 july. possible community and health-care contacts are being monitored. the source of infection for this case is unknown. the risk of importation from nigeria to japan is low due to a significant decrease in the number of travellers and the low number of games participants from nigeria. the risk of spread of infection in the usa is low because contacts in the usa had been identified and were monitored during the incubation period after their last contact date. therefore, the risk of importation into japan is low. 3 august bluedot ei platform/ malaria/media 377 599 new cases of malaria were recorded in the northern angolan province of malanje in the first half of 2021, resulting in the deaths of 268 people. this is an increase in cases, but a reduction in deaths, compared with the same period in 2020. the actual increase in cases cannot be determined because data for previous years were not available. there have been no imported malaria cases from angola in the past 5 years, the number of travellers has decreased significantly from recent years, and the number of games participants from angola is less than 50. therefore, the risk of importation into japan is low. wpsar vol 12, no 4, 2021 | doi: 10.5365/wpsar.2021.12.4.903 https://ojs.wpro.who.int/6 kasamatsu et alenhanced event-based surveillance for the tokyo 2020 games day.14 for the games, a larger number of countries were targeted; however, the time required was less than 1 hour per day per fetp fellow. this reduction in time was largely due to events being triaged by the regional office and bluedot, which allowed niid staff to rapidly initiate an assessment based on information provided. globally, public health resources have been limited during the covid-19 pandemic; hence, the technical support from external resources was vital for implementing enhanced surveillance for the games. during future mass gatherings, the use of external platforms may make ebs more efficient for local governments and facilities with limited human resources. there were limitations to this enhanced ebs in terms of data triangulation. first, many of the information sources used by the three systems overlapped because they obtained information through existing informal or formal channels such as social media or promed. second, since the newly adopted systems were outsourced, there was a time lag between the signal screening and our detection. these limitations need to be considered if the assessment and response are required immediately, in which case, the system would need to be based at the relevant internal institution. ebs to monitor infectious diseases occurring overseas, apart from covid-19, for the games in japan was enhanced by working with external organizations. the triangulation of information provided reliable risk assessments without missing significant events. furthermore, the collaboration helped to reduce the effort required to screen a wide range of sources internally while maintaining the quality of surveillance, especially for this event that occurred during the covid-19 pandemic. acknowledgements we would like to thank the staff of the center for surveillance, immunisation, and epidemiologic research, and the center for emergency preparedness and response, niid. we would also like to thank dr manami yanagawa, mr john carlo lorenzo and dr tamano matsui of the who regional office for the western pacific, and bluedot for their support of our epidemic intelligence activities. paralympic games using the pre-existing ebs system and external ebs systems. the provisional results revealed that no events occurring overseas were assessed as high risk for importation during the games and none qualified to be published in the daily report. the absence of such events during the games may be due to reports of imported infectious diseases decreasing during the pandemic.13 although travellers entered japan for the games, overall arrivals were substantially lower than before the covid-19 pandemic, which may have led to an overall decrease in importation risk. in addition, infection control measures in place against covid-19 may have decreased the risk of disease importation. the enhanced ebs for the games resulted in more reliable risk assessments because the framework incorporated data triangulation among three sources – the preexisting ebs system in japan, the who eios system and the bluedot web-based ei platform. the same signals, obtained from multiple articles and different sources, were often reported from each system; such consistency in signals coming from sources with different timeliness, representativeness, sensitivity and completeness may increase the validity of risk assessments. furthermore, the intelligence obtained from different sources was complementary, providing more detailed information about the event than relying on a single source, which may have contributed to appropriate risk assessment.3 using three ebs systems also prevented public health events from being missed. for example, signals obtained from one system were not picked up as events in the other systems. this was partly due to differences in the initial assessment (e.g. bluedot could conduct quantitative risk assessment using more accurate travel data, whereas the eios-based screening report qualitatively assessed the risk associated with the games). incorporating external surveillance systems had the potential to reduce the time and effort required for signal screening for the games. the eios system is a useful tool to deliver extensive and prompt information, but its informative nature makes it time consuming. previously, the eios system was used for the 2019 rugby world cup in japan, with 79 infectious diseases across 30 countries targeted for surveillance; it required one staff member and two fetp fellows to work for 3 hours each wpsar vol 12, no 4, 2021 | doi: 10.5365/wpsar.2021.12.4.903https://ojs.wpro.who.int/ 7 enhanced event-based surveillance for the tokyo 2020 gameskasamatsu et al 5. bluedot inc. toronto: bluedot inc; 2021. available from: https:// bluedot.global, accessed 22 july 2021). 6. eios technology. geneva: world health organization; 2021. available from: https://www.who.int/initiatives/eios/eios-technology, accessed 22 september 2021. 7. nasserie t, brent se, tuite ar, moineddin r, yong jhe, miniota j, et al. association between air travel and importation of chikungunya into the usa. j travel med. 2019;26(5):taz028. doi:10.1093/jtm/ taz028 pmid:31011752 8. tuite ar, watts ag, khan k, bogoch ii. countries at risk of importation of chikungunya virus cases from southern thailand: a modeling study. infect dis model. 2019;4:251–6. doi:10.1016/j. idm.2019.09.001 pmid:31667444 9. infectious disease surveillance system in japan. tokyo: national institute of infectious diseases; 2018. available from: https://www.niid.go.jp/niid/ images/epi/nesid/nesid_en.pdf, accessed 22 july 2021. 10. notification trends among imported dengue cases in japan. tokyo: national institute of infectious diseases; 2021. available from: https://www.niid.go.jp/niid/images/epi/dengue/dengue_imported202108.pdf, accessed 18 august 2021. 11. trends in notification of imported cases among select notifiable infectious diseases in japan. tokyo: national institute of infectious diseases; 2021. available from: https://www.niid.go.jp/niid/images/ epi/imported/pdf/202107_webupimportedids.pdf, accessed 18 august 2021. 12. statistical survey on legal migrants (in japanese). tokyo: immigration services agency of japan; 2021. available from: http://www. moj.go.jp/isa/policies/statistics/toukei_ichiran_nyukan.html, accessed 18 august 2021. 13. ullrich a, schranz m, rexroth u, hamouda o, schaade l, diercke m, et al. impact of the covid-19 pandemic and associated nonpharmaceutical interventions on other notifiable infectious diseases in germany: an analysis of national surveillance data during week 1–2016 – week 32–2020. lancet reg health eur. 2021;6:100103. doi:10.1016/j.lanepe.2021.100103 pmid:34557831 14. shimada t. application of eios to mass gathering events. eios global technical meeting; 12–14 november 2019; seoul, republic of korea. the korea centers for disease control and prevention and the world health organization regional office for the western pacific. conflict of interest none ethics statement as this work is a report on daily event-based surveillance activities and does not involve human research, ethical clearance was not sought. funding this work was supported by health and labour sciences research grants (numbers h30-shikogyosei-shitei-004 and 21la2003) from the ministry of health, labour and welfare, japan. references 1. gautret p, steffen r. communicable diseases as health risks at mass gatherings other than hajj: what is the evidence? int j infect dis. 2016;47:46–52. doi:10.1016/j.ijid.2016.03.007 pmid:26987476 2. a guide to establishing event-based surveillance. manila: world health organization regional office for the western pacific; 2008. available from: https://apps.who.int/iris/handle/10665/207737, accessed 18 september 2021. 3. asia pacific strategy for emerging diseases and public health emergencies (apsed iii): advancing implementation of the international health regulations (2005): working together towards health security. manila: world health organization regional office for the western pacific; 2017. available from: http://iris.wpro.who.int/handle/10665.1/13654, accessed 18 august 2021. 4. lowbridge c, chiew m, russell k, yamagishi t, olowokure b, li a. regional event-based surveillance in who’s western pacific region. western pac surveill response j. 2020;11(2):11–9. doi:10.5365/ wpsar.2018.9.5.009 pmid:33537160 investigation and control of a measles outbreak at the hong kong international airport, 2019 outbreak investigation report wong chi hong,a,b chuang shuk kwan,a lam wing hang,a,b lam ho yeung,a lam tsz sum,a ho lei ming raymond,a leung yiu hong,a and lam chau kuen yonniea a centre for health protection, department of health, hong kong sar (china). b field epidemiology training programme, hong kong sar (china). correspondence to wong chi hong (email: smo_epi2@dh.gov.hk). to cite this article: wong ch, chuang sk, lam wh, lam hy, lam ts, ho lmr, et al. investigation and control of a measles outbreak at the hong kong international airport, 2019. western pac surveill response j. 2020 jun;10(2). doi:10.5365/wpsar.2019.10.2.007 introduction: hong kong sar (china) achieved measles elimination status in 2016, and the incidence of measles infection had been low over the past few years. however, the centre for health protection (chp) at the department of health was notified on 22 march 2019 of an outbreak of three cases of measles infection among workers at the hong kong international airport (hkia). methods: we reviewed notifications of measles received by chp from 1 january to 17 may 2019. we defined a confirmed case of measles as having laboratory evidence of measles infection. all confirmed cases among airport workers or those with epidemiological information suggesting they had been infected by contact with airport workers were included in the review. we described the epidemiological features and reviewed the control measures against the outbreak. results: we identified 33 cases, 29 of which were among airport workers. they comprised 22 men and 11 women, aged 20–49 years (median 25 years). the majority of people with confirmed measles presented with fever and rash. all required hospitalization. none developed complications. control measures, including enhanced environmental hygiene and improved ventilation at hkia and vaccinations for the airport community, were implemented. vaccinations were provided to 8501 eligible airport workers, and the outbreak was declared over on 17 may 2019. discussion: early recognition of the outbreak and prompt control measures, especially targeted vaccination of the exposed population, effectively controlled the outbreak in just two weeks. hong kong sar (china) achieved measles elimination in 2016. the annual number of measles cases had remained at a very low level since then, with nine, four and 15 cases recorded in 2016, 2017 and 2018, respectively. in 2019, amid worldwide increases in measles incidence, especially in the philippines, the centre for health protection (chp) of the department of health of hong kong sar (china) also recorded an upsurge of measles cases (73 cases as of 17 may 2019), including a major outbreak at the hong kong international airport (hkia). hkia occupies 1255 hectares on lantau island. it is one of the world’s largest and busiest airports, connecting 120 airlines to over 220 destinations worldwide and handling about 75 million passengers in 2018. it has more than 73 000 workers. chp was notified on 22 march 2019 of an outbreak of three cases among hkia workers, and an epidemiological investigation was initiated. methods case definition for this investigation, we defined a laboratory-confirmed case of measles as a person having any of the following: (1) a positive serological test for measles virus igm antibody; (2) a fourfold or greater increase in the measles antibody (igg) titre; (3) the isolation of measles virus from a clinical specimen; or (4) a positive reverse transcription-polymerase chain reaction (rt–pcr) for measles virus in a clinical specimen, with any of the four occurring between 11 february and 17 may 2019. typical measles was defined as a patient with laboratory-confirmed measles who presented with fever, rash and at least one of the three “c”s (cough, coryza or conjunctivitis). patients with laboratory-confirmed measles who did not have signs or symptoms satisfying the definition of typical measles were classified as having modified measles. study period and case selection the earliest recorded confirmed measles patient among the hkia workers had an onset of rash on 4 march 2019. in an effort to identify any other epidemiologically linked measles cases, we reviewed all measles cases notified to chp from 1 january to 17 may 2019. all cases among the hkia workers were included in the hkia outbreak investigation. patients with epidemiological information suggesting that they were infected or contracted the disease from an airport worker were considered to be epidemiologically linked to the hkia outbreak. we conducted an epidemiological investigation for every measles case. we reviewed the clinical records and interviewed patients for demographic information and their clinical course, travel history, exposure and contact history. we investigated the local movements of all patients during the incubation and communicable periods, attempting to postulate the transmission chain of the outbreak. we also reviewed chp records for the timing and type of control measures implemented during the outbreak. ethics statement ethics approval was not required as this was an emergency response case. results the cases we identified 29 cases among airport workers in the hkia outbreak and four cases epidemiologically linked to the outbreak (one airport visitor, one traveller and two health-care workers with nosocomial exposure to an airport case). these 33 cases comprised 22 men and 11 women, aged 20–49 years (median 25 years). two thirds (22/33) of the patients were aged 20–29 years. the first patient had an onset of rash on 4 march 2019, and the last patient had an onset of rash on 5 april 2019 (fig. 1). the vast majority had rash (33, 100%) and fever (31, 93.9%). their clinical courses were mild and none developed complications. all were isolated in a hospital until the end of the communicable period (four days after the onset of rash). all respiratory specimens from the 33 patients tested positive for measles virus by polymerase chain reaction (pcr) and belonged to genotype b3. click to download figure 1. jpg, 155kb the measles vaccination history of the 33 patients showed that 12 (36%) had a documented record of at least two doses of measles-containing vaccine, 19 (58%) had no officially documented history of vaccination, and two (6%) were unvaccinated. among the 33 cases, 23 (70%) were born in hong kong sar (china) and 10 (30%) were not born locally. fifteen cases (45%) were classified as typical measles, and 18 (55%) were modified measles. nine (50%) patients among the 18 modified measles cases and three (20%) among the 15 typical measles cases had received two or more doses of measles-containing vaccine. most (27/29) of the affected airport workers did not know each other and could not recall any direct contact with other affected individuals. we identified at least three sub-clusters of this outbreak, with separate sources of infection affecting 32 of the 33 cases. each of the suspected sources was responsible for two generations of infection and affected one to seven people in each generation (fig. 2). for one case, the source could not be determined. click to download figure 2. jpg, 124kb outbreak response the measles outbreak at hkia was confirmed on 22 march 2019 when three measles cases were notified to chp and an initial epidemiological investigation revealed that the affected individuals were all airport workers who likely contracted measles at work. an outbreak response team was formed on the same day to carry out in-depth epidemiological investigations and formulate targeted control measures. an onsite investigation was conducted with experts in microbiology and field epidemiology. hkia management was advised to improve ventilation by increasing the intake of fresh air and increasing the number of alcohol-based hand-rub dispensers in the airport. press releases alerted the public to the measles outbreak and provided information about prevention and control measures. immediately after the outbreak was identified, measles-mumps-rubella (mmr) vaccinations were offered to airport workers without presumptive measles immunity, for example, those without a history of vaccination, as an outbreak control measure. vaccination stations were set up at the airport, and medical teams, including doctors and nurses, were deployed to conduct onsite vaccinations. between 22 march and 17 may 2019, mmr vaccinations were provided to 8501 airport workers. the outbreak was declared over on 17 may after two incubation periods (42 days) passed since 5 april 2019, the date when the last case visited hkia. discussion this was the first major outbreak recorded in hong kong sar (china) since the certification of the elimination of measles in 2016. outbreaks among workers in airports have been reported previously elsewhere, for example, in kansai, japan, in 2016, affecting 34 individuals (including 32 airport staff members and two health-care workers) and taoyuan international airport in taiwan (china) in 2018.1,2 heavy traffic flows, crowded environments that include international travellers and the recent upsurge in measles cases worldwide put airport workers at higher risk than the general population of having contact with travellers infected with measles. the airport’s recirculating ventilation design and crowded environments in certain places, such as changing rooms, might have contributed to the transmission of measles among the hkia workers who shared the same air space but might not have close interaction with one another. measles virus can live up to two hours in airspace where an infected person has coughed or sneezed.3 susceptible individuals may become infected by breathing contaminated air and/or touching contaminated environments. more than half of the cases (55%) in this outbreak were classified as modified measles, which is considered to have lower transmission potential.4 this is consistent with our observation that most of the patients who gave rise to secondary cases presented with clinically typical measles. primary vaccine failure occurs in some recipients of measles-containing vaccine, with about 5% of people who received two doses of measles vaccines not developing immunity after vaccination.5 one study has suggested that in the post-elimination era, when there is lack of boosting of immunity from exposure of wild-type measles, the duration of immunity among vaccinated individuals may not last.6 moreover, recent studies also supported the presence of secondary vaccine failure, in which waning immunity in adults who received two doses of measles-containing vaccine was observed.7,8 among the 33 affected individuals, two thirds (22/33) were 20–29 years old, and more than half (12/22) of them had a documented history of having previously received two or more doses of measles-containing vaccine. further analysis of the igm and igg results from blood specimens taken within 72 hours of rash onset could provide more information on the proportion of cases with potential secondary vaccine failure. this outbreak lasted for a month, from 4 march, when the first patient had an onset of rash, to 5 april, when the last patient had an onset of rash, and the outbreak was halted after two generations of transmission. we believe that early recognition of the outbreak and prompt implementation of control measures, especially the aggressive vaccination campaign targeted at airport staff, effectively prevented further spread of the disease and swiftly controlled the outbreak in about two weeks – from the identification of the outbreak on 22 march to 5 april, when the last affected individual visited hkia. one limitation of this report is the fact that our analysis of the transmission was retrospective, based on self-reported local movement history provided by the patients. such reporting is subject to recall error and might not reflect the actual transmission chain. because of the mild clinical course of the cases, other undiagnosed measles cases likely existed but were not detected, which may underestimate the actual outbreak size. it is possible that other people may have been infected through this outbreak and travelled outside of hong kong sar (china) and, therefore, would not have been included in this study. cross-border communication of measles outbreaks involving other airports might have provided data to plug the loophole and better reflect the actual outbreak situation. conclusions measles remains a public health threat, even in areas where measles has been eliminated. we demonstrated that early recognition of an outbreak and prompt control measures, especially vaccination for a potentially exposed population, can quickly control measles outbreaks. acknowledgements we would like to thank the staff members of the surveillance and epidemiology branch at chp who contributed in the investigation and control of this outbreak. conflicts of interest none funding none references nishiura h, mizumoto k, asai y. assessing the transmission dynamics of measles in japan, 2016. epidemics. 2017 sep;20:67–72. doi:10.1016/j.epidem.2017.03.005 pmid:28359662 shimizu k, kinoshita r, yoshii k, akhmetzhanov a, jung s, lee h, et al. an investigation of a measles outbreak in japan and taiwan, china, march–may 2018. west pac surveill response. 2018 aug 22;9(3):25–31. doi:10.5365/wpsar.2018.9.2.005 pmid:30377547 transmission of measles. atlanta, ga: centers for disease control and prevention; 2018. available from: https://www.cdc.gov/measles/about/transmission.html mizumoto k, kobayashi t, chowell g. transmission potential of modified measles during an outbreak, japan, march–may 2018. euro surveill. 2018;23(24):1800239. doi:10.2807/1560-7917.es.2018.23.24.1800239 world health organization. measles vaccines: who position paper – april 2017. wkly epidemiol rec. 2017;17(92):205–28. available from: http://origin.who.int/immunization/policy/position_papers/measles/en/ mossong j, muller cp. modelling measles re-emergence as a result of waning of immunity in vaccinated populations. vaccine. 2003 nov 7;21(31):4597–603. doi:10.1016/s0264-410x(03)00449-3 pmid:14575773 bitzegeio j, majowicz s, matysiak-klose d, sagebiel d, werber d. estimating age-specific vaccine effectiveness using data from a large measles outbreak in berlin, germany, 2014/15: evidence for waning immunity. euro surveill. 2019 apr;24(17): doi:10.2807/1560-7917.es.2019.24.17.1800529 pmid:31039834 chen cj, lee pi, hsieh yc, chen py, ho yh, chang cj, et al. waning population immunity to measles in taiwan. vaccine. 2012 oct 19;30(47):6721–7. doi:10.1016/j.vaccine.2012.05.019 pmid:22634294 https://ojs.wpro.who.int/ 1wpsar vol 12, no 1, 2021 | doi: 10.5365/wpsar.2020.11.3.007 original research c oronavirus disease 2019 (covid-19) is an infectious disease caused by severe acute respiratory syndrome coronavirus 2 (sars-cov-2). the infection was first detected in wuhan, china, and has since spread across mainland china1 and all over the world. covid-19 is the third coronavirus infection that has spread widely, after sars and middle east respiratory syndrome (mers).2 on 11 march 2020, who declared covid-19 a pandemic.3 as of 14 april 2020, covid-19 had led to 1 848 439 diagnosed cases and 117 217 deaths worldwide.4 up to 14 april 2020, malaysia has had a total of 4987 infected people and 82 deaths.5 with the increasing numbers of confirmed cases and fatalities due to covid-19, underlying comorbidities such as cardiovascular diseases and immune deficiency, especially among elderly patients, have been shown to be predictors of severe disease outcomes and poor prognoses in covid-19 patients.6–8 severe cases of a institute for public health, national institutes of health, ministry of health malaysia, setia alam, selangor, malaysia. b selangor state health department, ministry of health malaysia, shah alam, selangor, malaysia. c disease control division, ministry of health malaysia, wp putrajaya, malaysia. d institute for medical research, national institutes of health, ministry of health malaysia, setia alam, selangor, malaysia. published: 16 february 2021 doi: 10.5365/wpsar.2020.11.3.007 comorbidities and clinical features related to severe outcomes among covid-19 cases in selangor, malaysia wan shakira rodzlan hasani,a shubash shander ganapathy,a chong zhuo lin,a halizah mat rifin,a mohammad nazarudin bahari,b muhammad haikal ghazali,b noor aliza lodz,a muhd hafizuddin taufik ramli,a nur liana ab majid,a miaw yn jane ling,a muhammad fadhli mohd yusoff,a noor ani ahmad,a anita suleiman,c ahmad faudzi yusoff,d venugopalan balanb and sha’ari ngadimanb correspondence to wan shakira rodzlan hasani (email: shaki_iera@yahoo.com or wshakira@moh.gov.my) background: pre-existing comorbidities can predict severe disease requiring intensive care unit (icu) admission among covid-19 cases. we compared comorbidities, clinical features and other predictive factors between covid-19 patients requiring icu admission for intubation/mechanical ventilation and all other covid-19 cases in selangor, malaysia. method: field data collected during the covid-19 outbreak in selangor, malaysia, up to 13 april 2020 were used, comprising socio-demographic characteristics, comorbidities and presenting symptoms of covid-19 cases. icu admission was determined from medical records. multiple logistic regression analysis was performed to identify factors associated with icu admission requiring intubation/mechanical ventilation among covid-19 cases. results: a total of 1287 covid-19-positive cases were included for analysis. the most common comorbidities were hypertension (15.5%) and diabetes (11.0%). more than one third of cases presented with fever (43.8%) or cough (37.1%). of the 25 cases that required intubation/mechanical ventilation, 68.0% had hypertension, 88.0% had fever, 40.0% had dyspnoea and 44.0% were lethargic. multivariate regression showed that cases that required intubation/ mechanical ventilation had significantly higher odds of being older (aged ≥60 years) [adjusted odds ratio (aor) = 3.9] and having hypertension (aor = 5.7), fever (aor = 9.8), dyspnoea (aor = 9.6) or lethargy (aor = 7.9) than cases that did not require intubation/mechanical ventilation. conclusion: the covid-19 cases in selangor, malaysia requiring intubation/mechanical ventilation were significantly older, with a higher proportion of hypertension and symptoms of fever, dyspnoea and lethargy. these risk factors have been reported previously for severe covid-19 cases, and highlight the role that ageing and underlying comorbidities play in severe outcomes to respiratory disease. wpsar vol 12, no 1, 2021 | doi: 10.5365/wpsar.2020.11.3.007 https://ojs.wpro.who.int/2 hasani et alcovid-19 and invasive ventilatory support in malaysia the main symptoms of covid-19, such as fever, cough, dyspnoea, lethargy, arthralgia, myalgia, headache and diarrhoea. variables with p values < 0.25, based on wald χ2 statistics in univariate analysis,13 as well as those variables considered to be biologically plausible, were selected for the multivariate analysis. the final model included sex, age, hypertension, diabetes, heart disease, fever, cough, dyspnoea and lethargy. the univariate test p value cut-off was set at 0.25 because the usual level of 0.05 may fail to identify variables known to be important.14 a backwards selection method was used to select variables. starting with all candidate variables, the least significant effect for the model was removed, and the process was repeated until no further variables could be deleted without a statistically significant loss of fit. after this process, only age, hypertension, fever, dyspnoea and lethargy were significant in the multivariate model. to avoid over-fitting the model, only these five variables were included. possible multicollinearity and all possible two-way interaction terms were checked one by one with main effect. goodness-of-fit statistics were used to assess the fit of the regression model against actual outcomes. two-sided p values < 0.05 were considered statistically significant. statistical package social sciences (spss) statistical software version 24 was used for the analysis. the study was conducted in accordance with the declaration of helsinki and ethical approval was obtained from the national medical research registry, ministry of health malaysia (registration number nmrr-20–720– 54598). the requirement for written informed consent was waived given the context of an emerging infectious disease. results in total, 1287 laboratory-confirmed cases of covid-19 in selangor were included in the analysis. of these, 750 patients (58.3%) were male and most (74.0%) were of malay ethnicity. the median age was 36 years, and the highest percentage of cases were in people aged 18–29 years. the most commonly reported comorbidities were hypertension (15.5%) and diabetes (11.0%). more than one third of cases presented with fever (43.8%) or cough (37.1%); only 5.5% experienced dyspnoea, and 6.1% were lethargic (table 1). covid-19 often require admission to an intensive care unit (icu). in china, about 15% of patients developed severe pneumonia, and about 6% required non-invasive or invasive ventilatory support.9 early identification of the risk factors of severe covid-19 disease requiring intensive care in hospital would be helpful for managing hospital admissions. studies in china and italy suggest that the risk factors for severe covid-19 include underlying comorbidities.10,11 therefore, we compared the comorbidities, clinical features and other predictive factors of covid-19 patients requiring admission to icu for intubation/mechanical ventilation with all other covid-19 cases in selangor, malaysia. methods in this retrospective study, data were collected during a covid-19 outbreak in selangor, malaysia, a state on the west coast of peninsular malaysia. at the time of the study, selangor had recorded the highest number of covid-19 cases in the country, with the first case reported on 4 february 2020. the analysis included all laboratory-confirmed cases in the state up to 13 april 2020. cases were confirmed by reverse transcriptase polymerase chain reaction (rt–pcr) testing.12 descriptive methods were used to analyse sociodemographic characteristics, comorbidities, clinical presentation and the proportion of icu admissions requiring intubation/mechanical ventilation. clinical and sociodemographic characteristics were derived from case investigation reports obtained from district health offices in charge of each patient. the symptoms were self-reported during telephone interviews of cases by district health officers upon notification of a positive covid-19 case. admission to icu for intubation/mechanical ventilation was verified from hospital records. multiple logistic regression analysis was performed to identify factors associated with intubation/mechanical ventilation among covid-19 cases. the outcome variable was icu admission requiring intubation/mechanical ventilation. the predictor variables included a history of hypertension, diabetes, heart disease, chronic respiratory disease (including asthma, chronic obstructive pulmonary disease and emphysema), cancer and kidney disease and wpsar vol 12, no 1, 2021 | doi: 10.5365/wpsar.2020.11.3.007https://ojs.wpro.who.int/ 3 covid-19 and invasive ventilatory support in malaysiahasani et al of the 1156 patients who were hospitalized, 25 (2.2%) were admitted to the icu and required intubation/ mechanical ventilation. of these 25 cases, 14 were aged ≥60 years, 17 had hypertension, 10 had diabetes, 22 presented with fever, 14 with cough, 10 with dyspnoea and 11 with lethargy (table 2). the final multivariate model demonstrated that the odds of covid-19 cases that required intubation/ mechanical ventilation being older (≥60 years) were 4.2 times (aor: 4.24, 95% ci: 1.59–11.34) higher than the odds of all other cases being older, after controlling for sex, comorbidities and presenting symptoms. covid-19 cases that required intubation/mechanical ventilation also had 6.0 times higher odds of having underlying hypertension (aor: 5.97, 95% ci: 2.27–15.72) and presenting with the symptoms of fever (aor: 7.91, 95% ci: 2.18–28.73), dyspnoea (aor: 8.47, 95% ci: 3.08–23.29) or lethargy (aor: 7.57, 95% ci: 2.89–19.86), compared with the odds for these risk factors in all other cases (table 3). when age was used as a continuous variable in the same regression model, every 1-year increase in age increased the odds of requiring intubation/mechanical ventilation by 8% (aor: 1.08, 95% ci: 1.03–1.12). univariable analyses were also conducted for cancer, chronic kidney disease, current smoker, chronic respiratory disease and symptoms at presentation such as diarrhoea, arthralgia, myalgia and headache. the results are not presented in the table because the small sample sizes did not give meaningful ors and cis. discussion in this study, the proportion of covid-19 cases requiring intubation/mechanical ventilation in selangor, malaysia (2.2%) was similar to studies in china (2.3–3.0%)10,15 but lower than that in the united states of america (20.2–22.3%).16,17 these differences may be due to differences in guidelines for intubation and mechanical ventilation as well as icu bed capacity. we also found that underlying hypertension and diabetes were the most common comorbidities in all covid-19 cases, consistent with the findings in wuhan18 and in a meta-analysis of the prevalence of comorbidities in covid-19 patients.19 bornstein et al.20 reported that hypertension and type-ii diabetes were the most common comorbidities in infected covid-19 patients, characteristic covid-19-positive cases sex, n (%) male 750 (58.3) female 537 (41.7) age (years) median (iqr) 36.0 (30.0) mean (sd) 38.8 (18.2) age groups, n (%) <18 116 (9.0) 18–29 366 (28.4) 30–39 239 (18.6) 40–49 151 (11.7) 50–59 214 (16.6) ≥60 201 (15.6) ethnicity, n (%) malay 952 (74.0) chinese 118 (9.2) indian 43 (3.3) other 174 (13.5) nationality, n (%) malaysian 1122 (87.2) non-malaysian 165 (12.8) comorbid conditions, n (%) hypertension 200 (15.5) diabetes 141 (11.0) heart disease or other problem 50 (3.9) chronic respiratory disease 40 (3.1) chronic kidney disease 18 (1.4) cancer 7 (0.5) current smoker 57 (4.4) symptoms, n (%) fever 564 (43.8) cough 477 (37.1) lethargy 78 (6.1) dyspnoea 71 (5.5) headache 71 (5.5) myalgia 53 (4.1) diarrhoea 41 (3.3) arthralgia 31 (2.4) hospital admission (n = 1156), n (%) intubated (invasive ventilator support) 25 (2.2) not intubated 1131 (97.9) table 1. socio-demographic characteristics, comorbidity and clinical presentation of covid-19 positive cases in selangor (n = 1287) wpsar vol 12, no 1, 2021 | doi: 10.5365/wpsar.2020.11.3.007 https://ojs.wpro.who.int/4 hasani et alcovid-19 and invasive ventilatory support in malaysia variables intubated (invasive mechanical ventilation) (n = 25) not intubated (n = 1262) sex, n (%) male 18 (72.9) 732 (58.0) female 7 (28.0) 530 (42.0) age group, n (%) <60 11 (44.0) 1075 (85.2) ≥60 14 (56.0) 187 (14.8) comorbid conditions, n (%) hypertension 17 (68.0) 183 (14.5) diabetes 10 (40.0) 131 (10.4) heart disease 4 (16.0) 46 (3.6) chronic respiratory disease 0 (0.0) 40 (3.2) chronic kidney disease 3 (12.0) 15 (1.2) cancer 0 (0.0) 7 (0.6) current smoker 1 (4.0) 56 (4.4) symptoms, n (%) fever 22 (88.0) 542 (42.9) cough 14 (56.0) 463 (36.7) lethargy 11 (44.0) 67 (5.3) dyspnoea 10 (40.0) 61 (4.8) diarrhoea 3 (12.0) 38 (3.0) arthralgia 1 (4.0) 30 (2.4) myalgia 1 (4.0) 52 (4.1) headache 0 (0.0) 71 (5.6) preliminary findings from the united states of america suggested that people with underlying health conditions are at higher risk for severe disease from covid-19.25 a study in china showed that almost 70% of covid-19 patients who were admitted to an icu had comorbidities.26 our study shows that covid-19 patients with underlying hypertension contributed to a high percentage of icu admissions requiring intubation/ mechanical ventilation. cases that required intubation/ mechanical ventilation also had six times the odds of having underlying hypertension after adjustment for age, other comorbidities and clinical presentation. hypertension was the most common comorbidity that predicted a poor prognosis in patients with covid-19. in a systematic review and meta-analysis by yang et al.,26 the pooled odds of hypertension in patients with severe, as compared with non-severe disease, was 2.36 (95% ci: 1.46–3.83). other than age and underlying hypertension, the presenting symptoms of covid-19 infection also predict a severe outcome. as in other studies, the most common due to metabolic inflammation caused by the infection, which compromises the immune system. diabetes and hypertension were also reported as the most common comorbidities with other coronaviruses, such as sarscov and mers-cov.21 older age and underlying comorbidities are predictors of severe outcomes in viral infections generally,22,23 and we found that the proportion of covid-19 patients who required intubation/mechanical ventilation increased with age. the regression model showed that the odds of requiring intubation/mechanical ventilation was 4.2 times higher for adults aged ≥60 years after controlling for comorbidities and presenting symptoms. as in other studies, the risk for a severe outcome is higher for older people. data from china indicate that older adults with severe underlying health conditions are at higher risk for severe covid-19-associated illness and death.24 reports from italy also suggested that the risk factors for severe disease include older age and the presence of at least one underlying health condition among covid-19 cases.11 table 2. numbers of intubated cases of covid-19 by socio-demographic, ncd comorbidity and clinical presentation wpsar vol 12, no 1, 2021 | doi: 10.5365/wpsar.2020.11.3.007https://ojs.wpro.who.int/ 5 covid-19 and invasive ventilatory support in malaysiahasani et al risk factor simple logistic regression multiple logistic regression b crude or (95% ci) p b adjusted or* (95% ci) p sex male 1 female –0.62 0.54 (0.22–1.30) 0.166 age group (years) < 60 1 1 ≥ 60 1.99 7.32 (3.27–16.36) < 0.001 1.45 4.24 (1.59–11.34) 0.004 hypertension no 1 1 yes 2.53 12.53 (5.33–29.46) < 0.001 1.79 5.97 (2.27–15.72) < 0.001 diabetes no 1 1 yes 1.75 5.76 (2.53–13.07) < 0.001 heart disease no 1 1 yes 1.62 5.04 (1.66–15.26) 0.004 fever at presentation no 1 1 yes 2.28 9.74 (2.90–32.72) < 0.001 2.07 7.91 (2.18–28.73) 0.002 cough at presentation no 1 1 yes 0.787 2.20 (0.99–4.88) 0.053 dyspnoea at presentation no 1 1 yes 2.58 13.13 (5.66–30.42) < 0.001 2.14 8.47 (3.08–23.29) < 0.001 lethargy at presentation no 1 1 yes 2.64 14.01 (6.13–32.05) < 0.001 2.03 7.57 (2.89–19.86) < 0.001 * backwards multiple logistic regression was applied. multicollinearity and interactions were checked and not found. hosmer lameshow test p = 0.808, classification table (overall correctly classified percentage = 98.0%) and area under roc curve = 94.3% were used to check model fitness. univariable analyses were also conducted for cancer, chronic kidney disease, current smoker, chronic respiratory disease and symptoms at presentation such as diarrhoea, arthralgia, myalgia and headache. the results are not presented in the table because small cell sizes did not give meaningful ors and cis. presenting symptoms in this study were fever, cough, dyspnoea and lethargy.10,15,18,28,29 our findings indicate that symptomatic covid-19 patients with fever, dyspnoea and lethargy have a strong, significant risk for intubation/ mechanical ventilation. li et al.30 demonstrated significant differences in clinical symptoms and computed tomography scan manifestation between patients with or without severe or critical covid-19 after control for age and comorbidities. this finding is important for clinicians in stratifying risk for their patients according to presenting symptoms. although dyspnoea is a known risk factor for intubation/mechanical ventilation, patients presenting with fever or lethargy should also be closely monitored. our study has some notable limitations. first, the number of cases requiring intubation/mechanical ventilation was small at 25 cases (2.2%). furthermore, the data were derived from a report from a single state in malaysia and may not represent the national population. data on icu admissions, comorbidities and outcomes were missing for <20% of patients. despite these limitations, our results are consistent with previous studies of covid-19 cases. conclusion covid-19 cases that were intubated and ventilated had higher odds of being aged ≥60 years, having hypertension and presenting with fever, dyspnoea or lethargy compared with all other covid-19 cases. older people and those with comorbidities such as hypertension should be prioritised for hospital care as they are more vulnerable to severe disease and progression when infected with sars-cov-2. table 3. factors associated with intubation among positive covid-19 cases in a binary logistic regression model (n = 1287) wpsar vol 12, no 1, 2021 | doi: 10.5365/wpsar.2020.11.3.007 https://ojs.wpro.who.int/6 hasani et alcovid-19 and invasive ventilatory support in malaysia 10. guan wj, ni zy, hu y, liang wh, ou cq, he jx, et al. clinical characteristics of coronavirus disease 2019 in china. n engl j med. 2020;382(18):1708–20. 11. covid-19 surveillance group. characteristics of covid-19 patients dying in italy: report based on available data on march 20th, 2020. rome: instituto superiore di sanita; 2020. 12. laboratory testing for coronavirus disease (covid-19) in suspected human cases: interim guidance, 19 march 2020. geneva: world health organization; 2020 (https://apps.who.int/ iris/handle/10665/331501). 13. hosmer dw jr, lemeshow s, sturdivant rx. applied logistic regression. john wiley & sons; 2013. doi:10.1002/9781118548387 14 mickey rm, greenland s. the impact of confounder selection criteria on effect estimation. am j epidemiol. 1989;129(1):125– 37. 15. yang w, cao q, qin l, wang x, cheng z, pan a, et al. clinical characteristics and imaging manifestations of the 2019 novel coronavirus disease (covid-19): a multi-center study in wenzhou city, zhejiang, china. j infect. 2020;80(4):388–93. 16. richardson s, hirsch js, narasimhan m, crawford jm, mcginn t, davidson kw, et al. presenting characteristics, comorbidities, and outcomes among 5700 patients hospitalized with covid-19 in the new york city area. jama. 2020;323(20):2052–9. 17. petrilli cm, jones sa, yang j, rajagopalan h, o’donnell lf, chernyak y, et al. factors associated with hospitalization and critical illness among 4,103 patients with covid-19 disease in new york city. medrxiv. 2020. available from: https://www. medrxiv.org/content/10.1101/2020.04.08.20057794v1. 18. huang c, wang y, li x, ren l, zhao j, hu y, et al. clinical features of patients infected with 2019 novel coronavirus in wuhan, china. lancet. 2020;395(10223):497–506. 19. baradaran a, ebrahimzadeh mh, baradaran a, kachooei ar. prevalence of comorbidities in covid-19 patients: a systematic review and meta-analysis. arch bone jt surg. 2020;8(suppl 1):247–55. 20. bornstein sr, dalan r, hopkins d, mingrone g, boehm bo. endocrine and metabolic link to coronavirus infection. nat rev endocrinol. 2020;16(6):297–8. 21. yang jk, feng y, yuan my, yuan sy, fu hj, wu by, et al. plasma glucose levels and diabetes are independent predictors for mortality and morbidity in patients with sars. diabet med. 2006;23(6):623–8. 22. mcmichael tm, currie dw, clark s, pogosjans s, kay m, schwartz ng, et al. epidemiology of covid-19 in a long-term care facility in king county, washington. n engl j med. 2020;382(21):2005– 11. 23. koff wc, williams ma. covid-19 and immunity in aging populations – a new research agenda. n engl j med. 2020;383(9):804– 5. 24. epidemiology working group for ncip epidemic response, chinese centre for disease control and prevention. the epidemiological characteristics of an outbreak of 2019 novel coronavirus diseases (covid-19) in china. zhonghua liu xing bing xue za zhi. 2020;41(2):145–51. acknowledgements we thank the director-general of health malaysia for his permission to publish this article. we also thank the selangor state health office and all the district health offices in selangor for their cooperation and support for this study. conflict of interest none declared. funding ministry of health malaysia references 1. li q, guan x, wu p, wang x, zhou l, tong y, et al. early transmission dynamics in wuhan, china, of novel coronavirus–infected pneumonia. n engl j med. 2020;382(13):1199–207. 2. morens dm, taubenberger jk. influenza cataclysm, 1918. n engl j med. 2018;379(24):2285–7. 3. who announces covid-19 outbreak a pandemic – who director-general’s opening remarks at the media briefing on covid-19 – 11 march 2020. geneva: wold health organization; 2020. available from: https://www.who.int/director-general/ speeches/detail/who-director-general-s-opening-remarks-at-themedia-briefing-on-covid-19--11-march-2020, accessed 14 april 2020. 4. coronavirus disease (covid-19) pandemic: coronavirus disease (covid-19) outbreak situation. geneva: world health organization; 2020. available from: https://www.who.int/emergencies/diseases/novel-coronavirus-2019, accessed 14 april 2020. 5. latest covid-19 statistic in malaysia by moh as at 5:00 pm, april 14th. kuala lumpur: ministry of health malaysia; 2020. available from: https://www.moh.gov.my/index.php/pages/ view/2019-ncov-wuhan, accessed 14 april 2020. 6. li b, yang j, zhao f, zhi l, wang x, liu l, et al. prevalence and impact of cardiovascular metabolic diseases on covid-19 in china. clin res cardiol. 2020;109(5):531–8. 7. ruan q, yang k, wang w, jiang l, song j. clinical predictors of mortality due to covid-19 based on an analysis of data of 150 patients from wuhan, china. intensive care med. 2020;46(5):1– 3. 8. zhou f, yu t, du r, fan g, liu y, liu z, et al. clinical course and risk factors for mortality of adult inpatients with covid-19 in wuhan, china: a retrospective cohort study. lancet. 2020;395(10229):1054–62. 9. xie j, tong z, guan x, du b, qiu h, slutsky as. critical care crisis and some recommendations during the covid-19 epidemic in china. intensive care med. 2020;46(5):837–40. wpsar vol 12, no 1, 2021 | doi: 10.5365/wpsar.2020.11.3.007https://ojs.wpro.who.int/ 7 covid-19 and invasive ventilatory support in malaysiahasani et al 28. chen j, qi t, liu l, ling y, qian z, li t, et al. clinical progression of patients with covid-19 in shanghai, china. j infect. 2020;80(5):e1–6. 29. huang r, zhu l, xue l, liu l, yan x, wang j, et al. clinical findings of patients with coronavirus disease 2019 in jiangsu province, china: a retrospective, multi-center study. plos negl trop dis. 2020;14(5):e0008280. 30. li k, wu j, wu f, guo d, chen l, fang z, et al. the clinical and chest ct features associated with severe and critical covid-19 pneumonia. invest radiol. 2020;55(6):327–31. 25. chow n, fleming-dutra k, gierke r, hall a, hughes m, et al. preliminary estimates of the prevalence of selected underlying health conditions among patients with coronavirus disease 2019 – united states, february 12–march 28, 2020. morbid mortal wkly rep. 2020;69(13):382. 26. wang d, hu b, hu c, zhu f, liu x, zhang j, et al. clinical characteristics of 138 hospitalized patients with 2019 novel coronavirus–infected pneumonia in wuhan, china. jama. 2020;323(11):1061–9. 27. yang j, zheng y, gou x, pu k, chen z, guo q, et al. prevalence of comorbidities in the novel wuhan coronavirus (covid-19) infection: a systematic review and meta-analysis. int j infect dis. 2020;94:91–5. dengue in fiji: epidemiology of the 2014 denv-3 outbreak original research aneley getahun s,a anaseini batikawai,a devina nand,b sabiha khan,a aalisha sahukhanb and daniel faktaufonb a school of public health and primary care, college of medicine, nursing and health sciences, fiji national university, suva, fiji. b fiji ministry of health and medical services, suva, fiji. correspondence to aneley getahun s (email: aneley.getahun@fnu.ac.fj). to cite this article: getahun a, batikawai a, nand d, khan s, sahukhan a, faktaufon d. dengue in fiji: epidemiology of the 2014 denv-3 outbreak. western pac surveill response j. 2019 may;10(2). doi:10.5365/wpsar.2018.9.3.001 abstract introduction: dengue virus serotype-3 caused a large community-level outbreak in fiji in 2013 and 2014. we aimed to characterize the demographic features of affected individuals and to determine dengue mortality during the outbreak. methods: all laboratory-confirmed dengue cases and deaths were included in this study. incidence and mortality were calculated according to demographic variables. results: a total of 5221 laboratory-confirmed cases of dengue were included in this analysis. the majority of patients were male (54.5%) and indigenous fijians (itaukei) (53.5%). the median age was 25 years old. the overall incidence was 603 per 100 000 population. the age-specific incidence was highest among people between 20 and 24 years of age (1057 per 100 000) for both sexes. the major urban and peri-urban areas of suva and rewa subdivisions reported the highest incidence of >1000 cases per 100 000 population. a total of 48 deaths were included in this analysis. the majority of dengue-related deaths occurred in males (62.5%) and in the itaukei (60.4%) population. the median age at death was 35 years old. the overall dengue-related deaths was estimated to be 5.5 deaths per 100 000 population. dengue mortality was higher for males (6.8 per 100 000) than females. the highest ageand sex-specific mortality of 18 per 100 000 population was among males aged 65 years and older. discussion: dengue morbidity and mortality were highest among males, indigenous people and residents of urban and peri-urban locations. effective and integrated public health strategies are needed to ensure early detection and appropriate outbreak control measures. introduction dengue is one of the most common vector-borne diseases of public health importance globally. the disease is endemic in more than 100 countries,1 and it is estimated that 390 million dengue infections occur annually.2 dengue has emerged as a significant public health problem in pacific island countries, including fiji, causing large outbreaks in recent years.3–5 dengue is endemic in fiji, and its epidemiology has showed dynamic changes over the last four decades.6–8 dengue distribution is characterized by low endemic levels of transmission, usually dominated by a single serotype with cyclical patterns of outbreaks following introduction of a new serotype.4,7 in non-outbreak years, the estimated incidence in fiji ranged from 0.34 to 51.15 per 100 000 population.9 historical reports documented two nationwide outbreaks in 1971 and 1975,10,11 after which there was no major outbreak for over a decade. since 1988, outbreaks have occurred with increasing frequency, with six major outbreaks reported between 1998 and 2017.6,7,9,12,13 major outbreaks have occurred in a cyclical pattern of approximately every four to five years. in 2013, dengue serotype-3 virus (denv-3) re-emerged in the south pacific after 18 years, causing concurrent outbreaks in several pacific island countries.3–5 before then, denv-3 had last circulated in fiji in 1989 and 1990, causing a large community-level outbreak. at the end of 2013, dengue cases began to increase in fiji, and an outbreak was declared that continued into 2014. during this outbreak, over 15 000 cases (1733 per 100 000) were reported nationwide with a record number of deaths.9 we investigated demographic patterns of incidence and mortality during the 2014 outbreak period that could provide important information for the prediction and control of future outbreaks. we aimed to characterize dengue cases and to determine the magnitude of mortality in 2014. methods dengue surveillance in fiji includes notification of laboratory-confirmed and clinically suspected cases. confirmatory testing is primarily performed at the national public health laboratory. the laboratory tests used in fiji at the time of the outbreak were enzyme-linked immunosorbent assay and non-structural protein antigen. all confirmed cases are reported to the fiji centre for communicable disease control (fccdc). laboratory surveillance data include demography (patient’s name, hospital number, age, sex, ethnicity, address, health facility), date of reporting, and test results. information not routinely collected for surveillance purposes are date of onset, signs and symptoms, dengue type (dengue fever or dengue haemorrhagic fever), patient outcome (mortality) and socioeconomic data such as education level, occupation, and income. no established surveillance system for determining circulating serotypes exists; however, during outbreaks, representative blood samples are sent to overseas laboratories to identify the specific dengue virus causing the outbreak. health-care services in fiji are provided by the ministry of health and medical services (mohms) which is divided into four divisions: central, northern, western and eastern. each division is further divided into several subdivisions that have secondary-level (subdivisional) hospitals that receive referrals from community-level facilities.9 all health-care providers report suspected cases of dengue through the national notifiable disease surveillance schedule (nndss). the nndss staff monitors a comprehensive list of 46 diseases that medical officers are required to report weekly. the nndss only contains data on the number, age and sex of patients. all line lists of laboratory-confirmed cases are also submitted to the nndss during outbreaks. dengue deaths are reported using the standardized medical cause of death certificates (mcdc) that are completed by medical officers. dengue must be explicitly stated on the mcdc to be coded as a dengue death. all deaths are registered into the patient information system (patis plus) electronic database using mcdc data and further coded according to the international classification of diseases, tenth revision (icd 10) through an automated system called iris (version 4.0).14 for our epidemiological review, all laboratory-confirmed dengue cases reported to fccdc in 2014 were included. duplicate entries of patients who were cases more than once within an incubation period were removed. deaths attributed to dengue were obtained from patis plus. three additional laboratory-confirmed dengue deaths in 2014 identified in another study15 were added in the mortality analysis, even though they were not in the official record. data analysis was performed using microsoft office excel 2010 and spss software version 24. descriptive statistics were used for the demographic profile (sex, ethnicity and age) of laboratory-confirmed dengue cases and dengue-related deaths. all descriptive analysis results were calculated as proportions and medians with interquartile ranges. overall and specific incidence and mortality, stratified by demographic variables, were computed using population projections provided by the fiji bureau of statistics (fbos) for 2014 (fbos 2014, projected population, unpublished). since fbos data are not disaggregated for medical divisions, incidence and mortality by medical divisions and subdivisions were calculated using the 2014 population estimates from the mohms.9 incidence and mortality are expressed per 100 000 population. the geographic distribution of dengue patients was evaluated using the location of the treating health facilities since patients’ home addresses were not systematically recorded. ethical approval was given by the college health and research ethics committee, college of medicine, nursing and health science, fiji national university and the national health research and ethics review committee (2016.110.n.w.). results a total of 5249 laboratory-confirmed cases of dengue were reported in 2014 (fccdc, unpublished). after excluding 28 duplicates, 5221 cases were included in this analysis. most of the cases were male (54.5%), were itaukei (indigenous fijians) (53.5%) and were residents of the central division (65.5%) (table 1). the median age (interquartile range [iqr]) was 25 years (16–35). the majority of cases (80%) were reported during the first quarter with the highest number of cases occurring during epidemiologic week 7 from 23 february to 1 march 2014 (614 cases). table 1. demographic characteristics of laboratory-confirmed and dengue mortality cases click to download table 1. jpg, 288kb the overall incidence of laboratory-confirmed dengue was 603 cases per 100 000 population. the incidence was higher in males (674 per 100 000) compared with females (577 per 100 000). age-specific incidence progressively rose after the age of 10 years and reached its highest among people between 20 and 24 years of age (1057 per 100 000) for both sexes, and it steadily declined in the age group 50 years and above (fig. 1). further analysis of the incidence by geographical location showed the highest burden in the central division (912 per 100 000) followed by the northern and western divisions (542.8 per 100 000 and 278.6 per 100 000, respectively). the major urban and peri-urban subdivisions, within the central division (suva and rewa), reported the highest incidence of >1000 per 100 000 population (fig. 2). fig. 1. ageand sex-specific incidence of laboratory-confirmed dengue in fiji in 2014 click to download figure 1. jpg, 264kb fig. 2. dengue incidence by medical subdivision in fiji in 2014 click to download figure 2. jpg, 347kb a total of 45 deaths attributed to dengue were reported to mohms (patis plus, unpublished). three additional dengue-related deaths were found during another study.15 a total of 48 deaths were included in this analysis. the majority of reported deaths occurred in males (62.5%), itaukei (60.4%) and residents of the central division (40.7%). the median iqr age at death was 35 years (18–57), and five (10%) deaths were among children under the age of 5 years. overall mortality was estimated to be 5.5 deaths per 100 000 population. dengue mortality was higher for males (6.8 per 100 000) compared to females (4.2 per 100 000). mortality increased steadily with age: the highest mortality was among men aged more than 65 years (18 per 100 000) (fig. 3). the lowest recorded mortality was for boys aged between 5 and 14 years. those under 5 years of age had higher mortality (5.6 per 100 000) compared to children between 5 and 14 years of age (2.4 per 100 000). the northern division had the highest dengue mortality (6.9 per 100 000) followed by the central (5.3 per 100 000) and western divisions (4.6 per 100 000). two subdivisions in the north (bua and macuata) reported the highest mortality (12 per 100 000). among notified deaths (n = 45), the underlying cause of death was reported as dengue fever in most (62.2%). the remaining 37.8% were reported as dengue haemorrhagic fever. fig. 3. dengue mortality in 2014 outbreak in fiji, by age group and sex click to download figure 3. jpg, 252kb discussion dengue has emerged as a significant public health problem in fiji and the south pacific, causing large outbreaks in recent years.3,16 a better understanding of the epidemiology of dengue is essential to appropriately allocate limited resources for dengue control and to better evaluate the impact of control activities. we conducted a retrospective review of dengue cases in fiji during the 2014 denv-3 outbreak to characterize the demographic features and to determine the magnitude of dengue-related mortality. in this study, the median age of infection was 25 years, and age-specific incidence was highest among people between the ages of 15 and 34 years. the predominance among those in these age strata may be explained by their vulnerability to denv-3, which last circulated in the country 24 years prior. our findings are consistent with reports from previous outbreaks in fiji that showed higher morbidity among adolescents and young adults,6,8,10,11 which differs from patterns seen in hyperendemic countries in asia where dengue is mainly reported among young children.17 however, a shift in age groups has been demonstrated in some countries such as singapore, malaysia and thailand, when dengue outbreaks occurred after the introduction of a new serotype mainly affecting the adult population.18–20 males had a higher disease burden than females, as demonstrated by the increased absolute number and incidence among the male population. previous outbreak and non-outbreak reports also demonstrated male preponderance in fiji6,8,11 and other countries.20,21 we did not investigate the reason for the observed difference in incidence by sex, but possible reasons include increased risk of infection among men due to occupational exposure. we report high dengue incidence in the main urban and peri-urban areas of fiji. in the central division, suva (the capital city) and nausori, the adjacent peri-urban hub, reported the highest incidence with over 1000 cases per 100 000 population. previous studies in fiji reported a higher number of dengue cases and mosquito vectors in urban and peri-urban areas.8,22,23 increased reporting from urban areas could be due to greater availability of health services and access to testing. urban and peri-urban areas in fiji are characterized by expansive informal settlements with high population density and limited sanitation and public services.22,24 the suva–nausori corridor in the central division has the largest concentration of informal settlements where access to clean water and sanitation may be an issue.25 globally, urban and peri-urban centres are identified as high-risk areas for dengue.2 increased risk of spread in these areas is attributed to population movement, travel,2,23,26 overcrowding, increased vector breeding sites,26 poor sanitation facilities and hygiene22 and limited access to health care.19 dengue-prevention strategies in fiji should consider the social determinants of health and include broader socioeconomic influences of better urban planning and improved sanitation to reduce the overall transmission risk factors. during the 2014 outbreak, the majority of cases were reported in the first three months of the year. previous outbreaks and surveillance reports showed similar seasonal patterns of dengue from november to april, coinciding with the warm and wet season.11,23 this time period also overlaps with the cyclone season, when localized dengue outbreaks have been reported following heavy rain and flooding.27 a previous study demonstrated a significant correlation between the incidence of dengue with high temperatures and increased rainfall in three study sites in fiji.23 mortality in the 2014 denv-3 outbreak was higher than that of previously reported outbreaks in fiji. the 1997–1998 denv-2 outbreak7 reported 13 deaths with an estimated mortality of 1.7 deaths per 100 000 population (based on the 1996 census). a review of the 1989–1990 denv-1 outbreak6 reported an estimated mortality of 2.1 deaths per 100 000 population (for the estimated population size in 1990). our findings show higher mortality compared to other endemic and hyperendemic countries in south-east asia and south america where dengue mortality during outbreak and non-outbreak years ranges from 0.1 to 0.5 per 100 000 population.28,29 literature suggests dengue deaths have increased over the last few decades in some countries and regions.28–30 increased mortality has also been attributed to greater health-seeking behaviour and increased sensitivity of surveillance for detecting dengue deaths.28 the higher mortality among males has been reported previously31 and is thought to be due largely to differences in health-seeking behaviour.30 in this study, mortality progressively increased after the age of 55 years, particularly for males. the high mortality among elderly patients has been attributed to decreased immunity, compromised organ function, underlying co-morbidities and prolonged hospitalizations, which increase the risk of hospital-acquired infection or secondary infection.32,33 this trend is likely to continue as the population ages and the burden of noncommunicable diseases grows. we found higher mortality in the northern division despite the relatively lower incidence. the division is served by one divisional hospital (labasa hospital) and three subdivisional hospitals located in the main urban and peri-urban areas. while no studies have evaluated access to health services and quality of care in the division, it has the highest poverty rate in the country and poor health indicators.25 health-seeking behaviours of the northern division population are likely limited by socioeconomic, geographic and infrastructure barriers, especially for rural communities. labasa hospital has few specialist doctors and a smaller intensive care unit compared to other divisional hospitals, which could impact the quality of care for critically ill patients, resulting in higher mortality. we cannot substantiate the quality of care and access to health services from the surveillance data. further studies are warranted to determine the possible reasons of the increased mortality and to address health system-related issues. in addition, the ethnic distribution of dengue mortality requires further investigation. reports from a previous outbreak showed increased frequency of haemorrhagic manifestations in the itaukei people; however, a larger proportion of deaths occurred in fijians of indian descent.6 in contrast, in this outbreak, a large proportion of deaths occurred among the itaukei people. a global review suggests that ethnic disparities in dengue severity remain unexplained.30 one study shows that these differences may be largely due to socioeconomic factors that can be addressed by public health interventions.30 a review of the global literature on dengue mortality has highlighted underreporting and the difficulties associated with attributing dengue as a cause of death as factors challenging the understanding of mortality trends. in addition, heterogeneity in reporting of mortality and its predictors limits comparisons between studies.30 limitations this study has several limitations. we limited our analysis to 2014 data to ensure a systematic line listing of cases. it is expected that given the broad clinical spectrum of dengue, many cases would not have been reported, particularly early in the outbreak (end of 2013). between march and june 2014, only clinically suspected dengue patients were tested due to a shortage of dengue laboratory testing kits. therefore, the numbers used in this study are likely to significantly underestimate the actual number of dengue cases and deaths that occurred in fiji during this outbreak. in addition, incomplete case information (such as patient residential address, date of onset) further limits epidemiological analysis. although residential address information was not available, geographical location of the treating health facility was considered appropriate as patients generally use the health facility closest to their residents. health-care providers should systematically differentiate and specify the cause of dengue-related deaths, such as dengue shock and dengue haemorrhagic fever, for appropriate coding of underlying causes of death. conclusions and recommendations vector-borne diseases remain a significant public health challenge in pacific island countries and are expected to remain so due to a combination of environmental, climatic and socioeconomic factors. these factors increase the risk of transmission of dengue and emerging arboviral diseases such as chikungunya and zika.3 the high incidence and mortality described in this study indicate a need for continued surveillance of dengue in fiji with regular assessments of its epidemiology to inform broad prevention strategies. we suggest that there is a need to integrate disease and vector surveillances to identify outbreaks earlier in high-risk areas. in addition, vector surveillance needs to be improved to provide real-time data on vector density in high-risk areas and to identify circulating serotypes before seasonal outbreaks occur. this will allow for early interventions to reduce breeding sites in targeted areas and inform risk communication strategies. early detection and prompt case management are crucial to reduce dengue mortality. we reported high mortality among males, indigenous people and residents of urban and peri-urban areas. this information needs to be incorporated into assessing high-risk patients and interventions for prevention. further studies are required to identify specific risk factors for mortality among dengue patients in fiji. the 2014 denv-3 outbreak in fiji demonstrated the increasing risk of a large-scale community outbreak with increased mortality following introduction of a new dengue serotype. effective and integrated public health strategies are needed to ensure early detection and implement outbreak control measures. funding statement this study was performed with funding provided by the joint who western pacific region/tropical diseases research small grants scheme for implementation research (reference 2016/664422-0). conflicts of interest none. references dengue and severe dengue. geneva: world health organization; 2017 (https://www.who.int/mediacentre/factsheets/fs117/en/, accessed 5 january 2018). bhatt s, gething pw, brady oj, messina jp, farlow aw, moyes cl, et al. the global distribution and burden of dengue. nature. 2013 apr 25;496(7446):504–7. doi:10.1038/nature12060 pmid:23563266 roth a, mercier a, lepers c, hoy d, duituturaga s, benyon e, et al. concurrent outbreaks of dengue, chikungunya and zika virus infections an unprecedented epidemic wave of mosquito-borne viruses in the pacific 2012-2014. euro surveill. 2014 oct 16;19(41):20929. doi:10.2807/1560-7917.es2014.19.41.20929 pmid:25345518 cao-lormeau vm, roche c, musso d, mallet hp, dalipanda t, dofai a, et al. dengue virus type 3, south pacific islands, 2013. emerg infect dis. 2014 jun;20(6):1034–6. doi:10.3201/eid2006.131413 pmid:24856252 nogareda f, joshua c, sio a, shortus m, dalipanda t, durski k, et al. ongoing outbreak of dengue serotype-3 in solomon islands, january to may 2013. west pac surveill response. 2013 jul 30;4(3):28–33. doi:10.5365/wpsar.2013.4.2.013 pmid:24319611 fagbami ah, mataika ju, shrestha m, gubler dj. dengue type 1 epidemic with haemorrhagic manifestations in fiji, 1989-90. bull world health organ. 1995;73(3):291–7. pmid:7614660 prakash g, raju ak, koroivueta j. df/dhf and its control in fiji. dengue bull. 2001;21:21–7 (https://apps.who.int/iris/bitstream/handle/10665/163682/dbv25p21.pdf). erenavula jij, ledua ks, naicker p, tukana vl, kishore k. dengue fever in fiji: incidence from 2003–2009. fiji journal of public health. 2012;1(1):37–9 (https://www.health.gov.fj/ejournal/index.php/2016/02/18/dengue-fever-in-fiji-incidence-from-2003-2009/). ministry of health & medical services annual report 2014: suva: fiji ministry of health and medical services; 2014 (https://www.health.gov.fj/pdfs/annual%20report/annual%20report%202014.pdf, accessed 19 february 2016). maguire t, miles jar, macnamara fn, wilkinson pj, austin fj, mataika ju. mosquito-borne infections in fiji. v. the 1971-73 dengue epidemic. j hyg (lond). 1974 oct;73(2):263–70. doi:10.1017/s0022172400024116 pmid:4529580 reed d, maguire t, mataika j. type 1 dengue with hemorrhagic disease in fiji: epidemiologic findings. am j trop med hyg. 1977 jul;26(4):784–91. doi:10.4269/ajtmh.1977.26.784 pmid:889018 dengue fever situation in the pacific island countries and territories, 30 september 2008. noumea: secretariat of the pacific community; 2008 (http://www.pphsn.net/english/publications/informaction/ia29/selected_articles_per_disease-2.htm#dengue, accessed 19 december 2017). pacific syndromic surveillance report, week 33, ending 20 august 2017. manila: who regional office for the western pacific; 2017 (http://www.wpro.who.int/southpacific/programmes/communicable_diseases/disease_surveillance_response/pss-20-august-2017/en/). international statistical classification of diseases and related health problems, 10th revision (icd-10). geneva: world health organization; 2010 (https://apps.who.int/classifications/icd10/browse/2016/en, accessed 3 march 2016). getahun a, batikawai a, khan s, nand d, naidu r, ram r, et al. factors associated with dengue fatality in fiji: a hospital-based case control study. pacific health dialog. 2019;21(3):139–147. doi:10.26635/phd.2019.603 dengue: guidelines for diagnosis, treatment, prevention and control. geneva: world health organization; 2009 (https://www.who.int/tdr/publications/documents/dengue-diagnosis.pdf, accessed 3 february 2016). bravo l, roque vg, brett j, dizon r, l’azou m. epidemiology of dengue disease in the philippines (2000-2011): a systematic literature review. plos negl trop dis. 2014 nov 6;8(11):e3027. doi:10.1371/journal.pntd.0003027 pmid:25375119 limkittikul k, brett j, l’azou m. epidemiological trends of dengue disease in thailand (2000-2011): a systematic literature review. plos negl trop dis. 2014 nov 6;8(11):e3241. doi:10.1371/journal.pntd.0003241 pmid:25375766 mohd-zaki ah, brett j, ismail e, l’azou m. epidemiology of dengue disease in malaysia (2000-2012): a systematic literature review. plos negl trop dis. 2014 nov 6;8(11):e3159. doi:10.1371/journal.pntd.0003159 pmid:25375211 ler ts, ang lw, yap gs, ng lc, tai jc, james l, et al. epidemiological characteristics of the 2005 and 2007 dengue epidemics in singapore similarities and distinctions. west pac surveill response. 2011 may 20;2(2):24–9. doi:10.5365/wpsar.2010.1.1.011 pmid:23908885 liew sm, khoo em, ho bk, lee yk, omar m, ayadurai v, et al. dengue in malaysia: factors associated with dengue mortality from a national registry. plos one. 2016 jun 23;11(6):e0157631. doi:10.1371/journal.pone.0157631 pmid:27336440 raju ak. community mobilization in aedes aegypti control programme by source reduction in peri-urban district of lautoka, viti levu, fiji islands. new delhi: who regional office for south-east asia; 2003 (https://www.who.int/iris/handle/10665/163791). oli k, mcnamara k.e. dengue and climate change: exploring the relationships and risks in fiji. fiji journal of public health. 2015;4(1):1–7 (https://www.health.gov.fj/pdfs/fiji%20journal%20of%20public%20health%20vol4issue1.pdf). greenwell j, mccool j, kool j, salusalu m. typhoid fever: hurdles to adequate hand washing for disease prevention among the population of a peri-urban informal settlement in fiji. west pac surveill response. 2013 jan 10;4(1):41–5. doi:10.5365/wpsar.2012.3.4.006 pmid:23908955 children in fiji: an atlas of social indicators. suva: unicef in the pacific; 2011 (https://www.unicef.org/pacificislands/fiji_equity_atlas_web_version.pdf, accessed 23 february 2018). singh n, kiedrzynski t, lepers c, benyon ek. dengue in the pacific–an update of the current situation. pac health dialog. 2005 sep;12(2):111–9. pmid:18181502 ministry of health annual report 2012. suva: fiji ministry of health and medical services; 2012 (https://www.health.gov.fj/pdfs/annual%20report/annual%20report%202012.pdf, accessed 15 july 2017). wartel ta, prayitno a, hadinegoro sr, capeding mr, thisyakorn u, tran nh, et al. three decades of dengue surveillance in five highly endemic south east asian countries. asia pac j public health. 2017 jan;29(1):7–16. doi:10.1177/1010539516675701 pmid:28198645 paixão es, costa mc, rodrigues lc, rasella d, cardim ll, brasileiro ac, et al. trends and factors associated with dengue mortality and fatality in brazil. rev soc bras med trop. 2015 jul-aug;48(4):399–405. doi:10.1590/0037-8682-0145-2015 pmid:26312928 carabali m, hernandez lm, arauz mj, villar la, ridde v. why are people with dengue dying? a scoping review of determinants for dengue mortality. bmc infect dis. 2015 jul 30;15(1):301. doi:10.1186/s12879-015-1058-x pmid:26223700 moraes gh, de fátima duarte e, duarte ec. determinants of mortality from severe dengue in brazil: a population-based case-control study. am j trop med hyg. 2013 apr;88(4):670–6. doi:10.4269/ajtmh.11-0774 pmid:23400577 leo ys, thein tl, fisher da, low jg, oh hm, narayanan rl, et al. confirmed adult dengue deaths in singapore: 5-year multi-center retrospective study. bmc infect dis. 2011 may 12;11(1):123. doi:10.1186/1471-2334-11-123 pmid:21569427 lee ik, liu jw, yang kd. clinical and laboratory characteristics and risk factors for fatality in elderly patients with dengue hemorrhagic fever. am j trop med hyg. 2008 aug;79(2):149–53. doi:10.4269/ajtmh.2008.79.149 pmid:18689614 prevalence of hiv and sexually transmitted infections among young women engaged in sex work aboard foreign fishing vessels in kiribati original research tebuka toatu,a paul white,a,b damian hoy,a dennie iniakwala,a onofre edwin a merrilles, jra and sameer vali gopalania,c a public health division, pacific community, noumea, new caledonia. b epidemiology and laboratory capacity program, public health and hospital emergency preparedness office, commonwealth health care corporation, saipan, commonwealth of the northern mariana islands. c department of biostatistics and epidemiology, college of public health, university of oklahoma health sciences center, oklahoma city, ok, usa. correspondence to tebuka toatu (email:tebukat@spc.int). to cite this article: toatu t, white p, hoy d, iniakwala d, merrilles jr oe, gopalani sv. prevalence of hiv and sexually transmitted infections among young women engaged in sex work aboard foreign fishing vessels in kiribati. western pac surveill response j. 2018 march;9(1). doi:10.5365/wpsar.2017.8.4.005 abstract objective: to assess the prevalence of hiv and sexually transmitted infections (stis) among women who board foreign fishing vessels for sex work in kiribati. methods: a cross-sectional study was designed to collect data on behavioural risk factors for stis and knowledge of and attitudes towards hiv and stis during 2007. urine and blood samples were collected to test for hiv and select stis. descriptive statistics were performed for sociodemographic and behavioural characteristics, and χ2 tests were used to assess associations between potential key determinants and the presence of genital chlamydia infection. results: women who boarded foreign fishing vessels for transactional sex were younger, had less education, were less likely to live with a partner and were less likely to be otherwise employed. although no hiv infections were detected, more than half (57.5%) of the women were diagnosed with an sti. one quarter of the women tested positive for chlamydia, and 40% tested positive for mycoplasma. the presence of chlamydia was strongly associated with age at first sexual intercourse (p = 0.02) and number of sexual partners during the prior seven days (p = 0.02). conclusion: the high rate of stis in this population of sex workers is concerning given the potential of severe pregnancy-related and chronic health problems and the increased risk of transmission within the general population of kiribati. we identified a specific sex worker population as a priority group for targeted public health efforts to prevent and control the spread of stis in kiribati. introduction kiribati is a small island developing state composed of 33 widely dispersed small islands in the northern pacific ocean. the country has a population of 92 533, of whom 57.9% are under 25 years of age.1 kiribati's large exclusive economic zone, which covers 3.5 million kilometres of ocean, is an important national economic resource, generating income from fishing licenses, access fees and transhipment fees from foreign fleets. the income gained from foreign fishing vessels is critical to local and national economies. despite the economic benefits, unfavourable consequences have arisen such as an expansion of transactional sex (defined as sex in exchange for money or resources) in kiribati among fishermen and seafarers from asia and other pacific countries with kiribati women. transactional sex in kiribati is on the rise. the estimated number of women engaging in transactional sex on relatively urban south tarawa doubled from 30–50 in 2003 to 60–100 in 2006.2 the increasing trend is also apparent on kiritimati island.2 foreign fishing vessel crews are in port from days to weeks, during which time local women board the vessels for transactional sex. some of these women drink alcohol with the foreign fishermen and also engage in sex with local men. excessive alcohol consumption is prevalent among both men and women, which may lead to sexual assault. also, the frequency of condom use during these encounters is low.2 kiribati has an estimated 55 cumulative cases of human immunodeficiency virus (hiv) dating from 1991,3 and the incidence rate for hiv is among the highest in the pacific region.4,5 in kiribati, the most frequently reported mode of hiv transmission is heterosexual contact followed by perinatal transmission.3 in a meta-analysis of studies from 50 lowand middle-income countries, the hiv prevalence among female sex workers was 11.8%.6 in the pacific, a meta-analysis reported a sexually transmitted infection (sti) prevalence of 28.7% in papua new guinea.7 in kiribati, the total sti incidence reported from 2000 to 2005 was 30.1 per 10 000 people. most (62.9%) of the cases were males. however, these figures mask the true burden due to underreporting as sti reporting in kiribati is limited by laboratory and public health capacity.8 at the national level, surveillance and reporting of hiv/aids has been in place since 1989. hiv cases are reported by sentinel laboratories to the hiv programme coordinator. the coordinator prepares monthly hiv reports with information on sex, age and mode of transmission. at the time of the study, surveillance and reporting for other stis were limited by the lack of laboratory and public health information capacity. besides hiv, other notifiable stis were gonorrhoea and syphilis. chlamydia was not a notifiable infection, and testing facilities were not available locally during the time of this study. in a combined hiv surveillance survey and behavioural surveillance survey from 2004 to 2005, as part of the second generation surveillance surveys of hiv, other stis and risk behaviours in 6 pacific island countries, seafarers were identified as a high-risk group for both hiv and stis.9 overall, 9.3% of the seafarers were infected with genital chlamydia trachomatis.9 in a report specific to kiribati, women involved in transactional sex were identified to be at high risk for stis.3 women who board foreign fishing vessels for sex are thought to be at particular high risk since they often have multiple partners on the fishing vessels and within the local community. although two studies on behavioural risk factors among youth and young women boarding foreign fishing vessels are available,10,11 neither of these studies includes information on the prevalence for stis and hiv in this population. to address this important gap, the present study was undertaken to determine the prevalence of hiv and stis and assess behavioural risk factors among women engaged in transactional sex on foreign fishing vessels in kiribati. methods study design a cross-sectional study was undertaken to determine the hiv and sti prevalence and assess behavioural risk factors among women engaged in transactional sex with foreign seafarers. setting the study was undertaken at two sites in kiribati: south tarawa from january to march 2007 and kiritimati island from may to june 2007. it was structured in the form of a three-day workshop, with days one and two dedicated to participant interviews and sample collection and day three reserved for providing education on stis and hiv, access to and use of contraceptives, voluntary counselling, confidential testing and human rights. participants as transactional sex contravenes kiribati custom, a multisectoral approach was adopted to identify women engaged in sex work with foreign seafarers. we worked in conjunction with government agencies, nongovernmental organizations and trained peer educators from the adolescent health development centre to identify, inform and invite potential participants into the study in person. due to the absence of trained peer educators on kiritimati, trained counsellors were used. women who were 18–33 years old, resided in south tarawa or kiritimati island and boarded a foreign fishing vessel for sex work within the previous 12 months were invited to participate in the study. the age cut-offs were selected because women below 18 years were unable to provide consent for the study and those above 33 years were unlikely to be involved in transactional sex on foreign fishing vessels. of the 83 women invited to participate in the study, 80 women met the eligibility criteria. all eligible women agreed to participate in the study. prior to enrolment, information on the study was provided verbally and through an information sheet. participation was voluntary, and a signed consent form was obtained from all participants. all participants were compensated with an amount of 10 australian dollars. any women found to have stis were managed in accordance to the world health organization sexually transmitted infections case management guidelines as adapted by the ministry of health and medical services in kiribati. additionally, pre(before sample collection) and post-test (after receipt of test results) counselling was provided by nurses and officers who had undergone counselling training. sample size based on the prevalence of chlamydia at 20% among women under 20 years attending an antenatal clinic in tarawa (2002–2003),9 we calculated a target sample size of 88. sample size was calculated using ps: power and sample size calculation, version 2.1.31 (william d. dupont and w. dale plummer, jr., memphis, tennessee, usa). data and specimen collection we developed a structured cross-sectional questionnaire and collected blood and urine samples. the questionnaire comprised 65 questions across 11 sections (see annex 1), and it was also translated from english to kiribati language. first, trained counsellors administered one-on-one interviews using the questionnaire with quantitative and qualitative items. during each interview, which lasted 20–30 minutes per participant, counsellors collected information on sociodemographic characteristics, behavioural risk factors for stis and knowledge of and attitudes towards stis and hiv. second, urine and blood samples were collected. serological testing of blood samples for hiv, syphilis and hepatitis b were conducted locally employing abbott's determine test kits (abbott laboratories, tokyo, japan). reactive sera for syphilis were referred to the south eastern area laboratory in sydney, australia for confirmatory treponema pallidum particle agglutination assays and fluorescent treponema absorbance tests. in addition, frozen urine samples were referred for polymerase chain reaction testing for chlamydia trachomatis, neisseria gonorrhoeae, mycoplasma hominis and ureaplasma urealyticum. data management and analysis data were entered into an access database (microsoft corporation, redmond, washington, usa) on a password-protected computer and checked and validated using epi info, version 3.3.2 (centers for disease control and prevention, atlanta, georgia, usa). descriptive statistics such as measures of central tendency were performed for sociodemographic characteristics. χ2 tests were used to assess associations between key determinants and chlamydia infection. the significance level was set at p < 0.05. all analyses were performed using spss, version 15.0 (spss inc., chicago, illinois, usa). ethics at the time of this study, there was no standing human research ethics committee in kiribati. therefore, with the support of the ministry of health in kiribati, ethics approval was granted by the human research ethics committee at the university of new south wales, australia (hrec 06313). results participant characteristics a total of 80 women, 50 (62.5%) from south tarawa and 30 (37.5%) from kiritimati island, participated in this study. the mean age of participants was 21 (sd = 3.6) years with the majority aged 18–20 (n = 47, 58.8%). sociodemographic characteristics of participants by location are reported in table 1. half of the study participants had been married (n = 40, 50%), and 32 (40%) reported ever being pregnant. most women did not live with a partner (n = 64, 80%) and were away from home (left home and lived with peers due to stigma against sex work and pressure from family members) during the prior 12 months (n = 50, 62.5%). more than half (n = 45, 56.3%) of the women had never attended school, and 74 (92.5%) were unemployed (other than transactional sex) during the time of interview. table 1. demographic characteristics of young women who boarded fishing vessels for sex work in the past 12 months, kiribati, 2007 click to download table 1. jpg, 515kb behavioural characteristics a higher proportion of women boarded fishing vessels for the purpose of having sex and drinking alcohol (n = 56, 70%) than having sex only (n = 6, 7.5%) (table 2). most women (n = 69, 86.3%) reported having a single partner during each visit. although condom awareness (ascertained by the question: have you ever heard of a male condom?) was high (90% in south tarawa and 83.3% in kiritimati island) (data not shown), there was infrequent use of condoms (37.5%). only 9 (11.3%) women reported using condoms every time during sex. table 2. behavioural characteristics of women who boarded fishing vessels for sex work in the previous 12 months, kiribati, 2007 click to download table 2. jpg, 337kb prevalence of stis and hiv more than half (n = 46, 57.5%) of the women in our study were diagnosed with an sti. of these, the majority (n = 27, 58.7%) tested positive for a single sti. overall, the prevalence of chlamydia was 25%, syphilis was 6.3% and gonorrhoea was 2.5% (table 3). thirty-two (40%) and eight (10%) women were diagnosed with mycoplasma and ureaplasma, respectively. none of the women tested positive for hiv. prevalence of chlamydia in women was strongly associated with younger age at first sexual intercourse (p = 0.02) and total number of sexual partners (p = 0.02) but not associated with age or level of education (table 4). table 3. frequency and prevalence of stis and agents among young women boarding fishing vessels for sex work, kiribati, 2007 click to download table 3. jpg, 260kb table 4. frequency of genital chlamydia trachomatis infections by selected demographic and risk factors among young women boarding fishing vessels for transactional sex, kiribati, 2007 click to download table 4. jpg, 393kb discussion the results of this study show that women who board foreign fishing vessels for sex work tend to have limited education and are young, are not living with a partner and are otherwise unemployed. this study assesses the prevalence of risk behaviours and select stis among women boarding foreign fishing vessels for transactional sex in kiribati and shows that more than half (57.5%) of the women were diagnosed with an sti. the prevalence of stis in our study was twice as high as the overall prevalence among sex workers in papua new guinea (28.7).7 in addition, the prevalence of chlamydia in our study population was higher than other studies of female sex workers.7,12,13 the 25% chlamydia incidence in the women in our study is nearly twice that shown in a study of pregnant women from the general population in kiribati.9 this substantial difference highlights the increased sti risk for sex workers and emphasizes the need for public health interventions. in our study, 40% of the participants had ever been pregnant, which underscores the need for prenatal sti screening in this population so any treatable infections can be treated as early as possible. consistent with studies from other nations,14,15 our results also revealed a significant association between chlamydia and a history of contact with two or more sexual partners. consistent with previous findings among sex workers in china,16 the prevalence of urogenital mycoplasma hominis (40%) and ureaplasma urealyticum (10%) was high in this study population. a high prevalence of mycoplasma spp. and ureaplasma spp. could indicate a loss or decrease of lactobacillus species from the vaginal flora and is associated with bacterial vaginosis. previous studies have shown that the loss of hydrogen peroxide (h2o2)-producing lactobacillus spp. can lead to the overgrowth of pathogenic organisms and can increase the risk of transmission of stis and hiv.17 none of the women in our study tested positive for hiv; however, high rates of chlamydial infection, which is associated with an increased risk of hiv transmission18 and low rates of consistent condom use,19 could increase transmission risk if hiv were introduced into this population. the high prevalence of stis among this population of women flags the susceptibility of this group to a range of related severe and permanent health conditions, including but not limited to infertility, ectopic pregnancy, pelvic inflammatory disease and human papillomavirus-associated cancers.20,21 in addition, a high prevalence of stis in the sex worker population increases the risk of introducing stis into the general population, especially given the low adherence to safer sex practices by sex workers.22 participants had a high awareness of condom use (90% and 83.3% for south tarawa and kiritimati island, respectively), but many reported minimal or inconsistent condom use. a possible explanation for the infrequent use of condoms could be the lack of availability of condoms when needed. future studies should investigate the reasons for the inconsistency in condom use contrasted with the high awareness reported. even among the women reporting condom use, a high percentage of them had an sti (data not shown). this could indicate response bias with participants reporting higher condom use to meet the perceived expectations of the interviewers. another possible explanation could be that condoms were used incorrectly, for example, the lack of condom use during sexual foreplay. in our study, a high proportion of women (56%) had never attended a school. of those that attended a school, high dropout rates were reported from secondary schools. low education level is not only associated with entry into sex work23 but is also a risk factor for stis among women engaged in sex work.24 besides transactional sex, most women (92.5%) in our study were unemployed. fewer employment opportunities in kiribati coupled with a lack of formal education makes it challenging for these women to secure jobs. these socioeconomic factors are some of the drivers for women to enter sex work in kiribati. this study has some limitations that merit consideration. first, the small sample size could have reduced the power of the study to detect true sociodemographic and behavioural differences between those with chlamydia and those without. recruiting participants was challenging due to kiribati cultural norms that disapprove of engaging in sex for money and dictate that unmarried women should not be sexually active. nonetheless, the sample size of our study reflects the small size of the population of women boarding foreign fishing vessels. second, the survey responses may reflect socially desirable responses; however, we aimed to minimize this bias by using trained counsellors who assured the participants that their responses would be private, confidential and secure. in addition, the counsellors were trained and advised to adopt a non-judgmental approach to the participants' responses. third, behavioural characteristics, such as condom use, were self-reported and may have been subject to recall issues. fourth, due to the cross-sectional nature of our study, associations between various factors and stis cannot be interpreted to infer causality. despite these limitations, this is the first study to be conducted among this marginalized group of women in kiribati. the study has identified risk factors for sti transmission and barriers that need to be addressed specific to this high-risk population. economic drivers such as limited employment opportunities coupled with the lack of education are some of the reasons women board foreign fishing vessels for sex work.25 the high prevalence of stis among the women in our study warrants an immediate response to prevent wider community transmission. public health interventions such as periodic presumptive treatment to decrease morbidity from stis and shorten the duration of infectiousness to prevent further spread into the community must be implemented promptly.26 we recommend a combined approach, including enhancing existing communicable disease surveillance systems nationwide, strengthening health education to women at high risk of stis and to the general population, tailoring health programmes to make them more acceptable and accessible to women engaged in transactional sex and promoting efforts to destigmatize these women in kiribati society. as the prevalence of stis in this key population group is high, we advocate for follow-up studies to assess the trends of stis in this population. future studies could also assess any impact this population may have on the overall epidemiology of stis or hiv in kiribati. conflicts of interest none declared. funding funding for this project was provided by the global fund to fight aids, tuberculosis and malaria, united nations population fund, and the pacific community. acknowledgements for technical assistance and support, the authors would like to thank dr elizabeth sullivan, dr richard hillman, professor adrian mindel, mr riteti maninraka, dr kabwea tiban, dr airam metai, dr takeieta b. kienene, dr john tekanene, ms maoto metai, ms mamao robate and professor john tapsall. the authors are grateful to the young women who participated in the study. a portion of this work was completed and presented in fulfilment of the requirements of the master of science degree of the primary author. references 2005 census of population. volume i: basic information and tables (revised version). tarawa: kiribati national statistics office; 2015 (http://www.mfed.gov.ki/statistics/kiribati-document-library, accessed 15 march 2016). kiribati ministry of health and medical services. kiribati hiv/aids/tb task force (khatbtf), sti and hiv/aids strategic plan 2005–2008. tarawa: kiribati ministry of health and medical services; 2005. kiribati global aids response progress report 2012. tarawa: kiribati ministry of health and medical services; 2012 (http://files.unaids.org/en/dataanalysis/knowyourresponse/countryprogressreports/2012countries/ce_ki_narrative_report.pdf, accessed 20 march 2016). country strategy and program update: kiribati (2006–2007). manila: asian development bank; 2006. opportunities to improve social services in kiribati. human development in the pacific islands. washington, dc: the world bank, 2007 (http://documents.worldbank.org/curated/en/117551468289223392/opportunities-to-improve-social-services-in-kiribati, accessed 22 march 2016). baral s, beyrer c, muessig k, poteat t, wirtz al, decker mr, et al. burden of hiv among female sex workers in low-income and middle-income countries: a systematic review and meta-analysis. lancet infect dis. 2012 jul;12(7):538–49. doi:10.1016/s1473-3099(12)70066-x pmid:22424777 vallely a, page a, dias s, siba p, lupiwa t, law g, et al. the prevalence of sexually transmitted infections in papua new guinea: a systematic review and meta-analysis. plos one. 2010 12 23;5(12):e15586. doi:10.1371/journal.pone.0015586 pmid:21203468 morbidity and mortality database, health information centre. tarawa: kiribati ministry of health and medical services; 2016 (http://www.health.gov.ki/public-health-services.html#health-information, accessed 22 march 2016). second generation surveillance surveys of hiv, other stis and risk behaviours in 6 pacific island countries (2004–2005). geneva: world health organization; 2006 (http://www.wpro.who.int/hiv/documents/sgs_final_document/en/, accessed 3 march 2016). sexual knowledge and attitudes of adolescents in kiribati. suva: united nations population fund; 2002 (http://www.worldcat.org/title/sexual-knowledge-and-attitudes-of-adolescents-in-kiribati/oclc/607884488?referer=di&ht=edition). commercial sexual exploitation of children and child sexual abuse in kiribati: a situation analysis. ny: united nations children's fund; 2004 (http://www.worldcat.org/title/commercial-sexual-exploitation-of-children-and-child-sexual-abuse-in-kiribati-a-situation-analysis/oclc/68794879). ramjee g, karim ss, sturm aw. sexually transmitted infections among sex workers in kwazulu-natal, south africa. sex transm dis. 1998 aug;25(7):346–9. doi:10.1097/00007435-199808000-00004 pmid:9713913 esquivel ca, briones ezcarzaga ml, castruita limones de, lazalde ramos bp, salas ev, gutierrez aa, et al. prevalence of chlamydia trachomatis infection in registered female sex workers in northern mexico. sex transm dis. 2003 mar;30(3):195–8. doi:10.1097/00007435-200303000-00003 pmid:12616134 williams km, wingood gm, diclemente rj, crosby ra, hubbard mccree d, liau a, et al. prevalence and correlates of chlamydia trachomatis among sexually active african-american adolescent females. prev med. 2002 dec;35(6):593–600. doi:10.1006/pmed.2002.1112 pmid:12460527 pimenta jm, catchpole m, rogers pa, hopwood j, randall s, mallinson h, et al. opportunistic screening for genital chlamydial infection. ii: prevalence among healthcare attenders, outcome, and evaluation of positive cases. sex transm infect. 2003 feb;79(1):22–7. doi:10.1136/sti.79.1.22 pmid:12576608 pingmin w, yuepu p, jiwen z. prevalence survey on condom use and infection of urogenital mycoplasmas in female sex workers in china. contraception. 2005 sep;72(3):217–20. doi:10.1016/j.contraception.2005.05.002 pmid:16102559 klebanoff sj, coombs rw. viricidal effect of lactobacillus acidophilus on human immunodeficiency virus type 1: possible role in heterosexual transmission. j exp med. 1991 jul 1;174(1):289–92. doi:10.1084/jem.174.1.289 pmid:1647436 chesson hw, pinkerton sd. sexually transmitted diseases and the increased risk for hiv transmission: implications for cost-effectiveness analyses of sexually transmitted disease prevention interventions. j acquir immune defic syndr. 2000 may 1;24(1):48–56. doi:10.1097/00042560-200005010-00009 pmid:10877495 ahmed s, lutalo t, wawer m, serwadda d, sewankambo nk, nalugoda f, et al. hiv incidence and sexually transmitted disease prevalence associated with condom use: a population study in rakai, uganda. aids. 2001 nov 9;15(16):2171–9. doi:10.1097/00002030-200111090-00013 pmid:11684937 mullick s, watson-jones d, beksinska m, mabey d. sexually transmitted infections in pregnancy: prevalence, impact on pregnancy outcomes, and approach to treatment in developing countries. sex transm infect. 2005 aug;81(4):294–302. doi:10.1136/sti.2002.004077 pmid:16061534 bosch fx, de sanjosã© s. the epidemiology of human papillomavirus infection and cervical cancer. dis markers. 2007;23(4):213–27. doi:10.1155/2007/914823 pmid:17627057 steen r, dallabetta g. sexually transmitted infection control with sex workers: regular screening and presumptive treatment augment efforts to reduce risk and vulnerability. reprod health matters. 2003 nov;11(22):74–90. doi:10.1016/s0968-8080(03)02295-x pmid:14708399 clarke rj, clarke ea, roe-sepowitz d, fey r. age at entry into prostitution: relationship to drug use, race, suicide, education level, childhood abuse, and family experiences. j hum behav soc environ. 2012;22(3):270–89. doi:10.1080/10911359.2012.655583 solomon mm, smith mj, del rio c. low educational level: a risk factor for sexually transmitted infections among commercial sex workers in quito, ecuador. int j std aids. 2008 apr;19(4):264–7. doi:10.1258/ijsa.2007.007181 pmid:18482947 sladden t, vulavou i. unfpa supported sex worker initiatives in six pacific island countries 2007–2008. unfpa pacific sub-regional office; 2008. balkus je, manhart le, lee j, anzala o, kimani j, schwebke j, et al. periodic presumptive treatment for vaginal infections may reduce the incidence of sexually transmitted bacterial infections. j infect dis. 2016 jun 15;213(12):1932–7. doi:10.1093/infdis/jiw043 pmid:26908758 https://ojs.wpro.who.int/ 1wpsar vol 13, no 1, 2022 | doi: 10.5365/wpsar.2022.13.1.839 covid-19: outbreak investigation report a s of 2 january 2022, there were approximately 289 million confirmed cases of coronavirus disease 2019 (covid-19) globally, with over 5.4 million deaths.1 malaysia recorded its first confirmed covid-19 case on 2 january 2020, and by 6 july 2020, a total of 8476 confirmed cases of covid-19 were recorded, with 121 deaths. during that period, three clusters involving aged-care facilities were reported in selangor state, resulting in 44 infections and five deaths.2 the first covid-19 case that resulted in death involving a resident of an aged-care facility in the klang district was notified to the klang district health office on 27 march 2020 from a university hospital. this report details the investigation and measures taken at this aged-care facility in klang during the outbreak. the aims were (i) to verify the outbreak and cluster; (ii) to identify cases and describe the outbreak in terms of persons, place and time; (iii) to ascertain the outbreak source, classify at-risk groups and risk factors for disease transmission; and (iv) to implement infection prevention and control measures at the facility. methods the aged-care facility is privately owned, and it opened in klang district, selangor, in december 2019. there are nine staff and nine elderly residents. at the time of the outbreak, all residents had pre-existing comorbidities, including hypertension, diabetes mellitus and cardiovascular disease. three of the residents required special aids for activities of daily living, which included the use of wheelchairs and specially designed beds. a suspected case was defined as a person who met the clinical or epidemiological criteria. clinical criteria were acute respiratory symptoms with at least one of the following: shortness of breath or cough or sore throat and/or fever beginning sometime between 9 march and 7 april 2020 (28 days = 2 incubation periods). epidemiological criteria included residing or working at the facility anytime within the 14 days prior to symptom onset or from 9 march to 7 april. a confirmed case was an individual with laboratory confirmation of sars-cov-2 infection. a klang district health office, ministry of health malaysia, putrajaya, malaysia. published: 25 january 2022 doi: 10.5365/wpsar.2022.13.1.839 objective: aged-care facilities are high-risk settings for coronavirus disease 2019 (covid-19) outbreaks because residents have risk factors such as advanced age and multiple comorbidities. this report details a covid-19 outbreak at an aged-care facility in selangor, malaysia during march–april 2020. methods: epidemiological and environmental data were gathered via telephone interviews and field investigations. swab samples were taken from all residents and staff for laboratory investigation. possible contributing factors to the outbreak were explored. results: there were a total of 18 individuals at the institution: nine elderly residents and nine staff. the attack rate was 66.67% (6/9) among the elderly residents and 55.56% (5/9) among the staff. the most common symptoms reported were fever, cough, shortness of breath and diarrhoea. the fatality rate among covid-19 cases was 18.18% (2/11). both fatal cases occurred in people of advanced age (86 and 92 years old), who had comorbidities and had fever at presentation. the factors contributing to the outbreak included a delay in isolating symptomatic residents, the use of common facilities, caregivers providing support to more than one resident and a lack of natural ventilation. discussion: prevention and control measures must be aggressively implemented in high-risk sites to significantly reduce the risk of morbidity and mortality during covid-19 outbreaks. specific guidelines should be developed detailing the management of outbreaks in institutions such as aged-care facilities. covid-19 outbreak at an aged-care facility in selangor, malaysia, march–april 2020 faridah jafri,a mardiana omar,a faridah kusnina and masitah mohameda correspondence to faridah jafri (email: faridah.jafri1510@gmail.com) wpsar vol 13, no 1, 2022 | doi: 10.5365/wpsar.2022.13.1.839 https://ojs.wpro.who.int/2 jafri et alepidemiology of covid-19 outbreak in an aged-care facility in selangor, malaysia she developed symptoms of fever and diarrhoea on 23 march. she was readmitted to hospital on 25 march, but she developed shortness of breath and died 3 days later (table 1). the last case involved a 33-year-old female staff member with onset of fever and sore throat on 2 april. all residents and staff of the facility were at the facility during the outbreak period, which may have led to cross-infection during care work, therapy sessions and daily activities. laboratory investigation there were 14 swab samples taken at the facility on 30 march, three of which tested positive for covid-19. fifteen swab samples were taken at the university hospital between 27 march and 7 april (table 1). in total, there were 11 positive cases. environmental investigation the facility is a two-storey bungalow with five bedrooms and four bathrooms, with a total area of about 353 m2 (3800 square feet). there were three double-occupant rooms and two four-occupant rooms for the residents. all rooms had two occupants, except one double room with only one occupant. common areas included a lounge, a dining room and a kitchen. outside of the building is an open space used for physical activities. air conditioning is used constantly at the facility, and windows generally remain closed. activities conducted individually included personal care, regular health check-ups and physiotherapy sessions. however, caregivers and the physiotherapist attended to multiple residents. group activities included meal times, exercise and social activities. the facility’s management staff implemented twice-daily general cleaning and disinfection when the malaysian government enacted the first movement control order on 18 march 2020. based on observations and interviews, staff used personal protective equipment inconsistently throughout the outbreak. in general, the level of cleanliness was satisfactory, and measures for physical distancing were in place. infection prevention and control health education was delivered to the facility’s management about infection prevention and control measures for telephone investigations were conducted with the staff of the facility to gain information about residents and staff. all residents and staff were screened as part of active case detection on 30 march. the information collected included demographic data, clinical symptoms and details of close contacts. oropharyngeal or nasopharyngeal swab samples were taken and analysed by reverse transcription–polymerase chain reaction at the national public health laboratory in sungai buloh. repeat swab samples were also taken at the university hospital and were analysed at the hospital’s laboratory. a field assessment, which investigated the physical aspects of the facility and residents’ social interactions and activities, was conducted at the institution to ascertain possible contributing factors to the outbreak. results epidemiology on the day of mass screening at the facility, four individuals had already been admitted to the university hospital (one staff member and three elderly residents, one of whom had died). swab samples were taken from the remaining staff and residents at the facility (a total of 14 individuals). the demographic and clinical details of each resident and staff member are outlined in table 1. the attack rate was 66.67% (6/9) among the residents and 55.56% (5/9) among the staff. the fatality rate among cases who tested positive for covid-19 was 18.18% (2/11). the most common symptoms reported were fever, cough, shortness of breath and diarrhoea. the onset of symptoms for the index case was on 23 march, and onset for the last case was on 2 april. all confirmed cases were admitted to the university hospital ward for treatment and isolation. the three elderly residents with negative covid-19 results were admitted to the university hospital ward for close monitoring and quarantine. common features among both cases who died were advanced age (86 and 92 years old), the presence of comorbidities, fever at presentation and admission to the ward within 2 days after symptom onset. the epidemic curve shows a point source outbreak (fig. 1). the index case was a 92-year-old female with symptoms of fever, shortness of breath and diarrhoea. she had been to hospital previously for anaemia from 7–17 march. she was then discharged to the facility, where wpsar vol 13, no 1, 2022 | doi: 10.5365/wpsar.2022.13.1.839https://ojs.wpro.who.int/ 3 epidemiology of covid-19 outbreak in an aged-care facility in selangor, malaysiajafri et al table 1. demographic information and covid-19 disease course among residents and staff at an aged-care facility, klang district, selangor, malaysia, 2020 age sex ethnicity comorbidity symptoms symptom onset date sample dates and results admission date outcome care facility university hospital staff 35 male pakistani – cough, myalgia 26.03.2020 30.03.2020 positive 03.04.2020 positive 04.04.2020 general ward unknown female indian – fever, cough 28.03.2020 30.03.2020 positive 01.04.2020 positive 01.04.2020 general ward 36 female chinese – fever, myalgia 28.03.2020 – 29.03.2020 positive 29.03.2020 general ward 33 female chinese – fever, cough, sore throat 02.04.2020 30.03.2020 negative 03.04.2020 negative, 08.04.2020 general ward 07.04.2020 positive 26 female indian – asymptomatic – 30.03.2020 negative 03.04.2020 positive 04.04.2020 general ward 20 female unknown – none – 30.03.2020 negative – – home quarantine 30 female malay – none – 30.03.2020 negative – – home quarantine 33 male chinese – none – 30.03.2020 negative – – home quarantine 36 male chinese – none – 30.03.2020 negative – – home quarantine residents 92 female chinese hypertension, cvd fever, shortness of breath, diarrhoea 23.03.2020 – 27.03.2020 positive 25.03.2020 deceased (28.03.2020) 85 female chinese dm, hypertension fever, cough 28.03.2020 – 29.03.2020 positive 29.03.2020 general ward 92 female chinese dm, hypertension cough, shortness of breath 28.03.2020 – 29.03.2020 positive 29.03.2020 general ward 85 female chinese dm, hypertension, ckd cough, diarrhoea 30.03.2020 30.03.2020 positive 05.04.2020 positive 05.04.2020 general ward 86 male chinese hypertension, cvd fever, cough 01.04.2020 30.03.2020 negative 01.04.2020 positive 01.04.2020 deceased (16.04.2020) 85 female chinese dm asymptomatic – 30.03.2020 negative 05.04.2020 positive 05.04.2020 general ward 67 male chinese dm, hypertension, prostate disease, cvd none – 30.03.2020 negative 05.04.2020 negative 05.04.2020 general ward 84 male chinese dm none – 30.03.2020 negative 05.04.2020 negative 05.04.2020 general ward 85 female chinese dm, hypertension, ckd none – 30.03.2020 negative 05.04.2020 negative 05.04.2020 general ward ckd: chronic kidney disease; cvd: cardiovascular disease; dm: diabetes mellitus. dashes indicate that the category is not applicable. wpsar vol 13, no 1, 2022 | doi: 10.5365/wpsar.2022.13.1.839 https://ojs.wpro.who.int/4 jafri et alepidemiology of covid-19 outbreak in an aged-care facility in selangor, malaysia a few mechanisms may have prompted sars-cov-2 transmission at the facility. first, sars-cov-2 is transmissible even while a case is asymptomatic or presymptomatic.3 this phenomenon has complicated efforts to isolate infected individuals. evidence shows that asymptomatic individuals may be infectious as early as 12.3 days (95% confidence interval: 5.9–17 days) before symptom onset.4 second, the residents’ demographic factors, such as older age and the presence of comorbidities, predisposed them to greater risk of severe infection, with complications and death.5 third, the shared use of rooms and bathrooms, group activities and social interactions at the facility may have precipitated the spread of infection among the residents. fourth, the facility was fully air-conditioned, which hindered natural ventilation, thus predisposing residents and staff to the spread of airborne infection.6 based on the experiences in this outbreak, we have outlined a few recommendations for improvements to outbreak prevention and control measures in similar facilities. first, upon receiving an outbreak notification, a rapid assessment team should conduct a thorough risk assessment of the facility and its occupants (both residents and staff). second, a high index of suspicion should be adopted to identify symptomatic positive cases early and isolate them from the rest of the residents and staff. covid-19 outbreaks on 30 march. total disinfection of the facility was carried out by the municipality on 6 april. the facility was temporarily closed and all residents and staff were issued quarantine orders in an effort to break the chain of transmission and assist in contact tracing. all remaining residents were pre-emptively admitted to hospital on 6 april for close monitoring and quarantine (prior to the release of swab test results). discussion the index case of this outbreak was an elderly resident with symptom onset on 23 march 2020. she exhibited symptoms of fever and diarrhoea at the beginning of the infectious period, which subsequently led to hospital admission. the source of her infection was believed to be nosocomial, and infection was believed to have occurred during her previous hospital admission in early march. the week that she stayed at the aged-care facility between the two hospital admissions provided ample opportunity for transmission to take place. the onset of the last case was on 2 april (within one incubation period of the index case); this case had symptoms of fever, cough and sore throat. the time of onset showed that the outbreak was limited because no new cases were reported that exceeded one incubation period. fig. 1. epidemic curve of the covid-19 outbreak at an aged-care facility, klang district, selangor, malaysia, 2020 0 1 2 3 4 5 19 -m ar 20 -m ar 21 -m ar 22 -m ar 23 -m ar 24 -m ar 25 -m ar 26 -m ar 27 -m ar 28 -m ar 29 -m ar 30 -m ar 31 -m ar 1ap r 2ap r 3ap r 4ap r 5ap r 6ap r 7ap r staff resident(s) deceased alive n u m b er o f ca se s date of onset, 2020 interval between index case and last case: 11 days (within one incubation period) for asymptomatic cases, symptom onset was presumed to be 5 days prior to notification date. wpsar vol 13, no 1, 2022 | doi: 10.5365/wpsar.2022.13.1.839https://ojs.wpro.who.int/ 5 epidemiology of covid-19 outbreak in an aged-care facility in selangor, malaysiajafri et al conflicts of interest none declared. ethics statement ethics approval was not required. funding none references 1. weekly epidemiological update on covid-19 – 6 january 2022. geneva: world health organization; 2022. available from: https:// www.who.int/publications/m/item/weekly-epidemiological-updateon-covid-19---6-january-2022, accessed 7 january 2022. 2. hasmuk k, sallehuddin h, tan mp, cheah wk, ibrahim r, chai st. the long term care covid-19 situation in malaysia. london: international long-term care policy network; 2020. available from: https://ltccovid.org/wp-content/uploads/2020/10/malaysialtc-covid-situation-report-2-october-2020-1.pdf, accessed 28 september 2021. 3. ye f, xu s, rong z, xu r, liu x, deng p, et al. delivery of infection from asymptomatic carriers of covid-19 in a familial cluster. int j infect dis. 2020;94:133–8. doi:10.1016/j.ijid.2020.03.042 pmid:32247826 4. he x, lau ehy, wu p, deng x, wang j, hao x, et al. temporal dynamics in viral shedding and transmissibility of covid-19. nat med. 2020;26(5):672–5. doi:10.1038/s41591-020-0869-5 pmid:32296168 5. liu k, chen y, lin r, han k. clinical features of covid-19 in elderly patients: a comparison with young and middle-aged patients. j infect. 2020;80(6):e14-8. doi:10.1016/j.jinf.2020.03.005 pmid:32171866 6. natural ventilation for infection control in health-care settings. geneva: world health organization; 2009. available from: https:// apps.who.int/iris/handle/10665/44167, accessed 28 september 2021. third, hospital admission should be considered early for elderly residents because they are at great risk for rapid, unpredictable deterioration from sars-cov-2 infection. fourth, repeat testing should be considered in view of the possibility of continuous exposure to asymptomatic cases. finally, the use of natural ventilation should be encouraged, especially during the day, and windows and doors should be regularly opened at the facility. among the limitations of this outbreak investigation were the small sample size and lack of completeness in patient data because they were gathered through telephone interviews with third parties, that is, management staff. additionally, an outbreak transmission tree could be established through molecular sequencing to better explain the chronology of the outbreak. conclusions covid-19 outbreaks at aged-care facilities are serious events, as residents are at high risk of morbidity and mortality. in the outbreak at the aged-care facility in klang district, health authorities took appropriate measures by conducting mass screening at the facility and isolating elderly residents in the hospital. specific guidelines for managing institutional covid-19 outbreaks, such as those occurring at aged-care facilities, should be prepared by ministries of health and other appropriate agencies. acknowledgements we thank the director-general of health malaysia for his permission to publish this article. https://ojs.wpro.who.int/ 1wpsar vol 12, no 2, 2021 | doi: 10.5365/wpsar.2020.11.2.009 brief report a raja isteri pengiran anak saleha hospital, brunei darussalam. b institute of health sciences, pengiran anak puteri rashidah sa’adatul bolkiah, universiti brunei darussalam, brunei darussalam. c suri seri begawan hospital, brunei darussalam. d pengiran isteri hajah mariam hospital, temburong, brunei darussalam. published: 21 april 2021 doi: 10.5365/wpsar.2020.11.2.009 s ince late december 2019, an outbreak of coronavirus disease 2019 (covid-19), caused by severe acute respiratory syndrome coronavirus 2 (sars-cov-2), has spread globally, resulting in a pandemic. as of 30 march 2021, 126 million confirmed cases had been reported worldwide, with 2.7 million deaths.1 brunei darussalam reported its first case of covid-19 on 9 march 2020, and as of 11 april 2021, there were 219 confirmed cases.2 apart from limited small clusters, brunei darussalam remains at who level 2 of covid-19 transmission with the last documented local infection on 6 may 2020. several measures were taken by the government, headed by the ministry of health, to prevent or contain community spread. these included active case identification (i.e. screening at points of entry and surveillance in clinics), contact tracing by the department of public health, isolation of confirmed cases in a designated hospital (the national isolation centre, tutong district), limiting public gatherings (closure of schools and places of worship, cancellation of public gatherings and banning of large private functions) and continued advice on physical distancing (through all media). in public and private hospitals and clinics, measures to prevent nosocomial spread of covid-19 included limiting entry points, with compulsory risk assessment and temperature checks. in the three government hospitals (not the designated covid-19 hospital), patients admitted for pneumonia and those with risk factors for covid-19 were screened. in this paper, we describe this screening process from 9 march to 30 april 2020. materials and methods screening for sars-cov-2 was implemented in the three government hospitals for all patients referred from clinics or who presented to the emergency departments for admission and who met the screening criteria. the standardized screening criteria were any of the following: community-acquired pneumonia (lower respiratory symptoms with no history of recent hospital admission), radiological changes consistent with pneumonia, previous quarantine within four weeks of contact with a confirmed covid-19 case or travel to affected countries in the previous 14 days. patients were admitted to designated holding wards in each hospital, and nasopharyngeal swabs were taken and tested by reverse transcriptase polymerase chain reaction (rt–pcr) at the national virology reference laboratory. test results were usually available within 12 hours. while in the holding wards, patients continued to receive appropriate treatment and were screened for other infections, as indicated (dengue, malaria and various bacterial infections). patients who tested negative for sars-cov-2 were moved out of the holding wards to the main wards for continuation of care. patients who tested positive were informed of their results, and transferred to the national isolation centre for further management. the department of public health was informed of any positive results in order to initiate contact tracing without delay. patients were interviewed according to the usual contact-tracing protocol, and family members and screening of hospital admissions for covid-19 in brunei darussalam sanny zi lung choo,a hazirah shafri,a fatimah al-zahara johan,a norwani basir,a pui ling chong,a muhammad syafiq abdullah,a,b rosmonaliza asli,a jackson tan,a,b dilip joseph thottacherry,c mohammad ady adillah ahmadd and vui heng chonga,b correspondence to vui heng chong (vuiheng.chong@moh.gov.bn) wpsar vol 12, no 2, 2021 | doi: 10.5365/wpsar.2020.11.2.009 https://ojs.wpro.who.int/2 choo et alscreening of hospital admissions for covid-19 in brunei darussalam hospital were screened for sars-cov-2 and found to be negative. contact tracing for this case resulted in two additional covid-19 cases: the patient’s spouse and daughter. both were tested the day after the index case was diagnosed. the daughter, who already had mild fever and headache for two days, tested positive. the spouse, who was then presymptomatic, tested negative and was placed under a 14-day quarantine. she was retested 7 days later during quarantine when she developed sore throat and rhinorrhea, and was then positive. both were admitted to the national isolation centre soon after testing positive (daughter two days and spouse eight days after diagnosis of index case) and were discharged after 14 (daughter) and 20 days (spouse). the spouse was readmitted for a further four days after retesting positive on day 11 after discharge. discussion our experience highlights the importance of screening in hospitals during the covid-19 outbreak. although only one positive case was detected, we consider this programme a success, as, if the programme had not been carried out, nosocomial spread might have occurred. nosocomial transmission has been reported, with significant consequences, including the deaths of health-care workers and other patients.4–7 hospitalized patients are usually older adults who have comorbidities that place them at higher risk for complications.8 screening for sars-cov-2 should therefore be maintained in health-care settings as the pandemic continues, with appropriate infection prevention and control (ipc) measures. our screening programme had implications not only for the hospitals but also for the community. contact tracing for the case detected by screening led to the identification of two community cases, the patient’s spouse and daughter. they became mildly symptomatic during their illness; the daughter was symptomatic at first testing, and the spouse became symptomatic 7 days after initially testing negative and later retested positive. their symptoms resolved without treatment during hospitalization. these two cases could have been missed if the index patient had not been diagnosed, with a potential risk for community spread. detection of the initial case upon hospital contacts were screened for sars-cov-2 with rt–pcr testing and quarantined for 14 days. all positive sars-cov-2 cases, i.e. those detected by screening and those subsequently identified through contact tracing of cases, were transferred to the national isolation centre for treatment. patients were admitted initially for a minimum of 14 days and were discharged only when they were symptom-free for three consecutive days and had two consecutive negative rt–pcr tests on days 12 and 14 of hospitalization. after discharge, patients were obliged to self-isolate for 14 days; a repeat swab was taken and tested on day 11 after discharge. patients were considered cured once they had a negative swab and had completed 14 days of self-isolation. patients who retested positive during self-isolation were readmitted for further management. testing was repeated immediately, and the patients were discharged only after two consecutive negative swabs 24 hours apart. our criteria have since changed and we no longer retest patients on day 11 after discharge.3 results during the study period, 225 patients had been admitted to the holding wards in the three government hospitals. most of the patients (90%) were admitted from a medical specialty: eight from surgical and 14 from renal specialties. seven had been admitted to an intensive care unit and 35 to a high-dependency unit (table 1). of the 225 patients, only one (41-year-old man without comorbidities or travel history) was positive for sars-cov-2. this patient had presented five times to health-care services (four times to clinics and most recently to the emergency department of the main hospital) with fever and respiratory symptoms that had persisted despite symptomatic treatment. no contact with a possible or confirmed case was reported at any visit. after covid-19 was confirmed, the contact history was reviewed, and the patient was linked to a confirmed case. the patient was immediately transferred to the national isolation centre for treatment. his course of illness was uncomplicated, and he was discharged after 15 days of hospitalization and two consecutive negative rt–pcr tests. a swab taken 11 days after discharge was negative. the 12 health-care workers involved in the care of this case at the original http://table 1 wpsar vol 12, no 2, 2021 | doi: 10.5365/wpsar.2020.11.2.009https://ojs.wpro.who.int/ 3 screening of hospital admissions for covid-19 in brunei darussalamchoo et al admission and isolation of the two additional cases prevented further community spread. the limitations encountered included the continuously changing criteria for sars-cov-2 in the earlier part of the pandemic, especially with respect to countries of travel. initially, we categorized countries by risk categories according to the level of infection and presence of community spread; however, as more countries became affected, any travel history was considered a risk factor. the selection of patients for screening partially depended on the admitting doctors’ suspicion and interpretation of radiological changes. even with set criteria, we relied on the vigilance and awareness of front-line workers of ever-changing guidelines and protocols. in addition, there will always be variation in doctors’ threshold for screening, and the screening yield was low (only one positive of 225 screened; 0.44% yield), especially among those with chronic pulmonary problems, such as chronic obstructive pulmonary disease and past tuberculosis, who had the expected radiological changes. simple, non-infective exacerbations would have been identified during screening. unnecessary isolation in the holding wards, even for a short time, can be detrimental to patients, particularly those who require intensive medical care. the strict ipc measures required in these wards further burdens patients and staff. inappropriate admission to the holding wards also incurs costs, with inappropriate use of limited resources. we consider, however, that use of resources was acceptable, despite the low rate of detection, given that there was community spread in the country. the areas that would improve the screening programme include: rapid dissemination and implementation of revised criteria and other relevant documents to front-line health-care workers; maintaining open communication among team members in various departments; and continuous audits of screened patients to improve the screening process. references 1. coronavirus disease (covid-19) weekly epidemiological update – 30 march 2021. geneva: world health organization; 2020. available from: https://www.who.int/publications/m/item/weekly-epidemiological-update-on-covid-19---31-march-2021, accessed 12 april 2021. 2. press release on the current situation of the covid-19 infection in brunei darussalam. bandar seri begawan: ministry of health; 11 april 2021. available from: http://www.moh.gov.bn/lists/latest%20news/newdispform.aspx?id=840, accessed 12 april 2021. 3. abdullah ms, chong pl, asli r, momin rn, mani bi, metussin d, chong vh. post discharge positive re-tests in covid-19: common but clinically non-significant. infect dis (lond). 2020;52(10):7435. doi:10.1080/23744235.2020.1780309. 4. wu z, mcgoogan jm. characteristics of and important lessons from the coronavirus disease 2019 (covid-19) outbreak in china: summary of a report of 72 314 cases from the chinese center for disease control and prevention. jama. 2020;323(13):1239– 42. doi:10.1001/jama.2020.2648 5. chustecka z. more than 60 doctors in italy have died in covid-19 pandemic. medscape, 2 may 2020. available from: https://www.medscape.com/viewarticle/927753, accessed 2 may 2020. 6. zhan m, qin y, xue x, zhu s. death from covid-19 of 23 health care workers in china. n engl j med. 2020;382(23):2267–8. doi:10.1056/nejmc2005696 7. rickman hm, rampling t, shaw k, martinez-garcia g, hail l, coen p, et al. nosocomial transmission of covid-19: a retrospective study of 66 hospital-acquired cases in a london teaching hospital. clin infect dis. 2020:ciaa816. doi:10.1093/cid/ ciaa816 8. wu r, ai s, cai j, zhang s, qian zm, zhang y, et al. predictive model and risk factors for case fatality of covid-19: a cohort of 21,392 cases in hubei, china. innovation (new york). 2020;1(2):100022. doi:10.1016/j.xinn.2020.100022 table 1. number of admissions isolated and screened for covid-19 by hospital and specialty, brunei darussalam, 9 march–30 april 2020 specialty hospital 1 hospital 2 hospital 3 holding ward 1 holding ward 2 (high dependency) holding ward intensive care unit holding ward total medical 132 31 30 7 3 203 surgical 8 0 8 renal 10 4 14 total 150 35 30 7 3 225 https://ojs.wpro.who.int/ 1wpsar vol 13, no 3, 2022 | doi: 10.5365/wpsar.2022.13.3.926 case report t uberculosis (tb) remains endemic in many parts of the world and pulmonary tb (ptb) is the most common manifestation. tb is usually caused by mycobacterium tuberculosis.1 however, in some parts of the world, variants predominate; for example, in west and central africa, m. africanum predominates, accounting for over 50% of ptb cases.2,3 m. africanum comprises two phylogenetically distinct lineages within the m. tuberculosis complex (mtbc): m. africanum west african 1 and m. africanum west african 2.2,3 cases of m. africanum outside africa are rare and often occur in people who originate from affected regions.4 cases have been reported in england, france, germany, spain and the united states of america (usa),2 and local transmission outside endemic regions has also been reported. a study from norway reported a cluster of six cases of m. africanum originating from a single imported case.5 three patients were from countries in west africa, and the other three were from south asia and the caribbean, where m. africanum is not known to be present. four of the six patients had lived in norway for more than 10 years, and the other two for 3–9 years. the six cases were diagnosed over a 3-year period (2016–2018).5 prior to this report, no cases of m. africanum have been reported in the western pacific region. the case case identification a 52-year-old malaysian man living in brunei darussalam who had been previously well presented with a chronic cough that had recently become productive with greenish-yellow sputum. he also reported weight loss of 3 kg in recent months. several courses of antibiotics prescribed by a private doctor had been ineffective. a chest x-ray (cxr) showed pleural parenchymal lesions with fibrosis in the right upper zone with cavitation. his past medical history was insignificant, apart from a cxr (february 2018) done as part of occupational health screening, which showed pulmonary fibrosis in the right upper zone. cxr done before this in 2014 was normal (fig. 1). he was referred for evaluation but cancelled his appointment because he was well. he is a smoker of 24 pack-years and does not consume alcohol. he reported no past history, family history or a department of medicine, pengiran muda mahkota pengiran muda haji al-muhtadee billah hospital, tutong, brunei darussalam. b division of respiratory medicine, department of medicine, raja isteri pengiran anak saleha hospital, bandar seri begawan, brunei darussalam. c national mycobacteria reference laboratory, department of laboratory services, ministry of health, bandar seri begawan, brunei darussalam. d pengiran anak puteri rashidah sa’adatul bolkiah institute of health sciences, universiti brunei darussalam, brunei darussalam. published: 22 july 2022 doi: 10.5365/wpsar.2022.13.3.926 mycobacterium africanum is endemic to west africa and is rare outside this region. most of the people infected with m. africanum outside africa are migrants from affected parts of africa. we report a rare case of pulmonary tuberculosis (tb) secondary to m. africanum in a man in brunei darussalam who had lived and worked in guinea, west africa for 6 years more than 20 years ago. he had been well until december 2020, when he presented with a chronic cough and was diagnosed with coinfections of klebsiella pneumoniae and m. africanum, and newly diagnosed diabetes mellitus. this case highlights an interesting manifestation of pulmonary tb secondary to m. africanum in a patient whose last exposure was 20 years ago, contributed to by development of diabetes mellitus. a rare presentation of mycobacterium africanum after two decades: a case report from brunei darussalam abdur rahman rubel,a panduru venkata kishore,b may thu hla aye,a nor azian hafnehc and vui heng chonga,d correspondence to vui heng chong (email: chongvuih@yahoo.co.uk or vuiheng.chong@moh.gov.bn) wpsar vol 13, no 3, 2022 | doi: 10.5365/wpsar.2022.13.3.926 https://ojs.wpro.who.int/2 rubel et almycobacterium africanum in brunei darussalam the specific species or mutation band profile provided by the manufacturer. sputum culture isolated klebsiella pneumoniae and sensitivity testing showed it to be sensitive to all antibiotics apart from ampicillin. all three morning sputum smears also came back positive for acid fast bacilli (afb), confirming the diagnosis of ptb and k. pneumoniae coinfection. serum glycosylated haemoglobin came back as 9.3% (reference: <6.5%), confirming a new diagnosis of diabetes mellitus. afb culture identification (lpa, genotype mtbc) came back as m. africanum. hiv screening was negative. treatment the patient was started on a course of antibiotics while waiting for ptb investigations, after which he was started on anti-diabetes treatment (metformin 1000 mg twice daily and linagliptin 5 mg once daily); also, glucose control improved, with a glucose range of 5–10 mmol/l. the patient was started on standard anti-tubercular treatment (att) as per world health organization guidelines, with 2 months of intensive treatment with isoniazid, rifampicin, pyrazinamide and ethambutol, followed by 4 months of isoniazid and rifampicin. his treatment while waiting for three consecutive negative sputum afb tests was only complicated by mild anti-tb side-effects. on contact with anyone with tb. he was referred to the hospital for evaluation for ptb based on his history of chronic cough and cxr findings. clinical examination revealed minimal coarse crepitations in the right upper lung. blood investigation showed elevated white cell count, elevated inflammatory markers, hyperlipidaemia and hyperglycaemia. laboratory investigations three consecutive morning sputum specimens were sent to the national mycobacteria reference laboratory, department of laboratory services, brunei darussalam. in brief, the specimens were decontaminated and inoculated in both liquid (mycobacterium growth indicator tube, becton dickinson, nj, usa) and lowenstein-jensen slant (becton dickinson). simultaneously, an aliquot of concentrated specimen was prepared for auramine o fluorescent stain kit m (becton dickinson). smear-positive samples were screened for the presence of mtbc dna and drug (rifampicin and isoniazid) resistance genes using genotype mtbdrplus version 2.0 (hain lifescience gmbh, germany), performed according to the manufacturer’s instructions. further species differentiation within mtbc was identified using genotype mtbc version 1 (hain lifescience gmbh). after reverse hybridization, the final step was a lineprobe assay (lpa), which involved fixing the test strips on a designated sheet and interpretation according to fig. 1. a) chest x-ray from 2014 with normal findings, and b) from presentation in december 2020, showing fibrosis with cavitation in the upper zone on the right a b wpsar vol 13, no 3, 2022 | doi: 10.5365/wpsar.2022.13.3.926https://ojs.wpro.who.int/ 3 mycobacterium africanum in brunei darussalamrubel et al sion to disease, showing the lower virulence of m. africanum compared with m. tuberculosis. a study from endemic parts of africa has shown that patients with m. africanum had shorter duration of symptoms but more severe changes on chest imaging.7 those of older age and with conditions that affect the immune system (e.g. hiv and diabetes mellitus) are at higher risk. a recent study from brunei darussalam reported that a third of tb patients have underlying diabetes at or within 6 months of diagnosis of tb, highlighting the importance of diabetes as a risk factor in patients with tb.8 smoking has also been shown to contribute to the risk of poor outcomes from tb. a large study of patients from 32 high tb burden countries reported an estimated 17.6% (95% confidence interval [ci]: 8.4–21.4) of tb cases and 15.2% (95% ci: 1.8–31.9) of tb mortality were attributable to smoking.9 in our case, smoking is likely also a contributing factor in addition to diabetes mellitus. tb remains endemic in brunei darussalam, with an average of 227 cases recorded every year, for a rate of 54 per 100 000 population per year.8 this case represents the first case of m. africanum recorded in brunei darussalam. in fact, literature searches failed to locate any report of m. africanum in south-east asia. this case is interesting from several aspects. first, our patient is from south-east asia and his only exposure was during a period of residence in guinea. there was no history of other possible exposures after returning from guinea. second, ptb manifested more than 20 years after exposure. in the interim period, he had been well, apart from cxr findings during an occupational health screening. he probably manifested the disease after he developed diabetes mellitus, which was diagnosed simultaneously with ptb. apart from diabetes mellitus, there was no evidence of other conditions that can cause immune suppression. an hiv test was negative and there was no clinical evidence of underlying malignancy. furthermore, his condition improved after starting treatment for ptb and diabetes mellitus. tb remains an important public health problem, causing more than a million deaths each year, especially in developing countries.10 with effective day 17 of att, he developed an urticarial reaction that resolved with regular antihistamines. on day 26, he developed deranged liver function tests (lft). hepatotoxic drugs were withheld and the patient was treated with ethambutol and second-line levofloxacin in the interim period. once lft normalized, att re-challenge with the sequential introduction of main-line att was achieved. the patient completed the extended intensive-phase therapy followed by the continuation phase without any further adverse events. cxr after completion of treatment, 9 months after diagnosis, showed resolution of cavities, leaving only fibrotic changes in the right upper zone. his glycaemic control initially improved to 9.3% but later deteriorated as he had stopped his diabetes treatment due to financial issues that were compounded by the coronavirus disease (covid-19) pandemic. case history we revisited the patient’s history, which revealed that he had lived in a small village in guinea, west africa from 1995 to 2000. he could not recall having contact with anyone who had chronic cough or symptoms of tb. apart from the occasional bout of influenza, he had been well during his 6 years of living there. he then returned to his home country of malaysia and subsequently moved to brunei darussalam in 2011. his family reside in malaysia and are all well. he reported no history of contact with his former african colleagues and had not returned to africa. discussion humans are the only natural reservoir for m. africanum, which is usually transmitted by inhalation of infected droplets. however, cases of m. africanum infection in animals such as monkeys and cows have been reported.2,6 a study from bangladesh reported m. africanum type i identified through spoligotyping in autopsied lung tissue homogenate samples of four cows, probably infected through a farm caretaker.2 clinical manifestations of m. africanum are similar to m. tuberculosis but have a more indolent course and less severe symptoms.7 the infection may have host specificity, be influenced by factors such as age, and have less severe cough symptoms and slow progreswpsar vol 13, no 3, 2022 | doi: 10.5365/wpsar.2022.13.3.926 https://ojs.wpro.who.int/4 rubel et almycobacterium africanum in brunei darussalam references 1. chakaya j, khan m, ntoumi f, aklillu e, fatima r, mwaba p, et al. global tuberculosis report 2020 – reflections on the global tb burden, treatment and prevention efforts. int j infect dis. 2021;113(suppl 1):s7–12. doi:10.1016/j.ijid.2021.02.107 pmid:33716195 2. de jong bc, antonio m, gagneux s. mycobacterium africanum – review of an important cause of human tuberculosis in west africa. plos negl trop dis. 2010;4(9):e744. doi:10.1371/journal. pntd.0000744 pmid:20927191 3. yeboah-manu d, de jong bc, gehre f. the biology and epidemiology of mycobacterium africanum. adv exp med biol. 2017;1019:117– 33. doi:10.1007/978-3-319-64371-7_6 pmid:29116632 4. baya b, diarra b, diabate s, kone b, goita d, sarro yds, et al. association of mycobacterium africanum infection with slower disease progression compared with mycobacterium tuberculosis in malian patients with tuberculosis. am j trop med hyg. 2020;102(1):36– 41. doi:10.4269/ajtmh.19-0264 pmid:31733052 5. eldholm v, rønning jo, mengshoel at, arnesen t. import and transmission of mycobacterium orygis and mycobacterium africanum, norway. bmc infect dis. 2021;21(1):562. doi:10.1186/ s12879-021-06269-3 pmid:34118874 6. rahim z, möllers m, te koppele-vije a, de beer j, zaman k, matin ma, et al. characterization of mycobacterium africanum subtype i among cows in a dairy farm in bangladesh using spoligotyping. southeast asian j trop med public health. 2007;38(4):706–13. pmid:17883011 7. de jong bc, hill pc, aiken a, jeffries dj, onipede a, small pm, et al. clinical presentation and outcome of tuberculosis patients infected by m. africanum versus m. tuberculosis. int j tuberc lung dis. 2007;11(4):450–6. pmid:17394693 8. omar n, wong j, thu k, alikhan mf, chaw l. prevalence and associated factors of diabetes mellitus among tuberculosis patients in brunei darussalam: a 6-year retrospective cohort study. int j infect dis. 2021;105:267–73. doi:10.1016/j.ijid.2021.02.064 pmid:33610780 9. amere ga, nayak p, salindri ad, narayan kmv, magee mj. contribution of smoking to tuberculosis incidence and mortality in high-tuberculosis-burden countries. am j epidemiol. 2018;187(9):1846– 55. doi:10.1093/aje/kwy081 pmid:29635332 10. global tuberculosis report 2021. geneva: world health organization; 2021. available from: https://www.who.int/publications/i/ item/9789240037021, accessed 24 february 2022. and timely treatment, tb is curable. therefore, enhanced surveillance and reporting remain an integral component and should be continuously monitored and improved, especially in areas where tb remains endemic, including the western pacific region. this is especially true as pandemic-related travel restrictions are eased, resulting in increasing population movement, which can lead to the appearance of tb strains in non-endemic regions. conclusion this case represents the first case of m. africanum recorded in brunei darussalam. our patient’s only risk factor was having lived in africa 20 years ago and this unusual manifestation probably resulted from development of underlying diabetes mellitus. clinicians need to consider the possibility of m. africanum in any person with a history of travel to an endemic region, even after such a long interval. in addition, our case highlights that tb can manifest at any time, especially with the presence of underlying risk factors such as diabetes mellitus and heavy smoking. conflict of interest the authors declare no conflicts of interest. ethics statement the patient provided verbal consent for publication of this report. no identifying images are used in this report. funding none the epidemiology of tuberculosis in the pacific, 2000 to 2013 original research kerri viney,a damian hoy,b adam roth,b paul kelly,cd david harleya and adrian sleigha a australian national university, national centre for epidemiology and population health, research school of population health, canberra, australia. b research, evidence and information programme, public health division, secretariat of the pacific community, noumea, new caledonia. c population health division, australian capital territory health, canberra, australia. d australian national university medical school, canberra, australia. correspondence to kerri viney (email: kerri.viney@anu.edu.au or kerri.viney@hotmail.com). to cite this article: viney k et al. the epidemiology of tuberculosis in the pacific, 2000 to 2013. western pacific surveillance and response journal, 2015, 6(3). doi:10.5365/wpsar.2015.6.1.001 abstract objective: tuberculosis (tb) poses a significant public health challenge in the 22 pacific island countries and territories. using tb surveillance data and world health organization (who) estimates from 2000 to 2013, we summarize the epidemiology of tb in the pacific. methods: this was a descriptive study of incident tb cases reported annually by pacific island national tb programmes to who. we counted cases and calculated proportions and case notification rates per 100 000 population. we calculated the proportion of tb patients who completed tb treatment and summed estimates of national incidence, prevalence and mortality, provided by who, to produce regional incidence, prevalence and mortality rates per 100 000 population. results: estimated tb incidence in the pacific has remained high but stable from 2000 to 2013; estimated prevalence and mortality have fallen by 20% and 47%, respectively. the tb case notification rate increased by 58%, from 146 to 231 per 100 000 population in the same time period. in 2013, 24 145 tb cases were notified, most (94% or 22 657) were from papua new guinea. kiribati had the highest tb case notification rate at 398 cases per 100 000 population. tb case notification rates were also high in papua new guinea, the marshall islands and tuvalu (309, 283 and 182, respectively). discussion: tb in the pacific is improving in some areas; however, high rates affect many countries and the estimated regional incidence rate is stable. to further reduce the burden of tb, a combination of dedicated public health and system-wide approaches are required along with poverty reduction and social protection initiatives. introduction tuberculosis (tb), one of the world’s most important infectious diseases, continues to burden people in the pacific. annually, approximately 15 000–20 000 people are diagnosed with tb in the region, and 15% more go unreported.1,2 tb case notification rates vary greatly between pacific island countries and territories.1,2 further, some pacific island countries and territories have managed to reduce the burden of tb in recent years, while in other countries the tb case notification rate has increased dramatically.1,2 both epidemiological situations may represent improvements in tb case finding, prevention and care. the pacific region, as defined in this paper, comprises 22 countries and areas3 with approximately 10 million residents; about 7 million are in papua new guinea.4 the region includes thousands of islands scattered over a vast area of 8.5 million square kilometres and is divided into three subregions based on ethnic, linguistic and cultural differences: melanesia, micronesia and polynesia. the pacific island countries and territories have mixed economies and are mostly classified as middle-income (us$ 1036 to us$ 4085 per capita).5 health care is provided by governments and nongovernmental organizations with a small private sector contribution (excluding the contribution of traditional healers).6 health systems are oriented towards primary health care but are often poorly funded and consequently struggle to meet population needs.6 the high cost of service provision to small and scattered population groups compounds these difficulties.6 most pacific island countries and territories have a dedicated national tb programme responsible for prevention, diagnosis and care. due to their small size, pitcairn islands and tokelau do not. pacific island tb programmes aim for internationally recommended targets for tb elimination by 2050 as per the who regional strategic plan to stop tb in the western pacific: 2011–2015,7 the who stop tb partnership and the millennium development goals (mdgs).8 additional targets have been set for the global end tb strategy designed for implementation after 2015.9,10 in 1995, who recommended the international tb control strategy, directly observed treatment short-course (dots),11 which was adopted by all pacific island countries and areas in the subsequent years.2 by the year 2000, most had officially adopted this strategy and the associated standardized recording and reporting system. the six united states-affiliated pacific island countries (american samoa, commonwealth of the northern mariana islands, federated states of micronesia, guam, palau, and republic of the marshall islands) are also aligned with the tb policies of the united states centers for disease control and prevention (cdc).12 all pacific island countries and areas have a tb recording and reporting system using internationally accepted definitions. there is limited published information on the epidemiology of tb in the pacific, and progress towards international and regional tb targets requires further examination. who publishes annual global tb reports1 that report on global and regional tb trends and the epidemiology of tb in the 22 high-burden tb countries. however, they do not assess the epidemiology of tb in the pacific islands as a whole. therefore, we analysed this routinely collected tb data to better understand the epidemiology of tb in the pacific and to assess progress towards tb targets as outlined in the regional strategic plan.7 methods study design this was a descriptive study of tb surveillance data, assessing incident cases reported annually by pacific island national tb programmes to who. we also described estimates of incidence, prevalence and mortality provided by who.1 data collection the data source for this study was the annual tb surveillance data reported to who for the period 2000 to 2013.13 we chose the year 2000 as a baseline as many of the national tb programmes had adopted the dots strategy by this time and were using the associated recording and reporting tools. the year 2000 also serves as a baseline for selected tb indicators in the regional strategic plan.7 the routinely collected tb data are collated and verified by pacific national tb programme managers before being uploaded onto the who online tb data collection system. the reported variables cover clinical, microbiological, demographic and programmatic factors.13 completeness and consistency of data are verified by who before public release. who also provides estimates of tb incidence, prevalence, mortality and case detection.13 statistical analysis data were organized in microsoft excel and statistical analyses were carried out in stata version 12 (stata corp 2011 college station tx: statacorp lp). we counted cases and calculated proportions and notification rates per 100 000 using population estimates provided to who by the united nations population division. tb case notification rates comprised those who were registered as new or relapse unless otherwise stated. a new tb patient was defined as one who has never had tb or who has received less than one month of anti-tb drugs previously.14 a relapse tb patient was defined as one who was previously treated for tb, declared cured and has a recurrent episode of tb.14 treatment success was calculated by summing tb cases who were cured and who completed treatment and dividing by the total number of notified cases for that particular year. the tb treatment outcomes of cured, treatment completed, failed, died and lost to follow-up were reported using who definitions.14 the case definitions used to categorize tb patients and their treatment outcomes changed in 2013;14 the revised definitions were used by pacific island countries and territories to report to who in 2014. from 2013, tb patients were categorized as follows: bacteriologically or clinically diagnosed, further classified according to the anatomical site of disease, history of previous tb treatment, drug resistance and hiv status.13,14 therefore, treatment success was calculated for patients with sputum smear-positive tb (until 2012) and those with bacteriologically confirmed tb for 2013, including those who were classified as new and relapse. treatment completed was calculated for those with sputum smear negative and extrapulmonary tb until 2012 and for those with clinically diagnosed and extrapulmonary tb in 2013. country estimates for tb case detection, incidence, prevalence and mortality were provided by who; detailed methods for calculating these estimates are provided in the who annual global tb reports.13 who provides uncertainty intervals for tb case detection, incidence, prevalence and mortality; however, it is not recommended to sum these estimates. therefore, uncertainty intervals are not reported. ethical considerations this study used publicly available, routinely collected and anonymized surveillance data; therefore ethics approval was not required. results descriptive epidemiology in 2013, 24 145 cases of tb (comprising new and relapse patients) were notified in the pacific region. tb notifications in 2013 represented an 8% increase from 2012 with the majority being from papua new guinea (22 657; 94%). a further 3% (767) were from two other pacific island countries: kiribati (n = 407) and solomon islands (n = 360) (table 1). table 1. notified cases of tb by type, and rates per 100 000 population for the pacific island countries and areas, 2013* click to download table 1. jpg, 584kb * pitcairn islands is not included in this table, as they have not reported any cases of tb since the who reports began in 1997. † these countries did not report data to who in 2013. the highest case notification rate in 2013 was in kiribati at 398 cases per 100 000 population. this was followed by papua new guinea, the marshall islands and tuvalu with 309, 283 and 182 cases per 100 000 population, respectively (table 1). the case notification rate for the whole region was 231 cases per 100 000 population (figure 1). almost all cases were classified as new (23 886; 99%), and 16% (n = 3981) of all cases were laboratory confirmed. figrue 1. number of tb notifications and notification rates (all forms and sputum smear positive, with and without papua new guinea) in the pacific island countries and areas,* 2000 to 2013 click to download figure 1. jpg, 638kb note: in 2013 the classification of sputum smear-positive was replaced by laboratory confirmed. therefore in this figure the “smear positive” cases in 2013 are those who are laboratory confirmed (i.e. by sputum smear microscopy or by rapid molecular based test). * pitcairn islands is not included in this table, as they have not reported any cases of tb since the who reports began in 1997. png, papua new guinea. fourteen pacific island countries reported age and sex data to who for 1486 cases (6% of the total). of these, 53% (n = 792) were male and 17% (n = 258) were children aged less than 15 years. four countries reported 20% or more of their total tb caseload in children (table 2). table 2. proportion of tb in children aged 0–14 years in 14 pacific island countries and territories, 2013 click to download table 2. jpg, 519kb note: four pacific island countries did not report tb data to who in 2013 (american samoa, federated states of micronesia, nauru and new caledonia). in addition, papua new guinea reported data to who in 2013; however the age and sex of tb patients was marked as unknown. tokelau and niue reported zero cases of tb in 2013. and, pitcairn islands is not included in this table, as they have not reported any cases of tb since the who reports began in 1997. therefore, these eight countries are not included in this table. tb case notifications almost doubled since 2000 when a total of 11 871 tb cases were notified (figure 1). accordingly, from 2000 to 2013 the tb case notification rate increased from 146 to 231 cases per 100 000 population (figure 1). however, if papua new guinea data are excluded, the tb case notification rate per 100 000 population has fallen slightly over the same time period from 50 cases in 2000 to 47 cases in 2013 (figure 1). hiv and drug-resistant tb in 2013, a total of 6702 tb patients (28%) were tested for hiv; 5939 (89%) were from papua new guinea. of all patients tested for hiv, 814 (12%) were hiv positive; 807 (99%) were from papua new guinea. a total of 146 patients were diagnosed and treated for multidrug-resistant (mdr)-tb in the whole region in 2013; 84 (58%) were bacteriologically confirmed. almost all of these patients were from papua new guinea (145; 99%) with one from the marshall islands. the number tested for mdr-tb was not reported. also noteworthy was the report of six confirmed cases of extensively drug resistant (xdr)-tb, all from papua new guinea; a 50% increase on the four xdr-tb cases noted in 2012, the year extensive drug resistance was first reported for the pacific region. treatment outcomes information on tb treatment outcomes was available for only 4365 patients notified with tb in 2012 (20%) (table 3). of these 4365 tb patients, the treatment success rate for the whole region was 74% (range 68% to 100% for individual pacific island countries and areas) (table 3). of the 894 patients with an unsuccessful tb treatment outcome, 5% died (n = 239), 2% had the tb treatment outcome of “treatment failed” (n = 73) and 15% were lost to follow-up (n = 652). table 3. tb treatment outcomes for patients notified in 2012* in the pacific island countries and areas click to download table 3. jpg, 618kb * tb treatment outcomes are reported for 2012 to who in mid-2013 as tb treatment has a duration of six months. † treatment success comprises those who have an outcome of cured and treatment completed divided by the number of patients in the cohort. ‡ these countries did not report data to who in 2013. estimated incidence, prevalence, mortality and case detection in 2013, the regional estimated tb incidence, prevalence and mortality rates were 262, 340 and 25 per 100 000 population, respectively (figure 2). the highest estimated incidence and prevalence rates were in kiribati at 498 and 752 cases per 100 000 population, respectively. the highest mortality rate was in the marshall islands at 40 cases per 100 000 population. across the region, the average case detection rate was 85% (range 72% to 100% in individual pacific island countries and areas). since the year 2000, the estimated incidence rate has been stable (figure 2). prevalence and mortality rates both fell during the period 2000 to 2013 (figure 2). the prevalence rate decreased by 20%, from 424 to 340 per 100 000 population and mortality fell by almost half (47%) from 47 to 25 per 100 000 population (figure 2). when data from papua new guinea were excluded, estimated incidence, prevalence and mortality rates decreased by 18%, 28% and 52%, respectively. figure 2. estimated tb incidence, prevalence, mortality* and case notification rates in the pacific island countries and areas,† with and without papua new guinea, 2000 to 2013 click to download figure 2. jpg, 568kb * the mortality rates in this figure are exclusive of tb-hiv related mortality. † pitcairn islands is not included in this table; as they have not reported any cases of tb since the who reports began in 1997. png, papua new guinea. discussion globally, tb case notification and incidence rates have been falling; therefore, the mdg target for a reversal in tb incidence by 2015 has already been achieved.1 however, in the pacific region, tb case notification rates have been increasing since 2000 due to increases in papua new guinea and in the pacific subregion of micronesia (most notably in the marshall islands and kiribati). across the pacific, the estimated tb incidence rate has remained stable, and there have been impressive declines in tb prevalence and mortality rates. if data from papua new guinea are removed from the regional total, all three indicators have improved, indicating the influence of the data from papua new guinea on regional epidemiology. the increase in tb notifications may be partly attributable to programmatic factors; dots was introduced in the region in 1998 but took several years to be uniformly implemented.2 since 2000, some pacific island countries and areas have introduced electronic recording and reporting systems, tb contact tracing and active tb case finding strategies, and more recently, new diagnostic technologies such as xpert® mtb/rif (a rapid molecular test) and liquid culture. many of these interventions have been found to increase tb case detection.15–17 other non-programmatic factors such as the ongoing process of urbanization and increasing rates of diabetes may also partly account for the increase in tb notifications, although we were not able to assess this in our study. the largest increase in tb case notifications was recorded between 2011 and 2012: 16 541 and 22 130 cases, respectively, mostly due to a 38% increase in tb case notifications in papua new guinea.13 the increase is thought to be due to improved diagnostic services and strengthened recording and reporting practices made possible by a grant from the global fund to fight aids, tuberculosis and malaria.18 from 2000 to 2013, the largest increase in tb case notifications, over 300%, was in the marshall islands. most pacific island countries have a community hiv prevalence of less than 0.1% and very low rates of tb-hiv co-infection;13,19 papua new guinea has the highest hiv prevalence at 0.8%.20 only 28% of tb patients notified in 2013 were tested for hiv, an improvement on 2012 when only 20% were. due to this low proportion, the significance of hiv for tb in the region is therefore unclear. in papua new guinea, 25% of tb patients were tested for hiv in 2013 and 14% (807) were hiv positive. the small proportion tested for hiv implies uncertainty in estimation of hiv prevalence among tb patients in papua new guinea. therefore, increased hiv testing is an important objective for national tb programmes, particularly in papua new guinea where the rate of hiv is higher than in other countries in the region. individual pacific island countries and areas have very different burdens of tb; some countries have low and declining rates of tb and may therefore aim to eliminate tb. who recently identified a set of eight interventions designed for implementation by 30 countries with a low and declining incidence of tb.21 while the pacific island countries and areas were not on this list, those with a low and declining tb burden may implement similar measures, including screening for active tb and latent tb infection in high-risk groups.21 other countries such as papua new guinea, kiribati and the marshall islands have a higher and increasing burden of tb, and a range of context-specific interventions will be important for tb prevention and care in these countries. many interventions appropriate for papua new guinea were outlined during a recent programme review.18 these interventions include enhanced local ownership, improved health systems management, improved sputum-based diagnosis, retention of tb patients on treatment and better diagnosis and management of mdr-tb.18 kiribati is scheduled for a national tb programme review in 2015. in the meantime, the ministry of health and medical services is implementing an active tb case finding programme (personal communication, dr takeieta kienene, kiribati ministry of health and medical services). drug-resistant tb is an important tb control issue in the region,22 and to date, 221 people with mdr-tb have been detected in the pacific.13 there were 146 patients with mdr-tb who started treatment in 2013 (of these, 84 were bacteriologically confirmed), but who estimated 1140 incident cases of mdr-tb.13 the majority of the region’s notified and bacteriologically confirmed mdr-tb patients (n = 73) are from papua new guinea where drug-resistant tb constitutes an urgent public health problem. mdr-tb has also been detected in a further nine pacific island countries, including co-incidental outbreaks involving two different strains23 affecting a total of 42 patients in the federated states of micronesia (personal communication, dr mayleen ekiek, federated states of micronesia ministry of health and social affairs). technical staff from the three main technical agencies in the region (i.e. cdc, the secretariat of the pacific community and who) and other partners are collaborating on the development of interventions to prevent and minimize the impact of drug-resistant tb. a high proportion of tb was detected in children in four pacific island countries (i.e. guam, kiribati, the marshall islands and vanuatu) with 20% or more of all tb occurring in paediatric patients. ageand sex-specific data were incomplete for other countries, including papua new guinea, yet a recent programme review in papua new guinea found that the proportion of tb detected in children was 28%.18 a high proportion of paediatric tb may indicate that case detection in children is adequate (who estimates that paediatric patients should account for 5–20% of all tb case notifications in high burden settings);9 however, it also indicates transmission of tb within households and close contacts, and possibly, overdiagnosis of tb using clinical criteria alone. further studies are needed to determine the burden and diagnostic practices of paediatric tb in the pacific. the case detection rate highlights that approximately 15% of all tb patients in the pacific are never diagnosed. globally, there are concerted efforts to ascertain and treat the 3 million cases undetected by national tb programmes.24 in the pacific, active tb case finding will likely be a focus for selected national tb programmes in coming years by expanding access to tb care, including screening, diagnostic testing and treatment.24 there are several limitations to our study. we used routinely collected surveillance data which were incomplete. data on age, sex and tb treatment outcomes were missing for over 80% of the 2013 tb cohort, introducing a potential for selection bias into our study. these estimates were affected by data from papua new guinea where age and sex data were reported as unknown, and tb treatment outcome data were not reported for all patients. in addition, four pacific island countries did not report any data to who in 2013. these data may all be available at the country level and represent important data for evidence-led programming and policy-making. it is imperative that these data are reported to who on an annual basis as they represent one of the most comprehensive sources of information on tb trends and indicators at the regional level. another limitation of this study is the limited scope. detailed analyses in selected pacific island countries were not possible. more detailed analyses may yield useful information for changes in local policy and practice. in addition, individual pacific island countries are at various stages of the epidemiological transition with different levels of income, development and tb burden.5,13 therefore, recommendations based on the regionwide data may not suit specific country contexts. this represents another limitation of a regional analysis. we encourage staff from the pacific island countries and areas with a significant burden of tb to strengthen their tb surveillance systems and subsequently analyse their own tb data to make specific policy recommendations about tb prevention and care at the national level. conclusions tb case notifications are increasing in parts of the pacific and there has been little change in the estimated tb incidence rate since the year 2000. very high rates of tb were reported in kiribati, papua new guinea, the marshall islands and tuvalu. tb elimination remains unlikely across the region, although some pacific island countries may achieve this target. to reduce the burden of tb in the region, pacific island countries with a low and declining estimated incidence of tb may focus on early detection of active tb and latent tb infection and other key interventions recommended by who.21 in other pacific island countries and areas with a high estimated incidence of tb, a combination of dedicated public health and system-wide approaches are needed along with initiatives aimed at reducing poverty. the region needs substantially improved surveillance of tb in all its forms to enable ministries of health and public health agencies to plan the most suitable responses. conflicts of interest none declared. funding none. acknowledgements we would like to acknowledge that these data have been downloaded from who website, available at: http://www.who.int/tb/country/data/download/en/. we also gratefully acknowledge the ongoing collaboration and contribution of the national tb programme managers to control tb in the pacific region. references global tuberculosis report 2014. geneva, world health organization, 2014. available from: http://www.who.int/tb/publications/global_report/en/ [accessed 26 june 2015]. viney k, o’connor j, wiegandt a. the epidemiology of tuberculosis in pacific island countries and territories: 2000–2007. asia-pacific journal of public health, 2011, 23:86–99. doi:10.1177/1010539510390671 pmid:21169602 members of the pacific community 2011. noumea, secretariat of the pacific community, 2015. available from: http://www.spc.int/en/about-spc/members.html [accessed 26 june 2015]. 2013 population and demographic indicators (jan 2014 update). noumea, secretariat of the pacific community, 2015. available from: http://www.spc.int/sdd/ [accessed 26 june 2015]. country and lending groups. washington, dc, the world bank, 2014. available from: http://data.worldbank.org/about/country-classifications/country-and-lending-groups [accessed 26 june 2015]. commonwealth secretariat. commonwealth health ministers book. london, united kingdom henley media group, 2007. regional strategy to stop tb in the western pacific 2011–2015: reaching out to all. manila, world health organization regional office for the western pacific, 2011. available from: http://www.wpro.who.int/tb/regionalstrategy_201115__web.pdf [accessed 25 june 2015]. the stop tb strategy: building on and enhancing dots to meet the tb-related millennium development goals. geneva, world health organization, 2006. available from: http://whqlibdoc.who.int/hq/2006/who_htm_stb_2006.368_eng.pdf [accessed 25 june 2015]. raviglione m. global strategy and targets for tuberculosis prevention, care and control after 2015. geneva, world health organization, 2013. available from: http://www.who.int/tb/post_2015_tb_presentation.pdf [accessed 25 june 2015]. who end tb strategy. geneva, world health organization, 2014. available from: http://www.who.int/tb/post2015_strategy/en/ [accessed 25 june 2015]. the five elements of dots. geneva, world health organization, 2014. available from: http://www.who.int/tb/dots/whatisdots/en/ [accessed 25 june 2015]. us centers for disease control and prevention. cdc tuberculosis surveillance data training: report of a verified case of tuberculosis instruction manual. atlanta, united states department of health and human services, 2009. available from: http://www.cdc.gov/tb/programs/rvct/instructionmanual.pdf [accessed 25 june 2015]. tuberculosis data. geneva, world health organization, 2015. available from: http://www.who.int/tb/country/data/download/en/index.html [accessed 25 june 2015]. definitions and reporting framework for tuberculosis 2013 version. geneva, world health organization, 2013. available from: http://apps.who.int/iris/bitstream/10665/ 79199/1/9789241505345_eng.pdf [accessed 26 june 2015]. systematic screening for active tuberculosis: principles and recommendations. geneva, world health organization, 2013. available from: http://www.who.int/tb/tbscreening/en/ [accessed 10 july 2015]. hiatt t and nishikiori n. epidemiology and control of tuberculosis in the western pacific region: analysis of 2012 case notification data. western pacific surveillance and response journal, 2014, 5(1):25–34. doi:10.5365/wpsar.2014.5.1.013 pmid:24734214 nasa j et al. screening adult tuberculosis patients for diabetes mellitus in ebeye, republic of the marshall islands. public health action, 2014, 4: s50-s52. doi:10.5588/pha.13.0079 joint external review of the national tuberculosis programme of papua new guinea. port moresby, national department of health, 2014. hiv surveillance in pacific island countries and territories. noumea, secretariat of the pacific community, 2012. available from: http://www.spc.int/hiv/index.php?option=com_docman&task=cat_view&gid=108&itemid=148 [accessed 26 june 2015]. global aids report 2012 – country progress report: papua new guinea. geneva, joint united nations porgramme on hiv/aids, 2012. available from: http://www.unaids.org/sites/default/files/en/dataanalysis/knowyourresponse/ countryprogressreports/2012countries/ce_pg_narrative_report.pdf [accessed 12 august 2015]. who targets tuberculosis elimination in over 30 countries. geneva, world health organization, 2014. available from: http://www.who.int/mediacentre/news/ releases/2014/tb-elimination/en/ [accessed 25 june 2015]. majumdar ss, marais bj, denholm jt, britton wj. drug resistant tuberculosis: collaborative regional leadership required. the medical journal of australia, 2014. 200(5):241-242. pmid:24641128 united states centers for disease control and prevention (cdc).two simultaneous outbreaks of multi-drug resistant tuberculosis – federated states of micronesia 2007–2009. mmwr morbidity and mortality review weekly, 2009, 58:253–256. pmid:19300407 stop tb partnership. the “missed” three million. geneva, world health organization and stop tb partnership, 2014. available from: http://www.stoptb.org/events/ world_tb_day/2014/ [accessed 25 june 2015]. https://ojs.wpro.who.int/ 1wpsar vol 13, no 3, 2022 | doi: 10.5365/wpsar.2022.13.3.913 covid-19: lessons from the field problem as of 13 june 2022, the coronavirus disease 2019 (covid-19) pandemic had amounted to more than 532 million cases globally and more than 6.3 million deaths.1 brunei darussalam reported the first case of covid-19 on 9 march 2020 and implemented measures that successfully contained the first wave, with the last case of community spread reported on 6 may 2020.2 from then, brunei darussalam was at level 2 out of the four levels of covid-19 transmission classified by the world health organization, with no community spread and only sporadic imported cases.3 while measures implemented during the first wave had remained in place to monitor the situation, it was not possible to accurately predict the impact of the second wave until it happened. soon after the second wave started on 7 august 2021, owing to the more infectious delta strain of the severe acute respiratory syndrome coronavirus 2 (sars-cov-2), it quickly became apparent that the existing quarantine and isolation measures would not be sufficient. a similar situation was faced by many countries where health-care systems were stretched or had collapsed due to factors such as overwhelming numbers of covid-19 patients, burnout among health-care providers and the depletion of resources.4–6 with the expected increase in the number of covid-19 cases, it was important to change the role of the national isolation centre (nic) from an isolation centre to a covid-19 hospital. this report describes the challenges faced by brunei darussalam during the second wave of covid-19, the measures implemented to avoid overwhelming the nic and its transition to a covid-19 hospital. a department of medicine, pengiran muda mahkota pengiran muda haji al-muhtadee billah hospital, tutong, brunei darussalam. b department of medicine, raja isteri pengiran anak saleha hospital, bandar seri begawan, brunei darussalam. published: 22 july 2022 doi: 10.5365/wpsar.2022.13.3.913 problem: soon after the start of the second wave of coronavirus disease 2019 (covid-19) in brunei darussalam, which was confirmed to be due to the more infectious delta strain of severe acute respiratory syndrome coronavirus 2 (sars-cov-2), it became apparent that the national isolation centre (nic) was not coping. context: the nic was the only isolation and treatment centre for covid-19 in brunei darussalam. during the first wave and the first 11 days of the second wave, all confirmed cases were admitted to the nic for isolation and treatment in line with the management strategy to isolate all confirmed cases to control the outbreak. action: the ministry of health opened five community isolation centres and two quarantine centres to divert asymptomatic and mild cases from the nic. the community isolation centres also functioned as triage centres for the nic, and the quarantine centres accommodated recovered patients who did not have their own quarantine facilities. outcome: the community isolation and quarantine centres diverted cases from the nic and enabled recovered cases to be transferred to these step-down facilities. this reduced the nic’s occupancy to a safe level and enabled the reorganization of the nic to function as a treatment centre and a national covid-19 hospital. discussion: during any disease outbreak, health facilities must be prepared to adapt to changing situations. strong leadership, stakeholder commitments, teamwork and constant communication are important in this process. challenges during the second wave of covid-19 in brunei darussalam: national isolation centre to national covid-19 hospital noor affizan rahman,a,b muhammad syafiq abdullah,b rosmonaliza asli,b pui lin chong,b babu ivan mania and vui heng chonga,b correspondence to vui heng chong (email: vuiheng_chong@moh.gov.bn) wpsar vol 13, no 3, 2022 | doi: 10.5365/wpsar.2022.13.3.913 https://ojs.wpro.who.int/2 rahman et alnational isolation centre to national covid-19 hospital several times.7 the current testing protocol requires testing by reverse transcription polymerase chain reaction (rt-pcr) on day 8 after the first positive rt-pcr (designated as day 0 of covid-19 infection). if the test is negative, the patient is discharged to a designated quarantine centre. if the test is positive, testing is repeated every 48 hours until it is negative. the case must also be symptom-free or mildly symptomatic with no or resolving abnormalities in the investigations prior to discharge. post-discharge cases are isolated for another 2 weeks, either at a designated isolation facility or at the case’s own accommodation, if suitable. for risk stratification, cases were initially categorized by disease severity (mild, moderate, severe and critical) based on the clinical, laboratory and imaging parameters used in the first wave.8 however, on 13 august 2021, during the second wave, an adjustment was introduced to the new categorization system, which was adapted from that used by the moh malaysia,9 and based on clinical assessment supplemented by chest imaging. this system is more specific and facilitated the daily categorization of cases (table 1). challenges by day 7 of the second wave (13 august 2021), the preferred bed capacity of 260 was reached, and it was clear that the nic would be quickly overwhelmed. the national number of new and cumulative confirmed cases recorded over the first 16 days reached the maximum occupancy threshold of 320 by day 9 (fig. 1a). the number of new daily cases reached a peak of 314 on day 16 (22 august). due to the cumulative increase, a backlog of patients waiting to be admitted for assessment was expected. most of the cases admitted to the nic were asymptomatic or mildly symptomatic (categories 1 and 2) (fig. 1b). the situation was compounded by logistical, personnel and supply chain issues as a result of service expansion to cater to the increasing number of cases. existing personnel had to be reallocated to areas of need, and additional personnel were sought from within the moh, other ministries and volunteers in order to run the centre. support services such as transportation, laundry, catering, safety and cleanliness had to be increased. similarly, maintaining adequate stocks of consumables and medications and ensuring smooth supply chains were crucial. context setting brunei darussalam, with an estimated population of 453 600 (2020), is divided into four districts, each served by a government hospital. the nic is the designated national isolation facility for any infectious disease, located in the tutong district, consisting of three wards: one intensive care unit (icu) and two icucapable isolation wards with a total bed capacity of 27. prior to covid-19, this complex was used for isolation and treatment of pulmonary tuberculosis. it is located adjacent to the district government hospital, which has 135 beds in six wards. these two facilities have a combined bed capacity of 162. when covid-19 was discovered in wuhan, the people’s republic of china, in late december 2019, brunei darussalam began closely monitoring the situation, prepared thorough strengthening of surveillance and testing processes, and reviewed and updated infection control and outbreak management protocols. prior to the first wave, several suspected cases, mainly travellers returning from affected areas, were isolated in the nic, but all tested negative for sars-cov-2. when the first case of covid-19 was detected, all non-essential services were closed at the nic, and all inpatients were transferred to other hospitals in anticipation of more cases. the nic and district hospital were converted into a covid-19 isolation and treatment centre. due to the further increase in cases in the early phase, the ministry of health (moh) decided to build the national isolation centre extension (nice) adjacent to the nic. the nice consisted of 20 bays with six to eight beds per bay, including an icu-capable bay with six isolation rooms. however, soon after the nice was completed, the first wave was brought under control. the district hospital eventually reopened for general services, and the original nic cared for a small number of imported cases of covid-19 until the second wave began. altogether, the three complexes, henceforth all referred to as the nic, increased bed capacity to between 260 (preferred) and 320 (maximum), taking into consideration the available personnel. testing and triaging strategy over the course of the pandemic, the testing and management protocols used in the nic were revised wpsar vol 13, no 3, 2022 | doi: 10.5365/wpsar.2022.13.3.913https://ojs.wpro.who.int/ 3 national isolation centre to national covid-19 hospitalrahman et al table 1. clinical categories for adults with covid-19, brunei darussalam source: adapted from ministry of health malaysia guidelines.9 a determined by either clinical findings or chest imaging. there were two centres (centres a and b) that received patients who remained positive for sars-cov-2 by rtpcr (centre a) on day 8 and patients who had recovered (rt-pcr negative on day 8 or 10) but did not have their own suitable accommodation for isolation (centre b). later, most of the centres also served as triage centres and admitted asymptomatic or mild cases for isolation (table 2). the emergency medical ambulance service initially triaged patients and decided on their destination according to an admission criterion. national isolation centre the process of transforming the nic from an isolation centre to a national covid-19 hospital required several conditions to be met. the diversion of asymptomatic and mildly symptomatic cases to other isolation centres led to a reduction in total occupancy and allowed for personnel distribution to improve the nurse-to-patient and doctor-to-patient ratios. this also provided the opportunity to restructure and introduce other relevant specialty services to cater to the various medical needs of patients such as pregnant patients, patients with it was also important to have sufficient numbers and the right mix of doctors and nurses to maintain services and manage cases with different medical conditions. redeployment from other hospitals was required at short notice, further straining the personnel shortage in source hospitals. with rapidly increasing numbers of patients being admitted and spread out across the three buildings of the nic, it was challenging to group cases with similar medical needs and levels of care together. in addition, the different social needs of patients needed to be taken into consideration. action opening of supporting community isolation and quarantine centres an important step taken by the moh was the identification and conversion of existing government facilities into isolation centres, which enabled the diversion of milder cases from the nic. in total, there were seven centres, all of which were suitable government complexes for isolation, such as schools or training centres. initially, staging description category 1 asymptomatic category 2 symptomatic without pneumoniaa category 3 symptomatic with pneumonia category 4 symptomatic with pneumonia requiring supplemental oxygen category 5 critically ill (respiratory failure requiring mechanical ventilation with or without other organ failure) category 2 can be further divided into two subcategories: mild (2a) and moderate (2b). this subcategorization is for clinical management team reference only to risk-stratify patients who can be transferred to the community isolation facility. category 2a (mild) category 2b (moderate) sore throat or rhinorrhoea with no fever or dyspnoea persistent fever (≥2 days) or new onset fever cough with no fever or dyspnoea exertional dyspnoea loss of taste but able to consume food orally chest pain loss of smell unable to consume food orally diarrhoea two times or less within 24 hours with normal urine output worsening lethargy, e.g. difficulty with usual activities or struggling to get out of bed nausea and vomiting with normal urine output unable to ambulate without assistance mild lethargy but still able to carry out daily activities worsening or persistent symptoms, e.g. cough, nausea, vomiting or diarrhoea myalgia but still able to carry out daily activities reduced consciousness reduced urine output in the last 24 hours wpsar vol 13, no 3, 2022 | doi: 10.5365/wpsar.2022.13.3.913 https://ojs.wpro.who.int/4 rahman et alnational isolation centre to national covid-19 hospital fig. 1a. recorded number of daily new and cumulative covid-19 cases for the first 16 days of the second wave, brunei darussalama 259 339 0 200 400 600 800 1000 1200 1400 7 aug 8 aug 9 aug 10 aug 11 aug 12 aug 13 aug 14 aug 15 aug 16 aug 17 aug 18 aug 19 aug 20 aug 21 aug 22 aug day 1 day 2 day 3 day 4 day 5 day 6 day 7 day 8 day 9 day 10 day 11 day 12 day 13 day 14 day 15 day 16 n o. o f c as es dates and days of the second wave new cases cumulative cases maximum capacity preferred capacity fig. 1b. recorded number of covid-19 cases admitted to the nic from 13 august (day 7 of second wave) to 11 september 2021 by clinical category, brunei darrusalam 0 50 100 150 200 250 300 350 400 13 aug day 7 15 aug day 9 17 aug day 11 19 aug day 13 21 aug day 15 23 aug day 17 25 aug day 19 27 aug day 21 29 aug day 23 31 aug day 25 2 sep day 27 4 sep day 29 6 sep day 31 8 sep day 33 10 sep day 35 n o. o f c as es dates and days of the second wave category 1 category 2 category 3 category 4 category 5 maximum capacity preferred capacity a the solid line depicts the maximum capacity of the nic (320 patients), and the dotted line depicts the preferred capacity (260 patients). a the solid line depicts the maximum capacity of the nic (320 patients), and the dotted line depicts the preferred capacity (260 patients). wpsar vol 13, no 3, 2022 | doi: 10.5365/wpsar.2022.13.3.913https://ojs.wpro.who.int/ 5 national isolation centre to national covid-19 hospitalrahman et al tients admitted to the nic, highlighting the importance of the new centres. with the reduction in occupancy at the nic, it was possible to carry out the restructuring and adjustment of processes to function as a covid-19 hospital. restructuring of the isolation processes allowed for increasing the capacity of high-dependency units and icus, converting existing wards into a dedicated obstetrics and gynaecology (ob/gyn) ward with ensuite labour room, paediatric icu and neonatal icu, expanding physiotherapy services particularly chest physiotherapies, increasing dialysis points, and establishing a remote on-call surgical team based in the main tertiary hospital located in the capital that was ready for acute surgical emergencies (table 3). these changes also allowed for grouping of patients with similar medical needs (i.e. obstetric, renal dialysis and paediatric patients), effective allocation and distribution of nurses and doctors according to areas of expertise and improvements in patient care. end-stage renal failure and patients needing intensive care and monitoring. home isolation due to the increase in the number of patients waiting to be admitted to isolation centres, home quarantine/isolation was attempted. this had to be discontinued due to patients breaking quarantine orders and difficulties with monitoring adherence. since then, all cases are required to stay in designated isolation centres. outcomes with the opening of the community isolation and quarantine centres, the number of cases admitted to the nic declined with the opening of centre a (which started accepting patients on 18 august 2021) and declined further from day 20 with the opening of centre b, evident from day 15 (21 august 2021) (fig. 1b). this also coincided with the increase in category 3 and 4 patable 2. isolation and quarantine centres by role, category and occupancy as of 18 september 2021, brunei darussalam centre facility role categories of cases admitted capacity (overall/ usable) current occupancy staffing personnel national isolation centre isolation centres hospital isolation and treatment centre all categories 320/320 238 existing and redeployed staff community isolation centre a youth national programme centre isolation centre 1, 2a 532/532 353 onsite medical team military security community isolation centre b secondary and boarding school isolation centre 1, 2a, 2b 789/511 618 onsite medical team military security community isolation centre c army battalion camp isolation centre 1 300/200 40 remote medical team in centre b military security community isolation centre d school isolation centre 1 320/320 79 remote medical team based in district hospital military security community isolation centre e school isolation centre 1 222/222 10 onsite military medical team military security quarantine centre a school post-discharge quarantine recovered 150/45 0 administrative staff quarantine centre b school post-discharge quarantine recovered 408/222 78 administrative staff wpsar vol 13, no 3, 2022 | doi: 10.5365/wpsar.2022.13.3.913 https://ojs.wpro.who.int/6 rahman et alnational isolation centre to national covid-19 hospital the different centres and the moh. these conferences were headed by the minister of health or executive-level officials, allowing for rapid decision-making. involvement of the other ministries made it possible for the use and conversion of other facilities into isolation centres, and enabled provision of security by the armed forces. centres where medical teams monitored patients remotely were under the control of the armed forces. therefore, good teamwork within and between the moh and other agencies was essential. similar to during the first wave, there was considerable goodwill from the public and organizations, with donations in the form of food and daily-use items for the staff and patients. our experience highlighted that even during ongoing major disease outbreaks, it is possible to restructure services to cater to the changing situations and needs of cases. the transition of the nic from an isolation and treatment centre to a covid-19 hospital was made possible through strong leadership and commitment of relevant stakeholders. discussion in any disease outbreak, it is important that the health-care system is prepared for the unexpected. a key lesson learned from the ongoing covid-19 pandemic is that preparedness is very important. even then, it is not always possible to predict whether preparations will be adequate to cope with demand. our experience highlighted this when the nic was almost overwhelmed, but this was averted by the opening of community isolation and quarantine centres so that asymptomatic or mild cases could be diverted away from the nic. this also enabled the nic to restructure and transition from an isolation centre to a covid-19 hospital to deal with the increasing numbers of more severe cases. our success was dependent on the system’s ability to rapidly adapt to changing situations. it also required strong leadership, stakeholder commitment, teamwork, and especially constant and open communication between all stakeholders. since the start of the second wave, daily online conferences were scheduled between table 3. list of medical services available before and during the covid-19 outbreak specialties before covid-19 changes during covid-19 description intensive care / high-dependency setting services not available 9 capable rooms 18 capable rooms increased capacity of icu and high-dependency bay 27 icu-capable rooms, 24 high-dependency beds nephrology services not available 2 capable rooms (2 dialysis points) increased dialysis capability increased to 16 dialysis points ob/gyn outpatient clinics only unused ob/gyn ward/labour room reopening of the ward with labour room 15 beds ot 2 ready for use for minor cases 1 unused and ready for use to operationalize ots 1: ob/gyn ward 2: for other cases operationalization of all ots picu and nicu services not available initially used nice isolation rooms as designated picu and nicu isolation rooms due to their highdependency readiness later relocated to be near the ob/gyn ward conversion of a ward near the ob/gyn ward surgery outpatient clinics day-case surgery remote consultant on-call team ready for acute surgical emergencies available junior surgeons team on-call from another hospital physiotherapy service visiting services that were stopped during covid-19 re-introduction of regular physiotherapy, especially chest physiotherapy team of physiotherapists 5 days a week nicu: neonatal intensive care unit; ob/gyn: obstetrics and gynaecology; ot: operating theatre; picu: paediatric intensive care unit. wpsar vol 13, no 3, 2022 | doi: 10.5365/wpsar.2022.13.3.913https://ojs.wpro.who.int/ 7 national isolation centre to national covid-19 hospitalrahman et al 4. da silva sjr, pena l. collapse of the public health system and the emergence of new variants during the second wave of the covid-19 pandemic in brazil. one health. 2021;13:100287. doi:10.1016/j. onehlt.2021.100287 pmid:34222607 5. mcmahon de, peters ga, ivers lc, freeman ee. global resource shortages during covid-19: bad news for low-income countries. plos negl trop dis. 2020;14(7):e0008412. doi:10.1371/journal. pntd.0008412 pmid:32628664 6. matsuo t, taki f, kobayashi d, jinta t, suzuki c, ayabe a, et al. health care worker burnout after the first wave of the coronavirus disease 2019 (covid-19) pandemic in japan. j occup health. 2021;63(1):e12247. doi:10.1002/1348-9585.12247 pmid:34375497 7. chong vh, wong j, abdullah ms, asli r, momin rn, ahmed sn, et al. covid-19 patients with negative results on initial screening: experience of brunei darussalam. western pac surveill response j. 2022;13(1):1–4. doi:10.5365/wpsar.2022.13.1.772 pmid:35355900 8. bashir a, abdullah ms, momin nr, chong pl, asli r, ivan bm, et al. prevalence of primary co-infections among patients with covid-19 in brunei darussalam. western pac surveill response j. 2021;12(3):65–70. doi:10.5365/wpsar.2021.12.3.856 pmid:34703637 9. clinical management of confirmed covid-19 case in adult and paediatric, annex 2e. putrajaya: ministry of health malaysia; 2021. available from: https://covid-19.moh.gov.my/garis-panduan/ garis-panduan-kkm/annex-2e-clinical-management-ofconfirmed-covid-19-25032022.pdf, accessed 10 september 2021. conflicts of interest the authors declare no conflicts of interest. ethics approval not required for this report. funding none. references 1. who coronavirus (covid-19) dashboard. geneva: world health organization; 2021. available from: https://covid19.who.int/, accessed 14 june 2022. 2. press release on the current situation of covid-19 infection in brunei darussalam. bandar seri begawan: ministry of health brunei darussalam; 2021. available from: http://www.moh.gov.bn/lists/ latest%20news/newdispform.aspx?id=943, accessed 15 july 2021. 3. coronavirus disease 2019 (covid-19): situation report, 72. geneva: world health organization; 2020. available from: https://apps.who. int/iris/handle/10665/331685, accessed 10 june 2021. https://ojs.wpro.who.int/ 1wpsar vol 13, no 1, 2022 | doi: 10.5365/wpsar.2022.13.1.843 original research g lobally, the pacific islands are largely considered to be among the regions most severely affected by noncommunicable diseases (ncds).1–5 in the pacific, ncds are fuelled by several behavioural risk factors, including substantial rates of tobacco use and problem alcohol drinking, and (especially) patterns of diet and physical activity that result in a high prevalence of obesity.6–9 in 2010, the pacific islands health officers association (pihoa), comprising the heads of health in the us-affiliated pacific islands (usapi) – american samoa, commonwealth of the northern mariana islands, guam, republic of palau, republic of the marshall islands, and four states of the federated states of micronesia (chuuk, kosrae, pohnpei and yap) – issued a regional declaration of health emergency for ncds. the declaration called for an intensified response, guided by data.10 shortly after the declaration, pihoa convened technical working groups to develop a framework for tracking the progress of the ncd emergency, and for monitoring the response to ncds and the impact of the declaration. with this effort, the usapi became the first international group to recognize and organize a systematic response to ncds. the surveillance framework includes the following indicators with standardized data definitions: youth and adult tobacco smoking and tobacco chewing; youth alcohol use and adult binge drinking; youth and adult overweight and obesity; adult diabetes and hypertension prevalence; and cause-specific death rates for cancer, cardiovascular disease, chronic lung disease and diabetes (unpublished document: usapi ncd core monitoring a pacific islands health officers association, honolulu, hi, united states of america. b tennessee department of health, nashville, tn, united states of america. published: 18 february 2022 doi: 10.5365/wpsar.2022.13.1.843 objective: to determine the effectiveness of the response to the 2010 declared regional noncommunicable diseases (ncds) emergency in nine us-affiliated pacific island jurisdictions. methods: vital statistics and risk prevalence surveys were retrospectively reviewed using 14 standardized ncd risk, prevalence and death rate indicators to measure changes in health status over time. ncd risk and prevalence change scores were derived from subsets of these indicators, and ncd composite death rates were examined. an ncd strength-ofintervention score derived from a standardized regional monitoring tool provided measures for assessing responses aimed at curbing risk factors, prevalence and death rates. associations between the strength-of-intervention score and changes in health status were examined. results: pairs of values were available for 97 of 126 individual comparisons for 14 core indicators in nine jurisdictions. the composite mean prevalence of all risk factors across the jurisdictions between baseline and follow-up (26.7% versus 24.3%, p=0.34) and the composite mean diabetes and hypertension prevalence (28.3% versus 28.2%, p=0.98) were unchanged, while ncd death rates increased (483.0 versus 521.9 per 100 000 per year, p<0.01). the composite strengthof-intervention score for the region was 37.2%. higher strength-of-intervention scores were associated with improvements in health indicators. discussion: despite some improvements in selected ncd indicators at the jurisdiction level, there was no significant overall change in the prevalence of risk factors, diabetes and hypertension, and death rates have continued to increase since the ncd emergency declaration. however, the adoption of public sector ncd interventions was associated with improvements in health indicators. progress and strength of response against non-communicable diseases in the us-affiliated pacific island jurisdictions, 2010-2021 a mark durand,a haley l casha and zoe durandb correspondence to a mark durand (email: durand@pihoa.org) wpsar vol 13, no 1, 2022 | doi: 10.5365/wpsar.2022.13.1.887 https://ojs.wpro.who.int/2 durand et alprogress against ncds in usapi, 2010-2021 in this report, we examine progress in the usapi jurisdictions by examining the change in health status indicators in the usapi framework in the 10 years since the emergency declaration. we also look at the strength of the response against ncds in the usapi (reflected as intervention scores derived from the mana dashboards from usapi jurisdictions) and examine the relationship between the strength of intervention and changes in population health status. methods in this study, risk, disease prevalence and death rates were collected for each usapi jurisdiction using historical sources dating back to 2000. sources included surveys from the who stepwise approach to ncd risk factor surveillance (steps); customized, pihoa-facilitated, community-based hybrid ncd adult surveys; us centers for disease control and prevention (cdc) behavioral risk factor surveillance system surveys; cdc youth risk behavior surveillance surveys; pihoa-facilitated, customized rapid high school youth surveys; the us national center for health statistics mortality databases in the three us territories (guam, the commonwealth of the northern mariana islands and american samoa); and jurisdiction vital statistics office databases for nonterritory usapi (the freely associated states of palau, marshall islands and the four states of the federated states of micronesia). convenience surveys were excluded. prevalence estimates were compared from surveys that used consistent sampling, collection methods and survey questions as set forth in the usapi ncd core surveillance framework and data dictionary. ncd premature mortality rates were 5-year running averages, for those aged 30–69 years, age-adjusted to the who 2000–2025 standard population.14 prevalence of overweight or obesity, diabetes and hypertension were reported only from studies that included physical measurements of height, weight, blood pressure and fasting blood sugars, omitting those that relied solely on self-reported disease status. the date of the pihoa emergency declaration, may 2010, was considered the reference date for baseline measures. for each jurisdiction, the earliest available data point between 2010 and 2013 was used as the baseline value for each indicator, whereas the most recent avail& surveillance framework. honolulu, hawaii: pacific islands health officers association; 2012. available on request). in contrast with infectious disease surveillance, which largely depends on tracking incident cases, ncd surveillance depends on conducting periodic, population-based surveys. these must have consistent survey questions, physical measurement methods, age groups and sampling across jurisdictions and over time. although difficult to deploy repeatedly and consistently, population-based surveys give a much clearer picture than institution-based incidence data of the burden of ncds in populations. the use of a predetermined, balanced set of risk, disease prevalence and death indicators across multiple jurisdictions for the past decade is a major strength of this surveillance system. the framework aligns closely with the subsequently released world health organization (who) monitoring framework, although the usapi framework measures not just the core indicators recommended by who but also youth risk factors.11 the usapi framework called for monitoring the uptake of a specific suite of ncd policy measures developed by a pacific-wide technical working group, the pacific monitoring alliance for ncd action (mana). the mana coordination team includes ncd policy experts from the pacific community (spc), who, pihoa and the pacific centre for prevention of obesity at fiji national university. indicator definitions and assessment criteria were developed, refined and piloted by the coordination team, and endorsed by the pacific heads of health and pacific health ministers groups in 2017, with the inaugural assessment report released in 2018. progress is tracked via annual country-based assessments and reported on a mana dashboard, which is updated every 1–3 years by each member jurisdiction, with assistance from mana technical partners. the mana dashboard comprises 31 ncd interventions covering six categories including preventive policies for tobacco, policies for alcohol, policies for food environments and physical activity, health services system changes, leadership and governance structures, and surveillance and monitoring systems.12,13 the use of predefined measures for both health status and response across multiple jurisdictions presents an opportunity to systematically examine progress in the fight against ncds. wpsar vol 13, no 1, 2022 | doi: 10.5365/wpsar.2022.13.1.887https://ojs.wpro.who.int/ 3 progress against ncds in usapi, 2010-2021durand et al tion score is the sum of the points for all intervention items across all nine jurisdictions divided by the number of points possible × 100%. the relation between strength-of-intervention and change in health status indicators was explored using linear regression, with the intervention score for each category of intervention (tobacco, alcohol, nutrition or physical activity, and health services) as the independent variable. the log of the relative change from baseline of the corresponding health status indicators (i.e. for tobacco, alcohol, overweight or obesity, and ncd death rates) was used as the dependent variable (with tobacco intervention items linked to tobacco indicators, alcohol items to alcohol indicators, nutrition or physical activity items linked to overweight and obesity indicators, and clinical health services linked to ncd death rates). for example, if baseline versus recent cigarette use prevalence is 50% versus 30%, the relative change is (0.30 – 0.50) / 0.50 = –0.40. the relationship between average intervention scores across all intervention categories (as the independent variable) and the log of the relative change of all health status indicators (as the dependent variable) was used to provide an overall picture of how well the nine jurisdictions were doing relative to one another. log transformation of the relative change in health status indicators was employed to address skewness of the outcome data (skewness value = 3.69 for relative change in health status indicators versus –0.41 for log transformed data). results risk factors and disease prevalence, and their changes from baseline varied considerably across jurisdictions (tables 1, 2). the ncd risk and disease prevalence change scores for each indicator category (95% ci) were as follows: alcohol –4.2% (–7.7, –0.7), tobacco –2.4% (–5.3, 0.0), overweight and obesity +1.5% (–4.5, +7.4), and diabetes and hypertension –0.4% (–5.1, +4.3). negative scores indicate improvement and positive scores worsening of health status over time. death rates also varied substantially across jurisdictions (table 3). composite premature ncd death rates (including deaths from cardiovascular disease, cancer, able data point from 2015 to the present was considered to represent “recent status”. if no baseline data point was available between 2010 and 2013, we used data from surveys conducted before 2010. a composite indicator (the ncd risk and disease prevalence change score) was calculated as the average change from baseline in the prevalence of all risk factors, diabetes and hypertension. in addition, category-specific change scores were produced by averaging the change in prevalence for all indicators within each of the following categories: tobacco, alcohol, nutrition and physical activity, and diabetes and hypertension. a composite ncd death rate indicator was calculated as the sum of death rates for cardiovascular disease, cancer, diabetes and chronic lung disease. these composite indicators were used to assess overall changes from baseline for each category, by jurisdiction and for the region as a whole (e.g. the average of all baseline tobacco use prevalence values for youth and adults across the region was compared with the average of values at follow-up, to assess overall tobacco trends). the scores were not adjusted for the differing population sizes of the jurisdictions; they represent the average of changes that each individual jurisdiction has managed to achieve, and do not measure the true changes in prevalence of the usapi population as a whole. only data points having both baseline and follow-up values were included in composite indicator calculations. confidence intervals (ci) for ncd risk and disease prevalence change score results were calculated using t-tests at a 95% confidence level. changes in death rates were assessed using z-scores. the strength of the ncd response was gauged using strength-of-intervention scores derived from the mana dashboard. each intervention item in the dashboard was awarded between 0 and 5 points, based on the strength of the intervention. intervention scores were calculated as the current percentage of maximum possible points awarded for a group of response items, and were stratified by intervention category and by jurisdiction. intervention scores range from 0% (no actions taken) to 100% (all recommended interventions are implemented). for example, the regional tobacco intervention score is the sum of the points for all tobacco items across all nine jurisdictions, divided by the number of points possible × 100%, whereas the overall intervenwpsar vol 13, no 1, 2022 | doi: 10.5365/wpsar.2022.13.1.887 https://ojs.wpro.who.int/4 durand et alprogress against ncds in usapi, 2010-2021 table 1. alcohol, tobacco and overweight and obesity prevalence data points for youth and adults for the us-affiliated pacific islands, 2010–2021 usapi alcohol consumption youth adult baseline % (n) recent % (n) change, % p baseline % (n) recent % (n) change, % p american samoa 22.8a (2577) 23.1b (1940) +0.3 0.81 27.9c (843) 13.0d (741) –14.9 < 0.01 cnmi 41.4e (2291) 23.3f (1621) –18.1 < 0.01 – 23.0g (1089) – – fsm chuuk 17.4h (943) 13.1i (1280) –4.3 < 0.01 10.9j (2034) 13.0k (2046) +2.1 0.04 kosrae 25.6l (551) 13.2m (479) –12.4 < 0.01 18.7n (412) 21.0o (599) +2.3 0.37 pohnpei 30.3p (2386) 37.3q (1726) +7.0 < 0.01 26.0r (2227) 26.1s (1139) +0.1 0.95 yap – 45.5t (699) – – 29.9u (4271) – – – guam 24.7v (1385) 18.2w (980) –6.5 < 0.01 18.3x (501) 17.9y (1534) –0.4 0.83 rmi 40.8z (1381) – – – – 15.4aa (2693) – – palau 43.4bb (875) 37.4cc (434) –6.0 0.04 – 27.3dd (1404) – – alcohol change score percentage (95% confidence interval) –4.2 (–7.7, –0.7) smoking tobacco youth adult baseline % (n) recent % (n) change, % p baseline % (n) recent % (n) change, % p american samoa 16.4a (2653) 21.7b (2091) +5.3 < 0.01 39.4c (2044) 23.9d (744) –15.5 < 0.01 cnmi 23.9e (2186) 12.4f (1808) –11.5 < 0.01 28.6ee (1429) 25.2g (1089) –3.4 0.06 fsm chuuk 19.3h (942) 17.4i (1284) –1.9 0.25 33.1j (2034) 32.3k (2046) –0.8 0.59 kosrae 27.8l (551) 25.6m (480) –2.2 0.26 20.4n (412) 18.7o (604) –1.7 0.50 pohnpei 21.7p (2386) 30.6q (1726) +8.9 < 0.1 29.2r (2227) 21.3s (1134) –7.9 < 0.01 yap – 39.0t (699) – – 18.3u (4274) – – – guam 21.9v (1460) 13.3w (1079) –8.6 < 0.01 30.5x (501) 21.9y (1561) –8.6 < 0.01 rmi 31.7z (1381) 30.7ff (2056) –1.0 0.53 24.6gg (2998) 23.3aa (2677) –1.3 0.01 palau 47.0bb (869) 46.8cc (427) –0.2 0.95 16.7hh (2184) 16.6dd (1404) –0.1 0.94 chewing tobacco youth adult baseline % (n) recent % (n) change, % p baseline % (n) recent % (n) change, % p american samoa 6.1a (2653) – – – – – – – cnmi 35.2e (2186) 15.2f (1857) –20.0 < 0.01 21.2ee (1429) 16.7g (1089) –4.5 < 0.01 fsm chuuk 24.8h (947) 19.2i (1278) –5.6 < 0.01 22.5j (2034) 15.3k (2047) –7.2 < 0.01 kosrae 30.8l (550) 27.6m (480) –3.2 0.26 25.7n (412) 28.5o (601) +2.8 0.32 pohnpei 21.2p (2386) 22.4q (1726) +1.2 0.36 26.1r (2227) 48.3s (1121) +22.2 < 0.01 yap – 60.7t (699) – – 83.3u (3543) – – – guam 14.0v (1460) 13.5w (1181) –0.5 0.71 8.5x (501) 4.6y (1562) –3.9 < 0.01 rmi 31.1z (1381) 37.4ff (2056) +6.3 < 0.01 – 22.8aa (2390) – – palau 32.5bb (869) 27.7cc (560) –4.8 0.05 48.8hh (2184) 45.8dd (1404) –3.0 0.08 tobacco change score percentage (95% confidence interval) –2.4 (–5.3, 0.0) wpsar vol 13, no 1, 2022 | doi: 10.5365/wpsar.2022.13.1.887https://ojs.wpro.who.int/ 5 progress against ncds in usapi, 2010-2021durand et al table 2. diabetes and hypertension prevalence data points for adults for the us-affiliated pacific islands, 2010–2021 change scores represent the average per jurisdiction change from baseline of risk factors for alcohol, tobacco and overweight and obesity. they are not adjusted for differing population sizes and are not an estimate of prevalence changes in the usapi population as a whole. average values do not include missing values and their pairs (e.g. yap baseline and recent youth drinking, american samoa baseline and recent youth chewing tobacco, and marshall islands baseline and recent overweight and obesity). cnmi: commonwealth of the northern mariana islands; fsm: federated states of micronesia; rmi: republic of the marshall islands; usapi: us-affiliated pacific islands. see additional notes following table 3. overweight and obesity youth adult baseline % (n) recent % (n) change, % p baseline % (n) recent % (n) change, % p american samoa – – – – 93.1c (1995) 94.7d (699) +1.6 0.14 cnmi – – – – – 63.9g (1032) – – fsm chuuk 46.8h (957) 44.6i (1283) –2.2 0.30 67.8j (2034) 63.1k (1332) –4.7 < 0.01 kosrae 36.9l (529) 36.3m (479) –0.6 0.84 – 52.6o (576) – – pohnpei 27.4p (2386) 42.4q (1720) +15.0 < 0.01 59.9r (2227) 80.4s (1130) +20.5 < 0.01 yap 29.8u (610) 33.4t (699) +3.6 0.16 70.7u (4191) – – guam 43.0ii (6434) 45.0jj (7706) +2.0 0.02 – – – – rmi – 26.5ff (2056) – – 68.5gg (1610) 72.8aa (2570) +4.3 < 0.01 palau 65.0bb 44.7cc –20.3 < 0.01 75.7hh (2133) 72.5dd (1143) –3.2 0.04 overweight and obesity change score percentage (95% confidence interval) +1.5 (–4.5, +7.4) usapi adult diabetes prevalence baseline % (n) recent % (n) change, % p american samoa 47.3kk (342) 45.4 (746) –1.9 0.55 cnmi – – – – fsm chuuk 35.4j (2034) – – – kosrae – 29.4o (603) – – pohnpei 24.7r (2227) 23.5s (1146) –1.2 0.44 yap – – – – guam – – – – rmi 20.7gg (878) 25.3aa (2559) +4.6 < 0.01 palau 20.6hh (1895) 22.2dd (1335) +1.6 0.27 adult hypertension prevalence baseline % (n) recent % (n) change, % p american samoa 34.2c (2050) 39.7d (725) +5.5 0.01 cnmi – 56.0q (1063) – – fsm chuuk 11.9j (2034) 12.4k (1357) +0.5 0.66 kosrae – 27.0o (610) – – pohnpei 22.9r (2227) 21.6s (1143) –1.3 0.39 yap 30.9u (4285) – – – guam – – – – rmi 11.6gg (1670) 19.2aa (2657) +7.6 < 0.01 palau 51.6hh (2173) 33.0dd (1377) –18.6 < 0.01 diabetes and hypertension change score percentage (95% confidence interval) –0.4 (–5.1, +4.3) change scores represent the average per jurisdiction change from baseline of diabetes and hypertension prevalence. they are not adjusted for differing population sizes and are not an estimate of prevalence changes in the usapi population as a whole. average values do not include missing values and their pairs. cnmi: commonwealth of the northern mariana islands; fsm: federated states of micronesia; rmi: republic of the marshall islands; usapi: us-affiliated pacific islands. see additional notes following table 3. wpsar vol 13, no 1, 2022 | doi: 10.5365/wpsar.2022.13.1.887 https://ojs.wpro.who.int/6 durand et alprogress against ncds in usapi, 2010-2021 table 3. noncommunicable disease premature death rates for the us-affiliated pacific islands, 2010–2021mm 37.2%. there was considerable variation in the strength of intervention by category, from 24.9% for nutrition or physical activity to 48.1% for tobacco. the average composite strength-of-intervention score across intervention categories by jurisdiction also varied considerably, from 25.0% for the republic of the marshall islands to 54.8% in guam. log linear regression showed an overall negative relationship between response scores and the log diabetes and chronic lung disease) for the region as a whole increased from a baseline of 483.0 to 521.9 per 100 000 residents aged 30–69 years (p < 0.01). baseline versus recent death rates table 4 shows mana intervention scores for tobacco, alcohol, overweight or obesity, and health services intervention categories by jurisdiction. the average overall ncd strength-of-intervention score for the region was american samoa cnmi fsm chuuk kosrae pohnpei yap guam rmi palau all usapi diabetes baseline recent p 107.4nn 100.4oo 0.64 48.8nn 41.4oo 0.35 162.0pp 193.2oo 0.14 364.1pp 327.6oo 0.64 172.0pp 186.0oo 0.55 76.0pp 82.2qq 0.81 39.9nn 36.0oo 0.39 428.0rr 404.0qq 0.42 94.0ss 65.2oo 0.13 381.6 368.4 0.42 cardiovascular disease baseline recent p 243.4nn 237.0oo 0.76 164.1nn 146.8oo 0.24 216.6pp 252.6oo 0.14 292.0pp 335.4oo 0.56 251.0pp 338.0oo < 0.01 140.2pp 159.2qq 0.59 223.1nn 243.3oo 0.07 139.0rr 211.0qq < 0.01 266.0ss 274.5oo 0.80 717.3 791.4 < 0.01 cancer baseline recent p 110.7nn 118.6oo 0.59 93.3nn 101.3oo 0.49 78.6pp 198.2oo < 0.01 170.8pp 153.7oo 0.75 127.0pp 135.2oo 0.68 306.5pp 283.0qq 0.64 111.1nn 134.3oo < 0.01 121.0rr 129.9qq 0.59 233.0ss 204.7oo 0.36 406.8 476.3 < 0.01 chronic lung disease baseline recent p 22.8nn 20.6oo 0.73 33.4nn 7.0oo 0.69 23.8pp 18.2oo 0.45 32.0pp 45.1oo 0.62 72.0pp 65.7oo 0.66 60.4pp 15.0qq 0.01 15.7nn 9.7oo 0.02 11.0rr 17.0qq 0.27 29.0ss 32.8oo 0.85 86.7 59.9 < 0.01 total baseline recent p 484.3nn 476.6oo 0.68 339.6nn 296.5oo < 0.01 481.0pp 662.2oo < 0.01 858.9pp 861.8oo 0.97 622.0pp 724.9oo < 0.01 583.1pp 539.4qq 0.32 389.8nn 423.3oo < 0.01 699.0rr 761.0qq < 0.01 622.0ss 577.2oo 0.23 483.0 521.9 < 0.01 cnmi: commonwealth of the northern mariana islands; fsm: federated states of micronesia; rmi: republic of the marshall islands; usapi: us-affiliated pacific islands. notes for tables 1–3: a 2011 american samoa youth risk behavior survey (high school, grades 9–12) b 2015 american samoa youth risk behavior survey (high school, grades 9–12) c 2004 american samoa ncd steps survey (25–64 years) d 2018 american samoa hybrid ncd survey (25–64 years) e 2011 cnmi youth risk behavior survey (high school, grades 9–12) f 2017 cnmi youth risk behavior survey (high school, grades 9–12) g 2016 cnmi hybrid ncd survey (≥18 years) h 2017 chuuk rapid youth survey (high school, grades 9–12) i 2019 chuuk rapid youth survey (high school, grades 9–12) j 2006 chuuk behavioral risk factor surveillance system survey (18–64 years) k 2016 chuuk ncd steps survey (18–64 years) l 2015 kosrae rapid youth survey (high school, grades 9–12) m 2019 kosrae rapid youth survey (high school, grades 9–12) n 2012 kosrae behavioral risk factor surveillance survey (≥18 years) o 2019 kosrae hybrid ncd survey (≥18 years) p 2015 pohnpei rapid youth survey (high school, grades 9–12) q 2017 pohnpei rapid youth survey (high school, grades 9–12) r 2008 pohnpei ncd steps survey, as reported in pohnpei state department of health year 2015 ncd profile (25–64 years) s 2019 pohnpei hybrid ncd survey (≥18 years, but values in table were for adults 25–64 years only) t 2016 yap rapid youth survey (high school, grades 9–12) u 2013 yap community health assessment survey (youth items 15–18 years; adult items ≥18 years) v 2011 guam youth risk behavior survey (high school, grades 9–12) w 2017 guam youth risk behavior survey (high school, grades 9–12) x 2011 guam behavioral risk factor surveillance survey (≥18 years) y 2017 guam behavioral risk factor surveillance survey (≥18 years) z 2011 rmi youth risk behavior survey (high school, grades 9–12) aa 2018 rmi hybrid ncd survey (18–64 years) bb 2011 palau youth risk behavior survey (high school, grades 9–12) cc 2015 palau youth risk behavior survey (high school, grades 9–12) dd 2017 palau hybrid ncd survey (25–64 years) ee 2011 cnmi behavioral health survey (≥18 years) ff 2016 rmi joint global youth tobacco & rapid youth survey (high school, grades 9–12) gg 2002 rmi ncd steps survey (18–64 years) hh 2012 palau ncd steps survey (25–64 years) ii 2015 guam school bmi survey (results from grades 9–12 presented) jj 2019 guam school bmi survey (results from grades 9–12 presented) kk 2004 american samoa ncd steps survey (25–64 years; cut off for diabetes set at ≥110 mg/dl) ll 2018 american samoa hybrid ncd survey (25–64 years; cut off for diabetes set at ≥110 mg/dl) mm death rates – per 100 000 residents per year – are for those aged 30–69 years, age-adjusted (to the who 2000–2025 standard population) five-year running averages. usapi totals are weighted by the population size of those aged 30–69 years for each jurisdiction nn running average, 2006–2010 oo running average, 2013–2017 pp running average, 2007–2011 qq running average, 2014–2018 rr running average, 2011–2015 ss running average, 2008–2012 wpsar vol 13, no 1, 2022 | doi: 10.5365/wpsar.2022.13.1.887https://ojs.wpro.who.int/ 7 progress against ncds in usapi, 2010-2021durand et al table 4. strength of noncommunicable disease interventions in the usapi, 2020 r es p on se ca te go ry interventions a m er ic an s am oa c n m i c h u u k (f s m ) k os ra e (f s m ) p oh n p ei ( f s m ) ya p ( f s m ) g u am r m i p al au to ta l p oi n ts p oi n ts p os si b le in te rv en tio n sc or e by c at eg or y (% ) to ba cc o tobacco excise taxes 4 4 3 3 3 3 3 1 5 29 45 48.1 smoke-free environments 5 4 1 4 5 1 5 4 4 33 45 tobacco health warnings 0 2 1 1 1 1 3 2 0 11 45 tobacco advertising, promotion and sponsorship 2 1 1 4 5 1 2 4 5 25 45 tobacco sales and licensing 5 5 0 3 1 0 4 0 5 23 45 tobacco industry interference 0 0 1 1 1 1 0 0 0 4 45 enforcement of laws and regulations related to tobacco 1 3 2 2 2 2 3 0 1 18 27 a lc oh ol alcohol licensing to restrict sales 5 5 3 3 4 3 5 4 5 37 45 46.4 restrict alcohol advertising 0 0 0 0 5 0 2 0 0 7 45 alcohol taxation 2 2 2 2 2 2 2 1 2 17 45 drinking and driving penalties 3 3 2 2 2 2 4 3 4 25 45 enforcement of laws and regulations related to alcohol 1 3 0 0 0 0 3 0 1 10 27 n ut ri ti on & p h ys ic al a ct iv it y reducing salt consumption 0 1 5 0 1 5 4 0 3 19 45 24.9 eliminating trans-fats 1 1 0 0 0 0 1 1 1 5 45 restricting unhealthy food marketing to children 1 0 0 0 1 0 1 0 1 4 45 food fiscal policies 0 0 3 2 3 3 0 3 0 14 45 healthy food policies in schools 4 2 0 1 1 0 5 1 1 15 45 food-based dietary guidelines 1 1 2 2 2 2 4 3 1 18 45 restrict marketing of breast milk substitutes 0 0 0 0 0 0 0 0 5 5 45 baby-friendly hospitals 2 1 2 0 3 2 0 1 1 12 45 maternity leave and breastfeeding 0 1 1 1 0 1 1 0 1 6 45 compulsory physical education in school curriculum 5 1 1 0 1 1 3 0 1 13 45 enforcement of laws and regulations related to nutrition & physical activity 1 3 0 0 0 0 3 0 1 8 27 h ea lt h se rv ic es national guidelines for care of main ncds 4 1 2 1 1 2 4 2 0 17 45 47.4essential drugs 2 5 2 4 4 2 2 1 0 22 45 smoking cessation availability 3 4 3 2 3 3 4 0 3 25 45 total points 50 53 37 38 51 37 68 31 51 422 1116 points possible 124 124 124 124 124 124 124 124 124 1116 intervention score by jurisdiction (%) 40.3 42.7 29.8 30.6 41.1 29.8 54.8 25.0 41.1 average intervention score = 37.2% cnmi: commonwealth of the northern mariana islands; fsm: federated states of micronesia; ncd: noncommunicable disease; rmi: republic of the marshall islands; usapi: us-affiliated pacific islands. strength of intervention: not present = 0 points; under development = 1 point; present but low strength = 2 points; present with medium strength = 3 points; present with higher strength = 4 points; present with highest strength = 5 points. response scores are calculated as number of points awarded in the category, divided by the total points possible × 100%. notes: the original mana dashboard has 31 indicators grouped into categories for governance, monitoring systems, health service systems, tobacco, alcohol, nutrition and physical activity. for this report, we omitted indicators for governance and monitoring systems, and used the remaining 26 that corresponded directly to intervention categories that match groups of health status indicators in the usapi ncd monitoring & surveillance framework (i.e. mana tobacco items for tobacco indicators; alcohol items for alcohol indicators; physical activity and nutrition items for overweight and obesity indicators; and health service items for death rates – since health services are deemed to have the greatest potential impact on ncd death rates in the short-to-medium term). responses for the ncd interventions in the mana dashboard are graded using a “traffic light” rating scheme: red denotes that no policy or action has been taken; amber denotes that policy or action is under development; and green denotes that policy or action is in place. when a policy or action is in place, the strength of the actions is assessed using a star system (0–3 stars).12 for the purposes of this report, the traffic light codes for each intervention were assigned a numerical point score ranging from 0 to 5, with 5 points indicating the strongest response for that intervention. in the mana dashboard, enforcement of laws and policies related to nutrition, alcohol and tobacco are included as a single item (with higher scores awarded for enforcement of more than one substance). in the present report, enforcement was split into three items: tobacco, alcohol, and nutrition law and policies enforcement. these items were graded on a scale of 0–3: 0 = no enforcement provisions; 1 = enforcement regime under development; 2 = compliance monitoring in place with annual summary reports issued; and 3 = compliance monitoring in place with annual summary reports and evidence of fines or other sanctions given to violators. wpsar vol 13, no 1, 2022 | doi: 10.5365/wpsar.2022.13.1.887 https://ojs.wpro.who.int/8 durand et alprogress against ncds in usapi, 2010-2021 our conclusions are subject to several limitations. first, various data points for either baseline or recent core health status indicators were not available for some jurisdictions. timely, routine surveillance activities (youth school-based surveys, adult community-based surveys and analysis of vital statistics data) based on jurisdiction-level ncd monitoring and surveillance plans are needed to fill these gaps and provide a more complete picture of the ongoing ncd emergency. second, although we would have liked to use 2010 baseline values and recent data points for each indicator, the collection years and time span between the baseline and recent data points vary among indicators and jurisdictions, introducing some uncertainty in assessing progress. deficiencies in the completeness and accuracy of mortality reporting that have been observed in the region may also have affected our findings, while out-migration from several of the jurisdictions since censuses were last conducted (between 2010 and 2015) may also have affected mortality rate estimates.17 in addition, it would be useful to track the exact dates of initiation of interventions. however, some interventions (e.g. tobacco and alcohol tax increases) are introduced in phases and implementation times for others are unclear. finally, the numerical scoring of ordinal values used in the ncd intervention scores may compromise precision in these measures (since the expected impact from each additional point within an intervention and the expected impact of each point from one intervention to the next may not be constant). in summary, declaring a regional emergency for ncds in usapi has stimulated the development of standardized frameworks for ncd surveillance and response. although surveillance for ncds is challenging and additional investments are needed to address gaps and assure rigorous conduct of surveys, existing data do yield a detailed picture of progress over the past 10 years. some progress has been made towards better control of alcohol and tobacco, but there is little change in other measures of health. the evidence supports the effectiveness of policy and health system interventions in the context of the pacific islands; however, many of the recommended ncd interventions have not been adopted, especially in the most affected areas (geographical and risk factors). a renewed commitment to adopt these measures is needed to decisively turn the tide of ncds in the region. of relative changes in health status indicators, with an r2 of 0.063 and regression line slope of –0.0024 (p = 0.01) (fig. 1). this suggests an average improvement in related health status indicators of 2.7% for every 10% increase in the corresponding response index. log linear regression also showed a negative relationship between average response scores by jurisdiction and the log of relative changes in health status indicators by jurisdiction (regression line slope = –0.0044; p = 0.02) (fig. 2). discussion through collective action, usapi countries and territories have defined a consensus set of core ncd response measures and health status indicators, permitting a concerted approach to addressing the ncd crisis and to monitoring progress in the region. this study shows that, since the ncd emergency declaration in 2010, there was no change in the composite mean prevalence of all risk factors across the usapi jurisdictions between baseline and follow-up and the composite mean diabetes and hypertension prevalence, whereas ncd death rates significantly increased. there were some improvements in the prevalence of alcohol and tobacco use, and increases in obesity prevalence and ncd death rates. given these results, it will be difficult to meet the united nations sustainable development goal 3.4: “by 2030, reduce by one third premature mortality from non-communicable diseases”.15 ncd prevalence and death rates are largely the result of longstanding behaviours and they change relatively slowly in response to policy measures (although improvements in health services can improve death rates more rapidly). in contrast, risk factor prevalence changes more rapidly in response to effective policy measures; thus, the decline in some risk factors could presage future improvements in disease prevalence and mortality as their benefits accrue over time. the only jurisdiction to show a decrease in ncd death rates, the northern mariana islands, has one of the highest intervention scores. across all jurisdictions, the strength of response score was 43%, indicating that many evidence-based interventions have not yet been implemented; most of these interventions are the province of policy-makers outside the health sector. as noted by others, strengthened multisectoral commitment is therefore a key to success.16 wpsar vol 13, no 1, 2022 | doi: 10.5365/wpsar.2022.13.1.887https://ojs.wpro.who.int/ 9 progress against ncds in usapi, 2010-2021durand et al fig. 1. noncommunicable disease intervention scores versus change in corresponding health indicators, us-affiliated pacific islands, 2010–2020 ‐0.5 ‐0.4 ‐0.3 ‐0.2 ‐0.1 0.0 0.1 0.2 0.3 0.4 0.5 0 10 20 30 40 50 60 70 80 lo g r el at iv e ch an ge response score ncd response scores vs. change in corresponding health indicators, usapi, 2010‐ 2020 log relative change predicted log relative change data points are the log of the relative changes in health indicators versus corresponding composite intervention indicators at the jurisdiction level (i.e. each tobacco indicator versus the jurisdiction’s tobacco intervention score, alcohol indicators versus the jurisdiction’s alcohol intervention score, etc.). data points are the overall intervention indicator for each jurisdiction versus the log of the average of relative changes for all measured health indicators. as: american samoa; cnmi: commonwealth of the northern mariana islands; rmi: republic of the marshall islands. fig. 2. composite jurisdiction noncommunicable disease intervention scores versus relative change in health indicators, us-affiliated pacific islands, 2010–2020 -0.5 -0.4 -0.3 -0.2 -0.1 0.0 0.1 0.2 0.3 0.4 0.5 10 20 30 40 50 60 70 lo g re la � ve c ha ng e response score log rela�ve change predicted log rela�ve change rmi yap pohnpei chuuk kosrae palau cnmi as guam wpsar vol 13, no 1, 2022 | doi: 10.5365/wpsar.2022.13.1.887 https://ojs.wpro.who.int/10 durand et alprogress against ncds in usapi, 2010-2021 4. gani a. some aspects of communicable and non-communicable diseases in pacific island countries. soc indic res. 2009 apr;91(2):171–87. doi:10.1007/s11205–008–9276-x 5. abraham d, cash hl, durand am, denholm j, moadsiri a, gopalani sv, et al. high prevalence of non-communicable disease risk factors among adolescents in pohnpei, micronesia. hawaii j med public health. 2018 nov;77(11):283–8. pmid:30416871 6. hawley nl, mcgarvey st. obesity and diabetes in pacific islanders: the current burden and the need for urgent action. curr diab rep. 2015 may;15(5):29. doi:10.1007/s11892–015–0594–5 pmid:25809458 7. hughes rg, lawrence ma. globalization, food and health in pacific island countries. asia pac j clin nutr. 2005;14(4):298–306. pmid:16326635 8. curtis m. the obesity epidemic in the pacific islands. j dev soc transform. 2004;1:37−42. 9. global database on body mass index: bmi classification. geneva: world health organization; 2006. available from: http://www. assessmentpsychology.com/icbmi.htm, accessed 6 december 2021. 10. declaring a regional state of health emergency due to the epidemic of non-communicable diseases in the united states-affiliated pacific islands. resolution #48–01. honolulu, hawaii: pacific island health officers association; 2010. available from: https://www. pihoa.org/wp-content/uploads/2019/08/ncd-emergency-declaration-48-01.pdf, accessed 6 december 2021. 11. ncd global monitoring framework. geneva: world health organization; 2021. available from: https://www.who.int/teams/ ncds/surveillance/monitoring-capacity/gmf, accessed 5 june 2020. 12. tolley h, snowdon w, wate j, durand am, vivili p, mccool j, et al. monitoring and accountability for the pacific response to the non-communicable diseases crisis. bmc public health. 2016 sep;16(1):958. doi:10.1186/s12889–016–3614–8 pmid:27613495 13. pacific monitoring alliance for non-communicable diseases action (mana) data dictionary. suva, fiji: the pacific community; 2015. available from: https://static-content.springer.com/ esm/art%3a10.1186%2fs12889– 020 – 08795 –2/mediaobjects/12889_2020_8795_moesm1_esm.pdf, accessed 2 july 2020. 14. ahmad ob, boschi-pinto c, lopez ad, murray cjl, lozano r, inoue m. age standardization of rates: a new who standard. gpe discussion papers series: no. 31. 2001. world health organization. 15. united nations general assembly. transforming our world: the 2030 agenda for sustainable development. new york city: united nations; 2015. available from: https://www.un.org/ga/search/ view_doc.asp?symbol=a/res/70/1&lang=e, accessed 14 september 2021. 16. the lancet. saving the pacific islands from extinction. lancet. 2019 aug;394(10196):359. doi:10.1016/s0140–6736(19)31722–2 pmid:31379320 17. hosey g, ichiho h, satterfield d, dankwa-mullan i, kuartei s, rhee k, et al. chronic disease surveillance systems within the us associated pacific island jurisdictions. prev chronic dis. 2011 jul;8(4):a86. pmid:21672410 public health implications agreement across countries and territories on a core set of predefined ncd-related response measures and health status indicators enables a systematic approach to monitoring the response to the ncd crisis and resulting changes in population health status. the provision of such high-quality feedback is useful for strategic planning and evaluation for public health practitioners, technical assistance agencies and policy-makers. the discrete groupings and modest population sizes within multiple jurisdictions and the ability to track the impact of interventions make the usapi an attractive setting for testing innovative approaches to the ncd crisis. conflicts of interest none of the authors has a conflict of interest wherein any author, our institutions or wpsar reviewers or editors have financial or personal relationships that might influence (bias) their actions. ethics statement the work and results reported in this paper were a product of routine surveillance activities. no information identifiable to specific people is included. ethics committee approval was not necessary. funding this work and the surveillance activities reported herein were funded by the us centers for disease control and prevention, project #cdc-rfa-dp19–1901: “prevention and control of chronic disease and associated risk factors in the us-affiliated pacific islands, us virgin islands, and puerto rico”. references 1. lower t, nauan b, abel m, ake m, puloka v, tiban k. curbing the tide – non-communicable disease in the pacific. pacific health surveillance and response 2005; 12(2):61–4. pmid:18181495 2. snowdon w. challenges of noncommunicable diseases in the pacific islands: the need for evidence and data. asia pac j public health. 2011 jan;23(1):110–1. doi:10.1177/1010539510390667 pmid:21169604 3. tuitama lt, young-soo s, clark h, tukuitonga c, beaglehole r. acting on the pacific crisis in non-communicable diseases. lancet. 2014 nov 22;384(9957):1823–4. doi:10.1016/s0140– 6736(14)61824–9 pmid:25457906 https://ojs.wpro.who.int/ 1wpsar vol 12, no 4, 2021 | doi: 10.5365/wpsar.2021.12.4.884 covid-19: lesson from the field problem on 19 march 2020, 2671 passengers and 1146 crew disembarked from a cruise ship after a 12-day international cruise that began and ended in sydney, australia; they then travelled on to other destinations.1 two thirds of the passengers were australian; of these, 40% were subsequently diagnosed with coronavirus disease 2019 (covid-19), including 18 who were diagnosed after returning to tasmania, an island to the south of mainland australia with a population of 528 000. two of these tasmanian cases were admitted to a regional public hospital on the northwest coast (hospital 1) for management of their illness. both were later identified as index cases of an outbreak that ultimately affected another 138 people comprising health-care workers (hcws), patients and other close contacts. the outbreak led to the closure of hospital 1; it also affected staff and patients at the co-located private hospital (hospital 2), a smaller public hospital 56 km away (hospital 3) and a residential agedcare facility 48 km away (fig. 1). here we describe the outbreak, possible transmission and lessons learnt from this early outbreak in australia. context the tasmanian outbreak was the first large covid-19 outbreak to occur in australia within a health-care setting that demonstrated ongoing transmission between hcws. tasmania’s initial covid-19 case was notified on a public health services, department of health, tasmania, australia. b menzies institute for medical research, university of tasmania, tasmania, australia. c tasmanian health service, department of health, tasmania, australia. d department of health, victoria, australia. e school of medicine, university of tasmania, tasmania, australia. published: 22 december 2021 doi: 10.5365/wpsar.2021.12.4.884 problem: one month after the initial case of coronavirus disease 2019 (covid-19) in tasmania, an island state of australia, two health-care workers (hcws) from a single regional hospital were notified to public health authorities following positive tests for sars-cov-2 nucleic acid. these were the first recognized cases in an outbreak that overwhelmed the hospital’s ability to function. context: the outbreak originated from two index cases. both had returned to tasmania following travel on a cruise ship and required hospital admission for management of covid-19. a total of 138 cases were subsequently linked to this outbreak: 81 hcws (most being nurses) and 23 patients across three hospitals, one resident of an aged-care facility and 33 close contacts. action: the outbreak was controlled through the identification and isolation of cases, identification and quarantining of close contacts and their household members, closure of the affected facilities and community-level restrictions to reduce social mixing in the affected region. lessons learnt: factors that were likely to have contributed to ongoing transmission in this setting included workplace practices that prevented adequate physical distancing, attending work while symptomatic, challenges in rapidly identifying contacts, mobility of staff and patients between facilities, and challenges in the implementation of infection control practices. discussion: many commonly accepted hospital practices before the covid-19 pandemic amplified the outbreak. the lessons learnt from this investigation changed work practices for hcws and led to wider public health interventions in the management of potential primary and secondary contacts. lessons learnt from the first large outbreak of covid-19 in health-care settings in tasmania, australia fay h johnston,a,b tara anderson,c michelle harlock,a natasha castree,a,d louise parry,c therese marfori,a,b michelle mcpherson,a,e mark veitch,a kylie j smitha,b and nicola stephensa,e correspondence to fay h johnston (email: fay.johnston@health.tas.gov.au) wpsar vol 12, no 4, 2021 | doi: 10.5365/wpsar.2021.12.4.884 https://ojs.wpro.who.int/2 johnston et ala covid-19 outbreak in tasmanian health-care settings hospital 1 to estimate attack rates among clinical occupational groups. the two index cases were admitted to the medical ward of hospital 1 for the management of covid-19 on 20 and 26 march 2020. their respective dates of diagnosis and notification to the department of health were 19 and 26 march. the two initial cases in hcws were notified on 3 april 2020, with a third hcw case notified the following day. all three hcw cases worked on the medical ward of hospital 1, although none provided direct care to the two index patients. thereafter, daily covid-19 case numbers increased rapidly for 10 days before declining (fig. 2). a total of 138 cases and 10 deaths were linked to the outbreak. of the cases, 81 were hcws, 23 were patients across the three hospitals, one was a resident of the aged-care facility and 33 were close contacts. the close contact cases included a small community cluster of six cases initiated from a discharged patient. the age and sex distributions of cases are shown in table 1. cases among hcws of the 81 cases among hcws, 72 (89%) worked within hospital 1, some of whom also worked at other facilities during the outbreak period, and 49 (60%) were nurses. 2 march 2020, and there was no community transmission in tasmania at that time. hcws are at risk of acquiring covid-19 infection from their patients and of subsequently instigating or amplifying outbreaks within the health-care setting.2,3 in recognition of the anticipated increased risk posed by the pandemic, hospitals in tasmania had strengthened infection prevention and control procedures even though, before this outbreak, only nine patients with covid-19 had been managed in a hospital in tasmania. description of outbreak outbreak cases were defined in accordance with australian national guidelines4 as persons with laboratory confirmation of covid-19 by nucleic acid testing from a deep nasopharyngeal swab, with onset of illness on or after 19 march 2020, who had a direct or indirect epidemiological link to any of the three health-care facilities (hospitals 1–3) in the northwest region of tasmania. all laboratory-confirmed cases were notified to public health services (phs), tasmanian department of health, for public health response, as required by legislation. cases were contacted to collect information about age, sex, occupation and risk factors for acquisition of infection, and to identify close contacts, as defined by the national guidelines.4 employment records were used to determine the number of staff by occupational group at fig. 1. map of australia showing tasmania (inset) and the northern coast of tasmania showing the locations of the health-care facilities involved in the outbreak burnie latrobe devonport hospitals 1 and 2 aged-care facility hospital 3 australia tasmania papua new guinea indonesia great australian bight coral sea arafura sea banda sea wpsar vol 12, no 4, 2021 | doi: 10.5365/wpsar.2021.12.4.884https://ojs.wpro.who.int/ 3 a covid-19 outbreak in tasmanian health-care settingsjohnston et al fig. 2. epidemic curve of covid-19 cases associated with the northwest outbreak in tasmania, australia, march to may 2020 table 1. age and sex distribution of cases by group, hospitalization and death 0 2 4 6 8 10 12 14 16 10 -m ar 12 -m ar 14 -m ar 16 -m ar 18 -m ar 20 -m ar 22 -m ar 24 -m ar 26 -m ar 28 -m ar 30 -m ar 01 -a p r 03 -a p r 05 -a p r 07 -a p r 09 -a p r 11 -a p r 13 -a p r 15 -a p r 17 -a p r 19 -a p r 21 -a p r 23 -a p r 25 -a p r 27 -a p r 29 -a p r 01 -m ay 03 -m ay 05 -m ay 07 -m ay 09 -m ay mar apr may n u m b er o f ca se s date of symptom onset index cases hcws patients other 7 april – quarantine of all discharged patients who had been admitted to hospital 1 on or after 27 march 11 april – quarantine of hcws from the medical and surgical wards of hospital 1; additional sta� support provided from hospital 2 13 april – closure of hospitals 1 and 2 and all co-located facilities; quarantine of all hcws and their household contacts from these facilities 6 april – hospital closed to visitors 5 april – medical ward closed to new admissions 4 april – enhanced environmental cleaning and mandatory use of face masks by hcws 3 april – first noti�cations of cases in hcws to public health hcw: health-care worker (all hcws including medical, nursing, allied health, administration, technical support and catering staff); patients: people who acquired the illness while staying in one of the health-care facilities; other: all other linked cases, mostly household contacts of hcws. a includes people being treated in hospital or residents in an aged-care facility. b includes household and other close contacts of people with covid-19 infection. c includes people who acquired the illness as inpatients and those who acquired the illness out of hospital but required admission for treatment of covid-19. all health-care workers patientsa otherb hospital casesc deaths total 138 81 24 33 29 10 sex female 85 61 7 17 12 5 male 53 20 17 16 17 5 age group (years) 0–19 6 – – 6 – – 20–49 67 52 1 14 2 – 50–69 41 28 5 8 9 – 70+ 24 1 18 5 18 10 wpsar vol 12, no 4, 2021 | doi: 10.5365/wpsar.2021.12.4.884 https://ojs.wpro.who.int/4 johnston et ala covid-19 outbreak in tasmanian health-care settings action a description of the management of the outbreak has been published elsewhere,5 and key elements are summarized here. following the initial notifications, emergency response teams were established at hospital 1 to identify and quarantine close contacts of cases and manage the outbreak consequences in the hospital. concurrently, the public health emergency operations centre (pheoc) increased its workforce of contact-tracing personnel, public health nursing and medical staff, and epidemiologists, to manage the escalating numbers of cases and contacts requiring investigation. staff were sourced through government interoperability arrangements and secondment agreements with the university of tasmania. initial interventions at the hospitals included enhanced environmental cleaning, use of surgical face masks by all hcws in the medical and surgical wards in hospital 1, and prohibition of visitors to hospitals 1 and 2. interventions escalated rapidly as case numbers continued to increase. on 7 april 2020, admission of new patients to the medical and surgical wards of hospital 1 ceased, and external specialist support was increased, including an infectious disease physician and a mobile pheoc team comprising a public health physician, an epidemiologist and a clinical nurse consultant. on 10 april, all remaining hcws from the medical and surgical wards, who had not already been identified as close contacts, were placed in quarantine. by 12 april, cases had been identified across most clinical areas of hospital 1 (including medical, surgical and mental health wards, and operating theatres), hospital 2, and in the pathology service and outpatient clinics colocated with these facilities. on 13 april, hospitals 1 and 2 and related campus medical services were closed, with patients transferred to other facilities, including hospital 3. all hcws who had worked in hospitals 1 and 2 and co-located facilities from 27 march (approximately 1300 people) and their household members (an estimated additional 3000–4000 people) were placed in quarantine at home for 14 days. this was the first example of the quarantining of secondary close contacts for outbreak management in australia. community restrictions were also implemented on 12 april to reduce social mixing in the affected region. this included a 14-day closure of all non-essential retail cases also occurred among medical and allied health practitioners, and among people working in maintenance, administrative and catering services, but none were identified among cleaning staff. the attack rates at hospital 1 were 16/98 doctors (16%) and 43/393 nurses (11%). seven hcws required admission to hospital for management of their illness and all were subsequently discharged. affected hcws worked across facilities in the colocated medical precinct of hospitals 1 and 2 (including in pathology collection and outpatient services) and in health-care facilities in other locations. the median number of different clinical settings where individual staff worked during their infectious period was 1 (range 1–7). a total of 40 (49%) hcw cases did not attend work while symptomatic, 26 (32%) first had symptoms on their last day at work and 15 (19%) attended work while symptomatic for time periods of 1–7 days. seven asymptomatic cases were identified during the outbreak, mostly through the requirement for testing before resuming work when hospital 1 was reopened. pathways of transmission the initial cases notified to phs occurred in staff primarily working on the medical ward of hospital 1. ten hcws had onset of symptoms between 30 march and 3 april, before identification of the first hcw cases, and at least two of these hcws recalled providing direct care to one of the two index cases during their acquisition period. these early cases included medical, nursing and allied health staff who attended daily nursing and medical handover meetings conducted in confined spaces. several other clusters among hcws were identified among attendees of regular meetings, such as administrative or clinical planning meetings. cases also occurred in the co-located hospital 2 (9 hcws and 6 patients); among these cases, six (5 hcws and 1 patient) had no link to other health-care facilities. fourteen cases were associated with hospital 3 (4 hcws and 10 patients), of whom three (2 hcws and 1 patient) could only have acquired the infection at hospital 3, whereas the remainder had either worked at or had also been admitted to hospital 1. the single case from the residential aged-care facility acquired covid-19 from a hcw who had previously worked at both hospitals 1 and 2. wpsar vol 12, no 4, 2021 | doi: 10.5365/wpsar.2021.12.4.884https://ojs.wpro.who.int/ 5 a covid-19 outbreak in tasmanian health-care settingsjohnston et al ate such symptoms from the onset of covid-19. it is also possible that some had asymptomatic covid-19 infection. however, at this stage of the pandemic, the importance of asymptomatic infection and transmission had not been recognized; hence, testing of asymptomatic contacts was not standard practice.4,10 changing work practices relating to presenteeism (i.e. attending work when unwell) requires a cultural shift in long-standing attitudes and perceptions that increase the likelihood of this behaviour. reasons for individuals continuing to work include workplace culture and expectations, a desire to support their colleagues, especially when there are staff shortages, and to maintain income, a particularly important consideration for casual workers.11,12 interventions were subsequently introduced to support this cultural change, including screening staff for acute respiratory symptoms before each shift, requiring covid-19 testing for staff who develop acute respiratory infection, and developing operational frameworks to support staff absences due to symptomatic respiratory infections and while awaiting test results. contact identification and testing there were many challenges with the timely identification of close contacts from the three hospitals. one challenge was locating multiple electronic and paper-based information systems to identify staff and patient movements during the outbreak, often by outbreak investigation team members unfamiliar with the local setting. covid-19 response guidelines and the definition of a close contact were frequently updated throughout the investigation and, as the outbreak escalated, contact tracing became overwhelming for the number of contact tracers available.5 these logistical difficulties made quarantining close contacts challenging.9,12 the outbreak occurred early in the pandemic when national guidelines limited covid-19 testing to symptomatic individuals and access to rapid testing was limited.4 consequently, not all contacts were tested. this hindered the rapid identification of new cases and may have resulted in asymptomatic cases going undetected, potentially adding to transmission. outbreak management principles, including the testing of asymptomatic contacts, were later added to the australian series of national guidelines for covid-19 on 28 may 2020.4 businesses, the strictest restrictions in australia at the time.5 the australian defence force provided temporary emergency department services while hospital 1 was cleaned, recommissioned and reopened. these control measures were followed by a reduction in the number of new cases over the following days. the outbreak was declared over on 6 june, after two incubation periods (i.e. 28 days) had passed with no new cases. lessons learnt we identified several factors that contributed to and amplified the spread of covid-19 through the health-care settings. physical distancing the nature of clinical work in a hospital makes it difficult to maintain physical distancing between staff, and between patients and staff. studies have found no difference in seroprevalence rates between frontline and non-frontline staff, highlighting transmission routes outside of direct patient care, such as from staff to staff.6,7 these factors were illustrated in this outbreak by the clustering of cases among attendees of recurring events such as nursing handovers and discharge planning meetings.5 the higher attack rates in doctors at hospital 1 might be attributable to the sharing of offices, daily visits to most hospital wards, ward rounds in small groups that huddle around a computer screen and attendance at meetings. hospital meeting places are often small, and cumulative time of close physical contact increases the risk of transmission.8,9 several measures, including limits on the number of people in rooms, were introduced after the outbreak to address physical distancing, although space constraints mean that assigning individual office space is often not possible. presenteeism almost 20% of infected hcws worked while symptomatic, with more unknowingly working during the presymptomatic stage of illness, an important infectious stage of covid-19.9 some, especially those with preexisting chronic respiratory conditions, attributed mild symptoms to other causes and were unable to differentiwpsar vol 12, no 4, 2021 | doi: 10.5365/wpsar.2021.12.4.884 https://ojs.wpro.who.int/6 johnston et ala covid-19 outbreak in tasmanian health-care settings and criteria for quarantine of people in these groups form part of the current series of national guidelines for covid-19.4 a limitation of the study is the lack of information about asymptomatic cases. at the time of the outbreak, the availability of rapid testing was limited, and testing of asymptomatic contacts was not routinely conducted. although seven (5%) of the known 138 cases were found to be asymptomatic, this could be an underestimate. it has been estimated that up to 24% of transmission could be associated with asymptomatic disease.15 the learnings from this first large australian outbreak in a health-care setting have contributed to ongoing interventions and pandemic responses throughout tasmania and other states and territories of australia. acknowledgements we acknowledge the many people who worked in difficult circumstances to contain the covid-19 outbreak in northwest tasmania and who continue to work to protect tasmanians from a serious threat to their health and wellbeing. specifically, we thank iain koolhof, karen banda, zoe stephens, gabriela willis and belinda fenney-walch for contributions to earlier versions of this report. conflict of interest as an editor of wpsar is an author, another editor on the editorial team managed this publication. ethics statement the investigation was conducted under the tasmanian public health act and did not require ethical review. funding no external funding was received for this work. references 1. walker b. special commission of inquiry into the ruby princess. sydney: state of new south wales; 2020. isbn: 978-0-64682316-4. 2. nguyen lh, drew da, graham ms, joshi ad, guo c-g, ma w, et al. risk of covid-19 among front-line health-care workers and the general community: a prospective cohort study. lancet public health. 2020;5(9):e475–83. doi:10.1016/s2468-2667(20)30164-x pmid:32745512 staff and patient mobility many infectious staff were highly mobile within the health-care facilities or worked in more than one health-care setting. given the small regional hospital workforce in this location, the mobility between healthcare and aged-care facilities was unavoidable. several patients who were transferred between hospitals were infectious but had not yet been diagnosed with covid-19; this contributed to transmission from hospital 1 to hospitals 2 and 3 early in the outbreak. infection prevention and control practices independent transmission from the two index cases with covid-19 to hcws was confirmed by genomic analysis,13 and a later instance of transmission from a covid-19 patient to a hcw at hospital 3 was identified through epidemiological investigation.5 although no specific breaches of infection control protocols were recalled by the hcws concerned, strengthening of infection control practices for all hcws through increased resourcing and staff education, training and support was rapidly implemented following the outbreak.12 discussion despite no ongoing community transmission in the region, the tasmanian outbreak was characterized by rapid transmission in health-care settings, with staff-to-staff transmission as the most significant contributor to the escalation of cases. the investigation identified a range of existing hcw practices that facilitate disease transmission in hospital settings, including challenges in achieving physical distancing, a culture of presenteeism and a high level of mobility of staff and patients across multiple health-care settings. the rapid closure of two hospitals highlighted the difficulties of maintaining a workforce in rural settings, because increases in demand coincided with a diminishing workforce due to the escalating isolation and quarantine requirements.14 the requirement that all hcws from hospitals 1 and 2 and their household contacts quarantine for 14 days, regardless of whether they met existing definitions of a close or casual contact, was associated with achieving rapid control of the outbreak. the definitions of close, casual and secondary contacts have since been refined, wpsar vol 12, no 4, 2021 | doi: 10.5365/wpsar.2021.12.4.884https://ojs.wpro.who.int/ 7 a covid-19 outbreak in tasmanian health-care settingsjohnston et al 9. cheng h-y, jian s-w, liu d-p, ng t-c, huang w-t, lin h-h, et al. contact tracing assessment of covid-19 transmission dynamics in taiwan and risk at different exposure periods before and after symptom onset. jama intern med. 2020;180(9):1156–63. doi:10.1001/jamainternmed.2020.2020 pmid:32356867 10. byambasuren o, cardona m, bell k, clark j, mclaws ml, glasziou p. estimating the extent of asymptomatic covid-19 and its potential for community transmission: systematic review and meta-analysis. jammi. 2020;5(4):223–34. doi:10.3138/jammi-2020-0030 11. reuter m, dragano n, wahrendorf m. working while sick in context of regional unemployment: a europe-wide cross-sectional study. j epidemiol community health. 2020 [epub ahead of print]. doi:10.1136/jech-2020-214888 pmid:33188056 12. wee le, sim xyj, conceicao ep, aung mk, goh jq, yeo dwt, et al. containment of covid-19 cases among healthcare workers: the role of surveillance, early detection, and outbreak management. infect control hosp epidemiol. 2020;41(7):765–71. doi:10.1017/ ice.2020.219 pmid:32391746 13. stephens n, mcpherson m, cooley l, vanhaeften r, wilmot m, lane c, et al. covid-19: integrating genomic and epidemiological data to inform public health interventions and policy in tasmania, australia. western pac surveill response j. 2021;12(4). doi:10.5365/wpsar.2021.12.4.878 14. bielicki ja, duval x, gobat n, goossens h, koopmans m, tacconelli e, et al. monitoring approaches for health-care workers during the covid-19 pandemic. lancet infect dis. 2020;20(10):e261–7. doi:10.1016/s1473-3099(20)30458-8 pmid:32711692 15. johansson ma, quandelacy tm, kada s, prasad pv, steele m, brooks jt, et al. sars-cov-2 transmission from people without covid-19 symptoms. jama netw open. 2021;4(1):e2035057. doi:10.1001/ jamanetworkopen.2020.35057 pmid:33410879 3. gómez-ochoa sa, franco oh, rojas lz, raguindin pf, roa-díaz zm, wyssmann bm, et al. covid-19 in health-care workers: a living systematic review and meta-analysis of prevalence, risk factors, clinical characteristics, and outcomes. am j epidemiol. 2021;190(1):161– 75. doi:10.1093/aje/kwaa191 pmid:32870978 4. communicable diseases network australia (cdna). coronavirus disease 2019 (covid-19) cdna national guidelines for public health units. canberra: australian government department of health; 2021. available from: https://www1.health.gov.au/internet/ main/publishing.nsf/content/cdna-song-novel-coronavirus.htm, accessed 14 october 2021. 5. covid-19 north west regional hospital outbreak – interim report. hobart: tasmanian department of health; 2020. available from: https://www.health.tas.gov.au/__data/assets/pdf_file/0006/401010/ north_west_regional_hospital_outbreak_-_interim_report.pdf, accessed 14 october 2021. 6. covid-19: a chronology of state and territory government announcements (up until 30 june 2020). canberra: parliament of australia; 2020. available from: https://www.aph.gov.au/ about_parliament/parliamentary_departments/parliamentary_library/pubs/rp/rp2021/chronologies/covid-19stateterritorygovernmentannouncements#_toc52275799, accessed 14 october 2021. 7. lombardi a, mangioni d, consonni d, cariani l, bono p, cantù ap, et al. seroprevalence of anti-sars-cov-2 igg among healthcare workers of a large university hospital in milan, lombardy, italy: a cross-sectional study. bmj open. 2021;11(2):e047216. doi:10.1136/bmjopen-2020-047216 pmid:33619203 8. mani ns, budak jz, lan kf, bryson-cahn c, zelikoff a, barker gec, et al. prevalence of coronavirus disease 2019 infection and outcomes among symptomatic healthcare workers in seattle, washington. clin infect dis. 2020;71(10):2702–7. doi:10.1093/ cid/ciaa761 pmid:32548613 health facility use by dengue patients in the klang valley, malaysia: a secondary analysis of dengue surveillance data original research yuan liang woon,a chiu wan ng,b rose nani mudinc and zailiza sulic a clinical research centre, dermatology block, hospital kuala lumpur, jalan pahang, kuala lumpur, malaysia. b department of social and preventive medicine, university of malaya, jalan universiti, kuala lumpur, malaysia. c sector of vector-borne disease, disease control division, ministry of health malaysia, putrajaya, malaysia. correspondence to woon yuan liang (email: ylwoon.crc@gmail.com). to cite this article: woon yl, ng cw, mudin rn, suli z. health facility use by dengue patients in the klang valley, malaysia: a secondary analysis of dengue surveillance data. western pac surveill response j. 2019 may;10(2). doi:10.5365/wpsar.2019.10.1.001 abstract background: dengue patients in malaysia have the choice to seek care from either public or private sector providers. this study aims to analyse the pattern of health facility use among dengue patients to provide input for the ongoing policy discussion regarding public–private integration. the focus of this study is in the klang valley, which has a high dengue burden as well as a high number of private facilities. methods: this is a cross-sectional study using an available secondary data source – the malaysian national dengue passive surveillance system, e-dengue registry. a total of 61 455 serologically confirmed dengue cases from the klang valley, registered in year 2014, were included. we retrospectively examined the relationship between demographic factors and the choice of health-care sector by logistic regression. results: the median age of the cohort was 26 (interquartile range: 17 to 37) years. more private facilities (54.4%) were used for inpatient care; more public facilities (68.2%) were used for outpatient care. the chinese and urban populations showed significantly higher use of the private health-care sector with an adjusted odds ratio of 4.8 [95% confidence interval (ci): 4.6–5.1] and 2.3 (95% ci: 2.2–2.4), respectively. conclusion: both public and private health facilities bear significant responsibilities in delivering health-care services to dengue patients. the workload of both sectors should be included in future health policy planning by public agencies. background dengue is a fast emerging mosquito-borne viral disease in all world health organization (who) regions.1 it poses substantial socioeconomic burden to the endemic countries. a recent study reported that both fatal and non-fatal dengue cases contributed to 1.14 million disability-adjusted life years globally in 2013.2 the disability-adjusted life years is a measure of disease burden, expressed as the sum of years of potential life lost due to ill-health, disability or premature mortality. furthermore, a prospective study involving three countries in asia (cambodia, malaysia and thailand) and five countries in the americas (brazil, el salvador, guatemala, panama and venezuela) found that the average cost for an ambulatory dengue case was us$ 514, while the cost for a hospitalized case was us$ 1394.3 dengue infection is hyperendemic in malaysia. its incidence doubled from 146 per 100 000 population in 2013 to 328 per 100 000 population in 2016.4 it was estimated that malaysia spent about us$ 175.7 million annually on treatment and dengue prevention activities.5 the klang valley, with an estimated population of 7.9 million in the state of selangor, the federal territory of kuala lumpur and the federal territory of putrajaya in 2014, has been targeted as the focus for reduction of dengue cases as it has consistently contributed more than half of the national dengue burden.4,6–8 the malaysian health-care system is a mixture of public and private systems; the public and private sectors complement each other in the delivery of health-care services. public health-care providers serve both rural and urban populations; private health-care providers mainly concentrate in high-density urban areas, especially along the west coast of peninsular malaysia.9 the public health-care system is mainly financed through taxation and general revenue collected by the federal government. additionally, the employees provident fund and social security organization also contributed to health-care funding for the public sector.10 the private sector is mainly funded through private employers, private insurance and out-of-pocket payments.10 to facilitate efficient health policy planning and resource allocation we need to estimate the disease burden in both health-care sectors and understand the factors associated with the pattern of health facility use. in malaysia, the performance and workload of the private sector were seldom taken into consideration in health policy planning by public agencies. this situation may lead to inefficiencies in the health sector and underutilization of expertise. studies related to health facility use in malaysia are limited. hence, this study aimed to analyse the pattern of health facility use among dengue patients in the klang valley by using the data captured in the national dengue surveillance system, e-dengue registry. methods study setting and populations this is a cross-sectional study that is based entirely on an available secondary data source in malaysia. a secondary data analysis was performed using the data captured in the e-dengue registry, a national dengue passive surveillance system in malaysia. all confirmed dengue cases from the klang valley registered in the e-dengue registry from 1 january 2014 to 31 december 2014 were included in the analysis. we assumed the health facilities that notified cases to the e-dengue registry were the first medical facilities to be used by dengue patients. for cases with missing information on the name of the medical facility, the full addresses of the health-care facilities were mapped on google maps to identify the facilities. then the facility names were matched with a list of public and private health-care facilities. a list of the klang valley public health-care facilities was obtained from the development division, ministry of health (moh) malaysia. the list comprised 18 public hospitals and 89 public clinics. a list of private health-care facilities was obtained from the medical practice division, moh malaysia. there were 92 private hospitals and 2205 private clinics in the klang valley during the study period. the e-dengue registry and case definition the e-dengue registry was established in malaysia in 2009 under the national dengue strategic plan 2009–2013.7 in malaysia, it is mandatory for health-care practitioners to notify all clinically suspected or serologically confirmed dengue cases through an online notification system (e-notice). the diagnosis is verified by district health officers according to the who 1997 classification.11 dengue fever is defined as any case with “acute febrile illness with two or more clinical presentations (myalgia, arthralgia, retro-orbital pain, headache, rash, leukopenia and haemorrhagic manifestations) in additional to supportive serology or occurrence at the same location and time as other confirmed dengue cases. a confirmed dengue case is one that was confirmed through laboratory testing such as dengue virus isolation, virus antigen detection, virus genomic sequence detection and/or a fourfold rise in antibody titer.”11 only confirmed dengue cases were entered into the e-dengue registry by the district health officers. statistical analysis the background characteristics of all dengue patients in the klang valley and the pattern of health facility use were described through descriptive analyses. logistic regression was used to examine the relationship between demographic factors and patients’ choices of health-care sectors. the two-sided statistical significance level was set at p ethics approval and consent to participate this article is research involving secondary data. all cases included in this study were anonymized. the study was registered under the national medical research registry (nmrr-17–544–34899) and approved by the medical research ethics committee (mrec), moh malaysia. results demographic profiles this study included 61 445 serologically confirmed dengue cases reported within the klang valley area in 2014. patients’ ages ranged from less than one month to 98 years. the age was non-normally distributed, with kolmogorov–smirnov normality test showing p table 1). the majority of the cases (77.5%) were adults aged 15–59 years; 18.9% of the cases were children aged below 15 years. those aged 60 years and above contributed only 3.6% of the total cases. more than half of the cohort were male (57.1%). the majority of the cohort were malay (54.1%) followed by malaysian chinese (25.4%) and indian (10.3%). in 2014, 8.4% of the registered dengue cases in the klang valley were non-malaysian with the majority from bangladesh (26.7%) followed by nepal (23.1%), indonesia (12.1%), india (6.1%), china (5.3%), myanmar (5.3%), pakistan (4.9%) and other countries. ethnicity information was missing from 778 (1.3%) cases. table 1. demographic profiles of confirmed dengue cases in the klang valley, 2014 click to download table 1. jpg, 204kb health facility utilization by dengue patients in klang valley there were 3158 cases with missing information on the health-care sector use. the use of private and public health-care facilities by dengue patients in the klang valley was 51% and 49%, respectively. when comparing the use of public and private health-care facilities within the districts, differences of more than 65% were noted for hulu selangor district, kuala langat district and sabak bernam district (table 2). at least 85% of the patients from these districts were using public health-care facilities instead of private health-care facilities. dengue patients from the federal territory of kuala lumpur, petaling district and hulu langat district used private health facilities more than public ones. fig 1 shows a map of the klang valley. table 2. use of health-care facilities of different districts in the klang valley click to download table 2. jpg, 305kb fig. 1. map of the klang valley and the pattern of health facility use click to download figure 1. jpg, 242kb the utilization rate of hospitals was about five times higher than that of clinics for the whole study population (83% versus 17%). when the utilization of health-care sectors was stratified by type of facility (private versus public), an inverse picture was observed between inpatient and outpatient cases. for hospitalized cases, the use of private facilities (54.4%) was about 10% higher than that of public facilities (45.6%). for cases who presented to outpatient care, the use of private clinics (31.8%) was two times lower than that of public clinics (68.2%). the association of patients’ demographic profiles and the choice of health-care sectors was tested (table 3). cases with missing information on health-care sector, age and/or ethnicity (n = 3900) were excluded from this analysis. multivariate analysis showed that females have higher private health care use than males (p p p table 3. analysis of demographic profile with use of private compared with public health-care facilities click to download table 3. jpg, 416kb discussion to the best of our knowledge, this is the first study focused on the pattern of health facility use among dengue patients in malaysia. we observed similar overall usage of private and public health-care facilities by dengue patients in the klang valley. our finding differs from that reported by zara al et al. in which the use of public health-care facilities was two times higher than private health-care facilities among dengue patients in brazil.12 this difference could be attributed to differences in health-care systems and health-seeking behaviours between malaysians and brazilians. stratification by the type of health-care facility showed dengue patients in the klang valley used more private inpatient care and public outpatient care. the opposite was observed in the national health morbidity survey (nhms) 2015, which demonstrated a higher utilization of public inpatient care and private outpatient care among the klang valley population.13 nhms is a population survey that targets all types of diseases when collecting information regarding the use of health-care services.13 however, our study involved only confirmed dengue cases. therefore, the use pattern of health-care services may differ when we focus only on a single medical condition, dengue fever. our finding demonstrates that hospital utilization was nearly five times higher than clinic utilization among dengue patients in the klang valley. according to a published report, dengue fever is the third and fourth most common discharge diagnosis made in private and public hospitals, respectively, in malaysia.9 however, brazil reported the opposite where the majority (81.4%) of the dengue patients used outpatient services.12 the nature of private health insurance and its coverage may influence patients’ health-seeking behaviour. the private insurance policies offered in malaysia usually cover the cost of hospital admission but not the cost of outpatient care.9 this may have influenced the health-seeking behaviour and caused a propensity for hospital use. the fact that the klang valley has the highest percentage of private health insurance coverage13 could possibly explain the higher use of private hospital care. similar to the nhms 2015, we found that private health-care facilities were used most by malaysian chinese regardless of the types of facility; the indigenous population had the least private health-care utilization among all. this could be related to the income distribution across the ethnic groups in malaysia. malaysian chinese are generally in a higher income group as compared to other ethnicities,14 and nearly half of malaysian chinese were covered by private health insurance. malaysia has a mixed public–private provision of health-care services for primary, secondary and tertiary care. public health-care services are more evenly distributed in urban and rural areas; private facilities tend to be available only in urban areas.9 the population in urban areas may have a higher socioeconomic status and are able to afford private services more than those in the rural population. this may also explain why the urban population has higher use of private health care. our study has a few limitations. first, this study only focused on data captured within the klang valley, so it might not be suitable to generalize the findings to the whole of malaysia. second, as the study was conducted using data from year 2014, the pattern of health facility use might be different now. third, as the e-dengue registry only captures confirmed dengue cases, the preference of health-care facilities among the undiagnosed and clinical dengue cases remains unanswered. fourth, a majority of dengue patients are asymptomatic and might not seek medical attention. therefore, the high hospital use as observed in this study might be associated with a more severe form of dengue infection. additionally, we noted the new dengue classification published by who in 2009; however, the 1997 who dengue classification was the case definition used in the surveillance system at the time of data collection. as this is secondary research, we do not have control over the case definition used by the system. however, a published systemic review concluded no study had formally compared the 1997 who dengue classification with the 2009 classification in the area of surveillance and research.15 therefore, the applicability of either classification in the surveillance system remains unknown. as the e-dengue registry has limited variables, we were unable to study other factors such as disease severity, economic factors, geographical factors, organizational factors and cultural factors that could potentially play an important role in determining use of health-care facilities. lastly, as we used the health-care facilities that notified the cases as the proxy for dengue patients’ preferences, it might not reflect the true preference of patients. nevertheless, this study has a large sample size compared to other studies with similar objectives, and it was the first study in malaysia to analyse disease-specific health facility use. this study shed light on the big picture of health facility use among dengue patients in the klang valley. conclusions our results showed both public and private health facilities bear significant responsibilities in delivering health-care services to dengue patients in the klang valley. malaysian chinese, females and urban populations have higher utilization for private health-care facilities. future health service and policy planning related to dengue infection should take into account the workload of both public and private sectors. acknowledgements the authors wish to thank the director-general of health malaysia, deputy director-general of health (public health) and the director of disease control division for permission to publish this article. the authors would like to extend their sincere appreciation to the sector of vector-borne disease, disease control division, ministry of health malaysia for support in this study. we would like to acknowledge ms yang su lan for her help in proofreading the manuscript. funding this study was funded by the operating budget of institute for clinical research, institute for clinical research, ministry of health malaysia. conflicts of interest none. references global strategy for dengue prevention and control 2012–2020. geneva: world health organization; 2012 (https://www.who.int/denguecontrol/9789241504034/en/). stanaway jd, shepard ds, undurraga ea, halasa ya, coffeng le, brady oj, et al. the global burden of dengue: an analysis from the global burden of disease study 2013. lancet infect dis. 2016 jun;16(6):712–23. doi:10.1016/s1473-3099(16)00026-8 pmid:26874619 suaya ja, shepard ds, siqueira jb, martelli ct, lum lc, tan lh, et al. cost of dengue cases in eight countries in the americas and asia: a prospective study. am j trop med hyg. 2009 may;80(5):846–55. doi:10.4269/ajtmh.2009.80.846 pmid:19407136 idengue. kuala lumpur: kementerian sains teknologi dan inovasi (mosti); 2014 (http://idengue.remotesensing.gov.my/idengue/index.php, accessed 5 april 2017) (in malay). packierisamy pr, ng cw, dahlui m, inbaraj j, balan vk, halasa ya, et al. cost of dengue vector control activities in malaysia. am j trop med hyg. 2015 nov;93(5):1020–7. doi:10.4269/ajtmh.14-0667 pmid:26416116 balvinder sg. history and epidemiology of dengue. putrajaya: myhealth; 2017 (http://denggi.myhealth.gov.my/history-and-epidemiology-of-dengue/?lang=en). dengue prevention and strategic plan, 2009-2013. putrajaya: vector control unit, ministry of health, malaysia; 2009 (https://books.google.com.my/books?id=puzcdwaaqbaj&lpg=pa21&dq=pelan%20strategik%20denggi%20kebangsaan%202009-2013&pg=pa21#v=onepage&q=pelan%20strategik%20denggi%20kebangsaan%202009-2013&f=true, accessed 5 april 2018). dengue prevention and strategic plan, 2015-2020. putrajaya: vector control unit, ministry of health, malaysia; 2014 (https://www.cdc.gov.tw/file/get/tss-3tfl58rn9u7cnz8jcg, accessed 5 april 2018). malaysia health systems research volume 1, contextual analysis of the malaysian health system, march 2016. putrajaya: ministry of health, malaysia and boston: harvard t.h. chan school of public health, harvard university; 2016 (http://www.moh.gov.my/moh/resources/vol_1_mhsr_contextual_analysis_2016.pdf, accessed 18 april 2018). malaysia national health accounts: health expenditure report, 1997-2016. putrajaya: malaysia national health accounts unit, planning division, ministry of health, malaysia; 2018 (https://www.aidsdatahub.org/sites/default/files/publication/malaysia_health_expenditure_report_1997-2016_07122018.pdf, accessed 26 march 2018). dengue haemorrhagic fever: diagnosis, treatment, prevention and control. geneva: world health organization; 1997 (https://www.who.int/csr/resources/publications/dengue/denguepublication/en/). zara al, martelli cm, siqueira jb jr, parente mp, braga c, oliveira cs, et al. health services utilization by dengue patient in brazil, 2012-2013: a multicenter study. value health. 2015 11;18(7):a529. doi:10.1016/j.jval.2015.09.1642 pmid:26532966 national health morbidity survey 2015 vol. v. putrajaya: ministry of health, malaysia; 2015 (http://iku.moh.gov.my/index.php/research-eng/list-of-research-eng/iku-eng/nhms-eng/nhms-2015, accessed 29 march 2018). household income and basic amenities survey report 2012. putrajaya: department of statistics, malaysia; 2012 (https://www.dosm.gov.my/v1/index.php?r=column/cone&menu_id=ulvlbuxzuwo0l3feawzmuvg4zfqzzz09, accessed 19 april 2017). horstick o, jaenisch t, martinez e, kroeger a, see llc, farrar j, et al. comparing the usefulness of the 1997 and 2009 who dengue case classification: a systematic literature review. am j trop med hyg. 2014 sep;91(3):621–34. doi:10.4269/ajtmh.13-0676 pmid:24957540 https://ojs.wpro.who.int/ 1wpsar vol 13, no 4, 2022 | doi: 10.5365/wpsar.2022.13.4.951 brief report i n response to singapore’s first coronavirus disease (covid-19) hospital outbreak from late april to early may 2021, we conducted a mass testing exercise on 3–7 may 2021. this cluster in a single hospital marked the arrival of the delta (b.1.617.2) variant of severe acute respiratory syndrome coronavirus 2 (sars-cov-2) in singapore, and was characterized by breakthrough infections in vaccinated health-care workers (hcws) and some patients.1 by late may, 47 cases of covid-19 had been linked to this hospital cluster. at the time of the hospital outbreak, close contacts of positive cases were identified and quarantined at government isolation facilities for 14 days. however, in light of concerns that contact tracing of positive cases alone may not prevent further transmission of sars-cov-2, especially by asymptomatic or very mildly symptomatic hcws, all public hospitals were encouraged to conduct mass testing exercises as part of a strategy to minimise the risk of further spread to other hospitals. this report describes the results of the national mass testing exercise in one public hospital, in an effort to assess the effectiveness of the mass testing of asymptomatic hcws as a strategy to track and prevent viral spread through casual exposure to the delta variant of sars-cov-2. methods staff at our tertiary care hospital who had any contact with the source hospital at which the delta variant outbreak occurred within 14 days of the mass testing exercise (3–7 may 2021) were invited to take a covid-19 test and to complete a short online questionnaire. participation was voluntary; staff who had already been identified as direct contacts through the ministry of health’s and the source hospital’s own extensive contact tracing programme were exempted. staff were informed about the testing exercise by department heads and reporting officers, and invitations to participate were sent out via email. out of a total of approximately 7000 hospital staff, 427 indicated that they had had recent contact with the source hospital and attended for testing. of the 427 tested, 165 presented to the staff clinic, while the remaining 262 attended the testing stations that were set up specifically for the purposes of the exercise. nasopharyngeal swab samples were collected for polymerase chain reaction (pcr) testing for sars-cov-2. the online questionnaire was designed to capture basic demographic data for each participant. participants were also asked to provide information relating to their recent exposure history by selecting from a list of five possible exposure routes (multiple selections were allowed): • “i live in the same household as someone who works at the source hospital” • “i met with someone working on the source hospital campus for more than 30 minutes” • “i attended a meeting or training at the source hospital” • “i visited someone in the source hospital’s inpatient wards” • “i attended to patients or worked on the source hospital campus” a department of medicine, national university hospital, singapore. published: 23 november 2022 doi: 10.5365/wpsar.2022.13.4.951 mass covid-19 testing of asymptomatic health-care workers in a tertiary hospital during an outbreak in another hospital in singapore: an effective strategy? william t wang,a hwang ching chan,a jyoti somania and see ming lima correspondence to william t wang (email: william.wang@mohh.com.sg) wpsar vol 13, no 4, 2022 | doi: 10.5365/wpsar.2022.13.4.951 https://ojs.wpro.who.int/2 wang et almass covid-19 testing of asymptomatic health-care workers source hospital also tested negative for covid-19 on pcr swab tests. our testing exercise suggests that mass screening of asymptomatic hcws is an ineffective strategy for preventing the spread of the delta variant of sarscov-2 in a hospital setting when there is a rapid and thorough contact tracing programme already in place. any potential benefits would need to be weighed against any potential harms; for instance, a high proportion of negative tests may inadvertently result in complacency among hospital staff, leading to reduced compliance with infection control measures. furthermore, implementing a mass testing exercise at any scale can be costly and may further exacerbate strained staffing and laboratory resources.5 in many countries, increased infection rates among hcws are typically proportional to increased infection rates within the community, suggesting that tracking community incidence to focus efforts on targeted screening may be more effective than conducting mass testing exercises.6 limitations of this study include the possibility of incomplete capture of demographic and exposure history information; we mitigated against this by requiring staff to register and complete the online questionnaire before attending for their pcr test. in relying on selfreports to determine exposure through casual contact, our study will inevitably be subject to a degree of recall bias, especially in terms of the duration and level of exposure. additionally, we acknowledge that some staff may have avoided the mass testing exercise despite known possible exposure. this was addressed by disseminating reminders through various communication channels to all staff about their obligation to public health safety and responsibility to participate in the mass testing if they had had any contact with the source hospital. moreover, given the status of the pandemic at the time of our exercise (may 2021), motivation to be tested among staff was fairly high, prompted mainly by a desire to protect household members. conclusion our mass testing exercise failed to uncover any instances of asymptomatic inter-hospital transmission. within the limitations of this study, the results suggest that mass testing of asymptomatic hcws may be an impractical the data were anonymized by an independent third party and were retrospectively aggregated by the study team. results none of the 427 asymptomatic hcws who participated in the testing exercise conducted at the tertiary hospital during 3–7 may 2021 tested positive for covid-19. of those tested, 163 (38.2%) reported living in the same household as a member of staff from the source hospital, 108 (25.3%) met with someone working on the source hospital campus for >30 minutes, 59 (13.8%) attended a meeting or training at the source hospital, 18 (4.2%) visited someone in the source hospital’s inpatient wards and 16 (3.7%) attended to patients or worked on the source hospital campus during the time period of interest (table 1). twenty-two (5.2%) reported more than one reason for exposure at the source hospital, while 41 (9.6%) went for testing without indication of any exposure. discussion previous studies have suggested that mass testing of asymptomatic hcws may help to reduce nosocomial transmission of covid-19 by allowing early identification and isolation of positive cases, and contact tracing and quarantining of close contacts.2 additionally, the presymptomatic and early symptomatic periods have been identified as times of considerable transmission risk, with one study suggesting that more than 40% of cases may be infectious in the pre-symptomatic period.3 the increased transmissibility of emerging variant strains of sars-cov-2 with shorter incubation periods adds further weight to the arguments in favour of employing hcw screening as a strategy to limit hospital transmission of covid-19.4 in this relatively small, single-centre study, we did not detect a single case of covid-19 in a group of 427 hcws who submitted for pcr testing, despite the fact that 90.4% of participants reported possible exposure to someone from the source hospital. our study sample excluded those hcws who had a known exposure to a confirmed case at the source hospital and for this reason might be considered to be at greater risk of infection; however, all known contacts of positive cases at the wpsar vol 13, no 4, 2022 | doi: 10.5365/wpsar.2022.13.4.951https://ojs.wpro.who.int/ 3 mass covid-19 testing of asymptomatic health-care workerswang et al table 1. self-reported sources of possible exposure to covid-19 cases among staff at a tertiary care hospital who participated in a voluntary mass testing exercise (3–7 may 2021), as part of the response to an outbreak at another hospital, singapore (n = 427) infection control strategy to track and prevent covid-19 transmission from one hospital to another. we suggest that an institutional testing strategy which mirrors local community incidence rates – whereby hospitals increase the frequency of asymptomatic testing when there is a surge in community cases but relax testing during periods of lower case rates – would be a more effective option, especially when combined with continued strict adherence to infection control measures and internal contact tracing and a recommendation that staff stay home when they feel unwell and report any cold/flu-like symptoms or close household exposures. conflicts of interest the authors have no conflicts of interest to declare. ethics approval this study was conducted retrospectively using existing anonymized data, and was exempted from ethics review by the national healthcare group domain specific review board. funding none. sources of possible exposure “yes” answers, n (%) lives in the same household as someone who works at the source hospital 163 (38.2) met with someone working on the source hospital campus for more than 30 minutes 108 (25.3) attended a meeting or training at the source hospital 59 (13.8) visited someone in the source hospital’s inpatient wards 18 (4.2) attended to patients or worked on the source hospital campus 16 (3.7) more than one of the above 22 (5.2) none of the above 41 (9.6) references 1. chow a, guo h, kyaw wm, li al, lim rhf, ang b. rostered routine testing for severe acute respiratory coronavirus virus 2 (sarscov-2) infection among healthcare personnel – is there a role in a tertiary-care hospital with enhanced infection prevention and control measures and robust sickness-surveillance systems? infect control hosp epidemiol. 2021;1–2. doi:10.1017/ice.2021.268 pmid:34075868 2. black jrm, bailey c, przewrocka j, dijkstra kk, swanton c. covid-19: the case for health-care worker screening to prevent hospital transmission. lancet. 2020;395(10234):1418–20. doi:10.1016/s0140-6736(20)30917-x pmid:32305073 3. he x, lau ehy, wu p, deng x, wang j, hao x, et al. temporal dynamics in viral shedding and transmissibility of covid-19. nat med. 2020;26(5):672–5. doi:10.1038/s41591-020-0869-5 pmid:32296168 4. treibel ta, manisty c, burton m, mcknight á, lambourne j, augusto jb, et al. covid-19: pcr screening of asymptomatic health-care workers at london hospital. lancet. 2020;395:1608– 10. doi:10.1016/s0140-6736(20)31100-4 pmid:32401714 5. shenoy es, weber dj. routine surveillance of asymptomatic healthcare personnel for severe acute respiratory coronavirus virus 2 (sars-cov-2): not a prevention strategy. infect control hosp epidemiol. 2021 may;42(5):592–7. doi:10.1017/ice.2020.1428 pmid:33427148 6. grijalva cg, rolfes ma, zhu y, mclean hq, hanson ke, belongia ea, et al. transmission of sars-cov-2 infections in households—tennessee and wisconsin, april–september 2020. mmwr morb mortal wkly rep. 2020;69:1631–4. doi:10.15585/ mmwr.mm6944e1 pmid:33151916 https://ojs.wpro.who.int/ 1wpsar vol 13, no 2, 2022 | doi: 10.5365/wpsar.2022.13.2.918 original research s ince march 2020, the government of vanuatu (a group of 83 islands with a population of approximately 302 000) has implemented several measures to prevent the importation and community transmission of severe acute respiratory syndrome coronavirus 2 (sars-cov-2), the pathogen that causes coronavirus disease 2019 (covid-19). measures include quarantining incoming travellers and suspending international ports of entry into vanuatu.1 between may and december 2020, 4661 people returned to vanuatu through a repatriation programme. implementing quarantine and monitoring the symptoms of those in quarantine added a considerable burden to the public health system in shefa province where the capital city, port vila, is located. public health and nursing staff were redeployed from community-based health services within shefa and from other provincial health services, resulting in the closure of health centres or delays in providing some essential health services. the impact of these closures and delays has not been quantified. to address the issue of limited health resources and high demand on public health resources due to these quarantine requirements, shefa provincial health service and the vanuatu ministry of health (moh) considered alternative strategies for monitoring the health of asymptomatic people in quarantine, such as using short message service (sms, or “text message”) technology. sms technology has been effectively used a vanuatu health program, port vila, vanuatu b melbourne school of population and global health, the university of melbourne, melbourne, victoria, australia c burnet institute, melbourne, victoria, australia d vanuatu ministry of health, port vila, vanuatu e private physician, port vila, vanuatu f vila central hospital, port vila, vanuatu g shefa provincial health service, port vila, vanuatu h world health organization country liaison office in vanuatu, port vila, vanuatu published: 30 june 2022 doi: 10.5365/wpsar.2022.13.2.918 objective: to prevent importation of coronavirus disease 2019 (covid-19) to vanuatu, since march 2020, all travellers to the country have been required to complete a 14-day quarantine in a government-designated facility. a short message service (sms, or “text message”) system was developed to collect information on symptoms of covid-19 among travellers in quarantine. a trial within a cohort study was conducted among travellers arriving to vanuatu by air from 27 october to 7 december 2020 to assess sms acceptability, efficiency and utility and whether sms-based health monitoring was as effective as in-person monitoring in identifying people with covid-19 symptoms. methods: control group participants received standard monitoring (daily in-person visits) and participants in the intervention group received a daily sms text requesting a response coded for symptom development. differences between the two groups were determined using χ2 tests. results: of the 495 eligible travellers, 423 participated; 170 were allocated to the control group and 253 to the intervention group. at least one return sms text was received from 50% (107/212) of participants who were confirmed to have received an sms text. less than 2% (4/253) of the intervention group and 0% of the control group reported symptoms. discussion: the sms intervention had a high level of acceptability. sms is a useful tool to monitor symptom development among people in quarantine and for broader public health programmes that require follow up. comparison of strategies for daily surveillance of international travellers quarantined in vanuatu, october–december 2020 caroline van gemert,a,b,c wendy williams,d joanne mariasua,d debbie fred,a matthew cornish,e len tarivonda,d posikai samuel tapo,d vincent atua,f obed manwo,g philippe guyant,h lola iavrod and geoff clarka correspondence to caroline van gemert (email: caroline.vangemert@unimelb.edu.au or caroline.vangemert@vhp.com.vu) wpsar vol 13, no 2, 2022 | doi: 10.5365/wpsar.2022.13.2.918 https://ojs.wpro.who.int/2 van gemert et alusing sms for covid-19 quarantine monitoring in vanuatu recruitment and consent a research nurse obtained written consent from participants after they arrived at their hotel; consent forms were translated into both english and bislama (one of the official languages of vanuatu). infection prevention and control measures the research nurse wore personal protective equipment based on world health organization (who) recommendations for health-care workers.8 where possible, the research nurse contacted eligible participants by phone. consent forms were collected by the research nurse and stored in a file for 3 days before being accessed. control and intervention groups in the control group, participants received standard monitoring. this involved daily visits from public health teams. monitoring teams worked in pairs, with one member recording data and the other conducting the assessment. the assessment included a temperature check using a digital thermometer and enquiries about symptoms such as fever, cough, sore throat or related symptoms. the results were recorded in a paper record that was stored at shefa provincial health service before the data were entered into the quarantine database (a customized google sheets database with restricted access). participants with symptoms were followed up by a rapid response team. if asymptomatic, people in quarantine were tested on days 5 and 11 after arrival, and if symptomatic, they were tested on the day of symptom onset. laboratory testing was conducted using the xpert xpress sars-cov-2 cartridge assay (cepheid, sunnyvale, ca, usa). data on medical follow up and outcomes (including testing and associated results) were not included in the quarantine database and were stored in the district health information software version 2 (dhis2) covid-19 case-based surveillance module. participants in the intervention group were monitored only by sms. participants without a local mobile telephone number were provided with a local sim card and were requested to activate the card. during the in a variety of public health programmes aiming to control infectious diseases; for example, sms has been used to send reminders for infant vaccinations,2,3 to send treatment reminders to improve adherence to hiv pre-exposure prophylaxis4 and tuberculosis treatment,5 and to send partner notifications for contact tracing for sexually transmitted infections.6 limited studies have used sms texts to record two-way information flow (that is, responses to questions that are recorded within the sms), and none of these has been from a pacific island country. for example, an intervention in western australia used sms to monitor the health of people who had recently travelled to areas in africa affected by ebola virus disease.7 in that intervention, people were sent an sms text twice daily for 3 weeks requesting their temperature and information about symptoms. if any related symptoms were reported, a medical officer contacted the person and followed up as appropriate. the present study sought to develop and assess an sms-based system to streamline active monitoring of travellers returning to vanuatu. the objective of the study was to assess sms acceptability, efficiency and utility and whether sms-based health monitoring was as effective as in-person monitoring to identify people with symptoms of covid-19 in vanuatu. methods study design this operational research used a trial within a cohort. the cohort was inbound travellers to vanuatu who arrived by air between 27 october and 7 december 2020. inclusion and exclusion criteria individuals aged ≥18 years arriving from a country classified as low risk were eligible to participate. lowrisk countries were defined by the vanuatu moh and included those with a 14-day incidence of <10 newly reported cases/100 000 population that had direct flights to vanuatu and had no reported community transmission. individuals with pre-existing respiratory conditions or health issues were identified through review of pre-travel registration forms, as per standard processes, and were excluded from the study. wpsar vol 13, no 2, 2022 | doi: 10.5365/wpsar.2022.13.2.918https://ojs.wpro.who.int/ 3 using sms for covid-19 quarantine monitoring in vanuatuvan gemert et al the intervention group including whether an outbound sms text was sent by the vanuatu moh (yes/no) and the date, whether an inbound sms text was received by the vanuatu moh (yes/no), the contents of the sms response (1 = no symptoms, 2 = symptoms), whether a sars-cov-2 test was requested (yes/no) and the results of the test. in addition, on the final day prior to release from quarantine, a five-question paper-based survey was distributed to all participants in the intervention group to assess the acceptability of the sms monitoring system. data analysis χ2 tests were used to compare: (1) characteristics of participants versus non-participants, (2) characteristics of the intervention group versus control group, (3) response rates of the intervention group by demographic variables and (4) symptoms reported in the intervention group versus control group. a p value of <0.05 was considered statistically significant. stata standard edition software (version 15; college station, tx, usa) was used for statistical analyses. results participation rates the last inbound flight to vanuatu for 2020 occurred on 7 december 2020, and therefore the target sample size of 540 participants could not be reached. however, among 495 people eligible to participate, 423 consented (participation rate of 85%). there was no statistical difference in proportions among participants and non-participants by sex and nationality, but more participants were aged 18–40 years compared with non-participants (p = 0.002). these proportions reflect the people travelling to vanuatu at that time. three quarters (78.0%; 330/423) of participants were male, one quarter (26.2%; 111/423) was aged ≥40 years and nearly all (95.0%; 402/423) were vanuatu nationals. the nationalities of the 21 people who were not vanuatu citizens included australian (n = 13), french (n = 6), chinese (n = 1) and fijian (n = 1). description of intervention and control groups among the 423 participants, 170 (40.2%) were allocated to the control group and 253 (59.8%) to the intervention quarantine period, each day at approximately 09:00, an sms text was sent to the person in quarantine: “in the last 24 hours, have you experienced a fever, cough or shortness of breath? if no, reply 1. if yes, reply 2.” the returned sms data were stored in a cloudbased database managed by digicel vanuatu (a mobile phone service provider) and accessible to the moh. data were downloaded as microsoft excel files and linked to the research database monitored by the ministry. if symptoms were reported, the database automatically generated an alert that was sent to a public health officer. the officer then telephoned the individual to verify symptoms and confirm their location. if the symptoms met the covid-19 case definition (based on the who case definition),9 the shefa provincial public health manager was informed, and the provincial rapid response team, comprising a medical practitioner and public health officer, was activated. data on medical follow up and outcomes (including testing and associated results) were not included in the quarantine database and were stored in the dhis2 covid-19 case-based surveillance module. participants in the intervention group were also tested on days 5 and 11 after arrival, as per the processes described above. sample size and allocation the sample size required to have sufficient power to detect 5% of the population reporting fever, cough or shortness of breath with a design effect of 2 was 540. all arrivals reporting travel from an eligible location were recruited until the sample size was reached. participants were block-allocated to either the control or intervention group according to date of arrival and hotel of allocation. block randomization was used to ensure that all participants in the control group were quarantined in the same hotel, therefore reducing strain on the public health workforce by reducing their need to travel between multiple hotels. data collected relevant data were extracted from the quarantine database for participants in the control and intervention groups, including name, date of birth, port of departure and date of arrival in vanuatu, and these were transferred to the research database (a customized microsoft excel database) and stored in a secure folder. the research database included additional data about participants in wpsar vol 13, no 2, 2022 | doi: 10.5365/wpsar.2022.13.2.918 https://ojs.wpro.who.int/4 van gemert et alusing sms for covid-19 quarantine monitoring in vanuatu discussion the detection rate of acute respiratory illness was higher for the intervention group than for the control group. however, it should be noted that the number of people reporting symptoms was low in both groups and is not statistically significant. globally, there has been a decrease in respiratory specimens testing positive for influenza at sentinel surveillance sites.10 this has also been reported in vanuatu.11 it is difficult to determine whether the overall low rate of symptom detection reflects underreporting in both the control and intervention groups. in contrast, in 2021 a new model for quarantine monitoring was adopted by the vanuatu moh whereby people in quarantine are telephoned to enquire about symptom development at two points during quarantine. from 1 january to 31 may 2021, 1226 people completed quarantine, among whom 5 (0.40%) reported influenza-like illness. this suggests that the sms intervention may achieve a higher rate of reporting; however, further research is required. there were several operational issues related to the use of sms texts in vanuatu, including challenges to ensuring that the sms texts sent were received by participants. reasons why texts were not received include people not activating the sim cards and the use of an overseas-based bulk sms service to send the sms texts. during the post-intervention survey, people who did not respond to the sms texts indicated that they forgot, had technical issues or did not understand the instructions. translating the sms text to bislama may increase response rates, and the remaining barriers could all potentially be addressed through improved troubleshooting of communication and technology issues. it is unclear whether literacy rates contributed to successful reporting. overall, most participants reported that the intervention instructions were easy to follow and they were comfortable responding by sms. however, a higher proportion of males than females found reporting by sms to be difficult. this conflicts with the finding that the majority of females and males found the instructions easy to follow, so the challenges in responding by sms may be due to technical or logistical issues associated with responding by sms rather than understanding the instructions. group. the control and intervention groups had similar distributions among age group and nationality; however, fewer males were in the control group (71.8% [122] versus 82.2% [208], p = 0.011) (table 1). intervention response rate among the 253 participants in the intervention group, evidence that an sms was received by the participant was available for 212 participants (83.8%). the reason why an sms text was not received is unclear, but is likely due to non-registration of the sim card or another technical issue. among these 212 participants, at least one return sms text was received from a total of 107 participants (50.4%). there was no statistical difference (p > 0.05) in sex, age group or nationality for participants in terms of the number of responses received (table 2). the response rate varied for the first 3 days by sex, but ranged between 35% and 50% for all participants each day between day 4 and day 14 (data not shown). intervention impact overall, four people in the intervention group (1.6%) and none in the control group reported symptoms during the quarantine period; the difference was not statistically significant. all four people who reported symptoms received a sars-cov-2 test, and none were positive. evaluation of the intervention the post-intervention evaluation was completed by 92 of the 253 participants in the intervention group (36.3%). among respondents to the evaluation, 32 (34.8%) were female and 60 (65.2%) were male. the majority of females (27; 84.4%) and males (35; 58.3%) agreed that the instructions were easy to follow (table 3). the majority of females (18; 56.3%) disagreed with the statement that responding by sms was hard, while the majority of males (32; 53.3%) were neutral about the statement. the majority of females (19; 59.4%) and males (35; 58.3%) agreed that they were comfortable answering the questions. reasons for not responding included not activating the sim card (females: 2, 6.3%; males: 3, 5.0%), having technical issues (females: 2, 6.3%; males: 4, 6.7%) and other reasons (not further described; females: 8, 25.0%; males: 6, 10.0%). wpsar vol 13, no 2, 2022 | doi: 10.5365/wpsar.2022.13.2.918https://ojs.wpro.who.int/ 5 using sms for covid-19 quarantine monitoring in vanuatuvan gemert et al a χ2 tests were used to compare the characteristics of the intervention group with those of the control group. p < 0.05 was considered statistically significant. a χ2 tests were used to compare the response rates of the intervention group by demographic variable. there are some additional limitations to consider. first, the sample size of 540 participants could not be reached and, as a result, the study has reduced statistical power to compare the control and intervention groups. however, we note that the broader objectives of the study were to evaluate the acceptability, efficiency and utility of sms-based health monitoring, and the study was able to meet this objective. second, it was not possible to validate whether travellers in the intervention group were truly asymptomatic as opposed to those in the control group; however, participants in the intervention group each had a specimen tested for sars-cov-2, and all results were negative. third, the response rate to the evaluation among participants was low (31%) and, therefore, may not reflect the attitudes of all participants. however, some important findings about ways to improve response rates by sms in the future were identified. conclusions the findings of this research highlight that sms is a useful tool to monitor symptom development among people in quarantine and that the intervention was both easy to understand and acceptable. the intervention achieved a 50% response rate, despite some technical difficulties. our results suggest that both sms and phone monitoring are acceptable methods, but that sufficient systems to identify and troubleshoot technological issues are required. in addition, our findings suggest that the use of one-way sms rather than two-way (that is, communicating information by sms without requiring a response) may be successful. table 1. characteristics of participants table 2. characteristics of the 212/253 people in the intervention group for whom there was evidence that an sms (short message service) text was received requesting information about their symptoms characteristic no. (%) of participants pa control group intervention group total 170 (40.2) 253 (59.8) sex female 48 (28.2) 45 (17.8) 0.011 male 122 (71.8) 208 (82.2) age group (years) 18–40 119 (70.0) 193 (76.3) >0.05 >40 51 (30.0) 60 (23.7) nationality vanuatu 159 (93.5) 243 (96.0) >0.05 other 11 (6.5) 10 (4.0) characteristic no. (%) of intervention participants pa no sms returned 1–5 sms returned >5 sms returned total 105 (49.5) 52 (24.5) 55 (25.9) sex female 12 (11.4) 13 (25.0) 9 (16.4) >0.05 male 93 (88.6) 39 (75.0) 46 (83.6) age group (years) 18–40 75 (71.4) 40 (76.9) 45 (81.8) >0.05 >40 30 (28.6) 12 (23.1) 10 (18.2) nationality vanuatu 2 (1.9) 1 (1.9) 5 (9.1) >0.05 other 103 (98.1) 51 (98.1) 50 (90.9) wpsar vol 13, no 2, 2022 | doi: 10.5365/wpsar.2022.13.2.918 https://ojs.wpro.who.int/6 van gemert et alusing sms for covid-19 quarantine monitoring in vanuatu ethics committee (number 2057578.1). all participants received 1000 vatu (approximately us$ 9.20) of phone credit from digicel vanuatu at the completion of the study. conflicts of interest caroline van gemert holds an early career research fellowship, funded by the australian national health and medical research council. the other authors declare they have no conflicts of interest. funding the vanuatu health program funded this research. the vanuatu health program is funded by the australian department of foreign affairs and trade’s australian aid program. references 1. coronavirus disease 2019 (covid-19): vanuatu situation report 3–23 march 2020. port vila: vanuatu ministry of health; 2020. available from: https://covid19.gov.vu/images/situation-reports/ situation_report_3.pdf, accessed 31 may 2021. 2. domek gj, contreras-roldan il, o’leary st, bull s, furniss a, kempe a, et al. sms text message reminders to improve infant vaccination coverage in guatemala: a pilot randomized controlled trial. vaccine. 2016;34(21):2437–43. doi:10.1016/j.vaccine.2016.03.065 pmid:27026145 3. menzies r, heron l, lampard j, mcmillan m, joseph t, chan j, et al. a randomised controlled trial of sms messaging and calendar reminders to improve vaccination timeliness in infants. vaccine. 2020;38(15):3137–42. doi:10.1016/j.vaccine.2020.02.045 pmid:32147296 4. pintye j, rogers z, kinuthia j, mugwanya kk, abuna f, lagat h, et al. two-way short message service (sms) communication may increase pre-exposure prophylaxis continuation and adherence among pregnant and postpartum women in kenya. glob health sci pract. 2020;8(1):55–67. doi:10.9745/ghsp-d-19-00347 pmid:32139420 5. wagstaff a, van doorslaer e, burger r. sms nudges as a tool to reduce tuberculosis treatment delay and pretreatment loss to followup. a randomized controlled trial. plos one. 2019;14(6):e0218527. doi:10.1371/journal.pone.0218527 pmid:31220140 6. bourne c, zablotska i, williamson a, calmette y, guy r. promotion and uptake of a new online partner notification and retesting reminder service for gay men. sex health. 2012;9(4):360–7. doi:10.1071/sh11132 pmid:22877596 7. effler pv, carcione d, giele c, dowse gk, goggin l, mak db. household responses to pandemic (h1n1) 2009-related school closures, perth, western australia. emerg infect dis. 2010;16(2):205–11. doi:10.3201/eid1602.091372 pmid:20113548 the findings show that sms is not inferior to in-person symptom detection and may be more effective than other methods, such as telephone calls. these findings have implications for covid-19 responses in resource-limited settings as well as relevance to broader public health programmes that require follow up. ethics statement ethical approval was obtained from the vanuatu ministry of health ethics and research committee (6 october 2020) and the university of melbourne human research table 3. responses to post-intervention evaluation by 92/253 participants in the intervention group evaluation category no. (%) of intervention participants female (n = 32) male (n = 60) ease and acceptability of the intervention instructions were easy to follow agree 27 (84.4) 35 (58.3) neutral 4 (12.5) 21 (35.0) disagree 1 (3.1) 2 (3.3) missing 0 (0.0) 2 (3.3) responding was hard agree 2 (6.3) 11 (18.3) neutral 10 (31.3) 32 (53.3) disagree 18 (56.3) 12 (20.0) missing 2 (6.3) 5 (8.3) i felt comfortable answering the questions agree 19 (59.4) 35 (58.3) neutral 8 (25.0) 21 (35.0) disagree 4 (12.5) 2 (3.3) missing 1 (3.1) 2 (3.3) reason for not responding i had technical issues 2 (6.3) 4 (6.7) i did not receive any messages 1 (3.1) 6 (10.0) i did not understand the instructions 0 (0.0) 15 (25.0) i did not activate the sim card 2 (6.3) 3 (5.0) i forgot 1 (3.1) 9 (15.0) other 8 (25.0) 6 (10.0) missing 18 (56.3) 17 (28.3) wpsar vol 13, no 2, 2022 | doi: 10.5365/wpsar.2022.13.2.918https://ojs.wpro.who.int/ 7 using sms for covid-19 quarantine monitoring in vanuatuvan gemert et al 10. olsen sj, azziz-baumgartner e, budd ap, brammer l, sullivan s, pineda rf, et al. decreased influenza activity during the covid-19 pandemic–united states, australia, chile, and south africa, 2020. am j transplant. 2020;20(12):3681–5. doi:10.1111/ajt.16381 pmid:33264506 11. vanuatu covid-19 surveillance: weekly summary report. port vila: vanuatu ministry of health; 2021. available from: https://covid19.gov.vu/ images/surveilllance-reports/wk17_vanuatu_covid-19_surveillance_ report_-_report_-_simplified.pdf, accessed 31 may 2021. 8. rational use of personal protective equipment for coronavirus disease 2019 (covid-19): interim guidance, 6 april 2020. geneva: world health organization; 2020. available from: https:// apps.who.int/iris/handle/10665/331695, accessed 31 may 2021. 9. public health surveillance for covid-19: interim guidance, 7 august 2020. geneva: world health organization; 2020. available from: https://apps.who.int/iris/handle/10665/333752, accessed 31 may 2021. spatial distribution of tuberculosis in a rural region of western province, papua new guinea original research tanya diefenbach-elstob,a,b vanina guernier-cambert,b bisato gula,c robert dowi,c daniel pelowa,c william pomat,d catherine rush,a,b david plummer,a emma mcbryde,b and jeffrey warner,a,b a college of public health, medical and veterinary sciences, james cook university, townsville, qld 4811, australia. b australian institute of tropical health and medicine, james cook university, townsville, qld 4811, australia. c balimo district hospital, balimo, western province, papua new guinea. d papua new guinea institute of medical research, goroka, eastern highlands province, papua new guinea. correspondence to tanya diefenbach-elstob (email: tanya.diefenbachelstob@gmail.com). to cite this article: diefenbach-elstob t, guernier-cambert v, gula b, dowi r, pelowa d, pomat w, et al. spatial distribution of tuberculosis in a rural region of western province, papua new guinea. western pac surveill response j. 2019 dec;10(4). doi:10.5365/wpsar.2019.10.2.001 introduction: there is a high burden of tuberculosis (tb) in the western province, papua new guinea. this study aims to describe the spatial distribution of tb in the balimo district hospital (bdh) catchment area to identify tb patient clusters and factors associated with high rates of tb. methods: information about tb patients was obtained from the bdh tb patient register for the period 26 april 2013 to 25 february 2017. the locations of tb patients were mapped, and the spatial scan statistic was used to identify highand low-rate tb clusters in the bdh catchment area. results: a total of 1568 patients were mapped with most being from the balimo urban (n = 252), gogodala rural (n = 1010) and bamu rural (n = 295) local level government (llg) areas. in the gogodala region (balimo urban and gogodala rural llgs), high-rate clusters occurred closer to the town of balimo, while low-rate clusters were located in more remote regions. in addition, closer proximity to balimo was a predictor of high-rate clustering. discussion: there is heterogeneity in the distribution of tb in the balimo region. active case-finding activities indicated potential underdiagnosis of tb and the possibility of associated missed diagnoses of tb. the large bdh catchment area emphasizes the importance of the hospital in managing tb in this rural region. western province in papua new guinea (png) has a very high burden of tuberculosis (tb) with a case notification rate of 674 per 100 000 people in 2016.1 tb is known to cause a high burden of disease in balimo and the gogodala region of the middle fly district; the average reported incidence of tb at balimo district hospital (bdh) was 727 cases per 100 000 people per year from 2014 to 2016 for people in the combined balimo and gogodala local level government (llg) areas.2 furthermore, rates of paediatric and extrapulmonary tb have been identified as very high, with 25.0% of patients aged 0–14 years, and 77.1% of patients diagnosed with extrapulmonary tb infection.2 bdh is the primary facility providing tb diagnosis and dots-based treatment in the gogodala region. other smaller health facilities, including health clinics and aid posts, can provide limited tb services such as clinical extrapulmonary tb diagnosis and treatment and pulmonary tb services when a sputum sample is not able to be transferred to the town of balimo.2 given the high burden of tb reported at bdh, there is a need to understand the distribution of tb in the balimo region. such analysis will provide insight into areas with high and low rates of tb as well as evidence to support the focused delivery of tb services. this study used spatial epidemiology techniques to (1) define the catchment area of bdh, (2) identify clustering of tb in the bdh catchment area and (3) investigate factors associated with high rates of tb. the approach aimed to illustrate the local tb burden in the context of the geography of this remote region of png, using mapping to illustrate the results as a complement to the underlying quantitative spatial analysis. study population and methods study setting and patient cohort patient data were obtained from the bdh tb patient register, which includes all patients diagnosed and commenced on tb treatment at bdh, as described previously.2 tb patients may be bacteriologically confirmed using smear microscopy or diagnosed clinically as occurs for the majority of cases in the balimo region, in accordance with the world health organization (who) case definitions and png national tuberculosis management protocol.2–4 in this study, patient locations were identified as the first village recorded as a residential address for each patient. out of 1614 tb patients registered from 26 april 2013 to 25 february/2017, 1568 were mapped after excluding patients from outside western province (n = 13) and those for whom a residential address could not be determined (n = 33). geographic and population data this study focused on the balimo urban (population 4394), gogodala rural (population 33 033) and bamu rural (population 13 432) llg areas. in png, llg areas are subdivided into rural wards and urban areas and further subdivided into census units. for this study, each patient’s location was matched to a census unit and from there to an electoral ward based primarily on png census data or, alternatively, on the 2012 and 2017 png government election polling schedules.5,6 instances of alternate local names were checked and confirmed locally. provincial, district and llg boundary data and latitude and longitude coordinates of census units were obtained from the png national statistical office and census data. for coordinates that could not be obtained from census data, alternate sources including arcgis online (esri, redlands, ca, usa) and a 2018 google search were used. population data for electoral wards used the 2011 national census figures7 to describe the underlying population at risk in the cluster analyses and logistic regression. population size was not projected to later years as ward-level population growth data were not available. mapping and cluster analyses the residential locations of tb patients diagnosed at bdh were mapped to identify the bdh catchment area (i.e. the region served by the hospital as defined by the origins of tb patients who have travelled to the hospital). mapping of residential locations was primarily based on census unit-level coordinates. however, patients from some locations were mapped based on the average coordinates of a combination of census units as the precise census unit was rarely known for these patients. average ward coordinates were calculated using the geographic midpoint calculator available in 2017. there were four locations where all census units within a ward were averaged and four locations where the averaged coordinates included several census units within a ward. towns and villages are depicted in figures 1 to 3 spatially as dots as we did not have access to georeferenced boundaries at the ward level for this region of png. cluster analyses were undertaken separately for the gogodala and bamu regions using averaged ward-level coordinates and ward-level population data. the gogodala region included the 39 gogodala rural llg wards plus balimo urban llg; the bamu region included the 19 bamu rural llg wards.7 eleven patients located within western province but outside the gogodala and bamu regions were excluded from the cluster analyses. cluster analyses based on paediatric and extrapulmonary tb cases were undertaken to compare clusters in these patient groups to the overall cluster analysis. these subanalyses used the same underlying population and coordinate data but with case data restricted to patient subgroups in the gogodala region only. age-stratified population data were not available for the wards in this region, so geographic differences in age distribution were not taken into account in the overall analysis. the spatial scan statistic was calculated using satscantm (version 9.6) (satscan, boston, ma., usa).8 a discrete poisson probability model was used because occurrence of the disease is rare.9,10 the data were scanned for areas with either highor low-rate clusters. a circular spatial window was used, and the maximum spatial cluster size was set at the default size of 50% of the population at risk. the analyses were run with the default 999 replications with statistical significance set at p 10,11 shapefiles depicting cluster areas were generated using satscantm. all maps were created using arcgis arcmap 10.4.1(esri, redlands, ca., usa) and used the world topographic map basemap layer provided within the arcgis online package. investigation of high-rate tb clusters for wards in the gogodala region, univariate and multivariate logistic regression were used to investigate the relationship between ward-level demographic and geographic variables and the occurrence of wards in significant high-rate tb cluster areas. based on ward-level population data, the predictor variables included gender ratio (total males/total females), housing density (total ward population/total number of households in the ward) and distance from balimo (distance in kilometres from the averaged balimo coordinates to the averaged ward coordinates). distance was calculated using the national hurricane center latitude/longitude distance calculator.12 statistical analyses were performed using stata/ic version 14 (statacorp llc, college station, tx., usa). ethics approval this study received local approval from the middle fly district health service and the evangelical church of png health service. human research ethics approval was received from the james cook university human research ethics committee (h6432) and the png medical research advisory committee (mrac no. 17.02). results the 1568 tb patients were identified at 90 localities across western province. these locations, shown in fig. 1, are based on census unit-level coordinates (averaged where relevant; see methods) and delineated by the llg boundaries of western province. the catchment area is depicted with the majority of patients originating from the balimo urban (n = 252) and gogodala rural (n = 1010) llg areas with a large number also in bamu rural llg (n = 295). eleven patients were located in other llgs in western province. click to download figure 1. jpg, 453kb cluster analyses highand low-rate tb clusters are described in table 1, and depictions in fig. 2 (for the gogodala region, n = 1262) and fig. 3 (for the bamu region, n = 295) are based on the ward-level population and tb patient data. cluster numbers included in table 1 correspond to the cluster numbers depicted in fig. 2 and 3. the optimal gini coefficients were found at 20% of the population in the gogodala region and at 10–12% of the population in the bamu region; paediatric tb and extrapulmonary tb subgroups were at 12% and 20%, respectively. only clusters with less than these proportions of the population at risk were reported for each region. in the gogodala region, high-rate clusters were generally identified closer to balimo, while low-rate clusters were seen on the outskirts of the region (fig. 2). this trend continued to be evident for the paediatric (n = 283) and extrapulmonary tb (n = 978) subgroups (fig. 2). in the bamu region, three high-rate clusters were identified in the lower regions of the bamu and gama rivers; low-rate clusters were identified further along the gama river and in the far north of the bamu rural llg (fig. 3). click to download table 1. jpg, 361kb click to download figure 2. jpg, 735kb click to download figure 3. jpg, 575kb the logistic regression results for predictors of ward-level high-rate tb clusters are summarized in table 2. in both the univariate and multivariate analyses, wards in high-rate tb clusters were associated with closer proximity to balimo. housing density had an odds ratio of 0.63 (95% ci: 0.34–1.20) in the univariate analysis, while the odds ratio in the multivariate analysis was 1.26 (95% ci: 0.55–2.90), suggesting confounding between housing density and distance from balimo in this analysis. click to download table 2. jpg, 190kb discussion this study examined the spatial distribution of tb patients diagnosed at bdh. the extensive hospital catchment area highlights the considerable distance that people travel to seek care for tb symptoms; however, the capacity to travel may help define and explain the lower case numbers in communities located further away from a health centre. in the gogodala and bamu regions, both highand low-rate tb clusters were identified, illustrating the heterogeneity of reported tb burden across the region with a substantially higher tb burden evident in closer proximity to balimo. most villages in the gogodala rural llg had tb cases identified during the study period. villages with no reported tb patients were predominantly located south of balimo near the fly river. geographic challenges may be particularly important for people from this area as travel to either balimo or daru is lengthy, and fuel to travel by motorized boat to daru is expensive. however, some patients were reported from the gogodala region between balimo and the fly river, which may reflect a choice to travel to balimo or, potentially, referral from a peripheral health facility in the region. overall, villages with no or low rates of tb should be noted for future investigation to identify people symptomatic for tb and describe treatment-seeking practices. in this study, low-rate clusters occurred in more remote areas, while closer proximity to balimo was a predictor of a ward located in a high-rate tb cluster. this association is potentially linked with underdiagnosis of tb in more remote areas as less arduous travel will promote better access to care. if villages in high-rate tb clusters reflect accurate rates of tb for the region more generally, villages with low rates of tb may indicate underdiagnosis of tb and are sites where active tb investigations should be undertaken. this finding is important as other research from our group has described potential underdiagnosis of tb in the balimo region.13 the possibility of underdiagnosis of tb was emphasized by results from the cluster analysis for the bamu rural llg region. the high-rate clusters in three of these wards are the result of non-routine active case-finding activities. during an eight-day period in march 2016, 96 patients from eight villages in the bamu rural llg region, including villages in these three high-rate cluster wards, were diagnosed with tb. by comparison, only 31 patients from these eight villages were diagnosed over the remainder of the study period. these diagnoses demonstrate the potential of an even higher burden of tb in remote and difficult-to-reach locations, reflecting people who may not otherwise have been diagnosed with tb. the geographically distant low-rate clusters seen in the bamu rural llg likely reflect a combination of access challenges and the possibility of travel by patients to health centres other than bdh for tb care. other studies have described higher tb density in regions with closer proximity to urbanized areas and delayed treatment-seeking in people who travelled to a health facility by foot, while increased distance and poorer access to health facilities have been associated with diagnostic delay in some resource-limited settings.14–17 in addition, urbanization has been associated with higher rates of tb as a result of factors such as overcrowding and increased tb transmission risk;18,19 however, it is notable that housing density in balimo was below average for the 40 gogodala region wards (density of 6.9 people per household compared to an average of 7.4). previous research in png has noted the importance of challenging travel in the context of tb care, including in the gogodala region where travel is primarily by boat or by foot.20,21 in addition, where travel by boat is possible, socioeconomic factors and affordability of fuel will play a role in the ability to travel.20 other factors, including proximity to a health facility, health worker training and local tb awareness activities have been associated with increased tb notifications.22–25 in the gogodala region, possible reasons for locations with high case density include the presence of an actively staffed aid post or health clinic that regularly refers presumptive tb patients or increased case-finding or awareness activities. high rates of paediatric and extrapulmonary tb have previously been identified in the balimo region.2 separate cluster analysis of these patient subgroups identified similar patterns to the overall distribution of tb in the gogodala region. this finding may indicate similar tb transmission patterns across the region as well as consistency in the approach to identifying tb in a region where diagnoses are predominantly based on clinical signs and symptoms. awaba has the largest health centre in the gogodala region outside of balimo. the low-rate cluster identified in the awaba ward is due to registration of tb patients diagnosed and started on tb treatment at the awaba health centre instead of at bdh. the awaba tb register was not available for this study, although tb incidence at the centre was estimated to be 381 cases per 100 000 people per year in a 2011 western province tb evaluation study.26 in our study, the 11 patients from within western province but outside the gogodala and bamu regions may be important when considering importation of tb into the gogodala region. seven of these patients had alternative addresses recorded within the gogodala and bamu regions, including two at logging camps and one at a school. this suggests mobility of people in the region, particularly in the context of education and employment, which is important when considering that schools and workplaces can be important sites of tb transmission.27,28 in this analysis, it was assumed that a tb patient’s first recorded address was where they were living at the time of registration. however, people with more than one address recorded may be more mobile, particularly if travelling between their residential and home villages (i.e. place of birth or family village) or workplace. thus, some patient locations may not have reflected the location where tb infection occurred. an unknown number of tb patients were registered at smaller health facilities in the balimo region. although such patient numbers are likely to be low, these facilities will have influenced the analyses to an unknown extent. in addition, the tb patients identified and described here will not include balimo-region patients diagnosed and commenced on treatment in the provincial capital of daru. finally, this analysis was based on population data collected in the 2011 png census. thus tb rates may have been inaccurate for wards that experienced unusually high or low growth in the time before and during our study period of 2013 to 2017. conclusions this analysis provides insight into tb distribution in the bdh catchment area. the results provide baseline data about tb distribution across the region as well as targeted information that points to the need for villageand ward-specific tb investigations. in this region, tb clustering likely reflects the ease with which people can travel and seek treatment, demonstrating the importance of access to health services. however, investigation of high-rate tb clusters, as well as diagnoses resulting from targeted case-finding activities, emphasize the high potential for missed tb diagnoses in the region. the potentially substantial burden of undiagnosed tb in the extensive catchment area of bdh indicates an urgent need for active case-finding activities both to reduce tb disease burden and prevent ongoing transmission of tb in the region. this study may help focus a more targeted active tb case detection programme. furthermore, these results emphasize the importance of targeted investment in resources and facilities in the middle fly district to improve and strengthen the provision of tb care in western province. acknowledgements we thank mr suli gayani and mr kimsy waiwa for their support of this project and acknowledge dr patricia graves and dr peter wood for their contributions to the methods and design of this work. research undertaken by tanya diefenbach-elstob was supported by an australian government research training program (rtp) scholarship. references aia p, wangchuk l, morishita f, kisomb j, yasi r, kal m, islam t. epidemiology of tuberculosis in papua new guinea: analysis of case notification and treatment-outcome data, 2008-2016. west pac surveill response j. 2018 jun 15;9(2):9–19. doi:10.5365/wpsar.2018.9.1.006 pmid:30057853 diefenbach-elstob t, graves p, dowi r, gula b, plummer d, mcbryde e, pelowa d, siba p, pomat w, warner j. the epidemiology of tuberculosis in the rural balimo region of papua new guinea. trop med int health. 2018 sep;23(9):1022–32. doi:10.1111/tmi.13118 pmid:29920858 department of health. papua new guinea: national tuberculosis management protocol. port moresby, papua new guinea: department of health; 2011. available from: https://www.adi.org.au/wp-content/uploads/2016/11/national-tuberculosis-management-protocol-png-2011.pdf world health organization. definitions and reporting framework for tuberculosis 2013 revision (updated december 2014). geneva (switzerland): world health organization; 2013. available from: https://apps.who.int/iris/bitstream/10665/79199/1/9789241505345_eng.pdf papua new guinea electoral commission. election commencing 23 june 2012: polling schedule for middle fly electorate. 2012. available from: https://garamut.files.wordpress.com/2012/06/western_middle-fly-schedule.pdf papua new guinea electoral commission. election commencing 20th april 2017: polling schedule for middle fly open electorate. port moresby: papua new guinea electoral commission. 2017. available from: http://www.pngec.gov.pg/docs/default-source/default-document-library/polling-schedule-v6.pdf national statistical office. 2011 national population & housing census: ward population profile southern region. port moresby, national statistical office; 2014. available from: http://www.nso.gov.pg/index.php/document-library?view=download&fileid=64 kulldorff m, information management services, inc. satscantm: software for the spatial and space-time scan statistics. boston, ma: satscantm; 2005. available from: https://www.satscan.org/ kulldorff m. a spatial scan statistic. commun stat theory methods. 1997;26(6):1481–96. doi:10.1080/03610929708831995 kulldorff m. satscantm user guide for version 9.6. boston, ma: satscantm; 2018. available from: https://www.satscan.org/techdoc.html han j, zhu l, kulldorff m, hostovich s, stinchcomb dg, tatalovich z, lewis dr, feuer ej. using gini coefficient to determining optimal cluster reporting sizes for spatial scan statistics. int j health geogr. 2016 aug 3;15(1):27. doi:10.1186/s12942-016-0056-6 pmid:27488416 national hurricane center. latitude/longitude distance calculator. miami, fl: us dept of commerce national oceanic and atmospheric administration. available from: https://www.nhc.noaa.gov/gccalc.shtml guernier v, diefenbach-elstob t, pelowa d, pollard s, burgess g, mcbryde es, warner j. molecular diagnosis of suspected tuberculosis from archived smear slides from the balimo region, papua new guinea. int j infect dis. 2018 feb;67:75–81. doi:10.1016/j.ijid.2017.12.004 pmid:29229499 dangisso mh, datiko dg, lindtjørn b. spatio-temporal analysis of smear-positive tuberculosis in the sidama zone, southern ethiopia. plos one. 2015 jun 1;10(6):e0126369. doi:10.1371/journal.pone.0126369 pmid:26030162 yirgu r, lemessa f, hirpa s, alemayehu a, klinkenberg e. determinants of delayed care seeking for tb suggestive symptoms in seru district, oromiya region, ethiopia: a community based unmatched case-control study. bmc infect dis. 2017 apr 20;17(1):292. doi:10.1186/s12879-017-2407-8 pmid:28427367 babatunde oi, bismark ec, amaechi ne, gabriel ei, olanike a-ur. determinants of treatment delays among pulmonary tuberculosis patients in enugu metropolis, south-east, nigeria. health. 2015;7(11):1506–16. doi:10.4236/health.2015.711164 demissie m, lindtjørn b, berhane y. patient and health service delay in the diagnosis of pulmonary tuberculosis in ethiopia. bmc public health. 2002 sep 25;2(1):23. doi:10.1186/1471-2458-2-23 pmid:12296975 antunes jlf, waldman ea. the impact of aids, immigration and housing overcrowding on tuberculosis deaths in são paulo, brazil, 1994-1998. soc sci med. 2001 apr;52(7):1071–80. doi:10.1016/s0277-9536(00)00214-8 pmid:11266050 oppong jr, mayer j, oren e. the global health threat of african urban slums: the example of urban tuberculosis. african geographical review. 2015;34(2):182–95. doi:10.1080/19376812.2014.910815 diefenbach-elstob t, plummer d, dowi r, wamagi s, gula b, siwaeya k, pelowa d, siba p, warner j. the social determinants of tuberculosis treatment adherence in a remote region of papua new guinea. bmc public health. 2017 jan 13;17(1):70. doi:10.1186/s12889-016-3935-7 pmid:28086845 ongugo k, hall j, attia j. implementing tuberculosis control in papua new guinea: a clash of culture and science? j community health. 2011 jun;36(3):423–30. doi:10.1007/s10900-010-9324-8 pmid:21161347 datiko dg, yassin ma, theobald sj, blok l, suvanand s, creswell j, cuevas le. health extension workers improve tuberculosis case finding and treatment outcome in ethiopia: a large-scale implementation study. bmj glob health. 2017 nov 2;2(4):e000390. doi:10.1136/bmjgh-2017-000390 pmid:29209537 dangisso mh, datiko dg, lindtjørn b. accessibility to tuberculosis control services and tuberculosis programme performance in southern ethiopia. glob health action. 2015 nov 20;8(1):29443. doi:10.3402/gha.v8.29443 pmid:26593274 parija d, patra tk, kumar amv, swain bk, satyanarayana s, sreenivas a, chadha vk, moonan pk, oeltmann je. impact of awareness drives and community-based active tuberculosis case finding in odisha, india. int j tuberc lung dis. 2014 sep;18(9):1105–7. doi:10.5588/ijtld.13.0918 pmid:25189560 yassin ma, datiko dg, tulloch o, markos p, aschalew m, shargie eb, et al. innovative community-based approaches doubled tuberculosis case notification and improve treatment outcome in southern ethiopia. plos one. 2013 may 27;8(5):e63174. doi:10.1371/journal.pone.0063174 pmid:23723975 mcbryde e. evaluation of risks of tuberculosis in western province papua new guinea. barton. department of foreign affairs and trade; 2012. available from: https://www.burnet.edu.au/system/publication/file/3606/2012_evaluation_of_risks_of_tuberculosis_in_western_province_png.pdf andrews jr, morrow c, walensky rp, wood r. integrating social contact and environmental data in evaluating tuberculosis transmission in a south african township. j infect dis. 2014 aug 15;210(4):597–603. doi:10.1093/infdis/jiu138 pmid:24610874 mcelnay c, thornley c, armstrong r. a community and workplace outbreak of tuberculosis in hawke’s bay in 2002. n z med j. 2004 aug 20;117(1200):u1019. pmid:15475989 https://ojs.wpro.who.int/ 1wpsar vol 11, no 4, 2020 | doi: 10.5365/wpsar.2020.11.1.013 brief report a universiti brunei darussalam. b ministry of health, brunei darussalam. published: 13 november 2020 doi: 10.5365/wpsar.2020.11.1.013 h ow many people actually have coronavirus disease 2019 (covid-19)? valid data describing the number and distribution of covid-19 cases are critical for the design and implementation of containment strategies; however, timely and accurate measurement of disease incidence continues to pose challenges.1 to obtain an accurate picture of the scale of the outbreak, we reviewed the count of cases and tests, as well as the testing rate and the proportion of positive tests, in member states of the association of southeast asian nations (asean). asean is a 10-member grouping of countries with a population of over 650 million people.2 cases of covid-19 within asean were reported first in thailand and then singapore in january 2020 and later in other asean countries, with the first death outside china reported in the philippines. to date, covid-19 has affected all countries in the asean region, with many imposing community quarantines and all restricting travel to varying degrees.3 no country knows the true number of people infected with covid-19. all that can be ascertained is the status of those who have been tested. the total number of people who have tested positive – the number of confirmed cases – is not the total number of people who have been infected. the number of covid-19 cases reported in a country is dependent on its surveillance sensitivity and laboratory testing capacity. the criteria for laboratory testing are also important because countries screen and test “suspect cases” based on clinical symptoms and a relevant epidemiological history.4,5 it is likely that in some asean countries, cases of covid-19 may be undetected because of restrictive case definitions of suspect cases or limited testing capability to possible issues with case ascertainment in the early phases of asean countries’covid-19 responses, we reviewed information on testing and cases obtained from ministries of health and online news sources from march–april 2020 (table 1). we provide an overview important testing indicators in asean countries during this phase of the covid-19 pandemic and discuss the utility of testing coverage, positivity rate and criteria for testing. one indicator of the reliability of testing data is testing coverage, or the number of tests conducted per 100 000 population. generally, we would expect that there are two reasons that countries with higher testing coverage have more reliable data on confirmed cases. first, a greater degree of testing provides us with a larger “sample” of people for whom disease status is known. second, it may be the case that where the capacity for testing is low, tests may be reserved for particularly high-risk groups. such rationing is one reason that those people tested may not be representative of the wider population. as observed in table 1, all countries increased their testing coverage from march to april 2020, and marked heterogeneity exists across countries. we note that across all countries, the number of cases increased dramatically in march and april 2020. in addition to the expansion of testing for severe acute respiratory syndrome coronavirus 2 (sars-cov-2), the virus that causes covid-19, this pattern of rapid case increase in some countries could also have been reflective of community transmission. a second indicator we highlight in table 1 is the test positivity rate (tpr), defined as the number of confirmed covid-19 cases per 100 tests. tpr is widely used by malaria surveillance programmes as one of several key indicators of temporal trends in malaria incidence.6 for covid-19, who interim guidance notes percent positive as an epidemiological factor to be used in risk assessments for countries.7 we support that this indicator may be of utility with respect to the assessment of covid-19 in asean country contexts. at the beginning of the outbreak, when the covid-19 caseload was low, a smaller number of tests was needed to accurately assess the spread of the virus. as the disease spreads, testing coverage needed to expand to provide a reliable picture of the true number of infected people. tpr can also be useful in determining whether or not an apparent testing for covid-19 cases in asean david sq koh,a sheena xm wong,a justin wongb correspondence to david koh (email: david.koh@ubd.edu.bn) wpsar vol 11, no 4, 2020 | doi: 10.5365/wpsar.2020.11.1.013 https://ojs.wpro.who.int/2 koh et altesting for covid-19 cases in asean case definitions, population or clinic-based fever surveillance, along with testing suspect cases, would provide a more accurate understanding of sars-cov-2 transmission. this is particularly relevant in view of the varied and non-specific clinical presentation of covid-19. both random testing and targeted testing, particularly among individuals in high-risk settings such as health care, have merit and need to be conducted simultaneously. second, all cases reported by asean countries in this dataset were diagnosed based on viral detection by polymerase chain reaction tests, which cannot detect resolved infections,9 and depending on testing criteria, may have missed asymptomatic or mild infections, because such people may not be tested. while acknowledging current limitations and variable test performance characteristics, we recommend large-scale seroprevalence studies as one additional measure to identify the best available estimate of disease burden and to compare with reports from existing surveillance systems. longitudinal cohort studies that estimate seroprevalence can also assist in estimating trends in disease transmission over time. third, as a regional grouping, with significant volumes of travel and trade among member states, increase in incidence is a result of better case detection, or a true increase. for example, if incidence is calculated using total population as a denominator and is found to be higher than usual, this could indicate a true increase in incidence. however, if the tpr shows a declining trend, it may suggest that this apparent increase is actually a result of better testing.8 here, we observe wide discrepancies across countries, with viet nam having a tpr of 0.1%, compared with singapore having a tpr of 16%. a high tpr could be an indicator of under-detection, as tests may be reserved for those with a high probability of having the disease. individuals who have the disease but are asymptomatic may not be detected. broad surveillance strategies should encounter far more people who are not infected than people who are, so the tpr should be lower. based on our findings, we make three observations. first, some countries established additional surveillance by performing laboratory tests for sars-cov-2 for patients with pneumonia or selected community cases of influenza-like illness.9 to get a clearer sense of sars-cov-2 transmission intensity, countries need to broaden criteria for testing. rather than testing solely based on restrictive suspect country population (millions) confirmed cases no. of individuals tested individuals tested per 100 000 test positivity rate (%) who transmission classification as of 30 aprearly mar 29 apr early mar end apr early mar end apr early mar end apr singapore 5.8 117 15 641 130025f 99 92927a 23 1772 9 16 clusters of cases malaysia 32 55 5945 100025f 154 20329a 3 489 5.5 4 clusters of cases thailand 69 47 2947 36803m 62 01829a 5 89 1.3 5 clusters of cases viet nam 97 16 270 n/a 261 00429a 0 273 n/a 0 clusters of cases philippines 109 3 8212 n/a 88 86928a 0 83 n/a 9 clusters of cases indonesia 273 2 9771 3313m 67 78429a 0 18 0.6 14 community transmission cambodia 16.7 1 122 2275m 11 57627a 1 71 0.44 1 sporadic cases myanmar 54 0 150 435m 771829a 0 14 0 2 clusters of cases lao people's democratic republic 7.2 0 19 545m 179627a 1 25 0 1 sporadic cases brunei darussalam 0.43 0 138 325m 13 42829a 7 3130 0 1 sporadic cases 25f as of 25 february,5m as of 5 march,28a as of 28 april,3m as of 3 march,27a as of 27 april,29a as of 29 april source: ministries of health; who coronavirus disease 2019 (covid-19) situation report – 101, 30 apr 2020. note: all asean countries require a positive polymerase chain reaction test for sars-cov-2 to confirm a case. table 1. confirmed covid-19 cases and laboratory tests performed in asean countries (march-april 2020) wpsar vol 11, no 4, 2020 | doi: 10.5365/wpsar.2020.11.1.013https://ojs.wpro.who.int/ 3 testing for covid-19 cases in aseankoh et al asean countries have a vested interest in assessing disease burden as they move towards de-escalation of travel restrictions and other restrictions on movement. to increase transparency and build trust, we suggest that countries report not only the number of confirmed cases in their country, but also the number of people tested or tests performed, and the criteria for such testing. references 1. tang yw, schmitz je, persing dh, stratton cw. laboratory diagnosis of covid-19: current issues and challenges. j clin microbiol. 2020 may 26;58(6):e00512-20. doi:10.1128/jcm.00512-20 pmid:32245835 2. statistical yearbook asean. 2019. available from: https://www. aseanstats.org/wp-content/uploads/2020/01/asyb_2019.pdf, accessed 30 april 2020 3. yang z. global health security – asean-china covid-19 meeting: why and what’s next? (rsis commentaries, no. 032). rsis commentaries. singapore: nanyang technological university; 2020 4. world health organization. global surveillance for covid-19 caused by human infection with covid-19 virus. interim guidance. 20 march 2020. available from: https://apps.who.int/iris/ bitstream/handle/10665/331506/who-2019-ncov-surveillanceguidance-2020.6-eng.pdf, accessed 30 april 2020 5. koh d, cunningham ac. counting coronavirus disease 2019 (covid-19) cases: case definitions, screened populations and testing techniques matter. ann acad med singapore. 2020;49:161–5. pmid:32301478 6. boyce rm, reyes r, matte m, ntaro m, mulogo e, lin fc, et al. practical implications of the non-linear relationship between the test positivity rate and malaria incidence. plos one. 2016 mar 28;11(3):e0152410. doi:10.1371/journal.pone.0152410 pmid:27018990 7. world health organization. considerations in adjusting public health and social measures in the context of covid-19: interim guidance, 16 april 2020. available from: https://apps.who.int/iris/ handle/10665/331773. 8. lambert sb, faux ce, grant ka, williams sh, bletchly c, catton mg, et al. influenza surveillance in australia: we need to do more than count. med j aust. 2010 jul 5;193(1):43–5. doi:10.5694/j.1326-5377.2010.tb03741.x pmid:20618114 9. pung r, chiew cj, young be, chin s, chen mic, clapham he, et al.; singapore 2019 novel coronavirus outbreak research team. investigation of three clusters of covid-19 in singapore: implications for surveillance and response measures. lancet. 2020 mar 28;395(10229):1039–46. doi:10.1016/s0140-6736(20)305286 pmid:32192580 10. bendavid e, mulaney b, sood n, shah s, ling e, bromley-dulfano r, et al. covid-19 antibody seroprevalence in santa clara county, california. medrxiv (preprint) doi: 10.1101/2020.04.14.20062463 https://doi.org/10.1128/jcm.00512-20 https://www.ncbi.nlm.nih.gov/entrez/query.fcgi?cmd=retrieve&db=pubmed&list_uids=32245835&dopt=abstract https://www.ncbi.nlm.nih.gov/entrez/query.fcgi?cmd=retrieve&db=pubmed&list_uids=32245835&dopt=abstract https://www.aseanstats.org/wp-content/uploads/2020/01/asyb_2019.pdf https://www.aseanstats.org/wp-content/uploads/2020/01/asyb_2019.pdf https://apps.who.int/iris/bitstream/handle/10665/331506/who-2019-ncov-surveillanceguidance-2020.6-eng.pdf https://apps.who.int/iris/bitstream/handle/10665/331506/who-2019-ncov-surveillanceguidance-2020.6-eng.pdf https://apps.who.int/iris/bitstream/handle/10665/331506/who-2019-ncov-surveillanceguidance-2020.6-eng.pdf https://www.ncbi.nlm.nih.gov/entrez/query.fcgi?cmd=retrieve&db=pubmed&list_uids=32301478&dopt=abstract https://www.ncbi.nlm.nih.gov/entrez/query.fcgi?cmd=retrieve&db=pubmed&list_uids=32301478&dopt=abstract https://doi.org/10.1371/journal.pone.0152410 https://www.ncbi.nlm.nih.gov/entrez/query.fcgi?cmd=retrieve&db=pubmed&list_uids=27018990&dopt=abstract https://www.ncbi.nlm.nih.gov/entrez/query.fcgi?cmd=retrieve&db=pubmed&list_uids=27018990&dopt=abstract https://apps.who.int/iris/handle/10665/331773 https://apps.who.int/iris/handle/10665/331773 https://doi.org/10.5694/j.1326-5377.2010.tb03741.x https://www.ncbi.nlm.nih.gov/entrez/query.fcgi?cmd=retrieve&db=pubmed&list_uids=20618114&dopt=abstract https://doi.org/10.1016/s0140-6736(20)30528-6 https://doi.org/10.1016/s0140-6736(20)30528-6 https://www.ncbi.nlm.nih.gov/entrez/query.fcgi?cmd=retrieve&db=pubmed&list_uids=32192580&dopt=abstract https://ojs.wpro.who.int/ 1wpsar vol 12, no 1, 2021 | doi: 10.5365/wpsar.2020.11.1.005 original research a antimicrobial resistance surveillance reference laboratory, research institute for tropical medicine, muntinlupa, philippines. b centre for genomic pathogen surveillance, wellcome genome campus, hinxton, england, united kingdom. c brigham and women’s hospital, boston (ma), usa. d university of st andrews school of medicine, st andrews, scotland, united kingdom. e centre for genomic pathogen surveillance, big data institute, university of oxford, oxford, england, united kingdom. † these authors contributed equally to this work. * these authors contributed equally to this work. published: 26 february 2021 doi: 10.5365/wpsar.2020.11.1.005 n eisseria gonorrhoeae is a leading cause of sexually transmitted infections, with an estimated 78 million cases of gonorrhoea each year worldwide, including 35.2 million in the who western pacific region.1 in the philippines, the prevalence of gonorrhoea in 2002 was reported to be <2% for both men and women,2 with higher rates of 7.7% and 10.8% among men who have sex with men at two different sites in 2005.3 n. gonorrhoeae has developed resistance to first-line antibiotics such as sulfonamides, penicillins, tetracyclines, macrolides, fluoroquinolones and early cephalosporins. currently recommended monotherapy for gonorrhoea is limited to one last effective class of antimicrobials, the extended-spectrum cephalosporins (e.g. cefixime and ceftriaxone); however, because of the recent emergence of resistance to these drugs, dual therapy with the injectable ceftriaxone plus oral azithromycin is the recommended treatment in many countries.4 while resistance to azithromycin has also increased globally,1 resistance to the dual therapy remains low.5 the increase in n. gonorrhoeae infections resistant to front-line antibiotics triggered a global action plan from who to control the spread and impact of gonococcal resistance and a call for international collaborative action, especially in the western pacific region.1 the who antimicrobial-resistant neisseria gonorrhoeae is a major threat to public health and is of particular concern in the western pacific region, where the incidence of gonorrhoea is high. the antimicrobial resistance surveillance program (arsp) has been capturing information on resistant gonorrhoea since 1996, but genomic epidemiology studies on this pathogen are lacking in the philippines. we sequenced the whole genomes of 21 n. gonorrhoeae isolates collected in 2013–2014 by arsp. the multilocus sequence type, multiantigen sequence type, presence of determinants of antimicrobial resistance and relatedness among the isolates were all derived from the sequence data. the concordance between phenotypic and genotypic resistance was also determined. ten of 21 isolates were resistant to penicillin, ciprofloxacin and tetracycline, due mainly to the presence of the blatem gene, the s91f mutation in the gyra gene and the tetm gene, respectively. none of the isolates was resistant to ceftriaxone or cefixime. the concordance between phenotypic and genotypic resistance was 92.38% overall for five antibiotics in four classes. despite the small number of isolates studied, they were genetically diverse, as shown by the sequence types, the n. gonorrhoeae multiantigen sequence typing types and the tree. comparison with global genomes placed the philippine genomes within global lineage a and led to the identification of an international transmission route. this first genomic survey of n. gonorrhoeae isolates collected by arsp will be used to contextualize prospective surveillance. it highlights the importance of genomic surveillance in the western pacific and other endemic regions for understanding the spread of drug-resistant gonorrhoea worldwide. genomic surveillance of neisseria gonorrhoeae in the philippines, 2013–2014 manuel c. jamoralin jr,a† silvia argimón,b† marietta l. lagrada,a alfred s. villamin,a melissa l. masim,a june m. gayeta,a karis d. boehme,a agnettah m. olorosa,a sonia b. sia,a charmian m. hufano,a victoria cohen,b lara t. hernandez,a benjamin jeffrey,b khalil abudahab,b john stelling,c matthew t.g. holden,d david m. aanensenb,e,* and celia c. carlosa,* on behalf of the philippines antimicrobial resistance surveillance program correspondence to celia carlos (ccarlosphl@gmail.com) and david m. aanensen (david.aanensen@bdi.ox.ac.uk) wpsar vol 12, no 1, 2021 | doi: 10.5365/wpsar.2020.11.1.005 https://ojs.wpro.who.int/2 villamin et aln. gonorrhoeae surveillance in the philippines antimicrobials representing four different classes, namely penicillin (pen), ciprofloxacin (cip), tetracycline (tcy), ceftriaxone (cro) and cefixime (cfx), by disc diffusion and gradient diffusion (etest, biomerieux). the minimum inhibitory concentrations were interpreted as resistant, intermediate or susceptible according to the interpretative criteria in the performance standards for antimicrobial susceptibility testing (26th edition) of the clinical and laboratory standards institute (clsi).12 all isolates were screened for β-lactamase production on cefinase paper discs (bd bbl). azithromycin was not included in the panel of antibiotics, because, at the time isolates were collected, it was not in the treatment guidelines of the philippines and no clsi breakpoint was available. dna extraction and whole-genome sequencing dna was extracted from a single colony of each isolate with a wizard® genomic dna purification kit (promega), and the quantity and quality were determined with a quantus fluorometer (promega) with picogreen and a nanodrop 2000c spectrophotometer (thermo fisher scientific). the dna extracts were then shipped to wellcome trust sanger institute for sequencing on the illumina hiseq platform with 100-bp paired-end reads. raw sequence data were deposited in the european nucleotide archive under the study accession number prjeb17615. run accessions are provided on the microreact projects. bioinformatics analysis genome quality was evaluated according to metrics generated from assemblies, annotation files and the alignment of the isolates to the reference genome of n. gonorrhoeae strain tcdc-ng08107 (accession cp002441.1), as previously described.13 annotated assemblies were produced with the pipeline previously described.14 we included 21 high-quality n. gonorrhoeae genomes in this study. the mlst sequence types (sts) and ng-mast types, as well as the presence of amr determinants (known genes or mutations) and clustering of the isolates according to genetic similarity (tree), were predicted in silico from genome assemblies with pathogenwatch (https://www.sanger.ac.uk/tool/pathogenwatch/).15 in parallel, the evolutionary relations among the isolates were inferred from single nucleotide polymorphisms gonococcal antimicrobial surveillance programme has operated in the western pacific and south-east asian regions since 1992, but surveillance of gonococcal antimicrobial resistance (amr) remains limited in the asia– pacific region.6 in a recent report, 18 of 21 countries in the asia and the pacific reported isolates with decreased susceptibility to ceftriaxone and/or isolates resistant to azithromycin between 2011 and 2016.6 the antimicrobial resistance surveillance program (arsp) of the philippines department of health has been contributing amr surveillance data to the western pacific gonococcal antimicrobial surveillance programme since 1996 and did not confirm isolates with decreased susceptibility or resistance to these antibiotics during 2011–2016,6 while high gonococcal resistance rates against other first-line antibiotics have long been reported (fig. 1). continuous surveillance is thus key to detecting potential emergence or introduction of resistance to current treatment options. molecular methods for defining the epidemiology of gonococci include both n. gonorrhoeae multiantigen sequence typing (ng-mast)7 and multilocus sequence typing (mlst),8 although ng-mast is more widely used to investigate specific gonococcal amr phenotypes.8 whole-genome sequencing (wgs) was recently shown to provide better resolution and accuracy than ng-mast or mlst.9 good understanding of the population structure and the mechanisms of resistance of n. gonorrhoeae in the philippines would allow detection of high-risk clones associated with high-risk groups and contribute to the clinical management of gonococcal-related diseases and the creation of policies to prevent the spread of drug resistance.10,11 here, we describe the results of the first genomic survey of gonococcal isolates in the philippines. methods bacterial isolates a total of 51 n. gonorrhoeae isolates were collected at arsp sentinel sites in 2013 and 2014 (table 1). of the 36 isolates referred to the arsp reference laboratory for confirmation, 22 isolates from seven sentinel sites were resuscitated and submitted for wgs. antimicrobial susceptibility testing all n. gonorrhoeae isolates in this study were tested at the ars reference laboratory for susceptibility to five wpsar vol 12, no 1, 2021 | doi: 10.5365/wpsar.2020.11.1.005https://ojs.wpro.who.int/ 3 n. gonorrhoeae surveillance in the philippinesvillamin et al (snps) by mapping the paired-end reads to the reference genome of n. gonorrhoeae strain fa 1090 (accession ae004969.1), as described in detail previously.13 mobile genetic elements described in the fa 1090 genome16 were masked in the alignment of pseudogenomes with a script available at https://github.com/sanger-pathogens/ remove_blocks_from_aln. snps were extracted with snp-sites,17 and a maximum likelihood phylogenetic tree was generated from 7518 snp positions with raxml,18 the generalized time-reversible model and the gamma method of correction for among-site rate variation, with 500 bootstrap replicates. to complement the pathogenwatch amr results, known amr determinants were identified from raw sequence reads with ariba19 and a curated database of known resistance genes and mutations available at https://github.com/martinghunt/ariba-publication/tree/ master/n_gonorrhoeae/ref. the combined genotypic predictions of amr (test) were compared with the phenotypic results (reference), and the concordance between the two methods was computed for each of five antibiotics (105 total comparisons). isolates found to be resistant or to have reduced susceptibility (intermediate) were pooled as non-susceptible for comparison purposes. an isolate with the same outcome for both the test and reference (i.e. both susceptible or both non-susceptible) was counted as a concordant isolate. concordance was the number of concordant isolates fig. 1. annual resistance rates of n. gonorrhoeae between 2000 and 2014 for penicillin (pen), ciprofloxacin (cip) and tetracycline (tcy) table 1. number of n. gonorrhoeae isolates analysed by arsp and referred to the reference laboratory during 2013 and 2014, isolates submitted for wgs and high-quality n. gonorrhoeae genomes obtained, by sentinel site and amr profile cvm: cagayan valley medical center, dmc: southern philippines medical center, evr: eastern visayas regional medical center, mmh: corazon locsin montelibano memorial regional hospital, nmc: northern mindanao medical center, vsm: vicente sotto memorial medical center, zph: zamboanga del norte medical center pen: penicillin, cip: ciprofloxacin, tcy: tetracycline number of isolates 2013 2014 total total arsp 24 27 51 referred to reference laboratory 16 20 36 submitted for wgs 8 14 22 high-quality genomes 8 13 21 by sentinel site cvm 0 1 1 dmc 1 0 1 evr 1 0 1 mmh 1 1 2 nmc 0 1 1 vsm 5 6 11 zph 0 4 4 by amr profile pen cip tcy 2 8 10 pen cip 4 4 8 pen 2 0 2 cip tcy 0 1 1 wpsar vol 12, no 1, 2021 | doi: 10.5365/wpsar.2020.11.1.005 https://ojs.wpro.who.int/4 villamin et aln. gonorrhoeae surveillance in the philippines mtrr promoter and the non-synonymous substitutions in pona (l421p) and porb (a121d), which may contribute to high-level penicillin resistance.22 the partially assembled blatem gene was also detected in this genome but was not considered in the concordance analysis. we also identified the non-synonymous mutation in the folp gene (r228s), which confers resistance to sulfonamides in 20 of 21 genomes; however, isolates are not routinely tested for resistance to this antibiotic class. the concordance between antimicrobial susceptibility testing results and genotypic predictions (table 3) was >95% for all antibiotics except tetracycline (66.67%), resulting in an overall concordance of 92.38% (table 3). the discrepancies were attributed to seven false-positive results (isolates with a susceptible phenotype but with known amr determinants in their genomes), all of which contained the mutation v57m in the rpsj gene; two isolates also carried the tetm gene.23 over the total number of isolates assessed (expressed as a percentage). the maximum likelihood tree, genotyping results and amr predictions and the metadata collected from the sentinel sites were visualized with microreact.20 to contextualize the genomes from this study with publicly available global genomes, we combined them with two surveys available on pathogenwatch, a european survey of 1054 genomes10 and a global survey of 395 genomes.21 ethics statement ethical approval is not applicable, as we used archived bacterial samples processed by arsp. no identifiable data were used in this study. results demographic and clinical characteristics of the n. gonorrhoeae isolates the 21 genomes included in this study represented seven sentinel sites, with vicente sotto memorial medical center (vsm) contributing the most isolates (n = 11). the highest incidence was in the age group 15–24 years (47.6%, n = 10), followed by the age groups 5–14 years (28.6%, n = 6), 25–34 years (14.3%, n = 3) and 1–4 years (9.5%, n = 2, table 2). the numbers of isolates from females and males were almost equal (n = 11 and n = 10, respectively). the most frequent specimen source was the vagina (n = 8) for female patients and penile discharge (n = 5) for males. all the patients were outpatients (n = 21). concordance between phenotypic and genotypic amr isolates were tested for susceptibility to five antibiotics representing four classes. in line with the resistance trends shown in fig. 1, the most prevalent resistance profile was pen cip tcy, identified in 10 isolates from five sentinel sites and linked mainly to the presence of the blatem gene, the s91f mutation in gyra and the tetm gene, respectively (table 3). one penicillin-resistant isolate (13ars_dmc0024) harboured three mutations, the –57dela mutation in the table 2. demographic and clinical characteristics of 21 n. gonorrhoeae isolates characteristic no. of isolates sex male 10 female 11 age (years) 1–4 2 5–14 6 15–24 10 25–34 3 patient type inpatient 0 outpatient 21 location community 21 hospital 0 specimen origin vagina 8 penile discharge 5 cervix 3 genital discharge, male 2 decubitus ulcer 1 urine 1 other 1 wpsar vol 12, no 1, 2021 | doi: 10.5365/wpsar.2020.11.1.005https://ojs.wpro.who.int/ 5 n. gonorrhoeae surveillance in the philippinesvillamin et al table 3. comparison of genomic predictions of antibiotic resistance with susceptibility testing at the ars reference laboratory antibiotic class antibiotic resistant isolates false positive false negative concordance (%) resistance genes/ snps cephalosporin cefixime 0 0 0 100 cephalosporin ceftriaxone 0 0 0 100 penicillin penicillin 18 0 1 95.24 blatem, mtrr_ promoter_–57dela, mtrr_a39t, mtrr_disrupted, pena_ins346d, pona1_l421p, porb1b_a121d, porb1b_g120k tetracycline tetracycline 14 7 0 66.67 tetm, rpsj-v57m, mtrr_promoter_ –57dela, mtrr_ a39t, mtrr_disrupted fluoroquinolone ciprofloxacin 19 0 0 100 gyra_d95g, gyra_d95a, gyra_s91f, parc_d86n, parc_s87n, parc_e91k contained isolates resistant to ciprofloxacin harbouring the gyra_s91f mutation, clade ii was characterized by the presence of gyra_d95g alone or in combination with the one mutation in parc, while clade iii was characterized by the presence of gyra_d95a with one or two mutations in parc in all but one isolate. clades ii and iii showed different geographical distributions, although both were present at the vsm and zph sentinel sites, which submitted the most isolates. the genome from sentinel site southern philippines medical center (dmc) with a deletion in the mtrr promoter (–57dela) was found on a separate branch (i) in the tree and also carried a different complement of amr determinants, indicating that it is genetically distinct from the others (fig. 2). n. gonorrhoeae from the philippines in the global context the philippine genomes were contextualized with two recently published collections10,21 available in pathogenwatch. a recent global collection of 395 genomes from 58 countries (including the philippines) showed two major lineages with different evolutionary strategies. most of the genomes in this study were found within a subclade of lineage a, a multidrug-resistant lineage associated with infection in high-risk sexual networks (fig. 3a), and mixed with genomes from europe, pakistan and south-east asia, including genomes previously isolated in the philippines genotypic findings in silico genotyping a total of 15 different sts were identified, with only four (9364, 10316, 1582 and 8133) represented by more than one isolate. nine genomes were assigned to eight known ng-mast types and 12 genomes to nine novel types. only three sentinel sites, namely corazon locsin montelibano memorial regional hospital (mmh), vsm and zamboanga del norte medical center (zph), submitted more than one isolate, and all were represented by almost as many sts as isolates submitted. details of the numbers and the most common sts and ng-mast types found at each sentinel site are shown in table 4. population structure of n. gonorrhoeae in the philippines the diverse gonococcal population was represented by a tree with three deep-branching clades and no clear geographical signal (fig. 2). clades ii and iii were characterized by a different repertoire of amr genes and mutations. clade ii contained mostly isolates susceptible to or with reduced susceptibility to tetracycline and with the v57m mutation in the rpsj gene alone, while clade iii was composed of isolates resistant to tetracycline and also containing the tetm gene. similarly, while both clades wpsar vol 12, no 1, 2021 | doi: 10.5365/wpsar.2020.11.1.005 https://ojs.wpro.who.int/6 villamin et aln. gonorrhoeae surveillance in the philippines table 4. distribution of isolates, sts, ng-mast types, resistance profiles and resistance genes and mutations at the seven sentinel sites. the genetic resistance mechanisms for all the isolates from each site are listed. fig. 2. genomic surveillance of n. gonorrhoeae from the philippines, 2013–2014 cvm: cagayan valley medical center; dmc: southern philippines medical center; evr: eastern visayas regional medical center; mmh: corazon locsin montelibano memorial regional hospital; nmc: northern mindanao medical center; vsm: vicente sotto memorial medical center; zph: zamboanga del norte medical center pen: penicillin, cip: ciprofloxacin, tcy: tetracycline maximum likelihood phylogenetic tree of 21 isolates from the philippines, inferred from 7518 snp sites. the tree leaves are coloured by sentinel site (map). the tree is annotated with the mlst st as per the legend, the resistance phenotype for five antibiotics (red: resistant, yellow: intermediate, green: susceptible), and the distribution of known amr mechanisms (red: present, grey: not found). the tree branches are annotated with the bootstrap values and clade designations (i, ii and iii). the scale bar represents the number of snps per variable site. the data are available at https://microreact.org/project/arsp_ngo_2013-14 and https://pathogen.watch/collection/flnkisnu6giu-arspngo2013-2014. laboratory no. of isolates sts (no. of isolates) ng-mast types (no. of isolates) resistance profile± (no. of isolates) resistance genes and snps cvm 1 8780 novel pen cip tcy blatem, pena_ins346d, pona1_l421p, mtrr_ a39t, gyra_s91f, gyra_d95a, parc_s87n, tetm, rpsj-v57m dmc 1 1903 novel pen cip tcy pena_ins346d, pona1_l421p, porb1b_ a121d, mtrr_promoter_ –57dela, gyra_d95g, gyra_s91f, parc_s87n, parc_e91k, tetm, rpsj-v57m evr 1 1582 13 796 pen cip blatem, pena_ins346d, mtrr_a39t, gyra_ d95g, gyra_s91f, rpsj-v57m mmh 2 11 956, 11 208 1631, novel pen cip blatem, pena_ins346d, mtrr_a39t, porb1b_ a121d, porb1b_g120k, gyra_d95g, gyra_ s91f, parc_d86n, rpsj_v57m nmc 1 1588 novel pen cip tcy blatem, pena_ins346d, mtrr_a39t, pona1_ l421p, gyra_s91f, gyra_d95a tetm, rpsjv57m vsm 11 8133 (2), 9364 (2), 10 316 (1), 1587 (1), 11 431 (1), 11 963 (1), 1582 (1), 11 956 (1), 15 234 (1) 2187(2), 1691 (1), 1498 (1),1797 (1), novel (6) pen cip (4) pen cip tcy (4) cip tcy (1) pen (2) blatem, pena_ins346d, mtrr_disrupted, mtrr_a39t, pona1_l421p, porb1b_a121d, porb1b_g120k, gyra_d95g, gyra_d95a, gyra_s91f, parc_d86n, parc_s87n, parc_ e91k, tetm, rpsj-v57m zph 4 10 316 (2), 9364 (1), 8130 (1) 2080 (1), 11 821 (1), novel (2) pen cip tcy (3) pen cip (1) blatem, mtrr_disrupted, mtrr_a39t, porb1b_ a121d, gyra_d95g, gyra_d95a, gyra_s91f, parc_d86n, parc_s87n, parc_e91k, tetm, rpsj-v57m st legend s t p e n c ip tc y c fm c r o b la t e m m tr r _p ro m ot er _a –5 7 de l m tr r _a 3 9 t m tr r _d is ru p te d p en a _i ns 3 4 6 d p on a 1 _l 4 2 1 p p or b 1 b _a 1 2 1 d p or b 1 b _g 1 2 0 k gy ra _d 9 5 g gy ra _d 9 5 a gy ra _s 9 1 f p ar c _d 8 6 n p ar c _s 8 7 n p ar c _e 9 1 k te tm rp sj _v 5 7 m 100 100 ii i iii 100 100 100 100 100 100 95 wpsar vol 12, no 1, 2021 | doi: 10.5365/wpsar.2020.11.1.005https://ojs.wpro.who.int/ 7 n. gonorrhoeae surveillance in the philippinesvillamin et al fig. 3. global context of n. gonorrhoeae from the philippines fig. 3a. tree of 416 genomes from this study (n = 21) and a recent global collection (n = 395), inferred with pathogenwatch from 22 558 variant sites in 1542 core genes. purple nodes indicate genomes from the philippines from this study (circles) or the global collection (squares). the scale bar represents the number of snps. the data are available at https://pathogen.watch/collection/wrdonfwhju6f-arsp-ngo-2013-2014-global-context. fig. 3b. detail of the subtree of closely related genomes from the philippines (orange nodes) and norway (blue node), inferred with pathogenwatch. the tree branches are annotated with the number of pairwise snp differences between isolates. the metadata blocks indicate the st, ng-mast type and the presence (red blocks) of seven amr determinants. the full collection is available at https://pathogen.watch/collection/xtusqgwqhxcy-arsp-ngo-2013-2014-european-context. two genomes is consistent with isolates from the same location,10 suggesting an epidemiological link and a route of international transmission. the gonococcal reference laboratory at the norwegian institute of public health confirmed that the isolate was also resistant to penicillin and ciprofloxacin and susceptible to extended-spectrum cephalosporins (tetracycline not tested) and that the norwegian male had visited the philippines and claimed to have contracted gonorrhoea during his stay (personal communication). discussion wgs showed that the n. gonorrhoeae genomes from the philippines are genetically diverse and carry a variety of amr determinants, such as chromosomal mutations and acquired genes. the concordance between phenotypic (1998 and 200821). the genome from dmc was found within a separate subclade with genomes from europe, india and pakistan, which also carried the mtrr_–57dela promoter deletion. we further contextualized our isolates with 1054 genomes from 20 countries collected in 2013 in a european survey.10 notably, the genome of strain 14ars_vsm0347 isolated from a female on 25/04/2014 in the philippines was highly similar to that of ecdc_gc_088 isolated from a male on 31/12/2013 in norway (fig. 3b), with no snp differences found in the pathogenwatch core genome (1542 genes). one snp was identified in the referencebased alignment of the two pseudogenomes, confirming that these two genomes are highly similar. the two strains also shared the same complement of amr genes and mutations (fig. 3b). the genetic distance between the lineage b lineage aa b 723 0 mlst st ng-mast type 11956 11963 1498 1631 wpsar vol 12, no 1, 2021 | doi: 10.5365/wpsar.2020.11.1.005 https://ojs.wpro.who.int/8 villamin et aln. gonorrhoeae surveillance in the philippines portance of genomic surveillance in the western pacific and other endemic regions to understand the spread of drug-resistant gonorrhoea worldwide. acknowledgements we are grateful to martin steinbakk at the norwegian institute of public health and to karianne wiger gammelsrund and the microbiology laboratory at the university hospital of north norway for retrieving the information on the norwegian isolate. we also thank dr leonor sánchez-busó and dr magnus unemo for critical reading of the manuscript. funding this work was supported by a newton fund award from the medical research council (united kingdom) mr/ n019296/1 and the philippine council for health research and development. additional support was provided by the national institute for health research (united kingdom), the global health research unit on genomic surveillance of amr (16/136/111) and by research grant u01ca207167 from the us national institutes of health. conflicts of interest the authors declare no conflicts of interest. references 1. wi t, lahra mm, ndowa f, bala m, dillon jr, ramon-pardo p, et al. antimicrobial resistance in neisseria gonorrhoeae: global surveillance and a call for international collaborative action. plos med. 2017;14(7):e1002344. 2. wi tec, saniel op, ramos er, macneil j, neilsen g. rti/sti prevalence in selected sites in the philippines. durham (nc): fhi foundation; 2002. 3. external review of the national health sector response to hiv and sexually transmitted infections 2013: republic of the philippines. manila: who regional office foe the western pacific; 2015. 4. unemo m, shafer wm. antimicrobial resistance in neisseria gonorrhoeae in the 21st century: past, evolution, and future. clin microbiol rev. 2014;27(3):587–613. 5. fifer h, natarajan u, jones l, alexander s, hughes g, golparian d, et al. failure of dual antimicrobial therapy in treatment of gonorrhea. n engl j med. 2016;374(25):2504–6. 6. george crr, enriquez rp, gatus bj, whiley dm, lo yr, ishikawa n, et al. systematic review and survey of neisseria gonorrhoeae ceftriaxone and azithromycin susceptibility data in the asia pacific, 2011 to 2016. plos one. 2019;14(4):e0213312. 7. martin im, ison ca, aanensen dm, fenton ka, spratt bg. rapid sequence-based identification of gonococcal transmission clusters in a large metropolitan area. j infect dis. 2004;189(8):1497– 505. and genotypic resistance was high (>95%) for most antibiotics but only 66% for tetracycline. susceptible isolates carrying only the rpsj_v57m mutation, which confers low-level tetracycline resistance, have been reported previously.24 the two susceptible isolates with a full-length tetm gene reported by pathogenwatch were re-tested by disc diffusion and their susceptibility confirmed. the discrepancy, which could be explained for example by the lack of expression of the gene, errors in susceptibility testing or low-level dna contamination, will be further investigated. although n. gonorrhoeae remains largely susceptible to extended-spectrum cephalosporins and azithromycin in the philippines, we identified one isolate (13ars_dmc0024) with a –57dela mutation in the mtrr promoter, which results in overexpression of the mtrcde efflux pump and, in combination with other mutations, can increase the minimum inhibitory concentrations of azithromycin (as well as penicillin and tetracycline).4,22 prospective surveillance with wgs can detect in real-time the acquisition of additional mutations that could result in decreased susceptibility. a recent report suggested rapid recent intercontinental transmission of gonorrhoea, with common introductions from asia to the rest of the world.21 in support of this finding, the philippine genomes, most of which were within a subclade of global lineage a, were interspersed with those from other countries (fig. 3a). in addition, we found evidence of an introduction event from the philippines to norway associated with travel of a norwegian male to the philippines (fig. 3b). global lineage a is associated with infection in highrisk sexual networks.21 the combination of wgs with epidemiological information can reveal transmission routes and risk factors, which can be used to design better control measures.25 the small size of our retrospective data set (n = 21) and the linked epidemiological data did not permit any inferences about sexual networks or risk factors, which is a limitation of this study. the number of reported isolates by arsp has, however, since increased to more than 100 per year, and data on risk factors are also collected, which will allow a more comprehensive analysis of the population diversity and of risk factors in future reports. our results represent the first genomic survey of n. gonorrhoeae isolates collected by arsp and will constitute the background for contextualizing continuous prospective surveillance. in addition, it highlights the imwpsar vol 12, no 1, 2021 | doi: 10.5365/wpsar.2020.11.1.005https://ojs.wpro.who.int/ 9 n. gonorrhoeae surveillance in the philippinesvillamin et al 17. page aj, taylor b, delaney aj, soares j, seemann t, keane ja, et al. snp-sites: rapid efficient extraction of snps from multifasta alignments. microb genom. 2016;2(4):e000056. 18. stamatakis a. raxml version 8: a tool for phylogenetic analysis and post-analysis of large phylogenies. bioinformatics. 2014;30(9):1312–3. 19. hunt m, mather ae, sanchez-buso l, page aj, parkhill j, keane ja, et al. ariba: rapid antimicrobial resistance genotyping directly from sequencing reads. microb genom. 2017;3(10):e000131. 20. argimon s, abudahab k, goater rj, fedosejev a, bhai j, glasner c, et al. microreact: visualizing and sharing data for genomic epidemiology and phylogeography. microb genom. 2016;2(11):e000093. 21. sánchez-busó l, golparian d, corander j, grad yh, ohnishi m, flemming r, et al. the impact of antimicrobials on gonococcal evolution. nat microbiol. 2019;4(11):1941–50. 22. mortimer td, grad yh. applications of genomics to slow the spread of multidrug-resistant neisseria gonorrhoeae. ann n y acad sci. 2019;1435(1):93–109. 23. eyre dw, de silva d, cole k, peters j, cole mj, grad yh, et al. wgs to predict antibiotic mics for neisseria gonorrhoeae. j antimicrob chemother. 2017;72(7):1937–47. 24. bailey al, potter rf, wallace ma, johnson c, dantas g, burnham ca. genotypic and phenotypic characterization of antimicrobial resistance in neisseria gonorrhoeae: a cross-sectional study of isolates recovered from routine urine cultures in a highincidence setting. msphere. 2019;4(4):e00373-19. 25. didelot x, dordel j, whittles lk, collins c, bilek n, bishop cj, et al. genomic analysis and comparison of two gonorrhea outbreaks. mbio. 2016;7(3):e00525-16. 8. jolley ka, maiden mc. bigsdb: scalable analysis of bacterial genome variation at the population level. bmc bioinformatics. 2010;11(1):595. 9. unemo m, golparian d, nicholas r, ohnishi m, gallay a, sednaoui p. high-level cefiximeand ceftriaxone-resistant neisseria gonorrhoeae in france: novel pena mosaic allele in a successful international clone causes treatment failure. antimicrob agents chemother. 2012;56(3):1273–80. 10. harris sr, cole mj, spiteri g, sanchez-buso l, golparian d, jacobsson s, et al. public health surveillance of multidrug-resistant clones of neisseria gonorrhoeae in europe: a genomic survey. lancet infect dis. 2018;18(7):758–68. 11. williamson da, chow epf, gorrie cl, seemann t, ingle dj, higgins n, et al. bridging of neisseria gonorrhoeae lineages across sexual networks in the hiv pre-exposure prophylaxis era. nat commun. 2019;10(1):3988. 12. m100–s26 performance standards for antimicrobial susceptibility testing. 26th edition. annapolis junction (md): clinical and laboratory standards institute; 2016. 13. argimon s, masim mal, gayeta jm, lagrada ml, macaranas pkv, cohen v, et al. integrating whole-genome sequencing within the national antimicrobial resistance surveillance program in the philippines. nat commun. 2020;11(1):2719. 14. page aj, de silva n, hunt m, quail ma, parkhill j, harris sr, et al. robust high-throughput prokaryote de novo assembly and improvement pipeline for illumina data. microb genom. 2016;2(8):e000083. 15. sánchez-busó l, yeats ca, taylor b, goater r, underwood a, abudahab k, et al. a community-driven resource for genomic surveillance of neisseria gonorrhoeae at pathogenwatch. biorxiv. 2020. 16. piekarowicz a, klyz a, majchrzak m, adamczyk-poplawska m, maugel tk, stein dc. characterization of the dsdna prophage sequences in the genome of neisseria gonorrhoeae and visualization of productive bacteriophage. bmc microbiol. 2007;7(1):66. https://ojs.wpro.who.int/ 1wpsar vol 12, no 4, 2021 | doi: 10.5365/wpsar.2021.12.4.833 covid-19: original research s evere acute respiratory syndrome coronavirus 2 (sars-cov-2) is the cause of coronavirus disease 2019 (covid-19), which was first reported in wuhan, china, in late december 2019. as of september 2020, sars-cov-2 was responsible for over 25 million cases and nearly 1 million deaths.1 viet nam is a country of 97 million people, which, despite its lowerto middle-income status, has managed to limit the spread of sars-cov-2, requiring 8 months to reach 1000 cases and 7 months to record its first fatality. strategies for prevention, detection and control have included the key response measures of early detection, testing and treatment, required for all persons entering the country from affected countries, starting in early february 2020.2 the early days of the pandemic in viet nam were marked primarily by cases imported from china, whereas the second cluster was characterized by cases mainly imported from europe.2–6 viet nam hosts two national influenza centres, including one at the national institute of hygiene and epidemiology (nihe). the institute coordinates influenza surveillance in northern viet nam and has played a critical role in responding to the covid-19 pandemic. in its role as a reference laboratory for the entire country, nihe received some of the earliest specimens from cases of suspected covid-19. we describe herein the virological characteristics of specimens received for covid-19 testing between january and april 2020. a national institute of hygiene and epidemiology, hanoi, viet nam. b mohawk college, hamilton, ontario, canada. published: 22 december 2021 doi: 10.5365/wpsar.2021.12.4.833 background: viet nam confirmed its first case of severe acute respiratory syndrome coronavirus 2 (sars-cov-2) infection on 23 january 2020 among travellers from wuhan, china, and experienced several clusters of community transmission until september. viet nam implemented an aggressive testing, isolation, contact tracing and quarantine strategy in response to all laboratory-confirmed cases. we report the results of sars-cov-2 testing during the first half of 2020 in northern viet nam. methods: between january and may 2020, 15 650 upper respiratory tract specimens were collected from 14 470 suspected cases and contacts in northern viet nam. all were tested for sars-cov-2 by real-time rt-pcr. individuals with positive specimens were tested every three days until two tests were negative. positive specimens from 81 individuals were cultured. results: among 14 470 tested individuals, 158 (1.1%) cases of sars-cov-2 infection were confirmed; 89 were imported and 69 were associated with community transmission. most patients (122, 77%) had negative results after two tests, while 11 and 4 still tested positive when sampled a third and fourth time, respectively. sars-cov-2 was isolated from 29 of 81 specimens (36%) with a cycle threshold (ct) value <30. seven patients who tested positive again after testing negative had ct values >30 and negative cultures. conclusion: early, widespread testing for sars-cov-2 in northern viet nam identified very few cases, which, when combined with other aggressive strategies, may have dramatically contained the epidemic. we observed rapid viral clearance and very few positive results after clearance. large-scale molecular diagnostic testing is a critical part of early detection and containment of covid-19 in viet nam and will remain necessary until vaccination is widely implemented. virological characteristics of cases of covid-19 in northern viet nam, january–may 2020 hang khanh le nguyen,a son vu nguyen,a phuong mai vu hoang,a thanh thi le,a huong thi thu tran,a long hai pham nguyen,b thai quang pham,a thuy thanh nguyen,a anh duc dang,a anh phuong nguyena and mai thi quynh lea correspondence to mai thi quynh le (email: lom9@hotmail.com or lom9@nihe.org.vn) wpsar vol 12, no 4, 2021 | doi: 10.5365/wpsar.2021.12.4.833 https://ojs.wpro.who.int/2 nguyen et alvirologic characteristics of cases of covid-19 in northern vietnam, january–may 2020 data analysis laboratory and epidemiological data collected in this study were entered into a filemaker pro 19 advanced database and analysed. summary data were reported to the minister of health daily and fed back to each sender 24–48 hours after reception of samples. results characteristics of specimens received between 23 january and 25 may, the national influenza centre received 15 650 np/op specimens from 14 470 suspected cases in 28 cities and provinces in northern viet nam. samples were submitted from two types of suspected cases: 6420 people who entered viet nam from abroad (china during the first cluster and other countries during the second cluster) and 8050 from people who were contacts of suspected or confirmed cases. during the first cluster (23 january–25 february 2020), 1741 specimens (11% of all specimens) were collected from people arriving from wuhan, china, their families and their close contacts. during the second cluster of cases (7 march–25 may 2020), we received an additional 13 909 (88.9%) samples; nearly two thirds were received from four locations (hanoi, 5366; ha giang, 1603; thai binh, 1118; lai chau, 1011) (table 1). detection of sars-cov-2 by real-time rt-pcr among 14 470 tested samples, 158 (1.14%) cases of sars-cov-2 were confirmed (table 1). eighty-nine (56%) of these were detected among suspected cases imported from other countries and the remaining 69 (44%) among community contacts of confirmed cases (table 2). thirteen cases were confirmed during the first cluster among people returning from china or their close contacts. of the 158 confirmed cases, 143 (91%) were vietnamese nationals and 96 (61%) were female, although we observed a significant difference in the distribution of gender between imported cases (44/89 or 49% female) and cases among community contacts (52/69, or 75% female, p < 0.0009 by the chi-squared test). the median age was 41 years (interquartile range [iqr]: 3 months–88 years) for community contacts and 33 years (iqr: 10–74 years) for imported cases. eleven methods viet nam established a national steering committee on prevention and control of covid-19 on 28 january 2020, 6 days after the first cases of covid-19 were identified in the country.3 subsequent guidelines issued by the steering committee on 19 february 2020 called for the collection of nasopharyngeal and oropharyngeal (np/op) swabs from suspected cases and close contacts of confirmed cases; the guidelines were harmonized with those of the world health organization (who) in march 2020.1 additional samples were obtained from travellers in quarantine, who were required to provide upper respiratory specimens for testing upon arrival and before the end of the 14-day quarantine. specimens were submitted by hospitals, provincial centres for disease control or quarantine facilities, with forms to indicate the reason for testing. confirmed cases of covid-19 were sampled every 3 days during hospitalization until they recovered clinically and had at least two negative results by real-time reverse transcription polymerase chain reaction (rt-pcr) for sars-cov-2. real-time rt-pcr testing np/op swabs were placed into a viral transport medium and maintained at 4 °c during transport to the national influenza centre at nihe for 24–48 hours.7 rna was isolated from the swabs with the viral rna extraction kit (qiagen, hilden, germany) according to the manufacturer’s instructions in biosafety level 3 containment laboratories. real-time rt-pcr was conducted with the superscript iii one-step rt-pcr system with platinum taq high fidelity dna polymerase (invitrogen, carlsbad, ca, usa), with targets of e, rdrp and n genes according to who recommendations. we defined confirmed cases as those with cycle threshold (ct) values <37 for at least two of the target genes.8 viral isolation vero e6 cells were maintained in eagle’s minimal essential medium containing 5% (v/v) newborn calf serum; 100 μl of real-time rt-pcr-positive samples were inoculated onto vero e6 cells and incubated at 37 °c. viral growth was monitored by daily observation of cytopathic effect. all experiments with sars-cov-2 viruses were performed in biosafety level 3 containment laboratories.9 wpsar vol 12, no 4, 2021 | doi: 10.5365/wpsar.2021.12.4.833https://ojs.wpro.who.int/ 3 virologic characteristics of cases of covid-19 in northern vietnam, january–may 2020nguyen et al table 1. epidemiological features of suspected cases tested for sars-cov-2, northern viet nam, january–may 2020 table 2. epidemiological features of confirmed cases of covid-19, northern viet nam, january–may 2020 dates source of suspected cases no. of suspected cases gender, n (%) mean (iqr) no. of positive cases (%)male female 23 january– 25 february travellers from china 1123 516 (45.9) 607 (54.1) 30 (1 month–87 years) 6 (0.5) community contacts 118 54 (45.8) 64 (54.2) 35 (4 months–58 years) 7 (5.9) 7 march– 25 may travellers from other countries 5297 2436 (45.9) 2861 (54.1) 38 (1 month–96 years) 83 (1.6) community contacts 7932 3648 (46.0) 4284 (54.0) 33 (1 month–90 years) 62 (0.8) total 14 470 6654 (45.9) 7816 (54.1) 34 (1 month–96 years) 158 (1.1) group all cases, n (%) gender, n (%) nationality, n (%) mean (iqr) re-positive, n (%) male female viet nam others imported cases 89 (56) 45 (51) 44 (49) 74 (83) 15 (17) 33 (10–74 years) 6 (3.8) community contacts 69 (44) 17 (25) 52 (75) 69 (100) 0 (0) 41 (3 months–88 years) 1 (0.6) tern was similar to that of cases with ct values <30: for 84 (85%) cases, only the first three samples were positive, and an additional 10 (11%) cases had positive results for one of the next three samples. one case was sampled 15 times with no positive results after the 10th sampling. for 81/158 (51%) confirmed cases, the samples had been appropriately stored and were of a sufficient volume to be inoculated onto vero e6 cells, from which we obtained 29 (36%) sars-cov-2 isolates. of these, 20 samples had detectable cytopathic effects between 72 and 96 hours, and an additional 9 isolates were harvested after a second blind passage. we identified 28 samples with ct values <20, and, of these, 18 (64%) yielded culturable virus (table 4). an additional 20 cases had ct values of 20–25, and we successfully cultured virus from 10 (50%) of these. the additional nine isolates recovered during the second passage had ct values of 25–30, suggesting a low load of viable virus. no viral isolates were recovered from samples with ct values >30 (n = 20). discussion during the first 5 months of the covid-19 epidemic in viet nam, we characterized all upper respiratory tract specimens received by nihe from cities and provinces (12%) of the 89 imported cases were detected only at second sampling while in quarantine. the ministry of health guidelines require that laboratory-confirmed cases undergo follow-up testing until at least two consecutive tests are negative. most cases required three or four subsequent tests to meet this criterion, but we also observed some cases after the collection of 10–15 subsequent specimens (table 3). correlation between ct value, date of illness / days since first positive sample and viral culture results we analysed the ct values of 158 confirmed cases of sars-cov-2 infection by serial sampling during hospitalization until two consecutive negative results were obtained. the proportion of cases that tested positive decreased with the number of times they were sampled. among the 652 samples collected, 167 (26%) had ct values <30, of which 105 (63%) were identified at the first sampling. among cases that were sampled a third and fourth time, only 12/124 (10%) and 6/71 (8%) cases, respectively, had ct values <30 (table 3). we identified 99 positive specimens with ct values >30, including seven cases that tested positive again after having tested negative (“re-positives”). the patwpsar vol 12, no 4, 2021 | doi: 10.5365/wpsar.2021.12.4.833 https://ojs.wpro.who.int/4 nguyen et alvirologic characteristics of cases of covid-19 in northern vietnam, january–may 2020 positive on their first sampling, and 11 were positive during their quarantine. this suggests that testing in quarantine centres at entry and throughout quarantine can prevent transmission of sars-cov-2 in a country. our results provided critical support for evaluating the covid-19 prevention and control strategy in viet nam. although viral culture is the gold standard for confirmation of viral infection, real-time rt-pcr is the accepted gold standard for detecting sars-cov-2 for the purposes of isolation and contact tracing because of the shorter turnaround time and greater sensitivity. semi-quantification of viral nucleic acids from the ct value can be used to select samples for virus isolation.3,9–11 we observed a strong correlation between ct values and cell culture positivity rate, suggesting that viral load may be used as a proxy for the infectivity of infected patients. among the 158 confirmed covid-19 cases, seven had positive real-time rt-pcr results after two consecutive negative results within 15 days. prolonged viral nucleic acid detection in samples from patients who have recovered from covid-19 has been a concern, as the large majority of these samples, both in the in northern viet nam. during that time, two clusters of sars-cov-2 infection occurred with community transmission. just over 1% of all samples yielded positive results by real-time rt-pcr and, by the end of may 2020, fewer than 400 cases had been identified in viet nam, with no deaths. rapid scaling up and decentralization of testing were key components of viet nam’s strategy to minimize entry and transmission of sars-cov-2. we identified 89 laboratory-confirmed cases in travellers by testing during centralized quarantine. of them, 78 (88%) were table 4. relations between ct value and culturable sars-cov-2 virus, northern viet nam, february–may 2020. ct value no. of clinical samples isolates recovered, n (%) ≤20 28 18 (64) 21–25 20 10 (50) 26–30 20 1 (5) >30 13 0 (0) total 81 29 (36) table 3. relations between cycle threshold (ct) values and specimen positivity over time for 158 confirmed cases of covid-19, northern viet nam, february–may 2020. a the first samples from these cases were negative, but the second samples were positive. all were from travellers from countries other than china. no. of tests for each suspected case <30 ≥30 positive negative total n % n % n % n n 1 105 71 42 29 147 93 11a 158 2 42 62 26 38 68 53 61 129 3 12 43 16 57 28 23 96 124 4 6 55 5 45 11 15 60 71 5 0 0 4 100 4 8 45 49 6 1 50 1 50 2 5 40 42 7 0 na 0 0 0 0 31 31 8 0 0 2 100 2 10 19 21 9 1 50 1 50 2 17 10 12 10 0 0 2 100 2 25 6 8 11 0 0 0 0 0 0 3 3 12 0 0 0 0 0 0 1 1 13 0 0 0 0 0 0 1 1 14 0 0 0 0 0 0 1 1 15 0 0 0 0 0 0 1 1 total 167 63 99 37 266 69 386 652 wpsar vol 12, no 4, 2021 | doi: 10.5365/wpsar.2021.12.4.833https://ojs.wpro.who.int/ 5 virologic characteristics of cases of covid-19 in northern vietnam, january–may 2020nguyen et al for improving technical guidelines for molecular testing, viral isolation and clinical management of covid-19 in viet nam. acknowledgements we thank matt moore (us centers for disease control and prevention, hanoi) and rogier van doorn (oxford university clinical research unit, viet nam) for scientific review. we recognize the timely provision of reagents at the beginning of the outbreak from the who collaborating centre for reference and research on tropical and emerging infectious diseases, institute of tropical medicine, nagasaki university, japan. we gratefully acknowledge the contributions of health workers at the centres for disease control in the cities and provinces in northern viet nam. we also thank the health-care practitioners of the clinics and hospitals in viet nam who supported this study. conflicts of interest the authors declare no conflicts of interest related to this work. ethics statement the ethics committee of the national institute of hygiene and epidemiology, viet nam, approved the protocol of this study. funding none references 1. laboratory testing strategy recommendations for covid-19: interim guidance. geneva: world health organization; 2020. available from: https://www.who.int/publications/i/item/laboratory-testingstrategy-recommendations-for-covid-19-interim-guidance, accessed 2 september 2021. 2. thanh hn, van tn, thu hnt, van bn, thanh bd, thu hpt, et al. outbreak investigation for covid-19 in northern vietnam. lancet infect dis. 2020;20(5):535–6. doi:10.1016/s14733099(20)30159-6 pmid:32145188 3. phan lt, nguyen tv, huynh lkt, dao mh, vo tan, vu nhp, et al. clinical features, isolation, and complete genome sequence of severe acute respiratory syndrome coronavirus 2 from the first two patients in vietnam. j med virol. 2020;92(10):2209–15. doi:10.1002/jmv.26075 pmid:32462705 4. le tqm, takemura t, moi ml, nabeshima t, nguyen lkh, hoang vmp, et al. severe acute respiratory syndrome coronavirus 2 shedding by travelers, vietnam, 2020. emerg infect dis. 2020;26(7):1624– 6. doi:10.3201/eid2607.200591 pmid:32240079 literature and in our collection, have high ct values, yet attempts to culture these viruses have been unsuccessful.4,10 the virus could not be cultured from specimens from the seven cases in this study, all of which had ct values >30, suggesting that these cases represent viral remnants rather than infectious virus. these findings are consistent with those from china and the republic of korea.11–14 this observation supports the hypothesis that prolonged shedding or re-positivity of samples is not associated with continued replication but is rather an indicator of removal of damaged lung tissue containing intact stretches of viral rna by coughing or ciliary transport.13–14 positive real-time rt-pcr results can be confusing for patients and hospital staff who understandably wish to prevent continued transmission, either among patients and health-care workers or in the general community. these findings should provide reassurance that patients with positive real-time rtpcr results with ct values >30 more than 10 days after onset or first positive result and after having had a negative result are at extremely low risk of transmission. these findings also support a strategy of testing based on signs of clinical recovery, rather than a “test-of-cure” strategy. this study had several limitations. first, the specimens we received were collected as part of the national strategy for prevention and control of covid-19 without accompanying systematic clinical metadata, and we were thus unable to stratify asymptomatic, mild and severe cases. second, we could not systematically assess the possible duration of viral shedding because most of our cases were detected upon arrival, through contact tracing and in quarantine. thus, sampling times were determined by disease control staff in the field rather than in the context of a rigorously designed study. third, the specimens for viral isolation were only from the upper respiratory tract. we did not receive any sputum or tracheal aspirate fluids, which might have different characteristics in terms of ct values or culturable virus. in summary, we describe here the virology and epidemiology of cases of laboratory-confirmed covid-19 in northern viet nam in two clusters of cases during the first 5 months of the pandemic. most cases that were laboratory-confirmed were confirmed within the first few samplings. we also determined that most cases that are positive very late in their clinical course are unlikely to represent active infection but, rather, remnants of viral rna. these results have provided valuable information wpsar vol 12, no 4, 2021 | doi: 10.5365/wpsar.2021.12.4.833 https://ojs.wpro.who.int/6 nguyen et alvirologic characteristics of cases of covid-19 in northern vietnam, january–may 2020 10. huang cg, lee km, hsiao mj, yang sl, huang pn, gong yn, et al. culture-based virus isolation to evaluate potential infectivity of clinical specimens tested for covid-19. j clin microbiol. 2020;58(8):e01068-20. doi:10.1128/jcm.01068-20 pmid:32518072 11. la scola b, le bideau m, andreani j, hoang vt, grimaldier c, colson p, et al. viral rna load as determined by cell culture as a management tool for discharge of sars-cov-2 patients from infectious disease wards. eur j clin microbiol infect dis. 2020;39(6):1059– 61. doi:10.1007/s10096-020-03913-9 pmid:32342252 12. lan l, xu d, ye g, xia c, wang s, li y, et al. positive rt-pcr test results in patients recovered from covid-19. jama. 2020;323(15):1502– 3. doi:10.1001/jama.2020.2783 pmid:32105304 13. qiao xm, xu xf, zi h, liu gx, li bh, du x, et al. re-positive cases of nucleic acid tests in discharged patients with covid-19: a follow-up study. front med (lausanne). 2020;7:349. doi:10.3389/ fmed.2020.00349 pmid:32656223 14. focus on covid-19: ongoing viral detection and repeat positives. toronto: public health ontario; 2020. available from: https://www. publichealthontario.ca/-/media/documents/ncov/main/2020/06/ covid-19-ongoing-viral-detection-repeat-positives.pdf?la=en, accessed 2 september 2021. 5. khanh nc, thai pq, quach hl, thi nh, dinh pc, duong tn, et al. transmission of sars-cov-2 during long-haul flight. emerg infect dis. 2020;26(11):2617–24. doi:10.3201/eid2611.203299 pmid:32946369 6. thai pq, rabaa ma, luong dh, tan dq, quang td, quach hl, et al. the first 10 days of severe acute respiratory syndrome coronavirus 2 (sars-cov-2) control in vietnam. clin infect dis. 2021;72(9):e334– 42. doi:10.1093/cid/ciaa1130 pmid:32738143 7. who covid-19 reference laboratory network. geneva: world health organization; 2021. available from: https://www.who.int/ docs/default-source/coronaviruse/reference-lab-network-for-website_apr2021.pdf?sfvrsn=db83bab7_1&download=true, accessed 2 september 2021. 8. tib molbiol real-time rt-pcr assay for detection of covid-19 virus: overview of reagents, equipment and guidance for use. geneva: world health organization; 2020. 9. laboratory testing for coronavirus disease 2019 (covid-19) for suspected human cases: interim guidance, 2 march 2020. geneva: world health organization; 2020. available from: https:// apps.who.int/iris/handle/10665/331329, accessed 2 september 2021. https://ojs.wpro.who.int/ 1wpsar vol 13, no 4, 2022 | doi: 10.5365/wpsar.2022.13.4.932 surveillance report d engue is the most prevalent vector-borne disease in south-east asia. caused by the four dengue virus serotypes (denv-1–4) and transmitted by aedes mosquitoes, primarily by aedes aegypti, the prime contributors to the emergence and spread of dengue are favourable climatic conditions, urbanization and international trade and travel.1 dengue emerged as a public health concern in lao people’s democratic republic (lao pdr) in 1983, following its first major outbreak in the capital city of vientiane, during which 1759 cases of dengue haemorrhagic fever (dhf) were recorded.2 since then, the country has experienced multiple outbreaks, not just in the capital but also in other parts of the country. about 40% of all dengue cases reported in lao pdr during 1985–1989 were from vientiane, with the highest dengue activity occurring during the monsoon season (may to october). previous studies of dengue in lao pdr have focused on a specific province or region and/or have relied on short-term dengue case data. in contrast, this study summarized dengue surveillance data spanning an 18year period, 2003–2020, from the two most affected southern provinces in lao pdr. it was designed to a department of environmental engineering and management, asian institute of technology, bangkok, thailand. b faculty of science and technology, norwegian university of life sciences, ås, norway. c department of microbiology, faculty of medicine, khon kaen university, khon kaen, thailand. d savannakhet provincial health department, phonsavangnuea, lao pdr. e champasak provincial health office, pakse, lao pdr. f institute of research and education development, university of health sciences, ministry of health, vientiane, lao pdr. g department of public health and clinical medicine, section of sustainable health, umeå university, umeå, sweden. h unité de la génétique fonctionnelle des maladies infectieuses, institut pasteur, paris, france. i department of statistics, begum rokeya university, rangpur, bangladesh. j lao-oxford-mahosot hospital-welcome trust research unit, microbiology laboratory, mahosot hospital, vientiane, lao pdr. k centre for tropical medicine and global health, university of oxford, oxford, united kingdom of great britain and northern ireland. published: 23 november 2022 doi: 10.5365/wpsar.2022.13.4.932 dengue is a public health issue in tropical south-eastern asia responsible for significant morbidity and mortality. information on dengue epidemiology is necessary for developing strategies to control infections effectively. in the lao people’s democratic republic (lao pdr), champasak and savannakhet provinces account for around 30% of the national dengue burden. in this study, the dengue epidemiological profile in these two southern provinces of lao pdr was described by analysing seasonal and spatial dengue notification data from 2003–2020 using the long-term mean (ltm) method. savannakhet had a higher ltm (132.0 cases/month, 95% confidence interval [cl]: 92.2–171.7) than champasak (113.3 cases/month, 95% ci: 86.0–140.5), with peaks in dengue notifications following the rainy season in both provinces. the highest notification rates were observed in july to september; these months were also when the ltm was most frequently exceeded. previously, dengue notifications were largely confined to the western districts of savannakhet and the northern districts of champasak, but more recently, notifications have increased in the eastern districts of savannakhet and southern districts of champasak. while the notification rate remained high in children and young adults (5–30 years), especially among students and farmers, a shift in the age structure of dengue cases was observed, with a greater proportion of notifications now occurring in those aged over 30 years. community-based vector control and prevention programmes are needed to restrict the spread of dengue into new geographical areas in the southern provinces of lao pdr. epidemiological profile of dengue in champasak and savannakhet provinces, lao people’s democratic republic, 2003–2020 sumaira zafar,a hans j overgaard,b,c tiengkham pongvongsa,d nanthasane vannavong,e sysavanh phommachanh,f oleg shipin,a joacim rocklöv,g richard e paul,h md siddikur rahmanc,i and mayfong mayxayf,j,k correspondence to sumaira zafar (email: sumaira.zafar@ait.asia) wpsar vol 13, no 4, 2022 | doi: 10.5365/wpsar.2022.13.4.932 https://ojs.wpro.who.int/2 zafar et aldengue epidemiological profile in southern lao pdr 2010 onwards, while savannakhet only adopted the new classification in 2020. samples of the notified dengue cases were confirmed by laboratory testing using nonstructural protein tests. data on the prevailing serotypes were obtained from the annual reports of the national center for laboratory and epidemiology and from the provincial health department of savannakhet. population data, based on the 2005 and 2015 censuses, were acquired from the official web portal of the national department of statistics.5 national data on the temporal trends in dengue cases (2003–2020) were also used in the analysis. analysis dengue notification rate available dengue surveillance data included information on the daily number of clinically diagnosed dengue cases and deaths by district, age, sex, occupation, nationality and disease severity. the monthly dengue notification rate was calculated per 100 000 persons (number of cases per month/district population x 100 000). monthly dengue notification rates were based solely on case data collected by the provincial surveillance system and stored in provincial databases; suspected and unconfirmed cases were not included. long-term mean of dengue cases a long-term mean (ltm) method was used to analyse spatiotemporal variations in dengue cases. the ltm was calculated by dividing the total number of dengue cases observed during a specified time period by the total number of time units (i.e. months) in that time period. the time period used in this study was 216 months (2003–2020). the ltm was used as a threshold to determine the number of months when the monthly number of cases exceeded or remained below the ltm. when the monthly number of cases exceeded the ltm for 3 or more consecutive months, this period was considered to be a “high transmission season”.6 ltms and the number of months that exceeded them were calculated and mapped for each district within the two provinces. inform risk assessment of dengue transmission as well as prevention and control strategies. methods study area the current study was conducted within a larger project (denclim project; 2018–2021) which aimed to evaluate the effects of environmental change and climatic variability on community vulnerability and exposure to dengue within four geographically similar, but socioeconomically different, neighbouring provinces in southern lao pdr and north-eastern thailand. lao pdr has three distinct geographical areas (north, central and south). the two most populated provinces in the south, champasak and savannakhet, were selected for this study (fig. 1). champasak and savannakhet together account for 24% (1.75 million) of the country’s population and both are endemic for dengue with year-round transmission. peak transmission, however, occurs during the rainy season, from may to october. data collection daily reports of dengue cases for champasak and savannakhet provinces collected by the two provincial health departments between 2003 and 2020, aggregated at the district level, were used in this study. as per the national dengue surveillance system protocols, all public health practitioners and directors of clinical laboratories must report all dengue cases that meet the dengue case definition within 24 hours of case confirmation to their provincial health department.3 as cases are probably underreported by this surveillance system, data are unlikely to be representative of the true incidence of dengue infection. clinically diagnosed dengue cases were initially categorized as either dengue fever (df), dhf or dengue shock syndrome (dss). in 2010, lao pdr adopted the new dengue case classification recommended by the world health organization (who),4 which categorizes cases as: dengue without warning signs (dwos), dengue with warning signs (dws) or severe dengue (sd).3 dengue cases were recorded in the champasak province according to the new who 2009 classification from ltm = σdengue cases) σmonths wpsar vol 13, no 4, 2022 | doi: 10.5365/wpsar.2022.13.4.932https://ojs.wpro.who.int/ 3 dengue epidemiological profile in southern lao pdrzafar et al 32.6% (champasak for 17.3%, savannakhet for 15.3%) of the country’s total number of notified dengue cases (table 2). high transmission seasons occurred in both provinces in 2013 (5387 and 4959 cases in champasak and savannakhet, respectively) and again in 2019 (6320 and 3145 cases in champasak and savannakhet, respectively). the highest numbers of deaths due to dengue were recorded in 2003 and 2013, followed by 2019 (table 2). in both provinces, rates of notified dengue cases were higher in the provincial capital districts than in remote districts away from the provincial capitals (fig. 1). the highest annual dengue notification rate was recorded in the south-western districts of savannakhet in 2019, when rates reached 1595 cases per 100 000 population. dengue notification rates in both provinces were highly variable and not limited to densely populated areas. sociodemographic characteristics of dengue cases the sociodemographic characteristics of cases including population density, age, sex, occupation and nationality were analysed to identify relative dengue case burdens. the population density of each district in the two provinces was plotted against the dengue notification rate to check for correlation. dengue cases were also sub-analysed by case definition, age group, occupation and nationality to see which groups were most affected. results dengue mortality and notification rates from 2003 to 2020, 24 479 dengue cases in champasak and 28 509 in savannakhet were recorded (table 1). on average, these two provinces combined accounted for fig. 1. annual average dengue notification rates in high transmission years by district, champasak and savannakhet provinces, lao pdr, 2003–2020 wpsar vol 13, no 4, 2022 | doi: 10.5365/wpsar.2022.13.4.932 https://ojs.wpro.who.int/4 zafar et aldengue epidemiological profile in southern lao pdr table 1. characteristics of dengue notifications, champasak and savannakhet provinces, lao pdr, 2003–2020 table 2. dengue fever notifications, deaths and notified cases as a proportion of national notifications, champasak and savannakhet provinces, lao pdr, 2003–2020 years with high transmission seasons are shown in bold. characteristic champasak savannakhet n % n % cases 2003–2020 2003–2020 male 12 621 51.6 14 750 51.7 female 11 858 48.4 13 759 48.3 total 24 479 100 28 509 100 deaths male 41 46.6 46 46.4 female 47 53.4 53 53.6 total 88 100 99 100 case definition old classification 2003–2009 2003–2019 dengue fever 7846 97.5 23 716 85.3 dengue haemorrhagic fever 138 1.7 3406 12.3 dengue shock syndrome 60 0.7 676 2.4 total 8044 100 27 798 100 2009 classification 2010–2020 2022 dengue without warning signs 13 590 82.7 508 71.4 dengue with warning signs 2170 13.2 170 23.9 severe dengue 675 4.1 33 4.6 total 16 435 100 711 100 year no. of cases (% of national total) no. of deaths (champasak and savannakhet) total no. of cases (lao pdr)champasak (n = 24 479) savannakhet (n = 28 509) 2003 914 (5.2) 6315 (35.7) 42 17 690 2004 700 (20.0) 752 (21.4) 13 3507 2005 1487 (27.2) 795 (14.5) 4 5471 2006 1187 (18.7) 314 (4.9) 1 6356 2007 1284 (26.0) 862 (17.4) 0 4943 2008 1557 (37.5) 1935 (46.6) 12 4149 2009 910 (11.8) 177 (2.3) 5 7706 2010 3029 (13.2) 2512 (11.0) 13 22 929 2011 522 (13.5) 50 (1.3) 4 3871 2012 938 (9.4) 225 (2.2) 3 9952 2013 5387 (12.2) 4959 (11.2) 42 44 171 2014 102 (5.9) 15 (0.9) 0 1716 2015 176 (11.0) 34 (2.1) 0 1600 2016 1343 (23.9) 655 (11.7) 13 5617 2017 732 (13.1) 956 (17.1) 5 11 049 2018 1022 (22.2) 922 (20.0) 11 6446 2019 3145 (8.3) 6320 (16.8) 19 37 700 2020 44 (0.5) 711 (8.6) 0 8305 wpsar vol 13, no 4, 2022 | doi: 10.5365/wpsar.2022.13.4.932https://ojs.wpro.who.int/ 5 dengue epidemiological profile in southern lao pdrzafar et al dengue notifications by sociodemographic characteristics population density in both provinces, the highest numbers of dengue notifications were generally observed in the more densely populated provincial capitals and their neighbouring districts (fig. 4a). however, when the capitals were removed, the association between dengue notification rates and population density was not statistically significant (pearson coefficient = 0.21, p = 0.013) (fig. 4b). age and sex the 5–14-year age group accounted for the highest proportion of cases, followed by the 15–30-year age group. 2007 and 2012 were notable for a higher-than-usual proportion of dengue notifications in those aged <1 year (fig. 5a). in all age groups, the majority of dengue infections were categorized as df (or dwos). the more severe cases, those categorized as dhf/dws and dss/sd, occurred most frequently in those aged 5–14 years old (table 4). overall, cases were more common in males than females (52% vs 48%) (table 1 and table 5); this male excess was also apparent in most age groups, in particular, in the 15–30-year age group. however, in absolute terms, the highest number of deaths occurred in females, with high case fatality rates recorded in those aged under 15 years in both sexes (table 5). occupation across the study period, young children (<5 years), students (5–18 years) and farmers have consistently experienced the greatest burden of dengue; on average, students accounted for 43% of dengue notifications and farmers for a further 22% (fig. 6). however, there has been a shift in the distribution of cases by occupation; whereas the proportion of cases reported in young children and students has fallen (from 84% in 2003 to 60% in 2019), the proportion of dengue notifications in farmers has increased over the same time period (from 6% to 30%). dengue cases were especially high among farmers in 2007 and 2011, when this group accounted for 44% and 45% of all cases, respectively (fig. 6). spatiotemporal variations in ltms the ltms for champasak and savannakhet were 113.3 (24 479/216; 95% confidence interval [cl]: 86.0–140.5) and 132.0 (28 509/216; 95% ci: 92.2–171.7) cases per month, respectively. the number of dengue cases exceeded the ltm for at least 3 consecutive months in 10 of the 18 years of the study period (2003–2020) in champasak and in 7 of the years in savannakhet (fig. 2a). both provinces experienced extended hightransmission periods. in champasak, the ltm was exceeded for 7 consecutive months in 2013 (march to september) and for 6 consecutive months in 2008, 2010 and 2019 (march to august). savannakhet experienced five prolonged epidemic periods, three lasting for 7 months (may to october) in 2003, 2008 and 2013, one for 6 months (june to october) in 2010, and one for 9 months (april to november) in 2019. the number of times the ltm was exceeded was greatest during the rainy season (may to september); during the period of our study, the ltm was most often exceeded in june and july (fig. 2b). in a district-level analysis, the highest ltm values were generally observed in or near the provincial capitals (fig. 3a). in savannakhet province, three districts exceeded the ltm threshold for 36-45 months and three districts for 46-50 months during the 216-month study period during the 216-month study period. in champasak province, seven districts exceeded the ltm threshold for 36–45 months and three districts for 56–58 months (fig. 3b). dengue serotypes occasional dengue serotype identification conducted by the national center for laboratory and epidemiology showed that in savannakhet, denv-1 was detected in 9 of the 11 years between 2003 and 2020 for which serotype data were available. denv-2 and denv-4 were also relatively common, being present in 6 out of 11 years, whereas denv-3 was only found in 2012 and 2013 (table 3). however, denv-3 was responsible for at least 80% of all reported dengue cases in lao pdr in 2012 and 2013. data indicate that in more recent years, denv-1 and denv-4 have been the more dominant serotypes, followed by denv-2, both nationally and in the champasak and savannakhet provinces (table 3). wpsar vol 13, no 4, 2022 | doi: 10.5365/wpsar.2022.13.4.932 https://ojs.wpro.who.int/6 zafar et aldengue epidemiological profile in southern lao pdr fig. 2b discussion this study describes the long-term dengue epidemic profile for champasak and savannakhet, two provinces in southern lao pdr. surveillance data from the two provinces indicate a high burden of disease. moreover, nationality a total of 218 cases of dengue were recorded among foreign nationals residing in lao pdr. of these, the highest numbers were seen in chinese and vietnamese citizens, primarily in those engaged in education, rice farming and trading activities (table 6). fig. 2. (a) number of months per year when dengue cases exceeded the long-term mean ; (b) number of times the long-term mean was exceeded each month compared to average monthly rainfall, champasak and savannakhet provinces, lao pdr, 2003–2020 a b wpsar vol 13, no 4, 2022 | doi: 10.5365/wpsar.2022.13.4.932https://ojs.wpro.who.int/ 7 dengue epidemiological profile in southern lao pdrzafar et al fig. 3. (a) long-term mean of dengue notifications per month, by district; (b) number of months when the longterm mean was exceeded, by district, champasak and savannakhet provinces, lao pdr, 2003–2020 to agricultural intensification, river dam construction in forests and associated resettlement of workers and inhabitants in remote areas.8 previous work has also shown a correlation between high density of built-up areas and high levels of development and dengue vulnerability within champasak and savannakhet provinces during 2003–2019.6 the ltm method proved useful for identifying not only the length of dengue epidemics in each year, but also the months with the highest dengue activity and the most affected districts. while the ltm remained high in eastern savannakhet and northern champasak throughout the study period, districts in central and western savannakhet exceeded their ltms for more months of the year than the eastern districts. this signals a change in dengue case distributions that may be linked to climatic and land cover changes, specifically an increase in mean temperature and in the number of new settlements in previously remote, less developed areas.6 especially high transmission seasons were observed in 2003, 2008, 2010, 2013 and 2019 in both of these two southern provinces, and across the country. over the study period, there has been a shift in the geographical distribution of cases in these two provinces. dengue notification rates were higher in more districts during the 2013 and 2019 high transmission seasons compared with 2003, when dengue notifications were largely confined to the more densely populated districts of western savannakhet and northern champasak and the provincial capitals. in 2019, four districts in savannakhet experienced notification rates in excess of 500 cases per 100 000 population, the highest recorded since the start of the study period in 2003. a similar pattern of increased emergence in new localities has also been reported by neighbouring countries.7 champasak and savannakhet provinces are among the four most populated provinces in lao pdr and have been experiencing extensive development due wpsar vol 13, no 4, 2022 | doi: 10.5365/wpsar.2022.13.4.932 https://ojs.wpro.who.int/8 zafar et aldengue epidemiological profile in southern lao pdr in 1983), all four serotypes have been co-circulating.9–11 however, denv-1 and denv-2 have consistently been present throughout much of the study period, both across the country as a whole and in the two southern provinces in this study, while the occurrence of denv-3 and denv-4 has been more sporadic. recent data from the lao pdr arbovirus surveillance network suggest that since 2016, there has been a steady decrease in the proportion of cases due to denv-4 (from 70% to 4% in 2020) and an increase in those caused by denv-2 (from 7% to 74% in 2020).10 dengue notification rates in both provinces tracked the rainy season, with the highest occurrence in june and july. the ltms followed a similar pattern – higher monthly ltms were typically observed for at least 3 consecutive months between may and october of each year. these seasonal and spatial patterns in dengue transmission were consistent with those reported in neighbouring south-east asian countries. lao pdr has been described as a hyperendemic denv country, and since the first outbreak in the country in 1979 (followed by the first major outbreak table 3. prevailing dengue serotypes in savannakhet and champasak provinces and lao pdr, 2003–2020 year serotype lao pdra savannakhetb champasak denv-1 (%) denv-2 (%) denv-3 (%) denv-4 (%) 2003 denv-1 denv-2 denv-4 – – – – – 2004 – – – – – – 2005 denv-1 – – – – – 2006 – – – – – – 2007 denv-1 denv-4 – – – – – 2008 – – – – – – 2009 denv-1 – – – – – 2010 denv-1 denv-4 – 38 30 22 10 2011 – – 75 12 13 0 2012 denv-2 denv-3 – 11 9 80 0 2013 denv-1 denv-2 denv-3 denv-2 denv-39 3 10 87 3 2014 – – 16 17 17 50 2015 – – 82 1 1 16 2016 denv-4 – 11 2 3 83 2017 – – 21 10 <1 69 2018 denv-1 denv-2 denv-4 denv-1 denv-2 denv-410 – – – – 2019 denv-1 denv-2 denv-1 11 – – – – 2020 denv-1 denv-2 denv-4 – – – – – a country-level serotype data are taken from the annual report of the national center for laboratory and epidemiology for 2017 (unpublished). the prevailing serotype is shown in bold. b data are provided by the savannakhet health department. wpsar vol 13, no 4, 2022 | doi: 10.5365/wpsar.2022.13.4.932https://ojs.wpro.who.int/ 9 dengue epidemiological profile in southern lao pdrzafar et al fig. 4. correlation between population density and average annual dengue notification rate (per 100 000 population) in districts of champasak (orange points) and savannakhet (blue points) provinces, (a) including and (b) excluding provincial capitals, lao pdr, 2003–2020 fig. 4 a b a b dengue infections were disproportionately high among children and adolescents aged <15 years. however, there were signs that age-specific notification rates are beginning to shift to older age groups, as evidenced by the observed 20–30% increase in the number of cases in older adolescents and adults (≥15 years) since 2005 (fig. 5a). other south-east asian countries population density has been identified as an important driving factor for high dengue transmission. the highest dengue notification rates by far were observed in the densely populated provincial capitals in both southern provinces. increasing urbanization and high population densities in cities have been associated with an elevated dengue risk with a high vector-to-host ratio.1 wpsar vol 13, no 4, 2022 | doi: 10.5365/wpsar.2022.13.4.932 https://ojs.wpro.who.int/10 zafar et aldengue epidemiological profile in southern lao pdr secondary infections that are considered important risk factors for severe clinical presentations.4 dengue case rates among females and males in all age groups remain broadly similar, although we observed a slightly higher case rate in males aged 15–29 years. have reported falls in their dengue notification rates among those aged <15 years. the increase in notification rates in older adults (15–45 years) may be explained by the spread of dengue into areas with lower rates of immunity among the population. changes in circulating dengue virus serotypes12 may also have led to a rise in fig. 5. (a) total number of dengue notifications by age group; (b) distribution of dengue notifications by age group and year, lao pdr, 2003–2020 a b wpsar vol 13, no 4, 2022 | doi: 10.5365/wpsar.2022.13.4.932https://ojs.wpro.who.int/ 11 dengue epidemiological profile in southern lao pdrzafar et al table 4. dengue notifications by case definition and age group, champasak and savannakhet provinces, lao pdr, 2003–2020 (percentage of total) table 5. dengue cases and deaths by age group and sex, champasak and savannakhet provinces, lao pdr, 2003–2020 fig. 6. proportion of dengue notifications by occupation and year, champasak and savannakhet provinces, lao pdr, 2003–2020 dengue case definition (old classification/2009 classification) age group (years) <1 1–4 5–14 15–29 30–44 45–59 ≥60 dengue fever/dengue without warning signs 93.6 87.3 79.0 90.1 92.7 94.8 95.5 dengue haemorrhagic fever/dengue with warning signs 5.7 10.4 15.7 8.7 6.7 5.0 4.0 dengue shock syndrome /severe dengue 0.6 2.3 5.3 1.1 0.7 0.2 0.5 dengue cases, n (%) dengue deaths, n (%) age group (years) female male female male <1 112 (0.2) 154 (0.3) 1 (0.89) 0 (0) 1–4 1751 (3.4) 1836 (3.6) 17 (0.97) 16 (0.87) 5–14 9726 (18.8) 10 072 (19.5) 67 (0.69) 57 (0.57) 15–29 8120 (15.7) 9528 (18.4) 11 (0.14) 12 (0.13) 30–44 3214 (6.2) 3294 (6.4) 4 (0.12) 2 (0.06) 45–59 1453 (2.8) 1304 (2.5) 1 (0.07) 0 (0) ≥60 632 (1.2) 479 (0.9) 1 (0.16) 0 (0) wpsar vol 13, no 4, 2022 | doi: 10.5365/wpsar.2022.13.4.932 https://ojs.wpro.who.int/12 zafar et aldengue epidemiological profile in southern lao pdr before the rainy season. as farmers and students under the age of 30 were the most affected groups, combined efforts by the education, agriculture and health ministries to make these groups more aware of the disease risks are recommended. interventions could include awarenessraising and educational programmes on effective indoor dengue vector control and preventive measures delivered through seminars and medical camps in villages and educational institutions (primary to university level). these could build on the success of the training in epidemic control aimed at village health volunteers, village heads and community schoolteachers currently provided by the international federation of red cross and red crescent societies, which have helped to increase villagers’ and communities’ health preparedness and response. in addition, community-level initiatives to control the spread of dengue should be encouraged; such initiatives might include reducing use of water storage containers, promoting use of larvicides to prevent mosquito breeding, use of mosquito nets and repellents in homes and in agricultural fields and increasing awareness of the risks posed by the accumulation of waste near households. conflicts of interest sumaira zafar is a phd student at the asian institute of technology under the denclim project funded by the research council of norway (grant number 281077). the other authors declare no conflicts of interest. ethics approval study protocols were approved by the khon kaen university ethics committee (reference no. he611228, 2 august 2018 and he631077, 24 march 2020) and the regional committees for medical and health research ethics in norway (2018/1085/rek sør-øst c, 27 june 2018). similarly, dengue case data reported through national surveillance systems of other countries in the who southeast asia and western pacific regions indicate that adult males aged >15 years are consistently at higher risk of infection than females.13 in this study, students and farmers were identified as being at higher risk of dengue infection compared with other occupational subgroups, a finding that is consistent with that of another study from lao pdr, which also found that farmers were the second most affected occupational group.14 dengue vectors are most active during the daytime. the primary dengue vector, ae. aegypti, is predominantly found indoors, which may account for increased exposure of children and students given that this group spends much of their day inside their homes or classrooms. farmers may have greater exposure to the secondary vector, ae. albopictus, which oviposits in tree holes and leaf axile.14 the data collected by provincial health departments inherently come with a few limitations: these include uncertainty in reporting, misdiagnosis and misreporting of symptomatic dengue, and absence of subclinical and asymptomatic infections. for confirmed dengue infections, the serotypes were rarely identified. travel-related infections are also common in these provinces, but this information was not included in the data and not easy to trace. in conclusion, this study has characterized the spatiotemporal trends in dengue transmission in southern lao pdr. since passive national surveillance data do not always include serotype and entomological information, it is recommended that detailed seroprevalence studies be conducted to further understand dengue epidemiology in lao pdr. such studies performed country-wide could help public health authorities develop improved action plans to implement vector control activities each year table 6. number of dengue notifications among foreign nationals (n = 218), by nationality and occupation, champasak and savannakhet provinces, lao pdr, 2003–2020 nationality occupation all children students service farmers commerce monks other all 218 12 21 3 40 110 3 29 vietnamese 117 8 16 2 28 36 3 24 chinese 97 3 5 0 10 74 0 5 other 4 1 0 1 2 0 0 0 wpsar vol 13, no 4, 2022 | doi: 10.5365/wpsar.2022.13.4.932https://ojs.wpro.who.int/ 13 dengue epidemiological profile in southern lao pdrzafar et al 8. power surge: the impacts of rapid dam development in laos. berkeley, ca: international rivers; 2008. available from: https:// archive.internationalrivers.org/resources/power-surge-the-impactsof-rapid-dam-development-in-laos-3964, accessed 30 march 2022. 9. phommanivong v, kanda s, shimono t, lamaningao p, darcy aw, mishima n, et al. co-circulation of the dengue with chikungunya virus during the 2013 outbreak in the southern part of lao pdr. trop med health. 2016;44:1–10. doi:10.1186/s41182-016-0020-y pmid:27524929 10. calvez e, bounmany p, balière c, somlor s, viengphouthong s, xaybounsou t, et al. using background sequencing data to anticipate denv-1 circulation in the lao pdr. microorganisms. 2021;9(11):2263. doi:10.3390/microorganisms9112263 pmid:34835389 11. calvez e, pommelet v, somlor s, pompon j, viengphouthong s, bounmany p, et al. trends of the dengue serotype-4 circulation with epidemiological, phylogenetic, and entomological insights in lao pdr between 2015 and 2019. pathogens. 2020;9(9): 728. doi:10.3390/pathogens9090728 pmid:32899416 12. kanakaratne n, wahala wm, messer wb, tissera ha, shahani a, abeysinghe n, et al. severe dengue epidemics in sri lanka, 2003-2006. emerg infect dis. 2009;15(2):192. doi:10.3201/ eid1502.080926 pmid:19193262 13. anker m, arima y. male-female differences in the number of reported incident dengue fever cases in six asian countries. western pac surveill response j. 2011;2(2):17–23. doi:10.5365/wpsar.2011.2.1.002 pmid:23908884 14. tangena jaa, thammavong p, lindsay sw, brey pt. risk of exposure to potential vector mosquitoes for rural workers in northern lao pdr. plos negl trop dis. 2017;11(7):1–17. doi:10.1371/journal.pntd.0005802 pmid:28742854 funding this research was supported by the research council of norway (denclim project, grant number 281077). references 1. gubler dj. dengue, urbanization and globalization: the unholy trinity of the 21st century. trop med health. 2011;39(suppl 4):3–11. doi:10.2149/tmh.2011-s05 pmid:22500131 2. fukunaga t, phommasack b, bounlu k, saito m, tadano m, makino y, et al. epidemiological situation of dengue infection in lao p.d.r. trop med. 1993;35(4):219–27. 3. khamphaphongphane b, lewis hc, ketmayoon p, phonekeo d, somoulay v, khamsing a, et al. national dengue surveillance in the lao people’s democratic republic, 2006–2012: epidemiological and laboratory findings. western pac surveill response j. 2014;5(1):7–13. doi:10.5365/wpsar.2014.5.1.001 pmid:24734212 4. dengue guidelines for diagnosis, treatment, prevention and control: new edition. geneva: world health organization; 2009. available from: https://apps.who.int/iris/handle/10665/44188, accessed 30 march 2022. 5. lao decide info [in lao]. vientiane: lao statistics bureau; 2019. available from: http://www.decide.la/%0a, accessed 15 january 2019. 6. zafar s, shipin o, paul re, rocklöv j, haque u, rahman m, et al. development and comparison of dengue vulnerability indices using gis-based multi-criteria decision analysis in lao pdr and thailand. int j environ res public health. 2021;18(17):9421. doi:10.3390/ ijerph18179421 pmid:34502007 7. arima y, matsui t. epidemiologic update of dengue in the western pacific region, 2010. western pac surveill response j. 2011;2(2):4– 8. doi:10.5365/wpsar.2011.2.2.005 pmid:23908882 https://ojs.wpro.who.int/ 1wpsar vol 13, no 4, 2022 | doi: 10.5365/wpsar.2022.13.4.960 case report n osocomial infection among immunocompromised patients is an emerging problem commonly encountered with multidrug-resistant gramnegative bacteria. ralstonia spp. are waterborne gramnegative bacteria, ubiquitous opportunistic environmental pathogens characterized as strong biofilm producers that are resistant to most antimicrobials. notable strains are r. pickettii, r. mannitolilytica and r. insidiosa.1 r. insidiosa has recently had increasing clinical relevance,2 especially in hospitals, because it can survive in different ultraor high-purification water systems used for industrial and laboratory methods.3,4 it can contaminate purified or distilled water used for medicinal procedures or products, and can survive in low-nutrient states and be resistant to commonly used antimicrobial agents such as chlorhexidine.5 the emergence of r. insidiosa as a causative agent of nosocomial infections was reported among immunocompromised individuals in the czech republic, where it led to bacteraemia among eight haemodialysis patients owing to contaminated haemodialysis solutions.6,7 a recent report from a chinese tertiary hospital has noted the emergence of multidrug-resistant r. insidiosa in clinical isolates.8 in january 2021, the department of internal medicine – infectious disease and infection prevention and control committee (ipcc) in the philippines declared an outbreak in a haemodialysis unit in baguio city when three patients were identified with ralstonia bacteraemia. haemodialysis sessions were suspended until the investigation was completed. the objectives of this study were to describe the three cases of ralstonia bacteraemia and to report the identification process and control measures implemented for this outbreak of r. insidiosa in a haemodialysis unit in baguio city. case series in this study, a confirmed case was defined as a patient who underwent haemodialysis and experienced a temperature of more than 38.5 °c or chills during or after a department of internal medicine, baguio general hospital and medical center, baguio city, philippines. b infection prevention and control committee, baguio general hospital and medical center, baguio city, philippines. published: 27 december 2022 doi: 10.5365/wpsar.2022.13.4.960 ralstonia insidiosa is an opportunistic pathogen considered an emerging problem among clinically vulnerable populations such as those with chronic kidney disease. this study presents three cases of ralstonia bacteraemia among chronic kidney disease patients in a haemodialysis unit in baguio city, the philippines. case 1 was an elderly male who experienced chills during two concurrent dialysis sessions. case 2 was a young female who also experienced chills and dizziness during a dialysis session; as this was thought to be related to hypotension, she was admitted. case 3 was an elderly female with known hypertension and diabetes who had been newly diagnosed with chronic kidney disease; she was brought to the emergency room hypotensive, dyspnoeic and disoriented with deranged laboratory parameters and was admitted to the intensive care unit. all three cases had blood cultures positive for r. insidiosa with an attack rate of 1.67%. drug and device tracing were conducted and environmental samples collected to identify the source of infection. a sample from the faucet of the reprocessing machine in the haemodialysis unit that was positive for ralstonia spp. was the source of the outbreak. control measures were implemented and the haemodialysis unit was thoroughly cleaned. no further cases were reported, with active surveillance continuing until january 2022. taken with previously published outbreaks, these findings suggest that medical products and devices can be contaminated with ralstonia spp. and cause illness. early identification of cases and the source of infection is required to prevent large outbreaks in this vulnerable population. outbreak of ralstonia bacteraemia among chronic kidney disease patients in a haemodialysis unit in the philippines denmarc r aranas,a bernard a demota and thea pamela t cajulaoa,b correspondence to denmarc r aranas (email: aranasdenmarc@gmail.com) wpsar vol 13, no 4, 2022 | doi: 10.5365/wpsar.2022.13.4.960 https://ojs.wpro.who.int/2 aranas et alralstonia outbreak in a haemodialysis unit ward. her chest tube was removed and the tip sent for culture. blood samples from two sites were submitted for culture and antibody sensitivity testing. the chest tube tip culture was positive for enterococcus faecalis and the blood culture was positive for bacteraemia with r. insidiosa. cefepime 500 mg intravenous once daily for 7 days was given for the ralstonia bacteraemia. the patient recovered from the bacteraemia and was discharged. case 3 case 3 was a 69-year-old female with known hypertension and diabetes mellitus. she had a 1-month history of bipedal oedema with decreasing urine output. she reported shortness of breath and progressive bipedal oedema in november 2020. she attended a different hospital where initial tests detected elevated creatinine, after which she was admitted and managed as a newly diagnosed chronic kidney disease patient secondary to hypertensive nephrosclerosis versus diabetic nephropathy. on 20 december 2020, the patient had bradycardia and hypotension at 80/50 mmhg and was given a dopamine drip. she was referred to our institution for haemodialysis the next day. the patient arrived at the emergency room with symptoms of drowsiness, disorientation and episodes of desaturation at 79% when on room air, and was afebrile. she had anicteric sclera, slightly pale palpebral conjunctiva and positive neck vein engorgement. her chest findings had crackles in the middle and basal lobes. the patient had bradycardia with irregular rhythm and no murmurs. extremities had pitting bipedal oedema, grade 3. the patient was assessed as having acute respiratory failure secondary to encephalopathy, which had resulted from chronic kidney disease, newly diagnosed, and itself the result of hypertensive nephrosclerosis versus diabetic nephropathy, complicated urinary tract infection, pulmonary congestion, metabolic acidosis, multiple electrolyte imbalance and anaemia; uncontrolled stage 2 hypertension; diabetes mellitus type 2, non-obese, non-insulin requiring; and suspected coronavirus disease (covid-19). the patient was admitted to the intensive care unit for close monitoring and further management, and was then initiated on haemodialysis. a complete blood count revealed increased white blood cells with neutrophilic predominance. blood culture detected the the session with a positive blood culture for r. insidiosa from december 2020. clinical histories and laboratory examinations were reviewed for all reported patients. active surveillance, whereby symptomatic patients from the haemodialysis unit had specimens collected for blood culture and sensitivity testing, was initiated, and continued until january 2022. all specimens underwent sensitivity testing for a range of antibiotics. three patients from the haemodialysis unit fit the case definition (table 1). the haemodialysis centre has 30 units catering to 180 dialysis patients; thus, the attack rate was 1.67%. case 1 case 1 was a 70-year-old male with known stage 5 chronic kidney disease secondary to hypertensive nephrosclerosis. he was on maintenance haemodialysis twice a week at the haemodialysis unit. during a haemodialysis session on 9 december 2020, the patient experienced chills with no associated chest pain or fever. a specimen was collected for blood culture and sensitivity testing before discharge from the haemodialysis unit. three days later, the patient underwent his next regular haemodialysis with recurrence of chills. after haemodialysis, the patient was sent to the emergency room. he was awake, comfortable, not in distress and had stable vital signs. the patient has an intact right internal jugular catheter. he was sent home and advised to continue maintenance medications and haemodialysis. the blood culture revealed growth of r. insidiosa. he was prescribed cotrimoxazole 800/160 one tablet daily for 7 days for the bacteraemia. the patient recovered from the bacteraemia and was discharged. case 2 case 2 was a 32-year-old female with known stage 5 chronic kidney disease secondary to chronic glomerulonephritis. she was on haemodialysis twice a week. a few hours before admission to the haemodialysis unit on 17 december 2020, she experienced chills, dizziness and body weakness, with hypotension at 80/60 mmhg. a 500 ml fast drip of normal saline solution was given and haemodialysis continued. as the chills and body weakness persisted, the haemodialysis was terminated and the patient was transferred to the emergency room. she was diagnosed with sepsis and admitted to the isolation wpsar vol 13, no 4, 2022 | doi: 10.5365/wpsar.2022.13.4.960https://ojs.wpro.who.int/ 3 ralstonia outbreak in a haemodialysis unitaranas et al radiobacter, bacillus spp., sphingomonas paucimobilis, pseudomonas putida, pseudomonas stutzeri, acinetobacter baumannii, delftia acidovorans, serratia plymuthica, aeromonas hydrophila, aeromonas punctata, klebsiella oxytoca, coagulase-negative staphylococci, staphylococcus epidermidis, staphylococcus haemolyticus and leclercia adecarboxylata (table 3). the faucet of the reprocessing machine was the only site that was positive for ralstonia species. standard and contact infection, prevention and control precautions and disinfection of equipment and the environment were implemented in the haemodialysis unit. the unit was monitored for effectiveness of these preventive measures with follow-up environmental swabs taken to ensure elimination of the source of infection. the wide range of organisms found in the haemodialysis unit indicates the need for maintaining a thorough general cleaning and regular disinfection protocol to prevent opportunistic infections. upon the results of the environmental testing, thorough disinfection and general cleaning of the haemodialysis unit was conducted. discussion three cases of ralstonia insidiosa infection were detected within the haemodialysis unit and were linked to a contaminated faucet in the haemodialysis reprocessing machine. upon detection of these cases, haemodialysis sessions were suspended and an investigation commenced. environmental evidence determined the source of infection, after which the faucet of the haemodialysis growth of r. insidiosa. co-trimoxazole 800/160 one tablet daily for 7 days was given for the bacteraemia. the patient recovered from the bacteraemia and was discharged. antibiotic susceptibility testing antibiograms of cases 1 and 2 were both resistant to amikacin and gentamicin with sensitivity to most of the other antibiotics tested. case 2 was also resistant to piperacillin-tazobactam. case 3 was sensitive or had intermediate results for all antibiotics (table 2). investigation and control measures a review of all drugs and devices used for each case from 15 days before the onset of symptoms until the confirmation of ralstonia bacteraemia was conducted. on 10–15 january 2021, environmental samples were collected from 44 sites throughout the haemodialysis unit, including reprocessing tubing, faucets, suction tubing, suction containers, water sources, venous or arterial site coupling machines and bleach source machines. samples were also collected from supplies, disinfectants, working areas and devices. all samples were cultured by the hospital’s department of pathology for identification to the genus level only. sensitivity testing was not conducted as per the hospital protocol for environmental samples. of the 44 collected samples, 25 were positive for a range of organisms, including: ralstonia spp., aeromonas spp., pseudomonas aeruginosa, rhizobium table 1. clinical characteristics of three cases of ralstonia bacteraemia detected among chronic kidney disease patients at a single institution in baguio city, the philippines, 2020 characteristics case 1 case 2 case 3 onset date 9 december 17 december 20 december age/sex 70/male 32/female 62/female comorbidities chronic kidney disease, hypertension chronic kidney disease, hypertension chronic kidney disease, hypertension, diabetes mellitus haemodialysis access right internal jugular catheter right internal jugular catheter right internal jugular catheter time on haemodialysis 1 year 1 year 2 months presenting symptoms chills chills, hypotension disoriented, hypotension, fever treatment received for bacteraemia co-trimoxazole 800/160 1 tablet once daily for 7 days cefepime 500 mg intravenous once daily for 7 days co-trimoxazole 800/160 1 tablet once daily for 7 days outcome discharged discharged discharged wpsar vol 13, no 4, 2022 | doi: 10.5365/wpsar.2022.13.4.960 https://ojs.wpro.who.int/4 aranas et alralstonia outbreak in a haemodialysis unit table 2. antibiogram of r. insidiosa isolates in blood cultures in the three clinical cases of ralstonia bacteraemia detected among chronic kidney disease patients at a single institution in baguio city, the philippines, 2020 table 3. environmental samples from a haemodialysis unit where ralstonia bacteraemia was detected among chronic kidney disease patients by site and results at a single institution in baguio city, the philippines, 10–15 january 2021 antimicrobial case 1 case 2 case 3 mic (μg/ml) interpretation mic (μg/ml) interpretation mic (μg/ml) interpretation amikacin ≥64 r ≥64 r 8 s cefepime 2 s 4 s ≤1 s ceftazidime 16 i 16 i ≤1 s ciprofloxacin ≤0.25 s ≤0.25 s ≤0.25 s gentamicin ≥16 r ≥16 r 8 i imipenem 2 s 2 s 2 s meropenem 4 s 4 s 2 s piperacillin/tazobactam 64 i ≥128 r 64 i trimethoprim/sulfamethoxazole ≤20 s ≤20 s ≤20 s i: intermediate; mic: minimum inhibitory concentration; r: resistant; s: sensitive. sites growth 1. faucet, reprocessing machine ralstonia spp. 2. reprocessing tubing, station 2 aeromonas spp. 3. reprocessing tubing, hep c pseudomonas aeruginosa 4. reprocessing tubing, hep b no growth after 48 hours of incubation 5. water processing machine knobs rhizobium radiobacter 6. point of use no growth after 48 hours of incubation 7. product tank no growth after 48 hours of incubation 8. acid mixer faucet no growth after 48 hours of incubation 9. bubbler, station 3 bacillus spp. 10. oxygen port, station 20 sphingomonas paucimobilis 11. oxygen port, station 18 no growth after 48 hours of incubation 12. panasonic refrigerator bacillus spp. 13. suction tubing 1 no growth after 48 hours of incubation 14. suction tubing 2 no growth after 48 hours of incubation 15. suction container 1 pseudomonas putida 16. suction container 2 no growth after 48 hours of incubation 17. suction container 3 no growth after 48 hours of incubation 18. venous site coupling, machine 30 pseudomonas stutzeri 19. arterial site coupling, machine 30 acinetobacter baumannii 20. water source, machine 30 no growth after 48 hours of incubation 21. citro clean, machine 30 no growth after 48 hours of incubation 22. bleach source, machine 30 no growth after 48 hours of incubation 23. chair, machine 30 staphylococcus haemolyticus 24. venous site coupling, machine 13 no growth after 48 hours of incubation 25. arterial site coupling, machine 13 no growth after 48 hours of incubation wpsar vol 13, no 4, 2022 | doi: 10.5365/wpsar.2022.13.4.960https://ojs.wpro.who.int/ 5 ralstonia outbreak in a haemodialysis unitaranas et al the czech republic, eight cases of central venous catheter infections by ralstonia insidiosa were observed; all isolates from cases had antibiotic sensitivities to betalactams and fluoroquinolones and were resistant to aminoglycosides.9 two isolates from this study had similar antibiotic sensitivities to fluoroquinolones, sulfonamide and carbapenems and resistance to aminoglycosides. one case’s isolate had antibiotic sensitivity to almost all drug classes with no resistance. in conclusion, three patients with chronic kidney disease who required haemodialysis developed bacteraemia with r. insidiosa. all three cases had good clinical outcomes after identification of the organism and specific antibiotic treatment. the source of the contamination was identified through environmental testing of possible sites within the haemodialysis unit and was determined to be the faucet of the haemodialysis reprocessing machine. taken with previously published outbreaks of ralstonia spp., these findings suggest that medical products and devices can be contaminated with these species and should be suspected when cases are detected. early identification of these cases and the source of infection is required to prevent large outbreaks and to ensure protection of vulnerable populations such as immunosuppressed patients with end-stage renal disease on haemodialysis. reprocessing machine was appropriately disinfected and cleaning of the haemodialysis unit was initiated. no further cases have been reported, with active surveillance continuing until january 2022. several other outbreaks have been reported involving contaminated haemodialysis water as the source of infection.10,11 the low attack rate of 1.67% suggests that the three cases were more vulnerable to infection; however, most patients who require dialysis have similar disease profiles with additional comorbidities and are of older age. the finding that cases had the same access site of the internal jugular haemodialysis catheter does not contribute to increased vulnerability. right-sided catheters do not relate to increased catheter-related dysfunction and infection. it is therefore possible that they had a greater chance of exposure to the source of infection.12 treatment for the three cases in this study was 7 days of cefepime and co-trimoxazole only, given according to the sensitivity of the isolates. in other published outbreaks, most ralstonia infections are treated with ciprofloxacin, amikacin piperacillin-tazobactam, meropenem or a combination of aminoglycosides and cephalosporins with a good response.8–10 there are no current standard recommendations for drugs or duration of treatment of ralstonia bacteraemia. in a report from sites growth 26. water source, machine 13 delftia acidovorans 27. bleach source, machine 13 no growth after 48 hours of incubation 28. citro clean, machine 13 no growth after 48 hours of incubation 29. oxygen tank, station 4 no growth after 48 hours of incubation 30. e-cart supply box no growth after 48 hours of incubation 31. oxygen port, station 20 no growth after 48 hours of incubation 32. water source, pantry serratia plymuthica 33. pantry sink, faucet aeromonas, hydrophila; aeromonas punctata; klebsiella oxytoca 34. water dispenser bacillus spp. 35. locker handles staphylococcus condimenti 36. telephone pseudomonas stutzeri 37. keyboard and mouse, station 2 coagulase-negative staphylococci 38. keyboard and mouse, station 1 coagulase-negative staphylococci 39. medicine table drawer handle staphylococcus epidermidis 40. medicine preparation table bacillus spp. 41. main door handle staphylococcus haemolyticus 42. dialysis stretcher pseudomonas stutzeri 43. weight log leclercia adecarboxylata 44. working area pseudomonas stutzeri wpsar vol 13, no 4, 2022 | doi: 10.5365/wpsar.2022.13.4.960 https://ojs.wpro.who.int/6 aranas et alralstonia outbreak in a haemodialysis unit 4. hoefel d, monis p, grooby w, andrews s, saint c. profiling bacterial survival through a water treatment process and subsequent distribution system. j appl microbiol. 2005;99(1):175–86. doi:10.1111/j.1365-2672.2005.02573.x pmid:15960678 5. ryan mp, adley cc. the antibiotic susceptibility of water-based bacteria ralstonia pickettii and ralstonia insidiosa. j med microbiol. 2013;62(7):1025–31. doi:10.1099/jmm.0.054759-0 pmid:23579396 6. van der beek d, magerman k, bries g, mewis a, declercq p, peeters v, et al. infection with ralstonia insidiosa in two patients. clin microbiol newsl. 2005;27(20):159–61. doi:10.1016/j.clinmicnews.2005.09.007 7. orlíková h, prattingerová j, žemličková h, melicherčíková v, urban j, sochorová m. [bacteremia and sepsis caused by ralstonia insidiosa (ralstonia pickettii-like) in dialysis patients in a czech hospital in the period january-may 2011]. zprávy centra epidemiologie a mikrobiologie. 2011;20(8):290–4. [czech] 8. fang q, feng y, feng p, wang x, zong z. nosocomial bloodstream infection and the emerging carbapenem-resistant pathogen ralstonia insidiosa. bmc infect dis. 2019;19(1):334. doi:10.1186/ s12879-019-3985-4 pmid:31014269 9. vošterová m, barková j, šrámek j. catheter infections caused by ralstonia insidiosa. liberec. czech republic: krajská nemocnice liberec a.s.; 2011. available from: https://www.edtnaerca.org/ resource/edtna/files/p%20097%20catheter%20infections%20 caused%20by%20ralstonia%20isidios.pdf, accessed 15 february 2022. 10. tejera d, limongi g, bertullo m, cancela m. ralstonia pickettii bacteremia in hemodialysis patients: a report of two cases. rev bras ter intensiva. 2016;28(2):195–8. doi:10.5935/0103507x.20160033 pmid:27410414 11. vincenti s, quaranta g, de meo c, bruno s, ficarra mg, carovillano s, et al. non-fermentative gram-negative bacteria in hospital tap water and water used for haemodialysis and bronchoscope flushing: prevalence and distribution of antibiotic resistant strains. sci total environ. 2014;499:47–54. doi:10.1016/j.scitotenv.2014.08.041 pmid:25173861 12. engstrom bi, horvath jj, stewart jk, sydnor rh, miller mj, smith tp, et al. tunneled internal jugular hemodialysis catheters: impact of laterality and tip position on catheter dysfunction and infection rates. j vasc interv radiol. 2013;24(9):1295–302. doi:10.1016/j.jvir.2013.05.035 pmid:23891045 acknowledgements the authors thank the infection prevention and control committee of baguio general hospital and medical center, as well as all the nurses and staff for their support and guidance. conflicts of interest the authors have no conflicts of interest to declare. ethics statement ethics approval was not required for the study because it was observational and anonymized case data were sourced from hospital medical records. funding this research is a stand-alone project and was financed by the investigators. references 1. xu y, nagy a, bauchan gr, xia x, nou x. enhanced biofilm formation in dual-species culture of listeria monocytogenes and ralstonia insidiosa. aims microbiol. 2017;3(4):774–83. doi:10.3934/ microbiol.2017.4.774 pmid:31294188 2. ryan mp, adley cc. ralstonia spp.: emerging global opportunistic pathogens. eur j clin microbiol infect dis. 2014;33(3):291–304. doi:10.1007/s10096-013-1975-9 pmid:24057141 3. ryan mp, pembroke jt, adley cc. genotypic and phenotypic diversity of ralstonia pickettii and ralstonia insidiosa isolates from clinical and environmental sources including high-purity water. diversity in ralstonia pickettii. bmc microbiol. 2011;11(1):194. doi:10.1186/1471-2180-11-194 pmid:21878094 https://www.edtnaerca.org/resource/edtna/files/p%20097%20catheter%20infections%20caused%20by%20ralstonia%20isidios.pdf https://www.edtnaerca.org/resource/edtna/files/p%20097%20catheter%20infections%20caused%20by%20ralstonia%20isidios.pdf https://www.edtnaerca.org/resource/edtna/files/p%20097%20catheter%20infections%20caused%20by%20ralstonia%20isidios.pdf https://ojs.wpro.who.int/ 1wpsar vol 13, no 3, 2022 | doi: 10.5365/wpsar.2022.13.3.943 original research s evere acute respiratory syndrome coronavirus 2 (sars-cov-2) causes the coronavirus disease (covid-19), which has rapidly spread worldwide. novel variants have been reported, particularly with mutations in the receptor-binding domain (rbd) of the spike protein that may affect infectivity, transmissibility, immune evasion and disease severity. based on virological characteristics and epidemic status, the world health organization (who) and other agencies have designated variants of concern (voc), variants of interest and variants under monitoring.1,2 by 18 october 2021, the pango lineage b.1.1.7 and b.1.167.2 (who label: alpha and delta, respectively) were designated as voc. b.1.1.7 and b.1.617.2 are characterized by n501y, d614g and p168h mutations in the rbd and l452r, t487k, d614g and p618r mutations, respectively. the alpha variant, first identified in the united kingdom of great britain and northern ireland in november 2020, spread rapidly nationally and then globally and was more infectious and transmissible than the earlier strains.3–5 in japan, the alpha variant was first detected at the end of december 2020 among travellers from the united kingdom and, in january 2021, in a covid-19 patient without a history of international travel. the delta variant demonstrated immune evasion a center for surveillance, immunization and epidemiologic research, national institute of infectious diseases, tokyo, japan. b center for research planning and coordination, national institute of infectious diseases, tokyo, japan. c department of bacteriology i, national institute of infectious diseases, tokyo, japan. published: 16 september 2022 doi: 10.5365/wpsar.2022.13.3.943 objective: monitoring the prevalence of severe acute respiratory syndrome coronavirus 2 (sars-cov-2) variants is important due to concerns regarding infectivity, transmissibility, immune evasion and disease severity. we evaluated the temporal and regional replacement of previous sars-cov-2 variants by the emergent strains, alpha and delta. methods: we obtained the results of polymerase chain reaction screening tests for variants conducted in multiple commercial laboratories. assuming that all previous strains would be replaced by one variant, the new variant detection rate was estimated by fitting a logistic growth model. we estimated the transmission advantage of each new variant over the preexisting virus strains. results: the variant with the n501y mutation was first identified in the kinki region in early february 2021, and by early may, it had replaced more than 90% of the previous strains. the variant with the l452r mutation was first detected in the kanto-koshin region in mid-may, and by early august, it comprised more than 90% of the circulating strains. compared with pre-existing strains, the variant with the n501y mutation showed transmission advantages of 48.2% and 40.3% in the kanto-koshin and kinki regions, respectively, while the variant with the l452r mutation showed transmission advantages of 60.1% and 71.9%, respectively. discussion: in japan, alpha and delta variants displayed regional differences in the replacement timing and their relative transmission advantages. our method is efficient in monitoring and estimating changes in the proportion of variant strains in a timely manner in each region. replacement of sars-cov-2 strains with variants carrying n501y and l452r mutations in japan: an epidemiological surveillance assessment yusuke kobayashi,a takeshi arashiro,a miyako otsuka,a yuuki tsuchihashi,a takuri takahashi,a yuzo arima,a yura k. ko,a kanako otani,a masato yamauchi,a taro kamigaki,a tomoko morita-ishihara,b hiromizu takahashi,b sana uchikoba,b michitsugu shimatani,b nozomi takeshita,b motoi suzukia and makoto ohnishic correspondence to yusuke kobayashi (email: yusuke-k@niid.go.jp) wpsar vol 13, no 3, 2022 | doi: 10.5365/wpsar.2022.13.3.943 https://ojs.wpro.who.int/2 kobayashi et alsars-cov-2 variant replacement in japan which were commissioned by the niid for an active epidemiological investigation based on the provisions of the act on the prevention of infectious diseases and medical care for patients with infectious diseases. in 2021, data were shared weekly with the niid from 8 march to 17 may and from 7 june to 20 september for the variant with the n501y mutation and the variant with the l452r mutation, respectively. data were obtained on the numbers of specimens with and without mutations, the dates of specimen submission and the prefectures of the testing institutions. the number of commercial laboratories that provided data increased over time. six and seven laboratories shared data on the variants with the n501y and l452r mutations, respectively. a sensitivity analysis was undertaken to compare data between the period when all laboratories were submitting samples and the total period. for the variant with the n501y mutation, the sensitivity analysis compared the results from the period when data were reported from all six laboratories to those from the entire study period, including weeks when not all data were available. for the variant with the l452r mutation, the sensitivity analysis compared the results from the period when data were reported from all seven laboratories to those from the entire study period. assuming that all previous strains would be replaced by one variant, we estimated detection rates by fitting a daily logistic growth model to the mutation detection rates for each region. the denominator was the number of specimens with information regarding the presence of mutation, excluding those that could not be analysed by screening tests. based on the same data, we estimated the transmission advantage of each variant over the preexisting virus strains that were available from the genomic surveillance data.12,13 the serial interval of covid-19 required for the calculation was set to 4.8 days.14 we conducted analyses of the kanto-koshin and kinki regions, which are metropolitan areas that include major urban centres (e.g. tokyo and osaka) and tend to be the centres of epidemics, plus the total for japan. daily numbers of covid-19 cases reported from each region were obtained from data published by the ministry of health, labour and welfare (mhlw).10 all statistical analyses were performed using r software (r foundation for statistical computing, vienna, austria). this study was conducted under the provisions of the act on the prevention of infectious diseases and medical care for with higher infectivity and transmissibility than previous strains.6,7 in japan, the delta variant was first identified in april 2021 in a patient without a travel history, and multiple cases were detected earlier in quarantined international travellers. whole-genome sequencing (wgs) is used to classify sars-cov-2 variants, with who developing guidance on surveillance methods using wgs for covid-19.8 in japan, wgs is mainly performed at the national institute of infectious diseases (niid), as well as at some local public health institutes (phis), university laboratories and commercial laboratories. however, testing all covid-19 specimens by wgs has been challenging; on 27 september 2021, wgs had been conducted for 88 355 specimens, which corresponded to 5.2% of the 1 707 848 reported cases, including duplicate cases.9,10 therefore, in japan, screening tests for variants are also conducted using the polymerase chain reaction (pcr) methods developed by the niid and commercial laboratories to detect the n501y and l452r mutations in the alpha and delta variants, respectively. since the end of march 2021, approximately 40% of patients who tested positive for covid-19 at phis and commercial laboratories have undergone these pcr variant screening tests. wgs is then performed preferentially on those specimens that are positive for each mutation by the pcr variant screening test, which biases the wgs results toward strains with these mutations.11 newly emerging variant strains, as mentioned above, may have different characteristics than preexisting strains. it is very important to know the local status of these variant strains in the region for appropriate public health and clinical response, such as duration of isolation, estimating vaccine efficacy and selecting appropriate antiviral drugs. as far as we know, this is the first regional comparative study on variant replacement in japan. we analysed the replacement of previous strains by variants with the n501y and l452r mutations using region-wide data obtained from pcr screening tests and estimated the transmission advantages of the alpha and delta variants over pre-existing strains to describe geographical distribution differences in japan. methods we obtained the results of pcr screening tests for variants conducted in multiple commercial laboratories, wpsar vol 13, no 3, 2022 | doi: 10.5365/wpsar.2022.13.3.943https://ojs.wpro.who.int/ 3 sars-cov-2 variant replacement in japankobayashi et al the increase in transmission advantage of the variant with the n501y mutation relative to the pre-existing virus strains was 48.2% (95% confidence interval [ci]: 46.5–50.2%) in the kanto-koshin region, 40.3% (95% ci: 37.3–43.5%) in the kinki region and 39.5% (95% ci: 38.4–40.7%) nationwide (fig. 3). variant with the l452r mutation between 7 june (week 23) and 20 september (week 38), pcr screening tests to detect the variant with the l452r mutation were conducted on 251 783 specimens, which accounted for 23.6% of the 913 109 specimens reported positive for sars-cov-2 during the same period. relative to the number of covid-19 cases reported, screening was highest in the kanto-koshin region (38.4 per 100 reported cases) and lowest in the shikoku region (5.6 per 100 reported cases) (table 1). the highest number of specimens was obtained from the kanto-koshin region (183 315, 72.8%), followed by the kinki region (29 639, 11.8%). the average interval between the time when the specimens were submitted to each laboratory and their being reported to the niid was 8.5 days (standard deviation: 0.6 days). in the kanto-koshin region, the variant with the l452r mutation was first detected in mid-may (week 20), and by early august (week 31), it had replaced more than 90% of the virus strains previously prevalent in the region. this same variant was detected in the kinki region in early june (week 23), and by mid-august (week 33), it had replaced more than 90% of the previous virus strains prevalent in the region. in japan, more than 90% of the existing virus strains had been replaced by the variant with the l452r mutation in early august (week 31) (fig. 1b). the sensitivity analysis showed that in the period when specimens were submitted from all laboratories, compared with all study periods, 50% of the variants with the l452r mutation were replaced by the circulated strain on day 0 in japan, the kanto-koshin region and the kinki region; meanwhile, 90% of the variant with the l452r mutation was replaced by the previous strain 1 day later in japan, 1 day earlier in the kanto-koshin region and on day 0 in the kinki region. the proportion of specimens with the l452r variant in the kanto-koshin region increased from week 24; the kinki and kyushu regions followed, and at week 32, patients with infectious diseases and did not require ethical approval, as no personally identifiable information was collected. results variant with the n501y mutation during 2021, between 8 march (week 10) and 17 may (week 20), pcr screening tests detected the n501y mutation in 37 823 specimens, which accounted for 15.3% of the 247 962 specimens that were positive for sarscov-2 during the same period, including duplicated samples (table 1). relative to the number of covid-19 cases reported, screening was the highest in the kanto-koshin region (23.8 per 100 reported cases) and lowest in the hokuriku region (3.1 per 100 reported cases) (table 1). the highest number of specimens was obtained in the kanto-koshin region (19 369, 51.2%), followed by the kinki region (10 108, 26.7%). although the data were reported to the niid each week, the average duration between the time the specimens were submitted to each laboratory and their being reported to the niid was 9.4 days (standard deviation: 1.0 days). in the kinki region, the variant with the n501y mutation was detected in early february (week 5), and by mid-april (week 15), it had replaced more than 90% of the virus strains previously circulating. in the kantokoshin region, the variant with the n501y mutation was detected in mid-february (week 6), and by mid-may (week 19), it had replaced more than 90% of the previously prevalent strains. in japan, more than 90% of the previous virus strains were replaced by the variant with the n501y mutation by early may (week 18; fig. 1a). the sensitivity analysis showed that in the periods when specimens were submitted from all laboratories, compared with all study periods, 50% of the variants with the n501y mutation were replaced by the circulated strain 4 days, 1 day and 20 days earlier in all of japan, the kanto-koshin region and the kinki region, respectively. however, 90% were replaced by the previous strain 3 and 2 days later in japan and the kanto-koshin region, respectively, and 2 days earlier in the kinki region. the proportion of samples with the n501y mutation increased from week 10 in the kinki region, followed by in western japan, including the chugoku and shikoku regions, and in week 18, it was detected in the majority of samples in all of japan (fig. 2a). wpsar vol 13, no 3, 2022 | doi: 10.5365/wpsar.2022.13.3.943 https://ojs.wpro.who.int/4 kobayashi et alsars-cov-2 variant replacement in japan the points represent the proportion of positive results by submission date, and the bars represent the respective 95% confidence intervals. the lines indicate the estimated proportion of positive results based on the logistic growth model for the respective variant. the detection rates of the alpha (b.1.1.7) and delta (b.1.167.2 or ay.29) variants in japan were obtained using genomic surveillance data.11 summary the number of covid-19 cases in japan increased substantially from march to june 2021 and from july to september 2021, which coincided with increased proportions of variants with the n501y and l452r mutations assumed to have been the dominant strain in these the majority of specimens in japan were positive for this variant (fig. 2b). the transmission advantage of this variant increased by 60.1% (95% ci: 59.3–60.9%) in the kanto-koshin region, 71.9% (95% ci: 69.4–74.5%) in the kinki region and 58.3% (95% ci: 57.6–59.0%) nationwide, compared with the pre-existing virus strains (alpha variant) (fig. 3). table 1. pcr tests conducted for n501y and l452r mutation screening and covid-19 cases reported by region, japan, march to september 2021 fig. 1. rise in proportions of the (a) n501y mutation and b.1.1.7 variant, january to may, and (b) l452r mutation and ay.29 (b.1.167.2) variant, may to september, japan, 2021 region n501y l452r 8 march to 17 may 2021 7 june to 20 september 2021 a) number of variant screening tests performed b) number of covid-19 cases reported a) to b) ratio a) number of variant screening tests performed b) number of covid-19 cases reported a) to b) ratio hokkaido 1955 11 302 17.3 6186 20 258 30.5 tohoku 549 10 428 5.3 1896 19 351 9.8 kanto-koshin 19 369 81 471 23.8 183 315 477 227 38.4 hokuriku 130 4187 3.1 860 13 053 6.6 tokai 2157 21 987 9.8 14 038 90 442 15.5 kinki 10 108 80 016 12.6 29 639 165 811 17.9 chugoku 1023 8708 11.7 3293 22 470 14.7 shikoku 232 4006 5.8 495 8915 5.6 kyushu 1606 20 255 7.9 8496 65 259 13.0 okinawa 694 5602 12.4 3565 30 322 11.8 japan 37 823 247 962 15.3 251 783 913 108 23.6 0.0 0.2 0.4 0.6 0.8 1.0 1 j an 8 j an 15 j an 22 j an 29 j an 5 f eb 12 f eb 19 f eb 26 f eb 5 m ar 12 m ar 19 m ar 26 m ar 2 a pr 9 a pr 16 a pr 23 a pr 30 a pr 7 m ay 14 m ay 21 m ay 28 m ay day p ro po rt io n kanto-koshin kinki japan alpha (b.1.1.7) based on genomic surveillance 0.0 0.2 0.4 0.6 0.8 1.0 1 m ay 8 m ay 15 m ay 22 m ay 29 m ay 5 j un 12 j un 19 j un 26 j un 3 j ul 10 j ul 17 j ul 24 j ul 31 j ul 7 a ug 14 a ug 21 a ug 28 a ug 4 s ep 11 s ep 18 s ep 25 s ep 2 o ct day p ro po rt io n (a) (b) wpsar vol 13, no 3, 2022 | doi: 10.5365/wpsar.2022.13.3.943https://ojs.wpro.who.int/ 5 sars-cov-2 variant replacement in japankobayashi et al colour range shows proportions positive for the variants with mutation, from low (yellow) to high (red), indicating changes in the proportion of variants in each region. fig. 2. biweekly geographical distribution of variants with the (a) n501y (weeks 10–18) and (b) l452r (weeks 24–32) mutations by week and region, japan, 2021 tohoku hokkaido kanto-koshin tokai hokuriku kinki chugoku shikoku kyushu okinawa tokyo sendai sapporo nagoya osaka fukuoka week 10 week 12 week 14 week 16 week 18 proportion 1.0 0.0 tohoku hokkaido kanto-koshin tokai hokuriku kinki chugoku shikoku kyushu okinawa tokyo sendai sapporo nagoya osaka fukuoka week 24 week 26 week 28 week 30 week 32 proportion 1.0 0.0 (a) (b) wpsar vol 13, no 3, 2022 | doi: 10.5365/wpsar.2022.13.3.943 https://ojs.wpro.who.int/6 kobayashi et alsars-cov-2 variant replacement in japan various sars-cov-2 variants have emerged worldwide since the beginning of 2021, some of which spread rapidly and have become dominant in certain countries. in japan, the proportion of variants with the n501y and l452r mutations increased in line with the increased number of covid-19 cases from march to june (fourth wave) and from july to september (fifth wave) 2021, respectively, with the increase in the proportion of these strains probably resulting in the respective epidemics. according to the wgs results, the b.1.214 strain accounted for the majority of cases in japan from october 2020 to february 2021 (third wave), after which the number of cases with the r.1 strain increased, followed by cases with the alpha variant. from march to june 2021 (fourth wave), the alpha variant accounted for a large proportion of cases, while the number of cases with the r.1 strain decreased around mid-march. from late may onward, the number of cases with the b.1.617.2 variant (delta variant; mostly reclassified as ay.29) increased, accounting for a large case proportion from july to september (fifth wave).11 therefore, it was considered epidemics, respectively (fig. 4). the data and published genomic surveillance results showed that the detection rate was higher for the alpha variant (genomic surveillance) relative to that of the variant with the n501y mutation in screening. however, the detection rates of the delta variant and those of the variant with the l452r mutation were almost identical (fig. 1).11 discussion this study revealed a rapid replacement of pre-existing virus strains by the variant with the n501y mutation from mid-february 2021 in the kinki region and the variant with the l452r mutation from late june in the kantokoshin region, which thereafter spread throughout japan. relative to pre-existing virus strains, the transmission advantage of the variant with the n501y mutation increased by 39.5% and that of the variant with the l452r mutation by 58.3%. fig. 3. estimated transmission advantages of the (a) n501y mutation (march to may) and (b) l452r mutation variant (may to september) in the kanto-koshin region, kinki region and japan, 2021 0 25 50 75 100 k an to −k o sh in k in ki ja p an region in cr ea se in t ra n sm is si o n a d va n ta g e (% ) 0 25 50 75 100 k an to −k o sh in k in ki ja p an region in cr ea se in t ra n sm is si o n a d va n ta g e (% ) 0 25 50 75 100 k an to −k o sh in k in ki ja p an region in cr ea se in t ra n sm is si o n a d va n ta g e (% ) 0 25 50 75 100 k an to −k o sh in k in ki ja p an region in cr ea se in t ra n sm is si o n a d va n ta g e (% ) the points represent the proportion of positive results by submission date, and the bars represent the respective 95% confidence intervals. a b wpsar vol 13, no 3, 2022 | doi: 10.5365/wpsar.2022.13.3.943https://ojs.wpro.who.int/ 7 sars-cov-2 variant replacement in japankobayashi et al the early detection of variant strains than pcr screening tests. before their detection using pcr screening tests, the alpha and delta variants were first identified in the kanto-koshin region (tokyo) in week 51 of 2020 and week 18 of 2021, respectively, based on genomic surveillance reports. as earlier genomic surveillance tended to focus on specimens testing positive by pcr screening, the proportion of specimens tested by genomic surveillance for specific mutations (i.e. n501y and l452r mutations) was expected to be higher, resulting in a bias that overestimated the prevalence of these variant strains. however, that most of the cases with n501y mutations in this study were caused by the alpha variant, and those with l452r mutations were due to the delta variant. genomic surveillance in japan is performed on 5–10% of the specimens positive for sars-cov-2 and has been conducted continuously regardless of changes in the number of patients. in contrast, pcr testing to screen for a specific variant is initiated after the prediction of an epidemic caused by a particular variant strain. therefore, genomic surveillance is more advantageous for fig. 4. daily counts of reported covid-19 cases and rise in the proportions of variants with the n501y and l452r mutations in japan (grey), the kanto-koshin region (purple) and the kinki region (green), january to september, 2021 the points represent the proportion positive by submission date, and the bars represent the respective 95% confidence intervals. the lines indicate the estimated positive proportion based on the logistic growth model for the respective variant. japan kanto-koshin kinki n501y l452r n501y l452r n501y l452r pro p o rtio n 1 j an 15 j an 29 j an 12 f eb 26 f eb 12 m ar 26 m ar 9 a p r 23 a p r 7 m ay 21 m ay 4 j u n 18 j u n 2 j u l 16 j u l 30 j u l 13 a u g 27 a u g 10 s ep 24 s ep day n u m b er o f co n fir m ed c as es 0.00 0.25 0.50 0.75 1.00 0 5 000 10 000 15 000 1 j an 15 j an 29 j an 12 f eb 26 f eb 12 m ar 26 m ar 9 a p r 23 a p r 7 m ay 21 m ay 4 j u n 18 j u n 2 j u l 16 j u l 30 j u l 13 a u g 27 a u g 10 s ep 24 s ep day n u m b er o f co n fir m ed c as es p ro p o rtio n 0.00 0.25 0.50 0.75 1.00 0 5 000 10 000 15 000 1 j an 15 j an 29 j an 12 f eb 26 f eb 12 m ar 26 m ar 9 a p r 23 a p r 7 m ay 21 m ay 4 j u n 18 j u n 2 j u l 16 j u l 30 j u l 13 a u g 27 a u g 10 s ep 24 s ep day n u m b er o f co n fir m ed c as es p ro p o rtio n 0.00 0.25 0.50 0.75 1.00 0 5 000 10 000 15 000 20 000 25 000 30 000 wpsar vol 13, no 3, 2022 | doi: 10.5365/wpsar.2022.13.3.943 https://ojs.wpro.who.int/8 kobayashi et alsars-cov-2 variant replacement in japan in the present study. a retrospective survey in the kinki region suggested that regional replacement and transmission advantage may have been due to the introduction of the alpha variant that was not detected immediately or to a potential regional transmission that occurred earlier than detected by the investigation.21 other factors such as the composition of pre-existing strains, the timing of the introduction of each variant and the public health response to covid-19 may have influenced the difference in transmission advantage in the kanto-koshin and kinki regions. we have not been able to fully evaluate the factors that caused the differences between the regions. this study has several limitations. first, pcr screening for variants in japan is conducted not only in commercial laboratories but also at phis, some universities and hospitals. the data from commercial laboratories exhibited a regional bias in the number of specimens obtained from medical institutions. therefore, the number of specimens might not have been sufficient to adequately evaluate the changes in the proportions of variants. in addition, there may be biases in the characteristics of the populations tested by each laboratory, such as those with a high incidence of outbreaks. second, in the early stages of analysis, the rise in the number of laboratories might have affected the regional bias and influenced the results of regional replacement of the previous variant by that with the n501y mutation. however, while the number of laboratories changed over time, the sensitivity analysis showed that this had little effect on the 90% replacement time. third, in addition to the alpha variant, the b.1.351 (beta), p.1 (gamma) and b.1.621 (mu) variants have the n501y mutation. furthermore, with the exception of the delta variant, b.1.617.1 (formerly kappa) and other variants also carry the l452r mutation. when multiple variants with the same mutation are prevalent, further analysis may be required to evaluate the replacement of each mutant variant. in conclusion, based on the pcr test results conducted at commercial laboratories to screen for the alpha variant carrying the n501y mutation and the delta variant carrying the l452r mutation, we evaluated the replacement and transmissibility of the variant with the n501y mutation and the variant with the l452r mutation compared to the b.1.1.214 and r1 strains, and alpha strains, respectively. our method is a reasonable and simple way to promptly monitor and estimate changes the comparison of genomic surveillance data from this study showed no significant difference in the transition of the detection rate of either variant. this study suggests that the proportion of cases with the n501y mutation first increased in the kinki region, while those with the l452r mutation initially increased in the kanto-koshin region. similarly, the number of covid-19 cases increased earlier in the kinki region than in the kanto-koshin region during the fourth wave of the epidemic caused by the n501y mutation and vice versa during the fifth wave due to the l452r mutation. genomic surveillance reports showed that the alpha variant was first detected in the kanto-koshin region. however, the subsequent rise in the percentage of cases occurred earlier in the kinki region, which concurs with the findings of this study. the period during which delta variant cases increased across regions corresponded to the concurrent increase in cases with l452r mutations in this study.11 the transmission advantage above pre-existing virus strains was compared for each variant. the variant with the n501y mutation demonstrated a 39.5% rise in transmission compared to the b.1.1.214 and r1 strains, whereas that of the variant with the l452r mutation was 58.3% higher than the alpha variant. a previous study in japan that compared the transmission advantages of the b.1.1.7 and b.1.617.2 variants with pre-existing virus strains demonstrated an increase of 44% and 95%, respectively.15 in contrast, reports from europe and the united states of america showed that the transmission advantage of the alpha variant increased by 42–100% compared with that of previous strains, and the delta variant increased by 55–120% compared with that of the alpha variant.13,16–19 these values are based on the global initiative on sharing avian influenza data and surveillance data on the number of patients and genomic surveillance level conducted in each country, and as a result, the estimation methods might differ from those used in this study.20 vaccination status in each country could lead to decreased transmission advantages. in japan, covid-19 vaccination programmes began in february 2021 for health-care workers and the older population. increased vaccination rates might also have influenced the transmission advantage, although this could not be assessed wpsar vol 13, no 3, 2022 | doi: 10.5365/wpsar.2022.13.3.943https://ojs.wpro.who.int/ 9 sars-cov-2 variant replacement in japankobayashi et al 6. cherian s, potdar v, jadhav s, yadav p, gupta n, das m, et al. sars-cov-2 spike mutations, l452r, e484q and p681r, in the second wave of covid-19 in maharashtra, india. microorganisms. 2021;9(7):1542. doi:10.3390/microorganisms9071542 pmid:34361977 7. peng j, liu j, mann sa, mitchell am, laurie mt, sunshine s, et al. estimation of secondary household attack rates for emergent spike l452r severe acute respiratory syndrome coronavirus 2 (sarscov-2) variants detected by genomic surveillance at a communitybased testing site in san francisco. clin infect dis. 2021;74(1):32– 9. doi:10.1093/cid/ciab283 pmid:33788923 8. guidance for surveillance of sars-cov-2 variants: interim guidance, 9 august 2021. geneva: world health organization; 2021. available from: https://www.who.int/publications/i/item/ who_2019-ncov_surveillance_variants, accessed 29 november 2021. 9. genomic analysis of sars-cov-2 in japan [in japanese]. tokyo: national institute of infectious diseases, ministry of health, labour and welfare; 2021 (infectious diseases weekly report japan, no. 23:11–2). available from: https://www.niid.go.jp/niid/ images/idsc/idwr/idwr2021/idwr2021-23.pdf, accessed 20 may 2022. 10. visualizing the data: information on covid-19 infections. tokyo: ministry of health, labour and welfare; 2021. available from: https://covid19.mhlw.go.jp/en/, accessed 28 september 2021. 11. detection of sars-cov-2 strain by genome surveillance [in japanese]. tokyo: national institute of infectious diseases; 2021. available from: https://www.mhlw.go.jp/content/10900000/000848377. pdf, accessed 29 november 2021. 12. reichmuth m, hodcroft e, riou j, althaus cl, schibler m, eckerle i, et al. transmission of sars-cov-2 variants in switzerland. bern: institute of social and preventive medicine, university of bern; 2021. available from: https://ispmbern.github.io/covid-19/variants/, accessed 15 may 2021. 13. davies ng, abbott s, barnard rc, jarvis ci, kucharski aj, munday jd, et al. estimated transmissibility and impact of sars-cov-2 lineage b.1.1.7 in england. science. 2021;372(6538):eabg3055. doi:10.1126/science.abg3055 pmid:33658326 14. nishiura h, linton nm, akhmetzhanov ar. serial interval of novel coronavirus (covid-19) infections. int j infect dis. 2020;93:284– 6. doi:10.1016/j.ijid.2020.02.060 pmid:32145466 15. ito k, piantham c, nishiura h. predicted dominance of variant delta of sars-cov-2 before tokyo olympic games, japan, july 2021. euro surveill. 2021;26(27):2100570. doi:10.2807/15607917.es.2021.26.27.2100570 pmid:34240695 16. volz e, mishra s, chand m, barrett jc, johnson r, geidelberg l, et al. assessing transmissibility of sars-cov-2 lineage b.1.1.7 in england. nature. 2021;593(7858):266–9. doi:10.1038/s41586021-03470-x pmid:33767447 17. leung k, shum mh, leung gm, lam tt, wu jt. early transmissibility assessment of the n501y mutant strains of sarscov-2 in the united kingdom, october to november 2020. euro surveill. 2021;26(1):2002106. doi:10.2807/1560-7917. es.2020.26.1.2002106 pmid:33413740 18. earnest r, uddin r, matluk n, renzette n, siddle kj, loreth c, et al. comparative transmissibility of sars-cov-2 variants delta and alpha in new england, usa. medrxiv. 2021. doi:10.1101/2021.10.06.21264641 pmid:34642698 in the proportion of variant strains in each region, even in regions where genomic surveillance is not sufficiently conducted. acknowledgements we would like to thank all staff who cared for covid-19 patients, along with laboratory workers and public health professionals involved in the pandemic response. we also thank all members of the covid-19 response team from the niid and mhlw for their strong support. conflict of interest the authors have no conflicts of interest to declare. ethics approval this study was conducted under the act on the prevention of infectious diseases and medical care for patients with infectious diseases and did not require ethical approval; we did not collect any personally identifiable information. funding no specific funding was received to support this work. references 1. tracking sars-cov-2 variants. geneva: world health organization; 2021. available from: https://www.who.int/en/activities/tracking-sars-cov-2-variants/, accessed 18 october 2021. 2. sars-cov-2 variant classifications and definitions. atlanta, ga: centers for disease control and prevention; 2021. available from: https://www.cdc.gov/coronavirus/2019-ncov/variants/variant-info. html, accessed 18 october 2021. 3. investigation of sars-cov-2 variants of concern: technical briefings. london: public health england; 2020. https://www.gov. uk/government/publications/investigation-of-sars-cov-2-variantstechnical-briefings, accessed 25 july 2022. 4. graham ms, sudre ch, may a, antonelli m, murray b, varsavsky t, et al. changes in symptomatology, reinfection, and transmissibility associated with the sars-cov-2 variant b.1.1.7: an ecological study. lancet public health. 2021;6(5):e335–45. doi:10.1016/ s2468-2667(21)00055-4 pmid:33857453 5. rambaut a, loman n, pybus o, barclay w, barrett j, carabelli a, et al. preliminary genomic characterisation of an emergent sarscov-2 lineage in the uk defined by a novel set of spike mutations. virological. 2020:1–5. available from: https://virological.org/t/preliminary-genomic-characterisation-of-an-emergent-sars-cov-2-lineage-in-the-uk-defined-by-a-novel-set-of-spike-mutations/563, accessed 20 may 2022. https://www.who.int/publications/i/item/who_2019-ncov_surveillance_variants https://www.who.int/publications/i/item/who_2019-ncov_surveillance_variants https://www.niid.go.jp/niid/images/idsc/idwr/idwr2021/idwr2021-23.pdf https://www.niid.go.jp/niid/images/idsc/idwr/idwr2021/idwr2021-23.pdf https://ispmbern.github.io/covid-19/variants/ https://ispmbern.github.io/covid-19/variants/ https://www.who.int/en/activities/tracking-sars-cov-2-variants https://www.who.int/en/activities/tracking-sars-cov-2-variants https://www.cdc.gov/coronavirus/2019-ncov/variants/variant-info.html https://www.cdc.gov/coronavirus/2019-ncov/variants/variant-info.html https://www.gov.uk/government/publications/investigation-of-sars-cov-2-variants-technical-briefings https://www.gov.uk/government/publications/investigation-of-sars-cov-2-variants-technical-briefings https://www.gov.uk/government/publications/investigation-of-sars-cov-2-variants-technical-briefings https://virological.org/t/preliminary-genomic-characterisation-of-an-emergent-sars-cov-2-lineage-inhttps://virological.org/t/preliminary-genomic-characterisation-of-an-emergent-sars-cov-2-lineage-inhttps://virological.org/t/preliminary-genomic-characterisation-of-an-emergent-sars-cov-2-lineage-inwpsar vol 13, no 3, 2022 | doi: 10.5365/wpsar.2022.13.3.943 https://ojs.wpro.who.int/10 kobayashi et alsars-cov-2 variant replacement in japan 21. kobayashi y, suzuki m, ukai t, ota m, yahata y, kamiya h, et al. characteristics of sars-cov-2 alpha variant cases in the kansai region and the importance of epidemiological investigation with genome analysis information (as of march 2021) [in japanese]. infectious agents surveillance report. 2021;42(7):137– 9. available from: https://www.niid.go.jp/niid/ja/typhi-m/ iasr-reference/2541-related-articles/related-articles-497/10518497r01.html, accessed 7 november 2021. 19. campbell f, archer b, laurenson-schafer h, jinnai y, konings f, batra n, et al. increased transmissibility and global spread of sars-cov-2 variants of concern as at june 2021. euro surveill. 2021;26(24):2100509. doi:10.2807/1560-7917. es.2021.26.24.2100509 pmid:34142653 20. the global initiative on sharing all influenza data (gisaid). genomic epidemiology of sars-cov-2 with subsampling focused globally since pandemic start. munich: gisaid; 2022. available from: https://www.gisaid.org/epiflu-applications/influenza-genomic-epidemiology/, accessed 29 november 2021. https://www.niid.go.jp/niid/ja/typhi-m/iasr-reference/2541-related-articles/related-articles-497/105 https://www.niid.go.jp/niid/ja/typhi-m/iasr-reference/2541-related-articles/related-articles-497/105 https://www.niid.go.jp/niid/ja/typhi-m/iasr-reference/2541-related-articles/related-articles-497/105 https://www.gisaid.org/epiflu-applications/influenza-genomic-epidemiology/ https://www.gisaid.org/epiflu-applications/influenza-genomic-epidemiology/ https://ojs.wpro.who.int/ 1wpsar vol 13, no 4, 2022 | doi: 10.5365/wpsar.2022.13.4.977 covid-19: brief report g enomic surveillance has become a critical tool for monitoring variants of severe acute respiratory syndrome coronavirus 2 (sars-cov-2), the virus that causes coronavirus disease (covid-19).1 recognizing this, capacity building for genomic surveillance towards a national sequencing network has become a principal goal in viet nam. the aim of the network is to standardize sequencing to empower the ministry of health (moh) to detect and respond to emerging public health threats, determine outbreak etiologies and enhance overall surveillance capacities in the country. the pasteur institute of nha trang (pi nha trang) is the agency within the moh responsible for public health surveillance and response in 11 central coastal provinces in viet nam, including key population centres such as da nang as well as major tourist destinations such as hoi an and nha trang. in may 2021, motivated by the desire to participate in the development of the national sequencing network, pi nha trang acquired its first next-generation sequencer and developed a protocol to identify and monitor the relative prevalence of sarscov-2 variants among covid-19 cases identified in the central region. in early 2020, all passengers arriving on inbound flights to viet nam underwent testing using real-time reverse transcription polymerase chain reaction (rt-pcr) (requirement expired 15 may 2022) and mandatory 14-day quarantine in centralized facilities (requirement expired 1 january 2022).2 these provisions allowed for quick detection and isolation of cases, as well as targeted genomic surveillance for imported cases. the b.1.1.529 (omicron) variant of sars-cov-2 was first reported to the world health organization by south africa and was designated a variant of concern on 26 november 2021.3 it has since been closely monitored by countries worldwide. through heightened genomic surveillance measures, the first imported case of the omicron variant in viet nam was detected on 19 december 2021 in a traveller entering the northern part of the country. this brief report characterizes 32 of a pasteur institute in nha trang, nha trang, viet nam. b u.s. centers for disease control and prevention, hanoi, viet nam. c quang nam department of health, quang nam, viet nam. d quang nam center for disease control, quang nam, viet nam. e da nang center for disease control, da nang, viet nam. f khanh hoa center for disease control, viet nam. published: 23 november 2022 doi: 10.5365/wpsar.2022.13.4.977 as authorities braced for the arrival of the omicron variant of severe acute respiratory syndrome coronavirus 2 (sars-cov-2), infrastructure investments and government directives prompted action in central viet nam to establish capacity for genomic surveillance sequencing. from 17 november 2021 to 7 january 2022, the pasteur institute in nha trang sequenced 162 specimens from 98 150 confirmed sars-cov-2 cases in the region collected from 8 november to 31 december 2021. of these, all 127 domestic cases were identified as the b.1.617.2 (delta) variant, whereas 92% (32/35) of imported cases were identified as the b.1.1.529 (omicron) variant, all among international flight passengers. patients were successfully isolated, enabling health-care workers to prepare for additional cases. most (78%) of the 32 omicron cases were fully vaccinated, suggesting continued importance of public health and social measures to control the spread of new variants. systematic sequencing of imported cases leads to detection of sars-cov-2 b.1.1.529 (omicron) variant in central viet nam do thai hung,a nguyen bao trieu,a do thi thu thuy,b allison olmsted,b trinh hoang long,a nguyen duc duy,a huynh kim mai,a bui thi thu hien,b nguyen van van,c tran van kiem,d vo thi thuy trang,d nguyen truong duy,d ton that thanh,e huynh van dong,f philip gouldb and matthew mooreb correspondence to allison olmsted (email: rzu9@cdc.gov) wpsar vol 13, no 4, 2022 | doi: 10.5365/wpsar.2022.13.4.977 https://ojs.wpro.who.int/2 do et alsystematic sequencing of sars-cov-2 in viet nam among all cases, 162 patient specimens collected between 8 november and 31 december 2021 were sequenced. the majority (78%; 127/162) were domestic cases while 22% (35/162) were imported cases. all domestic cases were identified as the b.1.617.2 (delta) variant while 92% (32/35) of imported cases were the omicron variant. phylogenetic relationships among sequenced cases demonstrate close relationships with sequences from multiple continents (supplementary fig. 1). no community cases of omicron were detected in the 11 provinces in central viet nam from november 2021 to early february 2022. descriptive epidemiology revealed that 66% (21/32) of omicron cases were under 40 years old, 53% (25/32) were fully vaccinated and 25% (8/32) had received booster doses (table 1). most of the cases (24/32; 75%) were asymptomatic at detection. none were hospitalized or died. a total of 13 individuals arrived on direct flights from the united states of america to viet nam and 13 additional passengers departed from various countries with stopover points in the republic of korea, where layover time ranged from 4 to 30 hours. sequencing results were reported promptly to the originating province and the moh, which shared them publicly via internet news outlets. all sequences were also uploaded to gisaid within 2 weeks; gisaid accession numbers are listed in supplementary fig. 2. discussion viet nam’s practice of universal testing and mandatory quarantine for international visitors, combined with preferential selection of imported cases for whole genome sequencing, enabled the early detection of imported omicron cases. prompt identification and isolation of these cases gave the government additional time to communicate with the public and prepare for eventual community transmission. this supports previous studies demonstrating that public health and social measures such as systematic targeted testing programmes remain important, even among highly vaccinated populations such as travellers.5 multiple flight origins further highlight the need for cooperation between countries to detect and respond to emerging variants. testing and sequencing strategies should be revisited and updated as outbreak situations continue to evolve. viet nam’s first imported omicron cases in the central region and highlights the importance of public health and social measures to detect and contain the spread of new variants. methods specimens were collected from domestic and imported laboratory-confirmed cases of covid-19 from 8 november to 31 december 2021. not all covid-19 cases were sequenced; each province was required to submit 2–3 specimens per week, while areas with international airports (khanh hoa and da nang provinces), border controls (quang binh and quang tri provinces) or a high case burden submitted 4–6 specimens per week. the selection of samples for sequencing was prioritized to imported cases or special cases (e.g. index cases of large clusters, patients infected after two vaccine doses, reinfected, or with severe symptoms or death). sequencing was performed on specimens with a cycle threshold value of ≤28 and volume of at least 800 μl, and with accompanying epidemiological data such as patient characteristics and clinical presentation. specimens were stored at 2–8°c for ≤72 hours from the time of collection. pi nha trang has the capacity to sequence 24–46 specimens per week using a miseq platform (illumina, san diego, ca, united states of america). the dragen covid lineage software (illumina) was used for genomic analysis and phylogenetic trees were generated using nextclade (https://clades.nextstrain.org/). outputs included quality metrics, lineage determination, amino acid substitutions for novel strain detection, and fasta format files for epidemiological analysis using accompanying epidemiological data. sequences were posted to the gisaid initiative database as per the protocol developed jointly by pi nha trang and the u.s. centers for disease control and prevention in viet nam (unpublished). to improve understanding of the effects of systematic testing and quarantine, sequence data for community cases were reported from november 2021 to february 2022. results there were 98 150 confirmed cases of covid-19 detected in central viet nam (97 985 domestic and 165 imported) from 1 november to 31 december 2021. https://clades.nextstrain.org/ wpsar vol 13, no 4, 2022 | doi: 10.5365/wpsar.2022.13.4.977https://ojs.wpro.who.int/ 3 systematic sequencing of sars-cov-2 in viet namdo et al table 1. characteristics of confirmed b.1.1.529 (omicron) sars-cov-2 cases (n = 32), central viet nam, 8 november–31 december 2021 characteristic no. % age group (years) 0–19 3 9 20–29 12 38 30–39 6 19 40–64 11 34 ≥65 0 0 sex male 12 38 female 20 63 covid-19 vaccination statusa fully vaccinated 17 53 fully vaccinated plus booster dose 8 25 unvaccinated (ineligible) 1 3 unknown 6 19 symptom profileb asymptomatic 16 50 symptomatic 8 25 unknown 8 25 initial signs or symptomsc cough 4 13 sore throat 3 9 fever 2 6 congestion or runny nose 1 3 headache 1 3 nausea or vomiting 1 3 outcome hospitalization 0 0 death 0 0 flight origin republic of koread 16 50 united states of america 13 41 malaysia 3 9 a fully vaccinated is defined as having received the complete immunization series according to the vaccine manufacturer. b self-reported symptoms. c cases may exhibit multiple symptoms. d includes passengers with flights originating in the republic of korea (n = 3) as well as passengers with layovers in the republic of korea (n = 13) whose flights originated in the united states of america (n = 9), canada (n = 3) or the netherlands (n = 1). government policies prioritizing whole-genome sequencing may improve the speed of variant detection, and collecting epidemiological data provides important context for sequenced cases. for example, the observation that most cases in this series were fully vaccinated supports previous data demonstrating that vaccination does not prevent transmission of the omicron variant.6 similarly, the lack of hospitalization or death supports data that omicron causes severe illness less frequently than delta.7 the integration of laboratory and epidemiological data is critical in ensuring the most useful information is available as quickly as possible, although the low proportion of specimens sequenced compared to total cases limits interpretation. as of 14 august 2022, viet nam reached 84.1% population coverage with two vaccine doses, allowing the country to slowly re-open to international travel and commerce.8 genomic surveillance for sars-cov-2 has become the international standard of surveillance.9 in addition to contributing to the understanding of clinical and epidemiological trends of covid-19, genomic surveillance provides critical data necessary for rapidly developing newer, more effective vaccines against sars-cov-2. early investment in infrastructure for genomic sequencing made it possible for authorities in central viet nam to respond quickly to the detection of a newly imported sars-cov-2 variant of concern. however, implementing new programmes always comes with challenges. for example, current limitations include overrepresentation of specimens from certain provinces and underrepresentation from others, as well as resource constraints at the local level for specimen collection and transfer. despite these issues, the data described here provide valuable evidence for further investment to overcome current limitations and scale up towards the greater goal of developing a national sequencing network in viet nam. disclaimer the findings and conclusions are those of the authors and do not necessarily represent the official position of the u.s. centers for disease control and prevention, department of health and human services. wpsar vol 13, no 4, 2022 | doi: 10.5365/wpsar.2022.13.4.977 https://ojs.wpro.who.int/4 do et alsystematic sequencing of sars-cov-2 in viet nam conflicts of interest the authors have no conflicts of interest to declare. ethics statement this work was carried out as a part of routine surveillance activities of the pasteur institute in nha trang and no ethics review was required. funding this report was supported in part by cooperative agreement no. nu2ggh002093-01-00 from the u.s. centers for disease control and prevention and the public health institute. references 1. genomic sequencing of sars-cov-2: a guide to implementation for maximum impact on public health, 8 january 2021. geneva: world health organization; 2021. available from: https://apps.who.int/ iris/handle/10665/338480, accessed 20 january 2022. 2. nguyen tv, tran qd, phan lt, vu ln, truong dtt, truong hc, et al. in the interest of public safety: rapid response to the covid-19 epidemic in vietnam. bmj glob health. 2021;6(1):e004100. doi:10.1136/bmjgh-2020-004100 pmid:33495284 3. update on omicron. geneva: world health organization; 2021. available from: https://www.who.int/news/item/28-11-2021-update-on-omicron, accessed 20 january 2022. 4. khare s, gurry c, freitas l, schultz mb, bach g, diallo a, et al. gisaid’s role in pandemic response. china cdc wkly. 2021;3(49):1049–51. doi:10.46234/ccdcw2021.255 pmid:34934514 5. sekizuka t, itokawa k, yatsu k, tanaka r, hashino m, kawano-sugaya t, et al. covid-19 genome surveillance at international airport quarantine stations in japan. j travel med. 2021;28(2):taaa217. doi:10.1093/jtm/taaa217 pmid:33236052 6. accorsi ek, britton a, fleming-dutra ke, smith zr, shang n, derado g, et al. association between 3 doses of mrna covid-19 vaccine and symptomatic infection caused by the sarscov-2 omicron and delta variants. jama. 2022;327(7):639–51. doi:10.1001/jama.2022.0470 pmid:35060999 7. modes me, directo mp, melgar m, johnson lr, yang h, chaudhary p, et al. clinical characteristics and outcomes among adults hospitalized with laboratory-confirmed sars-cov-2 infection during periods of b.1.617.2 (delta) and b.1.1.529 (omicron) variant predominance – one hospital, california, july 15–september 23, 2021, and december 21, 2021–january 27, 2022. mmwr morb mortal wkly rep. 2022;71(6):217–23. doi:10.15585/mmwr.mm7106e2 pmid:35143466 8. covid-19 in viet nam situation report 97. hanoi: who representative office for viet nam; 2020. available from: https://www. who.int/vietnam/internal-publications-detail/covid-19-in-viet-namsituation-report-97, accessed 22 august 2022. 9. robishaw jd, alter sm, solano jj, shih rd, demets dl, maki dg, et al. genomic surveillance to combat covid-19: challenges and opportunities. lancet microbe. 2021;2(9):e481–4. doi:10.1016/ s2666-5247(21)00121-x pmid:34337584 https://ojs.wpro.who.int/ 1wpsar vol 13, no 3, 2022 | doi: 10.5365/wpsar.2022.13.3.874 outbreak investigation report m easles has been resurgent throughout the world health organization’s (who’s) western pacific region in recent years.1 in 2019, outbreaks occurred nationwide in the lao people’s democratic republic (lao pdr), with the first laboratory-confirmed case reported in january 2019 in the northwest. subsequent cases were identified 1 month later in the central region, with cases quickly spreading throughout the country. xaisomboun was the 11th province to experience a measles outbreak during the first half of 2019. xaisomboun is a mountainous province centrally located in lao pdr (fig. 1). established in 2013, it is the smallest province in terms of area (8550 km2), population (92 682 people) and population density (10.82 people/km2). there are three main ethnic groups (43% are hmong–lu mien, 18% are mon–khmer and 31% are lao–tai in xaisomboun compared with national proportions of 8%, 21% and 67%, respectively), each with its own unique language and traditional beliefs.2 during 2012–2017, the under-5 mortality rate in xaisomboun was 51/1000 live births compared with 46/1000 naa national center for laboratory and epidemiology, vientiane capital, lao people’s democratic republic. b national center for epidemiology and population health, research school of population health, anu college of health and medicine, the australian national university, canberra, australia. c pediatric infectious disease, mahosot hospital, vientiane capital, lao people’s democratic republic. published: 3 august 2022 doi: 10.5365/wpsar.2022.13.3.874 objective: an increase in measles cases was reported in the northwest of the lao people’s democratic republic beginning in january 2019, with outbreaks quickly spreading throughout the country. following identification of two laboratoryconfirmed cases in xaisomboun province, we conducted an outbreak investigation to identify factors contributing to the measles outbreak in hard-to-reach village x. methods: active case-finding was undertaken at the provincial hospital and primary health care centre via a retrospective search through admission logbooks and house-to-house surveys in village x and surrounding villages. clinical samples were collected from suspected cases, and data were collected using a standard case investigation form. vaccine coverage data were reviewed. results: of the 40 suspected measles cases with rash onset during 12 february–27 april 2019, 83% (33/40) resided in village x and 98% (39/40) were of hmong–lu mien ethnicity. ages ranged from 22 days to 5 years, with 70% (28) aged <24 months. almost half of cases aged 9 to <18 months (5/11) and 67% (8/12) of cases aged ≥24 months had received a measles-containing vaccine (mcv). reported mcv coverage in xaisomboun for children aged <1 year in 2017–2018 was <50%. in 55% (22/40) of cases, case notification was delayed by ≥6 days. the final case classification comprised 10% laboratory-confirmed, 20% clinically compatible, 60% epidemiologically linked and 10% non-cases. discussion: this measles outbreak was likely associated with low immunization coverage, compounded by delays in reporting. effective strategies are needed to address beliefs about and health literacy barriers to immunization and measles awareness. such strategies may improve mcv coverage and early diagnosis, enabling timely public health interventions and reducing mortality and morbidity. factors contributing to a measles outbreak in a hard-to-reach rural village in xaisomboun province, lao people’s democratic republic vannida douangboupha,a,b,c philippa l. binns,b bouaphanh khamphaphongphane,a virasack som oulay,a khanxay sengsaiya,a thounchay boupphaphanha and phonepadith xangsayaratha correspondence to vannida douangboupha (email: d.vannida@gmail.com) wpsar vol 13, no 3, 2022 | doi: 10.5365/wpsar.2022.13.3.874 https://ojs.wpro.who.int/2 douangboupha et almeasles outbreak in xaisomboun, lao pdr have been reported. nine measles/rubella test-negative afr cases were reported in 2018 and only one in 2019 prior to the outbreak.4 additionally, one clinically compatible measles case (test negative) was reported with rash onset on 9 april 2019. this paper describes the outbreak investigation undertaken after two laboratory-confirmed cases were reported in village x, xaisomboun province, on 23 april 2019. methods definitions for case-finding, a suspected case was defined as a person who lived in village x or a nearby area (villages y and z*) who had symptom onset of fever and generalized maculopapular rash between 1 february and 30 april 2019. after suspected cases were identified and investigations completed, standard who definitions were tionally.3 the lao social indicator survey reported that 54.7% of household members surveyed (n = 1606) in xaisomboun were in the two poorest quintiles, had an average of 3.7 persons/sleeping room, and 66.2% and 17.5% had only basic sanitation services and handwashing facilities, respectively.3 village x* in xaisomboun had a population of 2821 people in 2018, 97.1% (n=2739) hmong–lu mien, 2.2% (62) mon–khmer and 0.7% (20) lao–tai; the population density was 18.2 people/km2 and approximately five people slept in one room.2 the village has access to the provincial hospital (a 30-bed secondary care hospital) about 25 km away, and there is one primary health care centre in the middle of the village.2 traditionally, there is a lot of population movement in and out of the region and between homes during the hmong–lu mien traditional new year celebrations and for other family events. since establishing surveillance for acute fever and rash (afr) in the province in 2013, no measles outbreaks fig. 1. number of cases of measles and coverage of the first dose of measles-containing vaccine (mcv1), by province, with xaisomboun province highlighted, lao people’s democratic republic, 2019 phongsali xaignabouli province (mcv1 = 79.7%) 1 laboratory-confirmed case: 29/1/2019 luang namtha province (mcv1 = 63.3%) 1 laboratory-confirmed case vientiane capital (mcv1 = 72.9%) 56 laboratory-confirmed cases: 26/2/2019 village s, district s 1 fatal case (cfr 0.20%) xiangkhouang province (mcv1 = 64.8%) 6 laboratory-confirmed cases: 5/3/2019 khammouan province (mcv1 = 78.2%) 1 laboratory-confirmed case: 14/3/2019 houaphan province (mcv1 = 64.2%) 10 laboratory-confirmed cases: 21/3/2019 vientiane province (mcv1 = 79.4%) 4 laboratory-confirmed cases: 23/3/2019 xaignabouli province (mcv1 = 79.7%) 1 laboratory-confirmed case: 26/3/2019 louang phabang province (mcv1 = 60.6%) 8 laboratory-confirmed cases: 26/3/2019 salavan province (mcv1 = 79.1%) 1 laboratory-confirmed case: 8/4/2019 xaisomboun province (mcv1 = 39.7%) 4 laboratory-confirmed cases: 23/4/2019 village x, district y luang namtha louang phabang houaphan xiangkhouang xaignabouli vientiane xaisomboun vientiane capital bolikhamxai khammouan non-investigation site investigation site savannakhet salavan xekong champasak attapeu bokeo oudomxai jan feb m ar a p r * for confidentiality, the names of the relevant villages were replaced by x, y and z. wpsar vol 13, no 3, 2022 | doi: 10.5365/wpsar.2022.13.3.874https://ojs.wpro.who.int/ 3 measles outbreak in xaisomboun, lao pdr douangboupha et al results cases forty suspected measles cases with rash onset between 12 february and 27 april were identified: 10 from the primary health care centre logbook, 24 from the houseto-house survey and six via notifications from hospital clinicians. four of the 40 initial suspected cases were ultimately classified as non-cases; there were 24 epidemiologically linked cases, eight clinically compatible and four laboratory-confirmed (fig. 2, table 1). the majority of suspected cases resided in village x (83%; 33) and were of hmong–lu mien ethnicity (98%; 39). all were aged between 22 days and 5 years, with 70% (28) aged <24 months. there were twice as many males (27) as females (13). the median time from rash onset to notification was 19 days (minimum = 0; maximum = 73; quartile 1 = 6, quartile 3 = 31). altogether, 55% (22) of suspected cases had delayed notification, but all cases had investigation initiated within 48 hours of notification, thus meeting who’s surveillance standards.5 there were no reported deaths, but 15% (6/40) of cases were hospitalized at the provincial hospital (table 1). laboratory results of the 40 cases identified through the investigation, specimens were collected from 28% (11; eight from village x, two from village y and one from village z). the time from rash onset to serum sample collection for 8 cases and to throat swab for 11 cases ranged from 0 to 4 days (table 1), meeting criteria for specimen collection adequacy as per who’s standards.5 all samples were delivered to the ncle laboratory within 4 days of collection, and the results were reported within 2 days of specimen receipt, also meeting who’s performance indicators.5 of the four laboratory-confirmed cases, all resided in village x, and three swabs from these cases and all their serum specimens were positive for measles. one laboratory-confirmed case had specimens collected 1 day after rash onset, and the other three had specimens collected on day 3 after rash onset (table 1). all 11 specimens tested negative for rubella. vaccination history of those aged 9 to <18 months, 46% (5/11) had received an mcv through routine immunization, as had applied to determine final case classifications (laboratoryconfirmed, epidemiologically linked, clinically compatible and non-measles cases).5 delayed case notification was defined as ≥6 days to notification after rash onset.6 case-finding the 11-person outbreak investigation team included six local public health staff and five central public health and government laboratory staff who travelled from the capital to xaisomboun by road. the field investigation was carried out from 23 to 30 april 2019. we undertook active case-finding at the provincial hospital and primary health care centre via a retrospective search of admission logbooks and house-to-house surveys in village x and surrounding villages to identify people fulfilling the definition of a suspected case. data collection and analysis face-to-face interviews with caregivers of suspected cases from the three villages were undertaken, guided by the national standard case investigation form. the form is used to collect information about demographics, history of immunization with measles-containing vaccine (mcv), clinical symptoms, complications, hospitalization and treatment outcomes, as well as contacts, travel and participation at gatherings. vaccination status was identified from the interview or a vaccination card, or both. these descriptive data were analysed using microsoft excel (2010). laboratory investigations throat swabs and blood samples were collected from suspected cases during their hospital visit or the houseto-house surveys in the three villages. specimens were transported to the who-accredited laboratory at the national center for laboratory and epidemiology (ncle) and tested for measles and rubella using the euroimmun anti-measles virus nucleoprotein enzyme-linked immunosorbent assay (elisa) (immunoglobulin m [igm]) and the anti-rubella virus glycoprotein elisa (igm) (euroimmun, lubeck, germany). detection of measles virus rna by reverse transcription–polymerase chain reaction was conducted as described in who’s surveillance standards for vaccine-preventable diseases.5 about 10% of suspected cases were sampled due to the remote location of the village, as per the ncle’s unpublished standard protocol for measles outbreak investigations. wpsar vol 13, no 3, 2022 | doi: 10.5365/wpsar.2022.13.3.874 https://ojs.wpro.who.int/4 douangboupha et almeasles outbreak in xaisomboun, lao pdr fig. 2. epidemic curve of the measles outbreak in xaisomboun province, lao people’s democratic republic, 1 february–30 april 2019 (n = 40) table 1. characteristics and risk factors by final case classification for 40 suspected measles cases in xaisomboun province, lao people’s democratic republic, 1 february–30 april 2019 discarded 0 1 2 3 2 4 6 8 10 12 14 16 18 20 22 24 26 28 30 2 4 6 8 10 12 14 16 18 20 22 24 26 28 2 4 6 8 10 12 14 16 18 20 22 24 26 28 30 2 4 6 8 10 12 14 16 18 20 22 24 26 28 30 februaryjanuary march april date of rash onset epidemiologically linked laboratory-confirmed clinically compatible hmong new year in xaisomboun province (6–15 december 2018) hmong new year in vientiane capital (25 december 2018–5 january 2019) n o. o f su sp ec te d ca se s outbreak investigation 23–30 april 2019 characteristic laboratoryconfirmeda epidemiologically linked clinically compatible discarded (non-cases) total sex female 2 (15.4) 7 (53.8) 2 (15.4) 2 (15.4) 13 (100) male 2 (7.4) 17 (63.0) 6 (22.2) 2 (7.4) 27 (100) age (months) <9 1 (5.9) 9 (52.9) 5 (29.4) 2 (11.8) 17 (100) 9 to <18 1 (9.1) 8 (72.7) 1 (9.1) 1 (9.1) 11 (100) 18 to <24 0 0 0 0 0 ≥24 2 (16.7) 7 (58.3) 2 (16.7) 1 (8.3) 12 (100) identification provincial hospital 3 (50.0) 1(16.7) 1 (16.7) 1 (16.7) 6 (100) primary health care centre 1 (10.0) 4 (40.0) 4 (40.0) 1 (10.0) 10 (100) house-to-house survey 0 19 (79.2) 3 (12.5) 2 (8.3) 24 (100) immunization status measles-containing vaccine: 1 dose 1 (7.1) 11 (78.6) 1 (7.1) 1 (7.1) 14 (100) measles-containing vaccine: 2 doses 1 (100) 0 0 0 1 (100) none 2 (9.5) 11 (52.4) 5 (23.8) 3 (14.3) 21 (100) unknown 0 2 (50.0) 2 (50.0) 0 4 (100) ethnicity lao–tai 0 0 0 1 (100) 1 (100) hmong–lu mien 4 (10.3) 24 (61.5) 8 (20.5) 3 (7.7) 39 (100) mon–khmer 0 0 0 0 0 village x 4 (12.1) 24 (72.7) 3 (9.1) 2 (6.1) 33 (100) y 0 0 5 (58.3) 1 (16.7) 6 (100) z 0 0 0 1 (100) 1 (100) wpsar vol 13, no 3, 2022 | doi: 10.5365/wpsar.2022.13.3.874https://ojs.wpro.who.int/ 5 measles outbreak in xaisomboun, lao pdr douangboupha et al had travelled to xiengkhouang province, one living in village x travelled to an unknown village and one living in village y visited village x (table 1). fifteen percent (6) of cases had participated in social events or gatherings. there was no report of international travel. population risk factors in xaisomboun, mcv coverage rates among those aged <1 year were <50% in both 2017 and 2018 compared with 80% nationally.7 surveyed coverage of one dose 67% (8/12) of those aged ≥24 months. only one child aged ≥24 months had received the second dose of mcv. immunization status could not be determined for four cases (table 1). contact, travel and mass gatherings altogether, 43% (17) of suspected cases had a history of exposure to a case with fever and rash during the 7–21 days prior to their rash onset (table 1). ten percent (4) had travelled during the 3 weeks prior to rash onset: two characteristic laboratoryconfirmeda epidemiologically linked clinically compatible discarded (non-cases) total contact with people with fever and rash 7–21 days prior to rash onset yes 0 12 (70.6) 2 (11.8) 3 (17.6) 17 (100) no 2 (11.1) 9 (50.0) 6 (33.3) 1 (5.6) 18 (100) unknown 2 (40.0) 3 (60.0) 0 0 5 (100) travel during 3 weeks prior to rash onset yes 0 1 (25.0) 1 (25.0) 2 (50.0) 4 (100) no 1 (3.0) 23 (69.7) 7 (21.2) 2 (6.0) 33 (100) unknown 3 (100) 0 0 0 3 (100) participation in social events or gatherings yes 0 3 (50.0) 2 (33.3) 1 (16.7) 6 (100) no 0 18 (69.2) 6 (23.1) 2 (7.7) 26 (100) unknown 4 (50.0) 3 (37.5) 0 1 (12.5) 8 (100) time to notification ≤5 days 4 (22.2) 7 (38.9) 3 (16.7) 4 (22.2) 18 (100) ≥6 days 0 17 (77.3) 5 (22.7) 0 22 (100) throat swab collected yes 4 (36.4) 0 3 (27.3) 4 (36.4) 11 (100) no 0 24 (82.8) 5 (17.2) 0 29 (100) serum sample collected yes 4 (50.0) 0 1 (12.5) 3 (37.5) 8 (100) no 0 24 (75.0) 7 (21.9) 1 (3.1) 32 (100) hospitalization yes 3 (50.0) 1 (16.7) 1 (16.7) 1 (16.7) 6 (100) no 1 (2.9) 23 (67.6) 7 (20.6) 3 (8.8) 34 (100) days from rash onset to throat swab 0 0 0 2 (100) 0 2 (100) 1 1 (50.0) 0 0 1 (50.0) 2 (100) 3 3 (50.0) 0 1 (16.7) 2 (33.3) 6 (100) 4 0 0 0 1 (100) 1 (100) days from rash onset to serum collection 0 0 0 1 (100) 0 1 (100) 1 1 (50.0) 0 0 1 (50.0) 2 (100) 3 3 (75.0) 0 0 1 (25.0) 4 (100) 4 0 0 0 1 (100) 1 (100) a values are number (%). wpsar vol 13, no 3, 2022 | doi: 10.5365/wpsar.2022.13.3.874 https://ojs.wpro.who.int/6 douangboupha et almeasles outbreak in xaisomboun, lao pdr day incubation period for the first suspected case. it is possible that earlier cases related to festival attendance were undetected or, more likely, there was importation from travellers visiting or returning to xaisomboun from provinces experiencing outbreaks in january and february 2019, such as in xiengkhouang. low mcv coverage likely contributed to the outbreak. we verified that the province had not achieved the recommended mcv coverage of 95%. contributing factors to low vaccination coverage, all of which are relevant to xaisomboun, include financial barriers to vaccination,9 being a member of an ethnic minority group with linguistic and cultural barriers,10 lack of knowledge or a low level of education,9 difficulty accessing vaccination centres9 and socioeconomic inequalities.11 reported factors affecting vaccine compliance in lao pdr may also relate to vaccine provision and include problems with the supply of vaccines and diluents, the cold chain, lack of availability of hcws, and capacity issues affecting coordination between relevant organizations to assess needs and make appropriate decisions.9 vaccine failure5 and vaccine quality are other possible contributing factors. a reduction in immunogenicity related to suboptimal vaccine handling and poor immune response during the national measles campaign in 2011 have previously been proposed and may also be contributory.12 additional likely contributing factors to the outbreak include delayed reporting and a lack of case recognition and infection prevention and control measures, as well as hesitancy to seek health care. delayed reporting as a contributing factor is supported by the number of clinically and epidemiologically linked cases identified during the investigation and the atypical progressive-source epidemiological curve. two barriers recognized to hinder the provision of high-quality care by hcws, namely lack of provider education and necessary equipment, may have contributed to the lack of case recognition.13 inadequate infection prevention and control measures in the healthcare setting can contribute to increased measles transmission and spread; however, we did not formally review these measures. furthermore, poor health-seeking behaviour is associated with low income14 and poor health insurance coverage.15 evidence indicates that in lao pdr there is limited coverage of the health equity fund, which creates challenges to accessing health services for those in the poorest quintiles.10 evidence also suggests that the use of health-care services in lao pdr often results of mcv in those aged 12–23 months in xaisomboun in 2017 was 40%, the lowest of all provinces, compared with 66% nationally.3 vaccination coverage data were not available for minority groups in this province. however, nationally surveyed coverage rates for measles–rubella vaccine in 2017 for children aged 12–23 months varied according to the ethnolinguistic group of the head of household: coverage was highest among families with a lao–tai (74%) head of household and lowest among those with a hmong–lu mien (45%) head of household.3 the traditional hmong–lu mien new year celebration was during 6–15 december 2018 in xaisomboun province and 25 december 2018–5 january 2019 in vientiane capital. this event is locally and nationally recognized as a feast that brings together family members who often live in different regions across the country to renew ties and social bonds, and it is also a time to remember ancestors, to pay repect to family spirits, and to reflect on the passing years and prepare for the new year.8 public health interventions we assisted local teams in notifying health facilities in the area to trigger a risk assessment and immunization response to enhance the current, local surveillance systems for acute fever and rash and clinical case management strategies and to initiate community engagement, awareness and risk communication activities. we provided health education to parents about home care strategies, sanitation, isolation and when to seek medical attention; initiated vitamin a prophylaxis for the cases; and advised health-care workers (hcws) to undertake regular home visits and to follow up. subsequently, the ministry of health conducted a mass vaccination campaign in the province beginning in early may 2019. discussion the outbreak investigation identified 40 suspected measles cases, of whom almost all resided in village x and were of hmong–lu mien ethnicity. all were children, predominantly aged <24 months. among those aged 9 to <18 months, mcv coverage was <50%. notification was delayed for most cases. the source of this outbreak was not determined. travel and gatherings related to the traditional new year festival may have been contributing factors, although these occurred well before the 7–21wpsar vol 13, no 3, 2022 | doi: 10.5365/wpsar.2022.13.3.874https://ojs.wpro.who.int/ 7 measles outbreak in xaisomboun, lao pdr douangboupha et al isolated nature of mountainous communities that have limited access to health care, education and other public services19 increases this population’s susceptibility to outbreaks. effective strategies are needed to enable local health authorities and communities to work together to understand and address barriers to immunization and to raise awareness about measles. these strategies need to include further exploration of the cultural beliefs, health literacy rates and socioeconomic status specific to the province. understanding and addressing these issues may help to improve mcv coverage and early diagnosis, enabling timely public health interventions to control outbreaks and reduce mortality and morbidity. additionally, delivering training modules for hcws that specifically address measles detection and surveillance with review of feedback from participants and serial nationwide measurements of performance by the ministry of health could contribute to increasing the standard of primary health care, thereby improving the health of the population of lao pdr.13 acknowledgements we would like to express gratitude to the staff at the epidemiological and laboratory units of the ncle for contributing their knowledge and expertise to the investigation and control of this outbreak. conflicts of interest none. ethics statement this study was conducted as part of an outbreak response under the lao pdr law for outbreak investigations. the australian national university ethics committee approved the study (protocol no. 2017/909). funding this outbreak was carried out as part of the first author’s master’s of applied epidemiology course at the australian national university under the asean–australian health security fellowship funded by the health security initiative of the indo-pacific centre for health security, australian government department of foreign affairs and trade. in financial hardship for patients and their relatives.14 uninsured people frequently use traditional medicine and self-medication due to perceptions of high prices and poor quality associated with public health services.14 although there is a relatively robust network of public health services, access can be hindered by the mountainous terrain and lack of year-round roads.10 overcrowded environments and inadequate sanitation in xaisomboun, as identified by the lao social indicator survey,3 also facilitate measles virus transmission.16 the survey3 also suggests that the community in xaisomboun is hesitant to seek health care, as it reported that for children aged 0–59 months, advice or treatment was not sought for 48.4% of children with diarrhoea and 72% of those with fever compared with national rates of, respectively, 51% and 42%.3 the unique languages and traditional beliefs of the xaisomboun community may also play an important part in their health-seeking behaviour. this study highlights issues similar to those identified in other measles outbreaks in the asia–pacific region. the 2013–2014 measles outbreak in northern viet nam reportedly started among ethnic minorities in mountainous areas that had limited access to vaccination.17 a measles outbreak investigation in a remote area of the solomon islands in 2014 suggested that reasons for delayed hospital visits included the long distances between home and hospital, complex sociocultural issues and families first consulting traditional healers.18 this study had limitations. the retrospective nature of the study, relying on voluntarily self-reported information from participants, means that recall bias and an underestimation of reported cases are likely. also, additional suspected cases may not have been identified if they were absent from their village during the investigation. we encountered linguistic and cultural barriers and had limited access to professionally trained interpreters; therefore, the accuracy of the data could be affected. however, our results are supported by collaborative evidence and field observations. this outbreak investigation in a rural, mountainous village in lao pdr highlights many important considerations. likely contributors to this outbreak include population movement, low immunization coverage, delayed notification, and a lack of case recognition and healthseeking behaviour, as well as socioeconomic factors. the wpsar vol 13, no 3, 2022 | doi: 10.5365/wpsar.2022.13.3.874 https://ojs.wpro.who.int/8 douangboupha et almeasles outbreak in xaisomboun, lao pdr 11. hajizadeh m. socioeconomic inequalities in child vaccination in low/ middle-income countries: what accounts for the differences? j epidemiol community health. 2018;72(8):719–25. doi:10.1136/jech2017-210296 pmid:29581228 12. vynnycky e, miyano s, komase k, mori y, takeda m, kitamura t, et al. estimating the immunogenicity of measles–rubella vaccination administered during a mass campaign in lao people’s democratic republic using multi-valent seroprevalence data. sci rep. 2019;9(1):12545. doi:10.1038/s41598-019-49018-y pmid:31467441 13. peabody j, tran m, paculdo d, sato a, ramesh k. quality of health care in the lao people’s democratic republic. tokyo: asian development bank institute; 2019. available from: https://www.adb.org/publications/ quality-of-health-care-lao-pdr, accessed 16 november 2021. 14. the lao people’s democratic republic health system review. manila: who regional office for the western pacific; 2014. available from: https://apps.who.int/iris/handle/10665/207762, accessed 16 november 2021. 15. osei asibey b, agyemang s. analysing the influence of health insurance status on peoples’ health seeking behaviour in rural ghana. j trop med. 2017;2017:8486451. doi:10.1155/2017/8486451 pmid:28567060 16. wongsanuphat s, thitichai p, jaiyong r, plernprom p, thintip k, jitpeera c, et al. investigation of measles outbreak among thai and migrant workers in two factories in nakhon pathom, thailand, 2019. int j environ res public health. 2020;17(13):4627. doi:10.3390/ijerph17134627 pmid:32605070 17. do lp, van ttt, nguyen dtm, van khang p, pham qt, tran mt, et al. epidemiological and molecular characteristics of a measles outbreak in northern vietnam, 2013–2014. j clin virol. 2021;139:104840. doi:10.1016/j.jcv.2021.104840 pmid:33962181 18. diau j, jimuru c, asugeni j, asugeni l, puia m, maomatekwa j, et al. measles outbreak investigation in a remote area of solomon islands, 2014. western pac surveill response j. 2015;6(3):17–21. doi:10.5365/wpsar.2015.6.2.001 pmid:26668762 19. boulom s, essink dr, kang mh, kounnavong s, broerse jew. factors associated with child malnutrition in mountainous ethnic minority communities in lao pdr. glob health action. 2020;13(suppl. 2):1785736. doi:10.1080/16549716.2020.1785 736 pmid:32741342 references 1. measles – western pacific region (wpro): 7 may 2019. manila: who regional office for the western pacific; 2019. available from: https://www.who.int/emergencies/disease-outbreak-news/item/07may-2019-measles-western-pacific-region-en, accessed 16 november 2021. 2. brief 2018 report and 2019 plan for xaisomboun district health office [in lao]. xaisomboun, lao pdr: district health office; 2019. 3. lao social indicator survey ii 2017, survey findings report. vientiane, lao pdr: lao statistics bureau, unicef; 2018. available from: https:// www.aidsdatahub.org/resource/lao-social-indicator-survey-ii-2017-survey-findings-report, accessed 16 november 2021. 4. epidemiology unit, national center for laboratory and epidemiology. measles epidemiological data (official data based on weekly data reported to ncle as of 12 august 2019). vientiane, lao pdr: ministry of health; 2019. 5. surveillance standards for vaccine-preventable diseases, second edition. geneva: world health organization; 2018. available from: https://apps.who.int/iris/handle/10665/275754, accessed 16 november 2021. 6. swaan c, van den broek a, kretzschmar m, richardus jh. timeliness of notification systems for infectious diseases: a systematic literature review. plos one. 2018;13(6):e0198845. doi:10.1371/ journal.pone.0198845 pmid:29902216 7. national immunization program. measles immunization coverage in lao pdr (2017 & 2018). vientiane, lao pdr: ministry of health; 2018. 8. yang k. an assessment of the hmong american new year and its implications for hmong-american culture. hmong studies journal. 2007 dec 1;8. available from: https://www.hmongstudiesjournal. org/uploads/4/5/8/7/4587788/kyanghsj8.pdf. 9. phimmasane m, douangmala s, koffi p, reinharz d, buisson y. factors affecting compliance with measles vaccination in lao pdr. vaccine. 2010;28(41):6723–9. doi:10.1016/j.vaccine.2010.07.077 pmid:20692220 10. overview of lao health system development 2009–2017. manila: who regional office for the western pacific; 2018. available from: http://iris.wpro.who.int/handle/10665.1/14226, accessed 16 november 2021. https://ojs.wpro.who.int/ 1wpsar vol 12, no 3, 2021 | doi: 10.5365/wpsar.2021.12.3.808 brief report c oronavirus disease 2019 (covid-19) is a respiratory illness caused by infection with severe acute respiratory syndrome coronavirus 2 (sarscov-2), first identified in december 2019 in hubei province, china.1 by 31 january 2020, at least one case had been reported from each of mainland china’s 31 provincial-level administrative units, and by 29 february, a total of 80 968 cases had been reported.2 on 30 january 2020, who declared covid-19 a public health emergency of international concern, and on 11 march 2020, who declared the outbreak a global pandemic. non-pharmaceutical interventions (npis) for respiratory virus outbreaks are used to prevent exposures and reduce transmission through individual or community action.3,4 with several other countries in the western pacific region,5–7 china implemented covid-19 contact tracing with quarantine as part of a comprehensive covid-19 prevention and control strategy, which also included mask use, emphasis on hand hygiene, enforced physical distancing and movement restrictions within and between provinces.8,9 china’s contact-tracing strategy was to identify and quarantine exposed individuals to prevent additional disease transmission. on 20 january 2020, china designated covid-19 a notifiable disease and updated the “frontier health and quarantine law” to allow quarantine of contacts.10 national guidelines on epidemiological a united states centers for disease control and prevention, atlanta, ga, united states of america. b united states centers for disease control and prevention, china country office, beijing, china. c united states public health service commissioned corps, rockville, md, united states of america. published: 12 august 2021 doi: 10.5365/wpsar.2021.12.3.808 objective: contact tracing has been used in china and several other countries in the who western pacific region as part of the covid-19 response. we describe covid-19 cases and the number of contacts traced and quarantined per case as part of covid-19 emergency public health response activities in china. methods: we abstracted publicly available, online aggregated data published in daily covid-19 situational reports by china’s national health commission and provincial health commissions between 20 january and 29 february 2020. the number of new contacts traced by report date was computed as the difference between total contacts traced in consecutive reports. a proxy for the number of contacts traced per case was computed as the number of new contacts traced divided by the number of new cases. results: during the study period, china reported 80 968 new covid-19 cases and 659 899 contacts. in hubei province, there were 67 608 cases and 264 878 contacts, representing 83% and 40% of the total, respectively. non-hubei provinces reported tracing 1.5 times more contacts than hubei province; the weekly number of contacts traced per case was also higher in non-hubei provinces than in hubei province and increased from 17.2 in epidemiological week 4 to 115.7 in epidemiological week 9. discussion: more contacts per case were reported from areas and periods with lower covid-19 case counts. with other non-pharmaceutical interventions used in china, contact tracing and quarantining large numbers of potentially infected contacts probably contributed to reducing sars-cov-2 transmission. use of public data to describe covid-19 contact tracing in hubei province and nonhubei provinces in china between 20 january and 29 february 2020 emilio dirlikov,a suizan zhou,b lifeng han,b zhijun li,b ling hao,b alexander j. millmanb,c and barbara marstona correspondence to emilio dirlikov (email: klt9@cdc.gov) wpsar vol 12, no 3, 2021 | doi: 10.5365/wpsar.2021.12.3.808 https://ojs.wpro.who.int/2 dirlikov et alcovid-19 contact tracing in china as the difference between national totals and totals for hubei province. ethics statement this activity was deemed not to be research as defined in united states government 45 cfr 46.102(l), and institutional review board approval was not required. non-research determination was provided by the us cdc center for global health in may 2020. results in addition to national and hubei province data, complete data were available for 22 of 30 non-hubei provincial-level administrative units: anhui, chongqing municipality, gansu, guangxi autonomous region, guizhou, hainan, hebei, heilongjiang, henan, hunan, inner mongolia autonomous region, jiangsu, jiangxi, jilin, liaoning, qinghai, shaanxi, shandong, shanxi, tianjin municipality, tibet autonomous region and zhejiang (fig. 1). eight provinces, comprising 26% of the total population, were excluded from the analysis because of no or insufficient reported data (beijing municipality, fujian, guangdong, ningxia autonomous region, shanghai municipality, sichuan, xinjiang autonomous region and yunnan). during epidemiological weeks 4–9, the nhc reported 80 968 new covid-19 cases and 659 899 contacts traced. these included 67 608 cases (83% of total cases reported) and 264 878 contacts (40% of total reported contacts traced) in hubei province. during the same period, non-hubei provinces reported an aggregate total of 13 360 cases and 395 021 contacts traced. among the 22 provinces with provincial-level data, those with the largest numbers of reported cases and contacts traced were henan province (reported cases = 1274/9664 [13%]; reported contacts = 39 199/306 684 [13%]) and zhejiang province (reported cases = 1216/9664 [13%]; reported contacts = 41 050/306 684 [13%]). the weekly number of contacts traced per case remained <10 in hubei province throughout the study period (median = 6.45; range = 2.0 in epidemiological week 7 to 8.5 in epidemiological week 4); the lowest value occurred when 18 453 clinically diagnosed cases were reported as part of the case counts for 12–15 february (epidemiological week 7), which increased the investigations and management of contacts were issued and updated several times, and responsibility for contact tracing was delegated to the local level.11,12 the national guidelines defined contacts as: “anyone who may have had contact with a case through a range of circumstances or activities including being family members, relatives, friends, colleagues, classmates, health care workers, and services personnel”.12 the national guidelines further detailed eight categories of close contacts (e.g. family members living together, direct caregivers or providers of medical treatment or care services and other people considered by onsite investigators to meet the criteria for a close contact). to describe the number of contacts traced and quarantined per case as part of covid-19 emergency public health response activities, we compared data from hubei province with those from the 30 other mainland provinces (non-hubei provinces) reported between 20 january and 29 february 2020. we compared the numbers in hubei province with those in non-hubei provinces because the majority of reported cases occurred in hubei province. methods we abstracted publicly available, online aggregated data reported in daily situational reports at the national level by the nhc and provincial level by provincial health commissions (see appendix: data sources). for epidemiological weeks 4–9 (weeks ending on saturdays), we collected daily reported data on newly reported cases and total contacts traced and placed under medical observation. data were reviewed for abstraction errors, including data entry errors and data completeness. provincial data that were >95% complete (i.e. reporting for >95% of days between 20 january and 29 february) were included. when situational reports included corrections to reported data, the corrected data were used for the day reported. the number of new contacts traced by report date was computed as the difference between the total number of contacts traced on consecutive reports. a proxy for the number of contacts traced per case was computed as the number of new contacts traced divided by the number of new cases. calculations were performed by epidemiological week. data were analysed at national and provincial levels (in the included provinces) and for the 30 non-hubei provinces combined, calculated https://ojs.wpro.who.int/ojs/index.php/wpsar/article/view/808/1044 wpsar vol 12, no 3, 2020 | doi: 10.5365/wpsar.2021.12.3.808https://ojs.wpro.who.int/ 3 covid-19 contact tracing in chinadirlikov et al identifying pre-symptomatic and asymptomatic infections early and reducing the time from symptom onset to initiation of medical care.13,14 contact tracing and data reporting varied by province, with non-hubei provinces reporting more contacts traced per case, and the number of contacts traced per case in these provinces increasing during the study period. in hubei province, the average number of contacts traced per case remained <10 during this period, and the number of contacts traced decreased with increasing numbers of reported cases. although non-hubei provinces reported only 17% of total cases, 1.5 times more contacts were traced than in hubei province. the differences between provinces may reflect local capacity for contact tracing, differences in local disease transmission, evolving guidelines and implementation of other npis. for example, a lockdown in wuhan city began on 23 january 2020, followed by widespread movement restrictions within and between provinces1 to mitigate transmission; national travel restrictions began to be lifted on 17 february 2020, although movement restrictions continued. implementation differed among provinces.9 denominator substantially and consequently reduced the number of contacts traced per case (fig. 2 and table 1). the weekly number of contacts traced per case was higher in non-hubei provinces than in hubei province and increased from 17.2 in epidemiological week 4 to 115.7 in epidemiological week 9 (fig. 2 and table 1). data from the 22 non-hubei provinces indicated that the number of contacts traced per case generally increased as case counts declined, while the reported number of contacts traced either remained high or increased over time. for example, anhui province reported 60 cases and 1023 contacts traced during epidemiological week 4 (17.1 contacts traced per case) and 1 case and 915 reported contacts traced during epidemiological week 9 (915 contacts traced per case). discussion with other npis used in china, contact tracing and quarantining of a large number of potentially infected contacts probably contributed to reducing sars-cov-2 transmission.10 contact tracing with quarantine potentially helped to mitigate the risk of transmission by hubei province non-hubei provinces excluded provinces fig. 1. map of mainland china provinces included in the analysis wpsar vol 12, no 3, 2021 | doi: 10.5365/wpsar.2021.12.3.808 https://ojs.wpro.who.int/4 dirlikov et alcovid-19 contact tracing in china observation, housing for contacts and laboratory testing capacity. while contact tracing identified and isolated large numbers of potentially infected contacts, published studies show that most contacts did not become reported cases: 30.4% (391 positive contacts/1286 contacts traced) in shenzhen, 2.6% (129/4950) in guangzhou and 2.3% (120/5241) in xi’an.13–15 contact tracing with quarantine is resource intensive. for example, in wuhan city, contact tracing was conducted by 1800 epidemiologists working in teams of five.8 data on provincial contact-tracing resources were not available. geographical and temporal differences may have affected the availability of resources, including trained staff for contact tracing and medical fig. 2. reported numbers of covid-19 cases and contacts traced per case, by week, hubei province (red) and non-hubei provinces (calculated; blue), epidemiological weeks 4–9, 2020 the weekly number of contacts traced per case was calculated as the number of new contacts traced in an epidemiological week divided by the number of new cases reported in that week. data for the 30 non-hubei provinces were calculated as the difference between national totals and totals for hubei province. in hubei province, the lowest value occurred when 18 453 clinically diagnosed cases were reported in case counts for 12–15 february (epidemiological week 7), which increased the denominator substantially and consequently lowered the number of contacts traced per case. 17.2 non-hubei provinces (calculated) epidemiological week 5000 6000 22.8 27.6 45.3 40.2 115.7 20.0 00 new cases n ew c as es number of contacts per case n u m b er o f co n ta ct s p er c as e 40.0 60.0 80.0 100.0 120.0 1000 4 5 6 7 8 9 2000 3000 4000 8.5 hubei province epidemiological week 30 000 35 000 5.1 4.2 2.0 7.8 8.2 2.0 00 new cases n ew c as es number of contacts per case n u m b er o f co n ta ct s p er c as e 4.0 6.0 8.0 10.0 10 000 5000 4 5 6 7 8 9 15 000 20 000 25 000 wpsar vol 12, no 3, 2020 | doi: 10.5365/wpsar.2021.12.3.808https://ojs.wpro.who.int/ 5 covid-19 contact tracing in chinadirlikov et al comprehensive in areas and periods with lower case counts (non-hubei provinces); there may also have been differences in other npis implemented, including mask use, emphasis on hand hygiene, enforced physical distancing and movement restrictions. future investigations should better define the role of covid-19 contact tracing and quarantine, including timeliness, prioritization of contacts who are more likely to be associated with transmission and the effectiveness of contact tracing in contexts that differ epidemiologically, socially and with respect to resource availability. acknowledgements we thank rj simonds for administrative and technical support. conflicts of interest none of the authors has a conflict of interest. funding no funding was given for this activity. disclaimer (required for publication by cdc authors): the conclusions, findings and opinions expressed by authors contributing to this journal do not necessarily reflect the official position of the us department of health and human services, the us public health service or the us centers for disease control and prevention. this report has several limitations. first, the public data did not include contact-by-exposure type, and it is likely that the actual number of contacts traced differed by type of exposure (e.g. family, shopping centre, public transport). therefore, the number of “contacts traced per case” may be overestimated when large numbers of contacts are linked to a single case (e.g. attending a public gathering with a confirmed case). second, without data on individual patients, our analysis is based on aggregated data and subject to ecological fallacy. for example, contacts traced reported in one week could have been those of cases reported in the previous week. third, data on contact-tracing outcomes and resources were not available for analysis. all contacts were assumed to have been quarantined according to the national guidelines, and provinces were assumed to have implemented contact-tracing guidelines uniformly, although inter-provincial differences may have affected the comparability of the reported data. the data could not be verified externally, the data collection methods were unknown, and it was not known whether all reported contacts traced were linked to reported cases. finally, reported data on contact tracing were missing or incomplete for eight provinces, which were excluded from the analysis. despite these limitations, our findings describe contact tracing in china during the covid-19 response and differences between hubei province and non-hubei provinces based on publicly available data. we found higher rates of contacts traced and quarantined in areas with lower numbers of reported covid-19 cases, suggesting that contract tracing may have been more table 1. weekly numbers of reported covid-19 cases, contacts traced and contacts traced per covid-19 case, by geographical unit, epidemiological weeks 4–9, 2020 a proxy for the number of contacts traced per case was computed as the number of new contacts traced divided by the number of new cases. data for the 30 non-hubei provinces were calculated as the difference between national totals and totals for hubei province. in hubei province, the lowest value occurred when 18 453 clinically diagnosed cases were reported in case counts for 12–15 february (epidemiological week 7), which increased the denominator substantially and consequently lowered the number of contacts traced per case. epi week national total hubei province non-hubei provinces (calculated) cases contacts contacts per case cases contacts contacts per case cases contacts contacts per case epi week 4 1748 22 614 12.9 854 7250 8.5 894 15 364 17.2 epi week 5 12 410 140 413 11.3 8022 40 582 5.1 4388 99 831 22.8 epi week 6 22 843 208 061 9.1 18 026 75 256 4.2 4817 132 805 27.6 epi week 7 32 447 157 513 4.9 30 279 59 356 2.0 2168 98 157 45.3 epi week 8 8437 99 099 11.7 7409 57 754 7.8 1028 41 345 40.2 epi week 9 3083 32 199 10.4 3018 24 680 8.2 65 7519 115.7 total 80 968 659 899 8.2 67 608 264 878 3.9 13 360 395 021 29.6 wpsar vol 12, no 3, 2021 | doi: 10.5365/wpsar.2021.12.3.808 https://ojs.wpro.who.int/6 dirlikov et alcovid-19 contact tracing in china references 1. pan a, liu l, wang c, guo h, hao x, wang q et al. association of public health interventions with the epidemiology of the covid-19 outbreak in wuhan, china. jama. 2020;323(19):1915–23. doi:10.1001/jama.2020.6130 pmid:32275295 2. chinese center for disease control and prevention. tracking the epidemic. china cdc weekly, 7 may 2020. available from: http:// weekly.chinacdc.cn/news/trackingtheepidemic2020.htm, accessed 22 may 2020. 3. qualls n, levitt a, kanade n, wright-jegede n, dopson s, biggerstaff m et al. community mitigation guidelines to prevent pandemic influenza – united states, 2017. mmwr recomm rep. 2017;66(1):1–34. doi:10.15585/mmwr.rr6601a1 pmid:28426646 4. fong mw, gao h, wong jy, xiao j, shiu eyc, ryu s et al. nonpharmaceutical measures for pandemic influenza in nonhealthcare settings – social distancing measures. emerg infect dis. 2020;26(5):976–84. doi:10.3201/eid2605.190994 pmid:32027586 5. cheng hy, jian sw, liu dp, ng tc, huang wt, lin hh. taiwan covid-19 outbreak investigation team. contact tracing assessment of covid-19 transmission dynamics in taiwan and risk at different exposure periods before and after symptom onset. jama intern med. 2020;180(9):1156–63. doi:10.1001/jamainternmed.2020.2020 pmid:32356867 6. ng y, li z, chua yx, chaw wl, zhao z, er b et al. evaluation of the effectiveness of surveillance and containment measures for the first 100 patients with covid-19 in singapore – january 2–february 29, 2020. mmwr morbid mortal wkly rep. 2020;69(11):307– 11. doi:10.15585/mmwr.mm6911e1 pmid:32191691 7. covid-19 national emergency response center. epidemiology and case management team; korea centers for disease control and prevention. coronavirus disease-19: summary of 2,370 contact investigations of the first 30 cases in the republic of korea. osong public health res perspect. 2020;11(2):81–4. doi:10.24171/j.phrp.2020.11.2.04 pmid:32257773 8. report of the who–china joint mission on coronavirus disease 2019 (covid-19). geneva: world health organization; 2020. available from: https://www.who.int/docs/default-source/coronaviruse/who-china-joint-mission-on-covid-19-final-report.pdf, accessed 22 april 2020. 9. lai s, ruktanonchai nw, zhou l, prosper o, luo w, floyd jr et al. effect of non-pharmaceutical interventions to contain covid-19 in china. nature. 2020;585(7825):410–3. doi:10.1038/s41586-020-2293-x pmid:32365354 10. the novel coronavirus pneumonia emergency response epidemiology team. the epidemiological characteristics of an outbreak of 2019 novel coronavirus diseases (covid-19) – china, 2020. china cdc weekly. 2020;2(8):113–22. doi:10.46234/ ccdcw2020.032 11. chinese center for disease control and prevention. guidelines for covid-19 epidemiological investigations. china cdc weekly. 2020;2(19):327–8. 12. chinese center for disease control and prevention. guidelines for investigation and management of close contacts of covid-19 cases. china cdc weekly. 2020;2(19):329–31. 13. bi q, wu y, mei s, ye c, zou x, zhang z et al. epidemiology and transmission of covid-19 in 391 cases and 1286 of their close contacts in shenzhen, china: a retrospective cohort study. lancet infect dis. 2020;20(8):911–9. doi:10.1016/s14733099(20)30287-5 pmid:32353347 14. luo l, liu d, liao x, wu x, jing q, zheng j et al. modes of contact and risk of transmission in covid-19 among close contacts. medrxiv [preprint]. 2020. doi:10.1101/2020.03.24.20042606 15. zhang h, ji z, cheng z, zeng l, mi b, cheng f et al. epidemiological characteristics of close contact in xi’an. j xi’an jiaotong univ med sci. 2020:1–7. issn:1671–8259/cn:61–1399/r. http://weekly.chinacdc.cn/news/trackingtheepidemic2020.htm http://weekly.chinacdc.cn/news/trackingtheepidemic2020.htm https://www.who.int/docs/default-source/coronaviruse/who-china-joint-mission-on-covid-19-final-repor https://www.who.int/docs/default-source/coronaviruse/who-china-joint-mission-on-covid-19-final-repor wpsar vol 12, no 3, 2020 | doi: 10.5365/wpsar.2021.12.3.808https://ojs.wpro.who.int/ 7 covid-19 contact tracing in chinadirlikov et al technical appendix. provincial-level health commission websites containing publicly available reported data on covid-19 province name location national health commission http://weekly.chinacdc.cn/news/trackingtheepidemic.htm anhui http://wjw.ah.gov.cn/ beijing http://wjw.beijing.gov.cn/xwzx_20031/xwfb/ chongqing http://wsjkw.cq.gov.cn/ fujian http://wjw.fujian.gov.cn/ gansu http://wsjk.gansu.gov.cn/ guangdong http://wsjkw.gd.gov.cn/zwyw_yqxx/index.html guangxi http://wsjkw.gxzf.gov.cn/gzdt/bt/ guizhou http://www.gzhfpc.gov.cn/ hainan http://wst.hainan.gov.cn/swjw/index.html hebei http://wsjkw.hebei.gov.cn/ heilongjiang http://wsjkw.hlj.gov.cn/ henan http://www.hnwsjsw.gov.cn/ hubei http://wjw.hubei.gov.cn/fbjd/dtyw/ hunan http://wjw.hunan.gov.cn/ inner mongolia http://wjw.nmg.gov.cn/ jiangsu http://wjw.jiangsu.gov.cn/ jiangxi http://hc.jiangxi.gov.cn/ jilin http://wsjkw.jl.gov.cn/ liaoning http://wsjk.ln.gov.cn/ ningxia http://wsjkw.nx.gov.cn/ qinghai https://wsjkw.qinghai.gov.cn/ shaanxi http://sxwjw.shaanxi.gov.cn/ shandong http://wsjkw.shandong.gov.cn shanghai http://wsjkw.sh.gov.cn/xwfb/index.html shanxi http://wjw.shanxi.gov.cn/ sichuan http://wsjkw.sc.gov.cn/scwsjkw/szyw/tygl.shtml tianjin http://wsjs.tj.gov.cn/ tibet http://wjw.xizang.gov.cn xinjiang http://xjhfpc.gov.cn yunnan http://ynswsjkw.yn.gov.cn/wjwwebsite/web/index zhejiang http://www.zjwjw.gov.cn/col/col1202101/index.html http://weekly.chinacdc.cn/news/trackingtheepidemic.htm http://wjw.ah.gov.cn/ http://wjw.beijing.gov.cn/xwzx_20031/xwfb/ http://wsjkw.cq.gov.cn/ http://wjw.fujian.gov.cn/ http://wsjk.gansu.gov.cn/ http://wsjkw.gd.gov.cn/zwyw_yqxx/index.html http://wsjkw.gxzf.gov.cn/gzdt/bt/ http://www.gzhfpc.gov.cn/ http://wst.hainan.gov.cn/swjw/index.html http://wsjkw.hebei.gov.cn/ http://wsjkw.hlj.gov.cn/ http://www.hnwsjsw.gov.cn/ http://wjw.hubei.gov.cn/fbjd/dtyw/ http://wjw.hunan.gov.cn/ http://wjw.nmg.gov.cn/ http://wjw.jiangsu.gov.cn/ http://hc.jiangxi.gov.cn/ http://wsjkw.jl.gov.cn/ http://wsjk.ln.gov.cn/ http://wsjkw.nx.gov.cn/ https://wsjkw.qinghai.gov.cn/ http://sxwjw.shaanxi.gov.cn/ http://wsjkw.shandong.gov.cn http://wsjkw.sh.gov.cn/xwfb/index.html http://wjw.shanxi.gov.cn/ http://wsjkw.sc.gov.cn/scwsjkw/szyw/tygl.shtml http://wsjs.tj.gov.cn/ http://wjw.xizang.gov.cn http://xjhfpc.gov.cn http://ynswsjkw.yn.gov.cn/wjwwebsite/web/index http://www.zjwjw.gov.cn/col/col1202101/index.html https://ojs.wpro.who.int/ 1wpsar vol 12, no 2, 2021 | doi: 10.5365/wpsar.2020.11.4.001 original research p neumonia caused by severe acute respiratory syndrome coronavirus 2 (sars-cov-2) in wuhan, china was first reported to the world health organization (who) on 31 december 2019.1 as of 16 august 2020, the virus, which causes coronavirus disease 2019 (covid-19), had spread globally and infected more than 21 million people, with more than 700 000 deaths.2 the outbreak of covid-19 was declared a public health emergency of international concern by the who on 30 january 2020, following international spread of the disease. malaysia’s preparedness and response plan was instituted as early as february 2020. it included public health activities, intensified diagnostic capacity and early, appropriate treatment of confirmed covid-19 cases.3 the first cases of covid-19 in malaysia were detected on 25 january 2020 in three travellers from china,4 and the first case in a malaysian citizen was confirmed as the ninth case in early february 2020.4 localized clusters started to emerge in february, the largest cluster being linked to a religious gathering in sri petaling, which resulted in a major increase in the number of local cases and contributed to imported cases in neighbouring countries.5 by 16 march, every state and federal territory in malaysia had reported cases of covid-19. malaysia implemented a movement control order (mco) on 18 march 2020 to contain the spread of the virus.4 the government initiative included closing international borders, shutting down certain economic sectors and restricting social movement within and between states to protect the population.6 many of the initial confirmed cases were connected to a wet market in wuhan, and the sars-cov-2 a petaling district health office, selangor, malaysia. published: 21 april 2021 doi: 10.5365/wpsar.2020.11.4.001 descriptive epidemiology of the first wave of covid-19 in petaling district, malaysia: focus on asymptomatic transmission rama krishna supramanian,a lavanyah sivaratnam,a arifah abd rahim,a noor dalila inche zainal abidin,a ong richai,a zazarida zakiman,a salina md taib,a lee soo,a syed hafeez syed ibrahim jamalullai,a muhammad nur asraf khirusalleha and mohamed paid yusofa correspondence to rama krishna supramanian (email: ramakrishna@moh.gov.my) background: covid-19 was first detected in malaysia on 25 january 2020. multiple clusters were detected in petaling district, with the first locally transmitted case reported on 8 february. descriptive analyses of the epidemiology of the covid-19 outbreak in petaling are presented, from the first case to the end of the first wave. methods: all laboratory-confirmed covid-19 cases reported to the petaling district health office between 1 february and 26 june 2020 were analysed. socio-demographic characteristics, symptoms, date of onset, date of exposure, travel history and history of comorbidities were obtained by phone interviews using one of two investigation forms. the descriptive analysis was conducted according to time, place and person. results: there were 437 covid-19 cases, for an incidence rate of 24/100 000 population. ten (2.3%) deaths and 427 recovered cases were recorded. of the 437 cases, 35.5% remained asymptomatic and 64.5% were symptomatic. common symptoms included fever (43.8%), cough (31.6%) and sore throat (16.2%); 67.3% had no comorbidities, 62.5% reported close contact with a confirmed case, and 76.7% were local infections. transmission occurred in four main groups: religious gatherings (20.4%), corporations (15.1%), health facilities (10.3%) and a wholesale wet market (6.4%). in 31.9% of confirmed cases, an epidemiological link to an asymptomatic case was found. conclusion: transmission of the disease by asymptomatic cases should be emphasized to ensure continuous wearing of face masks, hand hygiene and social distancing. further research should be conducted to better understand the transmission of sars-cov-2 from asymptomatic cases. wpsar vol 12, no 2, 2021 | doi: 10.5365/wpsar.2020.11.4.001 https://ojs.wpro.who.int/2 krishna et aldescriptive epidemiology of the first wave of covid-19 in petaling district, malaysia case definition the definition of a confirmed case of covid-19 is a person with a reverse transcriptase polymerase chain reaction (rt-pcr) positive result, regardless of their symptoms. only cases that met this case definition were included. people under investigation for covid-19 are defined as having fever or acute respiratory infection (sudden onset of shortness of breath, cough and/or sore throat) and travel to or residence in an affected country (china, islamic republic of iran, italy, japan, republic of korea) within 14 days before illness onset or close contact within 14 days before illness onset with a confirmed case of covid-19. epidemiological investigation each notified case was verified by the petaling dho before an epidemiological investigation was undertaken to determine the source of infection, including contact tracing, active case detection and prevention and control measures, including quarantine. the primary objective of investigation was to identify the source of infection and close contacts of confirmed cases. information on socio-demographic characteristics, symptoms, date of illness onset, date of exposure, travel history and comorbidities was obtained by phone interview with cases and contacts using one of two investigation forms. the data were then shared with the selangor state health department. date of exposure was defined as the last date of contact with a known case of covid-19 or last date of travel, if any, while date of onset was defined as the date the person self-reportedly developed any symptoms related to covid-19. details of close contacts were retrieved during case investigations and sent to the contact tracing team for further action. all cases and contacts were monitored daily for the next 14 days. all relevant data were captured within the covid-19 surveillance system of malaysia’s ministry of health (moh). data management most notifications of confirmed cases were received from the surveillance unit of the selangor state health department; some were received by phone, fax or email from hospitals and accredited laboratories. the moh has a surveillance system for notification and monitoring of infectious diseases known as the communicable diseases control information system or enotifikasi,12 pathogen was indicated to be zoonotic in origin. reports have confirmed person-to-person transmission via respiratory droplets, as the virus was shown to spread in wuhan by close contact with positive cases, without exposure to live animals.7 the average incubation period for covid-19 is 5 days but may be up to 14 days. the common reported symptoms include fever, cough, shortness of breath, fatigue and other flu-like symptoms.8,9 asymptomatic cases have also been documented.10 the first covid-19 case in petaling was documented on 3 february 2020 and was later confirmed to be the first case in a malaysian citizen.4 following notification of a confirmed covid-19 case, the district health office (dho) implements control and prevention measures and conducts a thorough epidemiological investigation to identify the source of infection or index case. to break the chain of transmission, confirmed covid-19 cases are isolated and treated in designated covid-19 hospitals, while contacts are traced and identified for mandatory covid-19 laboratory testing and a 14-day at-home quarantine. early detection of cases among close contacts is crucial for early containment to prevent further seeding of community transmission. in early march 2020, the number of cases in petaling increased due to a localized cluster of covid-19 infections in one corporation, with more than 90 cases confirmed within 3 weeks.11 the outbreak then increased exponentially, triggering a more rigorous control response from the petaling dho. as analysis of the covid-19 cases in petaling may provide critical information to help control the spread of similar infectious diseases at district and national levels, the objective of this paper is to describe the epidemiology of the covid-19 epidemic in petaling district between 1 february and 26 june 2020. methods study design this descriptive study is based on an exploratory analysis of all cases of covid-19 notified to the petaling dho from the beginning of the outbreak in early february 2020 to the end of june 2020. study setting this study was conducted in the petaling district, selangor, malaysia, a highly urbanized area with a dense population of over 2 million people. wpsar vol 12, no 2, 2021 | doi: 10.5365/wpsar.2020.11.4.001https://ojs.wpro.who.int/ 3 descriptive epidemiology of the first wave of covid-19 in petaling district, malaysiakrishna et al and covid-19 was added as a notifiable disease to this system at the end of march 2020 to ensure mandatory reporting of suspected and confirmed cases of covid-19 to the nearest dho. reporting is compulsory under the malaysia prevention and control of infectious disease act 1988.13 as all case records contain national identification numbers, all cases are recorded in the system without duplication. the inclusion criteria for this study were confirmed covid-19 cases according to the case definition notified to the petaling dho between 1 february 2020 and 26 june 2020. data analysis the socio-demographic and clinical characteristics of all confirmed cases of covid-19 were summarized with descriptive statistics. an epidemic curve of all cases was constructed by plotting the number of cases (yaxis) against the self-reported date of symptom onset (x-axis). for asymptomatic cases, the date of onset was considered to be the last date of known exposure. ethical approval the study protocol was approved by the medical research and ethics committee, moh malaysia (nmrr20–1540–55803 [iir]). results between 1 february 2020 and 26 june 2020, there were 437 confirmed cases of covid-19 in petaling district. the total population of petaling district in the 2010 census14 was 1 812 633. therefore, the incidence rate of covid-19 infection was 24/100 000 population. the baseline characteristics of the confirmed cases are presented in table 1. all 437 cases were admitted to the hospital for isolation and treatment. ten cases (2.3%) died due to complications, and the other 427 cases were eventually discharged. of all cases, 76.7% were local and 23.3% were imported. the mean age was 41 years, and 25.6% were in the 21–30 years age group. the gender distribution was relatively even, with 53.8% male and 46.2% female cases. malaysian citizens accounted for 92%, and 64.5% of cases were symptomatic. the most commonly observed symptoms were fever (43.8%), cough (31.6%) and sore throat (16.2%). the total number of close contacts of confirmed covid-19 cases was 7081. among 160 close contacts who were later confirmed positive, 51 (31.9%) were close contacts of asymptomatic primary cases, and 109 (68.1%) were close contacts of symptomatic primary cases. a total of 294 cases (67.3%) had no comorbidities, while 70 (16%) had hypertension and 46 (10.6%) had diabetes mellitus. of all cases, 62.5% had reported close contact with a confirmed covid-19 case, and 76.7% were classified as locally transmitted infections. in petaling, four main clusters of cases were identified: at a religious gathering (20.4%), in a corporation (15.1%), in health facilities (10.3%) and at a wholesale wet market (6.4%). other clusters included sporadic local and imported cases. fig. 1 shows the dates of symptom onset for cases of covid-19 in petaling district between january and june 2020. the first cluster of covid-19 was detected in a corporation in early february, which peaked in mid-february. a total of 66 cases were reported from this cluster. the highest peak of cases occurred in midmarch; the infection rate then tapered off and ended in mid-april. most cases during the peak were linked to a mass religious gathering (89 cases). the third peak, seen at the end of april, involved vendors at a wholesale wet market, with a total of 28 cases reported. the epidemic curve in fig. 1 shows a pattern indicating person-to-person transmission. discussion we report the epidemiological characterization of the initial covid-19 outbreak in the most densely populated district of the state of selangor, malaysia. most of the reported cases were aged 21–30 years (25.6%), and the distribution of cases by gender was similar. the age distribution of the cases in this study is consistent with that in the initial outbreak reported in china, i.e. mainly young adults.15 about 65% of the cases were symptomatic, the three most commonly reported symptoms being fever, cough and sore throat. the pathogenesis of sars-cov-2 includes both upper and lower respiratory tract infections,16 and the earliest outbreak in the epicentre, wuhan, also included symptoms of respiratory tract infection in most reported cases.17 respiratory viruses are highly contagious when patients are symptomatic. in the outbreak reported here, more than half the wpsar vol 12, no 2, 2021 | doi: 10.5365/wpsar.2020.11.4.001 https://ojs.wpro.who.int/4 krishna et aldescriptive epidemiology of the first wave of covid-19 in petaling district, malaysia cases were locally transmitted and had reported close contact with a confirmed covid-19 case. covid-19 is transmitted primarily in respiratory droplets7 and by physical contact.18 evidence of human-to-human transmission among close contacts has been found since the beginning of the pandemic, in mid-december 2019.19 furthermore, the clusters of covid-19 cases in petaling district involved gatherings, further spreading the virus in the community.20 in this outbreak, about 32% of cases had an epidemiological link to an asymptomatic case. as similar viral loads have been reported in symptomatic and asymptomatic cases,17 community transmission of sars-cov-2 by asymptomatic cases is likely. the salivary glands could act as a potential reservoir for covid-19; thus, infectious salivary droplets could be transmitted to a susceptible host from the mouth when an asymptomatic carrier is speaking, sneezing or even breathing, or from the eyes, and directly inhaled into the lungs.21 similar evidence of transmission from asymptomatic carriers to close contacts has been reported.22,23 in view of the novelty of sars-cov-2, accumulation of evidence on transmission from asymptomatic people has contributed to understanding the dynamics and public health implications of the disease. in our study, almost one third of close contacts who became infected were contacts of asymptomatic cases. as asymptomatic individuals appear to be a common source of infection, strict monitoring of close contacts of asymptomatic cases is essential to contain potential outbreaks. the fundamental characteristics of first-wave cases and the associated epidemic curves in petaling table 1. baseline characteristics of covid-19 cases in petaling district n % total number of cases 437 attack rate 0.024 age (years, mean, sd) 41, 17.7 age group 0–10 15 3.4 11–20 28 6.4 21–30 112 25.6 31–40 77 17.6 41–50 59 13.5 51–60 77 17.6 >60 69 15.8 gender male 235 53.8 female 202 46.2 nationality malaysian 402 92.0 non-malaysian 35 8.0 symptom status symptomatic 282 64.5 asymptomatic 155 35.5 symptoms (n = 282) fever 187 43.8 cough 137 31.6 sore throat 71 16.2 headache 22 5.0 loss of taste and smell 21 4.8 myalgia 18 4.1 gastrointestinal disturbances 12 2.7 comorbidities or risk factors none 294 67.3 hypertension 70 16.0 diabetes mellitus 46 10.6 dyslipidaemia 22 5.0 heart disease 16 3.7 bronchial asthma 10 2.3 history of close contact with a confirmed covid-19 case yes 273 62.5 no 164 37.5 total number of close contacts symptomatic index cases 4568 64.5 asymptomatic index cases 2513 35.5 confirmed covid-19 cases among close contacts symptomatic index cases 109 68.1 asymptomatic index cases 51 31.9 type of infection local 335 76.7 imported 102 23.3 n % clusters religious gathering 89 20.4 corporation 66 15.1 health facilities 45 10.3 wholesale wet market 28 6.4 others 209 47.8 local council area subdivision petaling jaya 178 40.7 subang jaya 100 22.9 shah alam 157 36.0 others 2 0.5 status alive 427 97.7 dead 10 2.3 wpsar vol 12, no 2, 2021 | doi: 10.5365/wpsar.2020.11.4.001https://ojs.wpro.who.int/ 5 descriptive epidemiology of the first wave of covid-19 in petaling district, malaysiakrishna et al district indicate that 282 (64.5%) cases were symptomatic, with appropriate dates of onset of illness. the epidemic curve of all clusters in petaling district between january and june 2020 (fig. 1) indicates that the outbreak had a propagated source pattern of spread. this trend is consistent with person-to-person spread in outbreaks of this newly introduced zoonotic viral pathogen that subsequently became capable of human-to-human transmission due to high mutation and recombination rates.24 as shown in the epidemic curve, the outbreak in petaling district had multiple surges of cases, resulting from several main clusters, including a corporation, a religious gathering, health facilities, a wholesale wet market and sporadic cases. the index case in the corporation cluster was believed to have been infected while travelling in indonesia before the onset of symptoms. subsequently, while symptomatic, the index case attended a meeting at the office, and transmission occurred to other workers. the religious gathering was attended by more than 19 000 people from various countries. it not only became a catalyst for subsequent spread of covid-19 in petaling district but also resulted in massive transmission throughout malaysia and abroad.25 the gathering involved sharing of communal spaces, such as prayer halls, collective eating from shared plates and sharing of sleeping areas, which increased the opportunities for transmission among participants. transmission of covid-19 in these two main reported clusters in petaling district went beyond household contacts, and contact tracing revealed up to five generations of contacts. the epidemic curve shows that cluster transmission accounted for more than half of the confirmed covid-19 cases in this outbreak; a similar phenomenon has been seen in other cities.18 early implementation of the mco in response to the covid-19 pandemic played a vital role in controlling the outbreak and preventing disease transmission within the community. closure of all universities, schools, places of worship and non-essential sectors during the mco helped to break the chain of transmission in the community by prohibiting mass movement and gatherings nationwide. this federal response was successful in lowering the epidemic curve in petaling district. the enhanced or targeted mco, a cordon sanitaire implemented on 10 may 2020 by the federal government, slowed the covid-19 outbreak in petaling district during the wholesale wet market cluster. overall, this study provides valuable information on the first wave of the covid-19 outbreak in petaling district and the general epidemiological measures taken to curb the outbreak. additionally, this study included a large number of cases, as petaling is part of the state of selangor, which had the second-largest number of confirmed covid-19 cases in malaysia during this pefig. 1. covid-19 epidemic curve, with all clusters in petaling district between january and june 2020 wpsar vol 12, no 2, 2021 | doi: 10.5365/wpsar.2020.11.4.001 https://ojs.wpro.who.int/6 krishna et aldescriptive epidemiology of the first wave of covid-19 in petaling district, malaysia funding the authors received no financial support for the research, authorship or publication of this article. references 1. novel coronavirus (2019-ncov): situation report, 1. geneva: world health organization; 2020. available from: https://apps.who.int/ iris/handle/10665/330760, accessed 9 february 2021. 2. coronavirus disease (covid-19): situation report, 209. geneva: world health organization; 2020. available from: https:// apps.who.int/iris/handle/10665/333897, accessed 9 february 2021. 3. elengoe a. covid-19 outbreak in malaysia. osong public health res perspect. 2020;11(3):93–100. doi:10.24171/j. phrp.2020.11.3.08 pmid:32494567 4. shah aum, safri sna, thevadas r, noordin nk, rahman aa, sekawi z, et al. covid-19 outbreak in malaysia: actions taken by the malaysian government. int j infect dis. 2020;97:108–16. doi:10.1016/j.ijid.2020.05.093 pmid: 32497808 5. aziz na, othman j, lugova h, suleiman a. malaysia’s approach in handling covid-19 onslaught: report on the movement control order (mco) and targeted screening to reduce community infection rate and impact on public health and economy. j infect public health. 2020;13(12):1823–9. doi:10.1016/j.jiph.2020.08.007 pmid:32896496 6. prime minister’s office. restriction of movement order (pmo official website; 2020). 7. rothan ha, byrareddy sn. the epidemiology and pathogenesis of coronavirus disease (covid-19) outbreak. j autoimmun. 2020;109(2):102433. doi:10.1016/j.jaut.2020.102433 pmid: 32113704 8. huang c, wang y, li x, ren l, zhao j, hu y, et al. clinical features of patients infected with 2019 novel coronavirus in wuhan, china. lancet. 2020;395(10223):497–506. doi:10.1016/s01406736(20)30183-5 pmid:31986264 9. coronavirus disease 2019 (covid-19): situation report, 73. geneva: world health organization; 2020. available from: https:// apps.who.int/iris/bitstream/handle/10665/331686/ncovsitrep02apr2020-eng.pdf?sequence=1&isallowed=y, accessed 9 february 2021. 10. day m. covid-19: four fifths of cases are asymptomatic, china figures indicate. bmj. 2020;369(april):m1375. doi:10.1136/bmj. m1375 pmid:32241884 11. lodz na, lin cz, hasani wsr, ahmad na, ahmad fh, rifin hm, et al. covid-19 outbreak related to the first workplace cluster in malaysia. zenodo;2020 aug 27. available from: https://zenodo.org/record/4019952#.yci12qczzpy, accessed 29 january 2021. 12. enotifikasi user guide. kuala lumpur: kementerian kesihatan malaysia; 2014;(2):1–11. available from: http://enotifikasi.moh.gov. my/dms/documentation/manual_sistem.pdf. 13. prevention and control of infectious diseases act. 1988. p.u. (a) 374/2006. kuala lumpur: government of malaysia; 1988. available from: https://www.moh.gov.my/index.php/database_stores/ attach_download/317/19, accessed 9 february 2021. riod of the pandemic. nevertheless, the study had some limitations, such as lack of data on the severity and clinical outcomes of cases. furthermore, the data were retrospective and self-reported by patients and may be inaccurate due to recall bias. conclusion this study provides key findings in the petaling covid-19 outbreak that are consistent with those reported in other studies. most cases had a history of close contact with confirmed covid-19 cases, confirming human-to-human transmission. the study also confirms that asymptomatic cases can transmit the disease to others. this should be emphasized to the community to ensure continuous wearing of face masks, hand hygiene and social distancing in public. public health efforts should focus on surveillance for local transmission of cases and swift control measures to avert widespread community transmission. active case detection and quarantine of close contacts of confirmed cases is a key prevention and control strategy to prevent spread of the disease, while strict monitoring of close contacts of asymptomatic infected cases is just as important as for symptomatic cases. further research should be conducted to better understand the transmission of sars-cov-2 from asymptomatic cases. acknowledgements we acknowledge the director-general of health of malaysia’s ministry of health, datuk dr noor hisham abdullah, for his permission to publish this paper. we express our gratitude to the petaling district health office for sharing valuable knowledge and advice for the writing of this paper. our appreciation also goes to the staff of the petaling district health office for their help and cooperation in providing general feedback to improve the paper. conflicts of interest the authors declare that they have no conflict of interest in this publication. wpsar vol 12, no 2, 2021 | doi: 10.5365/wpsar.2020.11.4.001https://ojs.wpro.who.int/ 7 descriptive epidemiology of the first wave of covid-19 in petaling district, malaysiakrishna et al 14. population distribution and basic demographic characteristics 2010. kuala lumpur: department of statistics; 2011:1– 133. 15. the epidemiological characteristics of an outbreak of 2019 novel coronavirus diseases (covid-19) in china. ccdc wkly; vol 2; 2020. 16. chen j. pathogenicity and transmissibility of 2019-ncov. a quick overview and comparison with other emerging viruses. microbes infect. 2020;22(2):69–71. doi:10.1016/j.micinf.2020.01.004 pmid:32032682 17. lai cc, shih tp, ko wc, tang hj, hsueh pr. severe acute respiratory syndrome coronavirus 2 (sars-cov-2) and coronavirus disease-2019 (covid-19): the epidemic and the challenges. int j antimicrob agents. 2020;55(3):105924. doi:10.1016/j.ijantimicag.2020.105924 pmid:32081636 18. han y, yang h. the transmission and diagnosis of 2019 novel coronavirus infection disease (covid-19): a chinese perspective. j med virol. 2020;92(6):639–44. doi:10.1002/jmv.25749 pmid:32141619 19. li q, guan x, wu p, wang x, zhou l, tong y, et al. early transmission dynamics in wuhan, china, of novel coronavirus-infected pneumonia. n engl j med. 2020;382(13):1199–207. doi:10.1056/ nejmoa2001316 pmid:31995857 20. rocklöv j, sjödin h. high population densities catalyse the spread of covid-19. j travel med. 2020;27(3):1–2. doi:10.1093/jtm/ taaa038 pmid:32227186 21. baghizadeh fini m. oral saliva and covid-19. oral oncol. 2020;108:104821. doi:10.1016/j.oraloncology.2020.104821 pmid:32474389 22. hu z, song c, xu c, jin g, chen y, xu x, et al. clinical characteristics of 24 asymptomatic infections with covid-19 screened among close contacts in nanjing, china. sci china life sci. 2020;63(5):706–11. doi:10.1007/s11427-020-1661-4 pmid:32146694 23. mizumoto k, kagaya k, zarebski a, chowell g. estimating the asymptomatic proportion of coronavirus disease 2019 (covid-19) cases on board the diamond princess cruise ship, yokohama, japan, 2020. euro surveill. 2020;25(10):1–5. doi:10.2807/15607917.es.2020.25.10.2000180 pmid:32183930 24. wang c, horby pw, hayden fg, gao gf. a novel coronavirus outbreak of global health concern. lancet. 2020;395(10223):470–3. doi:10.1016/s0140-6736(20)30185-9 pmid:31986257 25. che mat nf, edinur ha, abdul razab mka, safuan s, abdul a, safuan s. a single mass gathering resulted in massive transmission of covid-19 infections in malaysia with further international spread. j travel med. 2020;27(3):1–4. doi:10.1093/jtm/ taaa059 pmid:32307549 https://ojs.wpro.who.int/ 1wpsar vol 12, no 4, 2021 | doi: 10.5365/wpsar.2021.12.4.857 covid-19: original research c oronavirus disease 2019 (covid-19) is a respiratory disease caused by infection with severe acute respiratory syndrome coronavirus 2 (sars-cov-2). the covid-19 pandemic, first reported in wuhan, china in december 2019,1 spread quickly worldwide. as of mid-october 2021, there have been over 240 million confirmed cases and 4.9 million deaths.2 the first case of covid-19 in viet nam was recorded on 22 january 2020 in a person who had returned from wuhan, and that case was linked to a further 15 cases related to wuhan.3 by the end of february, all 16 cases had recovered and viet nam remained clear of covid-19 for the following 20 days. by early march, the world saw a major shift in the distribution of covid-19 cases from china to europe and the united states of america, while china’s incidence decreased.4 this sparked a second wave of imported covid-19 cases in viet nam, of non-chinese origin, starting on 6 march a department of epidemiology, national institute of hygiene and epidemiology, hanoi, viet nam. b national centre for epidemiology and population health, research school of population health, college of health and medicine, australian national university, canberra, australia. c school of preventive medicine and public health, hanoi medical university, hanoi, viet nam. d general department of preventive medicine, ministry of health, hanoi, viet nam. e national agency for science and technology information, ministry of science and technology, viet nam. f national institute of hygiene and epidemiology, hanoi, viet nam. g national hospital of tropical diseases, hanoi, viet nam. h the kirby institute, university of new south wales, sydney, nsw, australia. * these authors contributed equally. # these authors contributed equally. published: 13 december 2021 doi: 10.5365/wpsar.2021.12.4.857 objective: asymptomatic infection with severe acute respiratory syndrome coronavirus 2 (sars-cov-2) and test re-positivity after a negative test have raised concerns about the ability to effectively control the coronavirus disease 2019 (covid-19) pandemic. we aimed to investigate the prevalence of covid-19 asymptomatic and pre-symptomatic infections during the second wave of covid-19 in viet nam, and to better understand the duration of sars-cov-2 infection and the dynamics between the evolution of clinical symptoms and sars-cov-2 test positivity among confirmed covid-19 cases. methods: we conducted a cohort analysis on the first 50 confirmed cases during the second covid-19 wave in viet nam using clinical, laboratory and epidemiological data collected from 9 march to 30 april 2020. kaplan-meier estimates were used to assess time to clearance of sars-cov-2 infection, and log-rank tests were used to explore factors related to time to sars-cov-2 infection clearance. results: most cases (58%) had no typical signs or symptoms of covid-19 at the time of diagnosis. ten cases (20%) were re-positive for sars-cov-2 during infection. eight cases (16%) experienced covid-19 symptoms after testing negative for sars-cov-2. the median duration from symptom onset until clearance of infection was 14 days (range: 6–31); it was longer in re-positive and older patients and those with pre-existing conditions. conclusion: asymptomatic and pre-symptomatic infections were common during the second wave of covid-19 in viet nam. re-positivity was frequent during hospitalization and led to a long duration of sars-cov-2 infection. re-positive testing, clinical evolution and clearance of infection: results from covid-19 cases in isolation in viet nam ngoc-anh hoang,a,b* thai quang pham,a,c* ha-linh quach,a,b khanh cong nguyen,a samantha colquhoun,b stephen lambert,b duong huy luong,a quang dai tran,d dinh cong phung,e tran nhu duong,f nghia duy ngu,a tu anh tran,a hue bich thi nguyen,g duc-anh dangf,# and florian vogtb,h,# correspondence to ha-linh quach and thai quang pham (email: linh.quach@anu.edu.au and pqt@nihe.org.vn) wpsar vol 12, no 4, 2021 | doi: 10.5365/wpsar.2021.12.4.857 https://ojs.wpro.who.int/2 hoang et alre-positive testing, clinical evolution and clearance of sars-cov-2 infection in viet nam national institute of hygiene and epidemiology and the medical services administration. data included in this analysis were obtained from the national institute of hygiene and epidemiology. case classification and definitions this study used case definitions from guidelines developed by the viet nam ministry of health.12 case confirmation required a positive polymerase chain reaction (pcr) test for sars-cov-2. a symptomatic covid-19 case was defined as a confirmed case showing any covid-19 compatible symptom according to ministry of health guidelines, including cough, fever, muscle soreness, shortness of breath, sore throat, headache, nausea and fatigue with symptom onset within 14 days before the first positive pcr test result.12 an asymptomatic case was a confirmed case without covid-19 compatible symptoms throughout the incubation and infection period. this period was counted from 14 days before the first sars-cov-2 positive test result until the first negative pcr test, in a series of three negative pcr tests, with at least 24 hours between each test. a pre-symptomatic case was defined as a confirmed case without covid-19 compatible symptoms at the time of the first positive pcr test but who then developed symptoms during the course of infection. a re-positive case was defined as a patient who had tested positive, then negative and then returned to positive. a close contact was defined as a person with direct contact (≤2 metres distance) with a confirmed case.13 in viet nam, if the confirmed case had a flight travel history within 14 days from the date of symptom onset or date of confirmation, whichever came first, all passengers on those flights were categorized as close contacts and were tested for sars-cov-2 infection. as per ministry of health guidelines, case severity was categorized as mild, severe or critical.13 a mild case was a patient with covid-19 symptoms who was conscious and did not require oxygen support. a severe case was a symptomatic patient who was conscious but required oxygen support. a critical case was an unconscious patient either being treated with mechanical ventilation or receiving extracorporeal membrane oxygenation. patients who had a chronic medical condition (e.g. cardiovascular disease, cancer, chronic respiratory diseases or diabetes) were defined as having pre-existing conditions at the time of infection. 2020 when an international passenger arriving from the united kingdom of great britain and northern ireland tested positive.5 case investigations conducted during the second wave suggested the occurrence of cases without compatible signs or symptoms of covid-19 at the time of the first positive test, raising concerns about the community spread of covid-19 in viet nam. some cases remained asymptomatic until discharge, whereas others developed symptom onset after testing positive (pre-symptomatic infections). also seen at that time was reversion of test results in patients who had tested negative following a positive result, and then returned to positive (repositivity). as in other settings, pre-symptomatic and fully asymptomatic infections were also recorded but not systematically investigated.6,7 important evidence gaps remain for asymptomatic and pre-symptomatic cases, and for patients with repositive test results.8,9 in particular, the duration until clearance of infection and the dynamics between clinical symptoms and test positivity are poorly understood.10,11 the testing and quarantine policy during the initial phase of the second wave of infections in viet nam provided us with a setting to investigate these questions. using clinical, laboratory and epidemiological data of arriving air travel passengers to viet nam and their secondary cases during march and april 2020, we aimed to investigate the prevalence of asymptomatic and pre-symptomatic covid-19 infections and to better understand the duration of sars-cov-2 infection and the dynamics between the evolution of clinical symptoms and sars-cov-2 test positivity. methods design a cohort analysis was conducted on the first 50 laboratory-confirmed cases during the second covid-19 wave in viet nam using clinical, laboratory and epidemiological data collected as a part of the national epidemic response between 9 march and 30 april 2020. data sources in viet nam, all hospitals reported clinical and treatment information and test results for covid-19 cases to the wpsar vol 12, no 4, 2021 | doi: 10.5365/wpsar.2021.12.4.857https://ojs.wpro.who.int/ 3 re-positive testing, clinical evolution and clearance of sars-cov-2 infection in viet namhoang et al describe the number of cases of each type (asymptomatic, pre-symptomatic and symptomatic), demographics and clinical symptoms in the study’s time range. pearson’s chi-squared and fisher’s exact test were applied to compare demographic and clinical characteristics between re-positive and non-re-positive cases, and between cases with a negative test presenting with covid-19 symptoms versus those without covid-19 symptoms. the kaplanmeier estimator was used to assess time to clearance of sars-cov-2 infection; that is, the time between the date of symptom onset and the date of the first of three consecutive negative sars-cov-2 tests. asymptomatic cases were excluded from this analysis. log-rank tests were applied to explore the relationship between time to sars-cov-2 infection clearance and patients’ age, sex, pre-existing conditions, inconsistent pcr results and clinical severity. results among the first 50 covid-19 cases in the second wave in viet nam, the proportions of pre-symptomatic, symptomatic and asymptomatic cases were 38%, 42% and 20%, respectively. male (54%) and female (46%) representation was approximately equal. vietnamese nationals accounted for 64% of cases. the prevalence of people under 30 years old in pre-symptomatic, symptomatic and asymptomatic groups was 15.8%, 57.2% and 50%, respectively. most of the asymptomatic and symptomatic cases were less likely than the pre-symptomatic cases to have a pre-existing condition (table 1). two thirds of cases (n = 34, 68%) were international arrivals, with the remaining cases identified locally (n = 16, 32%). among international passengers, 23% (n = 8) were detected through airport screening, 56% (n = 19) were detected through case-finding activities among flight passengers and 21% (n = 7) were detected during self-presentation at health facilities. all 16 local cases were close contacts of international passengers and were detected by case-finding activities (supplementary fig. 1). supplementary table 2 illustrates symptoms at onset and total numbers of symptoms during infection (combining symptoms at onset and during treatment or isolation) for the 40 pre-symptomatic and symptomatic cases. the most common symptom at onset was cough (70%), followed by fever (25%) and sputum production among confirmed cases, the status of being free from sars-cov-2 infection began on the date of the first of three consecutive negative sars-cov-2 tests before discharge. we used a sampling interval of 1 day between each test. case finding and management cases were identified through pcr testing at the time of arrival in viet nam, during self-presentation at health facilities because of health concerns (due to travel history to regions recording confirmed cases) or through active case-finding measures among passengers and their contacts. all passengers on incoming flights from covid-19 affected areas were tested for sars-cov-2 upon arrival and entered a mandated 14-day quarantine, irrespective of test results or symptoms. (the evolving test and quarantine policies for passengers arriving from affected areas into viet nam are included in supplementary table 1.) during this period, passengers could leave the airport without testing or quarantine if they did not depart from defined designated areas, and passengers were only contacted when any co-passengers were confirmed to be positive for sars-cov-2. any person who presented to health facilities with symptoms compatible with covid-19 and who reported a travel history to covid-19 affected areas within the past 14 days was directly transferred to a reference hospital for sars-cov-2 testing and quarantine. once sars-cov-2 infection was confirmed, an in-depth epidemiological investigation and contact tracing were conducted. all identified close contacts of confirmed cases were advised to self-quarantine immediately at their residence until contacted by local health authorities. they were then tested for sars-cov-2 by pcr and were placed into compulsory quarantine at a designated site for 14 days, irrespective of the test result. all quarantined individuals were tested at the start of their quarantine (day 0) and then systematically on days 3–5 and day 14. an additional test was undertaken if an individual developed symptoms. anyone who tested positive or became symptomatic was transferred to a reference hospital for isolation and treatment. statistical analysis data were cleaned using microsoft excel and exported to the statistical software package r version 3.6.3 for analysis.14 frequencies and percentages were used to wpsar vol 12, no 4, 2021 | doi: 10.5365/wpsar.2021.12.4.857 https://ojs.wpro.who.int/4 hoang et alre-positive testing, clinical evolution and clearance of sars-cov-2 infection in viet nam eight cases (16%) still experienced covid-19 symptoms after testing negative for sars-cov-2, among which four (50%) were symptomatic and four (50%) were pre-symptomatic at the time of testing. the demographic and clinical characteristics of the 10 (20%) re-positive covid-19 cases and eight (16%) cases who had covid-19 symptoms after testing negative for sars-cov-2 are shown in table 2. there was no significant difference in age, sex, nationality, pre-existing conditions and symptoms at onset between re-positive and non-re-positive cases. this was also observed among symptomatic cases who had a negative test versus cases without symptoms. most re-positive cases and cases with covid-19 symptoms after testing negative were categorized as severe or critical, and experienced more than two symptoms during infection. the overall median duration from onset of symptoms to clearance of sars-cov-2 infection was 14 days (range: 6–31). twenty days after symptom onset, 75% (30 cases) were free from sars-cov-2 infection (supplementary fig. 2). (15%). most cases experienced multiple symptoms, with 70% having more than one symptom and 15% having six or more symptoms. fig. 1 presents the clinical evolution and pcr results of sars-cov-2 testing during treatment or isolation in symptomatic, pre-symptomatic and asymptomatic cases. among 40 (80%) patients who experienced symptoms during infection, eight (20%) were clinically classified as severe and four (10%) as critical. three of the four critical cases had pre-existing conditions, namely, vestibular disorder, type 2 diabetes and hypertension. ten cases (20%) returned a positive sars-cov-2 result after returning one or more negative result (repositivity). the number of re-positive cases who were pre-symptomatic, symptomatic and asymptomatic was four, five and one, respectively. most re-positive cases (90%) had one loop of reversion (i.e. one positive test after a negative test, then negative test results until being free from sars-cov-2). only one re-positive case (case 19, who was pre-symptomatic at the time of testing) had more than one loop of reversion. table 1. characteristics of covid-19 cases by symptomatic category (n = 50) total pre-symptomatic symptomatic asymptomatic n = 50 % n = 19 % n = 21 % n = 10 % age, mean (sd) 40.6 (19.2) 48.6 (18.2) 35.1 (16.7) 36.7 (22.5) <20 4 8 2 10.5 1 4.8 1 10 20–29 16 32 1 5.3 11 52.4 4 40 30–39 8 16 2 10.5 4 19 2 20 40–49 3 6 3 15.8 0 0 0 0 50–59 8 16 5 26.3 2 9.5 1 10 60–69 7 14 5 26.3 2 9.5 0 0 70+ 4 8 1 5.3 1 4.8 2 20 sex male 27 54 12 63.2 11 52.4 4 40 female 23 46 7 36.8 10 47.6 6 60 nationality vietnamese 32 64 10 52.6 15 71.4 7 70 other 18 36 9 47.4 6 28.6 3 30 pre-existing condition yes 12 24 6 31.6 4 19 2 20 no 38 76 13 68.4 17 81 8 80 sd: standard deviation. wpsar vol 12, no 4, 2021 | doi: 10.5365/wpsar.2021.12.4.857https://ojs.wpro.who.int/ 5 re-positive testing, clinical evolution and clearance of sars-cov-2 infection in viet namhoang et al fig. 1. the evolution of clinical symptoms and results of sars-cov-2 pcr tests during treatment of symptomatic, pre-symptomatic and asymptomatic cases in viet nam cases are aligned by date of symptom onset for symptomatic and pre-symptomatic cases and date of first positive test for asymptomatic cases. a “free from infection” is defined as the date of the first of three consecutive negative sars-cov-2 tests before discharge, with a sampling interval of at least 1 day between each test. note: in the “disorders” column, “”: having at least one pre-existing condition and “”: free from pre-existing conditions. id disorders -11 -10 -9 -8 -7 -6 -5 -4 -3 -2 -1 day 0 1 2 3 4 5 6 7 8 9 10 11 12 13 14 15 16 17 18 19 20 21 22 23 24 25 26 27 28 29 30 31 32 33 34 c01 ª ¢ª è c02 ª ¢ª ª è c03 ª ¢ª è no symptoms c04 ª ª ¢ ª ª è mild c05 ª ¢ ª ª è severe c06 ª ¢ª ª ª è critical c07 ª ª ¢ ª è ª postive test result c08 ª ¢ª ª è r negative test result c09 ª ¢ ª ª è ¢ symptom onset c10 ª ¢ ª ª è è free from infection* c11 ª ¢ ª ª ª è c12 ª ¢ ª ª ª è c13 ª ª ª ª ¢ ª r ª ª è c14 ª ª ¢ ª ª ª ª ª è c15 ª ª ¢ª r r r ª ª ª ª è c16 ª ¢ª ª ª ª ª ª ª ª r ª è c17 ª ª ¢ ª ª ª ª ª ª è c18 ª ¢ ª ª ª ª è c19 ª ¢ª ª ª ª ª ª ª r r r ª ª ª ª r r ª day 0 1 2 3 4 5 6 7 8 9 10 11 12 13 14 15 16 17 18 19 20 21 22 23 24 25 26 27 28 29 30 31 32 33 34 c20 ¢ ª ª ª è c21 ¢ª ª ª ª è c22 ¢ª ª ª è c23 ¢ª ª ª ª è c24 ¢ª ª ª ª è c25 ¢ ª ª ª ª è c26 ¢ ª ª ª ª è c27 ¢ ª ª ª ª è c28 ¢ ª ª ª ª ª è c29 ¢ª ª ª ª ª è c30 ¢ ª ª ª è c31 ¢ ª ª è c32 ¢ ª ª ª è c33 ¢ª ª r r ª è c34 ¢ ª ª ª è c35 ¢ ª ª ª ª è c36 ¢ ª ª ª ª ª ª ª è c37 ¢ ª ª ª r r ª è c38 ¢ ª r ª ª ª è c39 ¢ ª ª ª ª ª ª r ª è c40 ¢ª ª ª ª ª ª ª r r r ª ª è id disorders day 0 1 2 3 4 5 6 7 8 9 10 11 12 13 14 15 16 17 18 19 20 21 22 23 24 25 26 27 28 29 30 31 32 33 34 c41 ª è c42 ª ª è ª postive test result c43 ª ª è r negative test result c44 ª è è free from infection* c45 ª ª ª ª ª è c46 ª ª ª ª è c47 ª ª ª è c48 ª ª ª è c49 ª ª ª è c50 ª ª ª ª r r ª ª è sesac cita mot p mys a sesac cita mot p my s sesac cita mot p mys-er p id disorders -11 -10 -9 -8 -7 -6 -5 -4 -3 -2 -1 day 0 1 2 3 4 5 6 7 8 9 10 11 12 13 14 15 16 17 18 19 20 21 22 23 24 25 26 27 28 29 30 31 32 33 34 c01 ª ¢ª è c02 ª ¢ª ª è c03 ª ¢ª è no symptoms c04 ª ª ¢ ª ª è mild c05 ª ¢ ª ª è severe c06 ª ¢ª ª ª è critical c07 ª ª ¢ ª è ª postive test result c08 ª ¢ª ª è r negative test result c09 ª ¢ ª ª è ¢ symptom onset c10 ª ¢ ª ª è è free from infection* c11 ª ¢ ª ª ª è c12 ª ¢ ª ª ª è c13 ª ª ª ª ¢ ª r ª ª è c14 ª ª ¢ ª ª ª ª ª è c15 ª ª ¢ª r r r ª ª ª ª è c16 ª ¢ª ª ª ª ª ª ª ª r ª è c17 ª ª ¢ ª ª ª ª ª ª è c18 ª ¢ ª ª ª ª è c19 ª ¢ª ª ª ª ª ª ª r r r ª ª ª ª r r ª day 0 1 2 3 4 5 6 7 8 9 10 11 12 13 14 15 16 17 18 19 20 21 22 23 24 25 26 27 28 29 30 31 32 33 34 c20 ¢ ª ª ª è c21 ¢ª ª ª ª è c22 ¢ª ª ª è c23 ¢ª ª ª ª è c24 ¢ª ª ª ª è c25 ¢ ª ª ª ª è c26 ¢ ª ª ª ª è c27 ¢ ª ª ª ª è c28 ¢ ª ª ª ª ª è c29 ¢ª ª ª ª ª è c30 ¢ ª ª ª è c31 ¢ ª ª è c32 ¢ ª ª ª è c33 ¢ª ª r r ª è c34 ¢ ª ª ª è c35 ¢ ª ª ª ª è c36 ¢ ª ª ª ª ª ª ª è c37 ¢ ª ª ª r r ª è c38 ¢ ª r ª ª ª è c39 ¢ ª ª ª ª ª ª r ª è c40 ¢ª ª ª ª ª ª ª r r r ª ª è id disorders day 0 1 2 3 4 5 6 7 8 9 10 11 12 13 14 15 16 17 18 19 20 21 22 23 24 25 26 27 28 29 30 31 32 33 34 c41 ª è c42 ª ª è ª postive test result c43 ª ª è r negative test result c44 ª è è free from infection* c45 ª ª ª ª ª è c46 ª ª ª ª è c47 ª ª ª è c48 ª ª ª è c49 ª ª ª è c50 ª ª ª ª r r ª ª è sesac cita mot p mys a sesac cita mot p my s sesac cita mot p mys-er p discussion this study examined the clinical and laboratory findings of the first 50 sars-cov-2 confirmed cases at the start of the second covid-19 wave in viet nam. there was a high prevalence of cases without compatible signs or symptoms of covid-19 at the time of the first positive test (i.e. asymptomatic infections and pre-symptomatic infections). we found that 20% of cases tested positive following a negative result, and 16% of patients still experienced covid-19 symptoms after testing negative for sars-cov-2. the median duration until clearance of sars-cov-2 infection was 14 days, with the duration being longer in older people, those with pre-existing conditions and re-positive cases. the median duration until clearance of sars-cov-2 infection was 12 days (95% confidence interval [ci]: 11–20) for males and 14 days (95% ci: 13–22) for females (p = 0.44), and was higher in older people (14 days among all those aged 30 years and older, 10 days in those aged 30–44 years, 12.5 days in those aged 45–59 years, 20 days in those aged 60 years or more; p < 0.001) (fig. 2). the duration until sars-cov-2 clearance for re-positive cases was nearly double the duration for those without test conversion (22 days vs 13 days, p = 0.00034). critical cases had a longer time to freedom from infection (26.5 days) than did mild cases (13 days) and severe cases (14 days) (p = 0.015) (fig. 3). wpsar vol 12, no 4, 2021 | doi: 10.5365/wpsar.2021.12.4.857 https://ojs.wpro.who.int/6 hoang et alre-positive testing, clinical evolution and clearance of sars-cov-2 infection in viet nam table 2. characteristics of covid-19 cases with a re-positive pcr test and symptomatic cases with a negative pcr test (n = 50) characteristics re-positive test p negative test with covid-19 symptoms pno n (%) yes n (%) no n (%) yes n (%) demographics age <45 26 (65) 3 (30) 0.10 28 (66.7) 1 (12.5) 0.01 45–64 8 (20) 5 (50) 8 (19) 5 (62.5) 65+ 6 (15) 2 (20) 6 (14.3) 2 (25) sex male 23 (57) 4 (40) 0.32 24 (57.1) 3 (37.5) 0.31 female 17 (43) 6 (60) 18 (42.9) 5 (62.5) nationality vietnamese 25 (63) 7 (70) 0.66 27 (64.3) 5 (62.5) 0.92 other 15 (38) 3 (30) 15 (35.7) 3 (37.5) pre-existing condition yes 7 (18.5) 5 (50) 0.03 9 (21.4) 3 (37.5) 0.33 no 33 (82.5) 5 (50) 33 (78.6) 5 (62.5) disease characteristics symptoms at onset cough 23 (57.5) 5 (50) -23 (54.8) 5 (62.5) -fever 7 (17.5) 3 (30) 7 (16.7) 3 (37.5) headache 4 (10) 0 (0) 4 (9.5) 0 (0) fatigue 4 (10) 0 (0) 4 (9.5) 0 (0) sputum production 3 (7.5) 2 (20) 3 (7.1) 2 (25) sore throat 2 (5) 2 (20) 3 (7.1) 1 (12.5) chill 0 (0) 1 (10) 0 (0) 1 (12.5) nasal congestion 0 (0) 1 (10) 1 (2.4) 0 (0) diarrhoea 0 (0) 1 (10) 0 (0) 1 (12.5) number of symptoms during infection 1–2 24 (60) 6 (60) 1 26 (61.9) 4 (50) 0.53 >2 16 (40) 4 (40) 16 (38.1) 4 (50) patient category pre-symptomatic 15 (38) 4 (40) 0.66 15 (35.7) 4 (50) 0.3 symptomatic 16 (40) 5 (50) 17 (40.5) 4 (50) asymptomatic 9 (23) 1(10) 10 (23.8) 0 (0) severity asymptomatic 9 (23) 1 (10) 0.009 10 (23.8) 0 (0) <0.001 mild 28 (70) 4 (40) 29 (69) 3 (37.5) severe 2 (5) 2 (20) 2 (4.8) 2 (25) critical 1 (3) 3 (30) 1 (2.4) 3 (37.5) groups were compared using pearson’s chi-squared or fisher’s exact test. wpsar vol 12, no 4, 2021 | doi: 10.5365/wpsar.2021.12.4.857https://ojs.wpro.who.int/ 7 re-positive testing, clinical evolution and clearance of sars-cov-2 infection in viet namhoang et al fig. 2. cumulative probability by sex, age and pre-existing condition of clearance of sars-cov-2 infection from the day of first positive laboratory test among 40 pre-symptomatic and symptomatic cases survival probabilities were estimated using the kaplan-meier estimator and interpreted as the probability of clearance of sars-cov-2 infection (the probability of having the first of three consecutive negative sars-cov-2 tests). p values were calculated using log-rank tests. p = 0.0009 pre-existing condition p = 0.44 p = 0.22 wpsar vol 12, no 4, 2021 | doi: 10.5365/wpsar.2021.12.4.857 https://ojs.wpro.who.int/8 hoang et alre-positive testing, clinical evolution and clearance of sars-cov-2 infection in viet nam cov-2 transmission appears to vary among asymptomatic cases. a study in china showed that transmissibility from asymptomatic cases is comparable to that of symptomatic cases.18 a study in singapore suggested that people with asymptomatic covid-19 might be less infectious than symptomatic cases.19 meanwhile, the world health the findings showed that 58% of cases did not exhibit compatible signs or symptoms of covid-19 at the time of the first positive test, although fewer than half remained asymptomatic. this finding aligns with current published evidence of the expression of asymptomatic, symptomatic and pre-symptomatic cases.15–17 the degree of sarsfig. 3. survival analysis by re-positivity and severity of 40 pre-symptomatic and symptomatic cases p = 0.00034 p = 0.015 positive retest after an earlier negative result disease severity survival probabilities were estimated using the kaplan-meier estimator and interpreted as the probability of clearance of sars-cov-2 infection (the probability of having the first of three consecutive negative sars-cov-2 tests). p values were calculated using log-rank tests. wpsar vol 12, no 4, 2021 | doi: 10.5365/wpsar.2021.12.4.857https://ojs.wpro.who.int/ 9 re-positive testing, clinical evolution and clearance of sars-cov-2 infection in viet namhoang et al when determining criteria for discharge and ending isolation, health authorities should consider multiple factors such as symptom resolution, time elapsed since the onset of symptoms, disease severity, immune system response and evidence of viral rna clearance from the upper respiratory tract.32 viral shedding is used as a marker of infectivity when detected via an upper respiratory tract pcr sample a few days before symptom onset.33 viral shedding persists for varying periods of time, with a median duration of 11 days.22 in our study, the median duration was 14 days. the viral shedding period in our study was defined as the day of diagnosis to the day of the first of three negative tests, each 24 hours apart; this excludes shedding before diagnosis. although viral shedding has been identified during both the asymptomatic and symptomatic phases, its relation to transmissibility is unclear. because realtime pcr cannot distinguish between infective virus and inactive virus, a positive pcr result does not necessarily represent the potential for viral transmission. the amount of viral rna detected does not necessarily indicate greater infectivity.33 older age and having pre-existing conditions have been reported as important independent predictors of worse outcomes in severe acute respiratory syndrome and middle east respiratory syndrome.34 our results also confirmed that increased age and pre-existing conditions were associated with longer sars-cov-2 infection in covid-19 patients, which is consistent with other findings.35 further in-depth studies are encouraged to explore additional factors related to the duration of sars-cov-2 infection. we acknowledge that there were several limitations to this study. first, the relatively small number of cases and specific context might limit the generalizability of our study findings. second, we acknowledge the lack of cycle threshold (ct) values (the number of cycles necessary to detect the virus by pcr). ct is a semi-quantitative value that categorizes the concentration of viral genetic material in a testing sample following pcr testing. this value indicates how much viral genetic material is in the sample: a low ct indicates a high concentration of viral genetic material, which is typically associated with a high risk of infectivity and vice versa. knowing this value might have helped us to understand re-positivity tests and to compare symptomatic, pre-symptomatic and asymptomatic organization declared that asymptomatic cases are much less likely to transmit the virus than those who develop symptoms.20 however, there is still a lack of comprehensive studies with representative samples on sars-cov-2 transmission during the asymptomatic period. in our study, 20% of confirmed covid-19 cases returned a positive sars-cov-2 result after one or more negative test result. findings from china indicated that the prevalence of a positive test following a negative test was about 17% after discharge.21,22 most current evidence about re-positivity focuses on the recovery or post-discharge phase. however, re-positivity during hospitalization might contribute to the need for ongoing admission and repeat testing, and cause distress for both patients and health care staff, which has not been the focus of published studies to date. in this study, all critical cases returned to positivity during sars-cov-2 infection. re-positive cases had a substantially longer duration until viral clearance, which aligned with current evidence.21 although re-positive tests for sars-cov-2 in recovered covid-19 patients are common, there is insufficient evidence about the underlying mechanism leading to a re-positive test.23 most reported re-positive results could not be explained as simple viral relapse or secondary infection.24 some potential reasons included virology (biological characteristics of the virus),25 specimen issues (sample collection, processing, virus at the limit of detection)26–28 or patient condition (underlying conditions, degree of infection, treatment methods).29 a study in post-symptomatic individuals showed that persistent positivity is associated with elevated cellular immune responses, and thus the viral rna may represent replicating virus.30 however, transmission to close contacts was not observed. other evidence suggested that re-positive cases are not infectious after an initial negative test, indicating that persistent pcr-positive individuals are not infectious at the post-symptomatic stage of infection.11,31 however, further work is needed to understand the likelihood of transmission from these patients. our findings showed that several cases still experienced covid-19 compatible symptoms after testing negative for the virus or even after meeting sars-cov-2 clearance criteria. defining and measuring covid-19 transmissibility should be more sophisticated than only checking for a negative test. it has been suggested that wpsar vol 12, no 4, 2021 | doi: 10.5365/wpsar.2021.12.4.857 https://ojs.wpro.who.int/10 hoang et alre-positive testing, clinical evolution and clearance of sars-cov-2 infection in viet nam funding this work was conducted as part of the master of applied epidemiology programme at the australian national university. authors n-a.h. and h-l.q. were trainees of the programme and received funding from the aseanaustralia health security fellowship by the commonwealth department of foreign affairs and trade. references 1. zhu n, zhang d, wang w, li x, yang b, song j, et al. a novel coronavirus from patients with pneumonia in china, 2019. n engl j med. 2020;382(8):727–33. doi:10.1056/nejmoa2001017 pmid:31978945 2. coronavirus cases. dover, dl: worldometers.info; 2021. available from: https://www.worldometers.info/coronavirus/, accessed 14 october 2021. 3. van cuong l, giang htn, linh lk, shah j, van sy l, hung th, et al. the first vietnamese case of covid-19 acquired from china. lancet infect dis. 2020;20(4):408–9. doi:10.1016/s14733099(20)30111-0 pmid:32085849 4. quach hl, hoang na. covid-19 in vietnam: a lesson of prepreparation. j clin virol. 2020;127:104379. doi:10.1016/j. jcv.2020.104379 pmid:32361325 5. the fight against covid-19: everything is still under control (in vietnamese). hanoi: ministry of health portal; 2020. available from: https://moh.gov.vn/tin-tong-hop/-/asset_publisher/k206q9qkzoqn/ content/cuoc-chien-chong-covid-19-moi-chuyen-van-trong-tamkiem-soat, accessed 14 october 2021. 6. long qx, tang xj, shi ql, li q, deng hj, yuan j, et al. clinical and immunological assessment of asymptomatic sars-cov-2 infections. nat med. 2020;26(8):1200–4. doi:10.1038/s41591-0200965-6 pmid:32555424 7. arons mm, hatfield km, reddy sc, kimball a, james a, jacobs jr, et al. presymptomatic sars-cov-2 infections and transmission in a skilled nursing facility. n engl j med. 2020;382(22):2081–90. doi:10.1056/nejmoa2008457 pmid:32329971 8. enhanced screening to reduce the spread of covid-19. ho chi minh city and hanoi: us embassy & consulate in vietnam; 2020. available from: https://vn.usembassy. g o v /e n h a n c e d s c r e e n i n g t o r e d u c e t h e s p r e a d o f c o v id-19 -2 / ?_ ga=2.20458 4023.617558 323.16341654 40 64551874.1634165440, accessed 14 october 2021. 9. day m. covid-19: four fifths of cases are asymptomatic, china figures indicate. bmj. 2020;369:m1375. doi:10.1136/bmj.m1375 pmid:32241884 10. qiao xm, xu xf, zi h, liu gx, li bh, du x, et al. re-positive cases of nucleic acid tests in discharged patients with covid-19: a followup study. front med. 2020;7:349. doi:10.3389/fmed.2020.00349 pmid:32656223 11. lan l, xu d, ye g, xia c, wang s, li y, et al. positive rt-pcr test results in patients recovered from covid-19. jama. 2020;323(15):1502– 3. doi:10.1001/jama.2020.2783 pmid:32105304 cases over time. although ct is important, this single value depends on several factors, including the quantity of specific gene targets and reagent variability, and other factors that do not reflect a person’s infectivity in the absence of clinical context.36 large-scale, multicentre studies that include ct values are required to explore the importance of this issue. conclusion a high proportion of asymptomatic and pre-symptomatic infections were evident in the first 50 confirmed cases during the second wave of covid-19 in viet nam. in this study, re-positive cases were common during hospitalization and had a long duration of sars-cov-2 infection. high-quality longitudinal studies to explore the transmissibility of re-positive and asymptomatic covid-19 patients are needed. acknowledgements we acknowledge the important contributions and guidelines from the viet nam national steering committee for covid-19 prevention and control, the ministry of health, the ministry of science and technology and the national institute of hygiene and epidemiology. we thank the health care workers from designated hospitals for covid-19 treatment in viet nam for their great work in covid-19 case management and treatment. we also thank the community health care workers in provincial centres of disease control for their excellent contributions to surveillance, contact tracing and disease control and prevention measures. conflicts of interest the authors declare no conflicts of interest. ethics statement the conduct of this analysis was approved by the national institute of hygiene and epidemiology and was exempted by the institute’s institutional review board as part of routine outbreak investigation and response activities. wpsar vol 12, no 4, 2021 | doi: 10.5365/wpsar.2021.12.4.857https://ojs.wpro.who.int/ 11 re-positive testing, clinical evolution and clearance of sars-cov-2 infection in viet namhoang et al 24. xiao at, tong yx, zhang s. false-negative of rt-pcr and prolonged nucleic acid conversion in covid-19: rather than recurrence. j med virol. 2020;92(10):1755–6. doi:10.1002/jmv.25855 pmid:32270882 25. an j, liao x, xiao t, qian s, yuan j, ye h, et al. clinical characteristics of recovered covid-19 patients with re-detectable positive rna test. ann transl med. 2020;8(17):1084. doi:10.21037/atm20-5602 pmid:33145303 26. pan y, long l, zhang d, yuan t, cui s, yang p, et al. potential falsenegative nucleic acid testing results for severe acute respiratory syndrome coronavirus 2 from thermal inactivation of samples with low viral loads. clin chem. 2020;66(6):794–801. doi:10.1093/ clinchem/hvaa091 pmid:32246822 27. xie x, zhong z, zhao w, zheng c, wang f, liu j. chest ct for typical coronavirus disease 2019 (covid-19) pneumonia: relationship to negative rt-pcr testing. radiology. 2020;296(2):e41–5. doi:10.1148/radiol.2020200343 pmid:32049601 28. zou l, ruan f, huang m, liang l, huang h, hong z, et al. sarscov-2 viral load in upper respiratory specimens of infected patients. n engl j med. 2020;382(12):1177–9. doi:10.1056/nejmc2001737 pmid:32074444 29. liu w, tao zw, wang l, yuan ml, liu k, zhou l, et al. analysis of factors associated with disease outcomes in hospitalized patients with 2019 novel coronavirus disease. chin med j (engl). 2020;133(9):1032–8. doi:10.1097/cm9.0000000000000775 pmid:32118640 30. vibholm lk, nielsen ssf, pahus mh, frattari gs, olesen r, andersen r, et al. sars-cov-2 persistence is associated with antigenspecific cd8 t-cell responses. ebiomedicine. 2021;64:103230. doi:10.1016/j.ebiom.2021.103230 pmid:33530000 31. kang yj. south korea’s covid-19 infection status: from the perspective of re-positive test results after viral clearance evidenced by negative test results. disaster med public health prep. 2020:14(6);762– 4. doi:10.1017/dmp.2020.168 pmid:32438941 32. guidance for discharge and ending of isolation of people with covid-19. solna: european centre for disease prevention and control; 2020. available from: https://www.ecdc.europa.eu/en/publicationsdata/guidance-discharge-and-ending-isolation-people-covid-19, accessed 14 october 2021. 33. widders a, broom a, broom j. sars-cov-2: the viral shedding vs infectivity dilemma. infect dis health. 2020;25(3):210–5. doi:10.1016/j.idh.2020.05.002 pmid:32473952 34. peeri nc, shrestha n, rahman ms, zaki r, tan z, bibi s, et al. the sars, mers and novel coronavirus (covid-19) epidemics, the newest and biggest global health threats: what lessons have we learned? int j epidemiol. 2020;49(3):717–26. doi:10.1093/ije/ dyaa033 pmid:32086938 35. zhou f, yu t, du r, fan g, liu y, liu z, et al. clinical course and risk factors for mortality of adult inpatients with covid-19 in wuhan, china: a retrospective cohort study. lancet. 2020;395:1054–62. doi:10.1016/s0140-6736(20)30566-3 pmid:32171076 36. henderson dk, weber dj, babcock h, hayden mk, malani a, wright sb, et al. the perplexing problem of persistently pcr-positive personnel. infect control hosp epidemiol. 2021;42(2):203–4. doi:10.1017/ice.2020.343 pmid:32772942 12. decision no. 963/qd-byt interim guidance on management of covid-19 (in vietnamese). hanoi: ministry of health; 2020. available from: https://thuvienphapluat.vn/van-ban/the-thao-y-te/ decision-963-qd-byt-2020-interim-guidance-for-preventionand-control-of-covid-19-438489.aspx, accessed 14 october 2021. 13. decision no. 1344/qđ-byt: guidelines for the diagnosis and treatment of acute respiratory infections caused by sars-cov-2 (covid-19) 3rd edition (in vietnamese). hanoi: ministry of health; 2020. available from: https://kcb.vn/huong-dan-chan-doan-vadieu-tri-viem-duong-ho-hap-cap-do-sar-cov-2-covid-19-phien-banlan-thu-3.html, accessed 14 october 2021. 14. r core team. r: a language and environment for statistical computing. vienna: r foundation for statistical computing; 2017. available from: https://www.r-project.org/, accessed 14 october 2021. 15. wu z, mcgoogan jm. asymptomatic and pre-symptomatic covid-19 in china. infect dis poverty. 2020;9(1):72. doi:10.1186/ s40249-020-00679-2 pmid:32564770 16. kimball a, hatfield km, arons m, james a, taylor j, spicer k, et al. asymptomatic and presymptomatic sars-cov-2 infections in residents of a long-term care skilled nursing facility — king county, washington, march 2020. mmwr morb mortal wkly rep. 2020;69(13):377–81. doi:10.15585/mmwr.mm6913 pmid:32240128 17. tabata s, imai k, kawano s, ikeda m, kodama t, miyoshi k, et al. clinical characteristics of covid-19 in 104 people with sarscov-2 infection on the diamond princess cruise ship: a retrospective analysis. lancet infect dis. 2020;20(9):1043–50. doi:10.1016/ s1473-3099(20)30482.5 pmid:32539988 18. yi c, aihong w, bo y, keqin d, haibo w, jianmei w, et al. [epidemiological characteristics of infection in covid-19 close contacts in ningbo city] (in chinese). zhonghua liu xing bing xue za zhi. 2020;41:667–71. doi:10.3760/ cma.j.cn112338-20200304-00251 pmid:32447904 19. sayampanathan aa, heng cs, pin ph, pang j, leong ty, lee vj. infectivity of asymptomatic versus symptomatic covid-19. lancet. 2021;397(10269):93–4. doi:10.1016/s0140-6736(20)32651-9 pmid:33347812 20. transmission of covid-19 by asymptomatic cases. cairo: world health organization regional office for the eastern mediterranean; 2020. available from: http://www.emro.who.int/health-topics/corona-virus/transmission-of-covid-19-by-asymptomatic-cases.html, accessed 14 october 2021. 21. zhu h, fu l, jin y, shao j, zhang s, zheng n, et al. clinical features of covid-19 convalescent patients with re-positive nucleic acid detection. j clin lab anal. 2020;34(7):e23392. doi:10.1002/ jcla.23392 pmid:32506726 22. hu x, xing y, jia j, ni w, liang j, zhao d, et al. factors associated with negative conversion of viral rna in patients hospitalized with covid-19. sci total environ. 2020;728:138812. doi:10.1016/j.scitotenv.2020.138812 pmid:32335406 23. dao tl, hoang vt, gautret p. recurrence of sars-cov-2 viral rna in recovered covid-19 patients: a narrative review. eur j clin microbiol infect dis. 2021;40(1):13–25. doi:10.1007/s10096-02004088-z pmid:33113040 three cases of neonatal tetanus in papua new guinea lead to development of national action plan for maternal and neonatal tetanus elimination case series siddharta sankar datta,a roland barnabas,b adeline sitther,c laura guarenti,a steven toikilik,d grace kariwigae and gerard pai suid a world health organization papua new guinea, port moresby, papua new guinea. b department of paediatrics port moresby general hospital, port moresby, papua new guinea. c rumginae rural hospital-kiunga, papua new guinea. d national department of health, port moresby, papua new guinea. e united nations international children’s fund-papua new guinea, port moresby, papua new guinea. correspondence to siddhartha sankar datta (e-mail: dattas@wpro.who.int or drsiddharthasdatta@gmail.com). to cite this article: datta ss et al. three cases of neonatal tetanus in papua new guinea lead to development of national action plan for maternal and neonatal tetanus elimination. western pacific surveillance and response journal, 2013, 4(2):40–43. doi:10.5365/wpsar.2013.4.1.008 abstract maternal or neonatal tetanus causes deaths primarily in asia and africa and is usually the result of poor hygiene during delivery. in 2011, three neonatal tetanus cases were investigated in papua new guinea, and all three cases were delivered at home by untrained assistants. the babies were normal at birth but subsequently developed spasms. a neonatal tetanus case must be viewed as a sentinel event indicating a failure of public health services including immunization, antenatal care and delivery care. the confirmation of these cases led to the drafting of the papua new guinea national action plan for maternal and neonatal tetanus elimination. this included three rounds of a tetanus toxoid supplementary immunization campaign targeting women of childbearing age (wbca) and strengthening of other clean delivery practices. the first immunization round was conducted in april and may 2012, targeting 1.6 million wbca and achieved coverage of 77%. the government of papua new guinea should ensure detailed investigation of all neonatal tetanus cases reported in the health information system and perform sub-provincial analysis of tetanus toxoid coverage following completion of all three immunization rounds. efforts also should be made to strengthen clean delivery practices to help eliminate maternal and neonatal tetanus in papua new guinea. introduction tetanus causes around 300 000 deaths worldwide each year predominantly in low-income and middle-income countries, and deaths from maternal or neonatal tetanus are concentrated mostly in asia and africa.1 neonatal tetanus (nnt) is primarily caused by lack of hygiene during delivery, and it usually occurs when the umbilical cord is contaminated while being cut or dressed with non-sterile instruments. symptoms, in the form of spasms, usually begin three days after birth. without any specific treatment, more than 95% of infants with nnt die; even with treatment 10%–90% die depending on the intensity of the supportive care.2 evidence suggests that infants surviving nnt suffer from brain damage, which often manifests as neurological abnormality and developmental impairment.3 cases of nnt are common in rural and disadvantaged settings where babies are born at home and die without registration of either event. thus, the true burden is always unknown.2 around 1500 suspected cases of nnt have been reported from papua new guinea to the world health organization (who) since 1992, an average of 75 per year.4 cases are reported to the national health information system based on clinical diagnosis only per the who-recommended standards for surveillance of selected vaccine-preventable diseases.5 these reported cases are not systematically investigated, impeding the ability of national and provincial managers in effective decision-making. in 2010, there were 50 suspected cases of nnt reported in papua new guinea through syndromic surveillance by health workers.4 in 2012, papua new guinea was classified as one of the 31 countries that had not yet achieved maternal and neonatal tetatus (mnt) elimination.6 in papua new guinea, vaccination for tetanus has been provided since 2008 as part of the combined diphtheria pertussis-tetanus-hepatitis b and haemophillus influenzae b (pentavalent) vaccine. however, accessibility to vaccination programmes is inequitable across papua new guinea; provinces such as western, eastern highlands and west sepik have health services that are not accessible to at least 40% of their population.7 also, the number of maternal health staff decreased by 25% from 1987 to 2000.7 in 2011, 61% of children less than one year of age in papua new guinea received three doses of pentavalent vaccine, and 51% of pregnant women received tetanus toxoid (tt) vaccine.8 according to who and the united nations international children’s fund, the proportion of births that could be considered protected against tetanus6 was around 61% in papua new guinea in 2011. both the tt and pentavalent vaccine coverage in papua new guinea varies widely between and within the provinces. we discuss three cases of nnt that were reported and subsequently investigated in 2011 and the development of national policy of mnt elimination in papua new guinea. the cases in 2011, two cases of nnt were reported from the paediatric unit of port moresby general hospital (pmgh) and one case of nnt was reported from rumginae rural hospital (rrh) in western province of papua new guinea. the two pmgh cases resided in goilala district, central province and the rumginae case in middle fly district, western province (figure 1). middle fly is characterized by forests, swamps, rivers and coast, and access is predominantly by dugout canoes, outboard powered dinghies and aircraft due to the vastly scattered villages being separated by large bodies of water.9 the average household size of middle fly district is 6.8; 89% of the population are reside in traditional dwellings, and 87% of the population are engaged in agriculture as the principal economic activity.10 the goilala district is a remote district characterized by very rugged topography with more than 70% comprised of deeply dissected valleys and mountains.11 there is no road access to the goilala district from provincial headquarters in port moresby, and the communities are usually serviced by light aircraft landing on treacherous mountain top airstrips.11 tt vaccine coverage for women of childbearing age (wcba) in goilala and middle fly districts were low at 9% and 12%, respectively, in 2011. figure 1. map of the location of neonatal tetanus cases, papua new guinea, 2011 click to download figure 1. jpg, 488kb all three cases (two males and a female) were delivered at home on the floor, and the births were attended by untrained assistants (table 1). the umbilical cord was cut in two of these cases with a bush knife, while in the other an old razor blade was used. the umbilical cords in these three cases were tied with strings from a rope, a rice bag and a grass skirt. all three babies were reportedly normal at birth and had normal crying and sucking for the first two days of life. all three babies started having difficulty in sucking after two days, and they developed symptoms of convulsions and spasms at an average of eight days after birth. the youngest of the multi-gravidae mothers was 16 and the eldest 29 years. only one of the mothers received any antenatal care or tt vaccination in her past pregnancies, while none of these mothers received any antenatal care or tt vaccination in the current pregnancy. the two cases that were admitted to pmgh survived, while the case at rrh died three days after admission to the hospital; there was no fatality among the mothers. follow-up of the cases discharged from pmgh was not possible due to the geo-topography of their residential location; hence, no comment can be made on the final clinical outcome in regards to neurological and developmental status of these cases after discharge. table 1. characteristics of mother and births for the three neonatal tetanus cases, papua new guinea, 2011 click to download table 1. jpg, 379kb the policy the confirmation and detailed investigation of these three cases by hospital physicians in 2011, along with the reported suspected cases of nnt by the health workers through the syndromic surveillance system, led to the drafting of the national action plan for elimination of maternal and neonatal tetanus in papua new guinea.12 the action plan targeted wcba (15–45 years) for three rounds of nationwide supplementary immunization activities with tt. this is in line with the who position paper on tetanus.13 a “high-risk approach” to control nnt in countries where the elimination target (< 1 case per 1000 live births at the district level) has not yet been reached. this high-risk approach should be targeted towards all wcba and immunization doses must be delivered using a campaign-style immunization programme of three doses of tt with an interval of at least four weeks between doses one and two and of at least six months between doses two and three. strengthening other measures to prevent mnt in the country, including clean delivery, training of midwives and community health workers ,and improvement in ante-natal care services, were also highlighted in the national elimination plan. the first immunization round targeted 1.6 million wbca and was conducted in april and may 2012. around 1.3 million (77%) women were reached with the tt vaccine during the first round.14 this supplementary immunization campaign was administered using multiple approaches at fixed site (maternal and child health clinics at health centres, school vaccination sessions, markets and congregation site sessions), day mobile and overnight patrol outreach sessions. the second immunization round was conducted in october through december 2012; final coverage results are pending. discussion these three nnt cases in papua new guinea must be viewed as sentinel events indicating a triple failure of public health in routine immunization, antenatal care and clean delivery/cord care services. unsafe cord practices were evident in all three cases. as reported in papua new guinea as early as 1991, unsafe birth practices, including cutting the cord with sharpened sea shells, fresh bamboo knifes, metal blades or knifes, were common practices.15 strengthening clean delivery practices is one component of the national action plan that aims to decrease the incidence of such unsafe practices. following the introduction of a programme promoting clean delivery practices and the replacement of cow dung for postnatal umbilical cord care with clean water or milk in kenya and tanzania, there was significant reduction in annual nnt incidence. after introduction of the programme in 1981, nnt rates fell sharply, and by 1988 annual death rates had dropped to 0.75 per 1000 births in the intervention areas compared with 82 per 1000 in control areas. these changes were both culturally acceptable and safer alternatives.16 although cases of nnt have been reported every year in the national health information system, it was the reporting and confirmation of the these three nnt cases by physicians at pmgh and rrh that led to the formulation of the national action plan for elimination of maternal and neonatal tetanus in papua new guinea. in order to achieve the elimination of mnt in papua new guinea, the other components of the national action plan need to be implemented, including the third and final immunization round, the strengthening of clean delivery practices and nnt surveillance. more detailed investigations of nnt cases reported in the health information system as well as sub-provincial analyses following completion of all three immunization rounds should be conducted. conflicts of interest none declared. funding none. references: roper mh, vandelaer jh, gasse fl. maternal and neonatal tetanus. lancet, 2007, 370:1947–1959. doi:10.1016/s0140-6736(07)61261-6 pmid:17854885 wassilak sgf et al. tetanus toxoid. in: plotkin sa, orenstein wa (eds). vaccines, 4th edition. philadelphia, wb saunders publishing, 2004, 745-781. okan m et al. long-term neurologic and psychomotor sequelae after neonatal tetanus. journal of child neurology, 1997, 12:270–272. doi:10.1177/088307389701200410 pmid:9203069 data on neonatal tetanus. reported incidence time series: who immunization surveillance, assessment and monitoring. geneva, world health organization, 2012. available from: http://www.who.int/immunization_monitoring/data/data_subject/ en/index.html [accessed 30 november 2012]. who-recommended standards for surveillance of selected vaccine-preventable diseases. geneva, world health organization, 2003. available from: http://whqlibdoc.who.int/hq/2003/who_v&b_03.01.pdf [accessed 30 november 2012]. the partnership, maternal and neonatal tetanus elimination. geneva, world health organization, 2012. available from: http://www.who.int/immunization_monitoring/ diseases/mnte_initiative/en/index1.html [accessed 30 november 2012]. ministerial taskforce report on maternal health in papua new guinea. waigani, national department of health, 2009. available from: http://www.unfpa.org/sowmy/ resources/docs/library/r149_doh_pnguinea_2009_ministerial_taskforce_report_ final_version_3.pdf [accessed on 30 november 2012]. national annual sector performance review. waigani, papua new guinea national health information system, 2012. learn about western province and papua new guinea, 2012. available from: http://www.otdfpng.org/learn [accessed on 30 november 2012]. papua new guinea 2000 census provincial report. waigani, national statistical office of papua new guinea, 2010. available from: http://www.spc.int/prism/ country/pg/stats/2000_census/census.htm [accessed 30 november 2012]. climate and weather goilala. available from: http://goilala.com/people-and-place/climate-weather [accessed 30 november 2012]. national plan of action for maternal and neonatal tetanus elimination, papua new guinea, 2012–2014. port moresby, national epidemiology unit, 2011. tetanus vaccine. weekly epidemiological record, 2006, 81:198–208. pmid:16710950 report on integrated measles supplementary activity 2012. waigani, epidemiology unit, public health division, national department of health. taylor p et al. mother care country assessment. papua new guinea, may 1991. meegan me et al. effect on neonatal tetanus mortality after a culturally-based health promotion programme. lancet, 2001, 358:640–641. doi:10.1016/s0140-6736(01)05787-7 pmid:11530155 https://ojs.wpro.who.int/ 1wpsar vol 13, no 2, 2022 | doi: 10.5365/wpsar.2022.13.2.904 outbreak investigation report p oliomyelitis is an acute viral infection of the nervous system caused by poliovirus types 1, 2 and 3. polio has been eliminated in most countries globally through vaccination. wild poliovirus type 2 was last seen in 1999 and was certified as eradicated in 2015. oral poliovirus vaccine (opv) remains the vaccine of choice for global polio eradication due to its ability to interrupt transmission of poliovirus by inducing mucosal immunity.1 however, in underimmunized populations, the weakened vaccine virus from opv may genetically mutate from the original attenuated strain and regain its neurovirulence, causing paralysis and outbreaks. among the three sabin strains in the opv, before 2016 type 2 was estimated to cause 40% of all vaccine-associated paralytic polio and 90% of all cases of circulating vaccine-derived poliovirus (cvdpv).2 in april 2016, the poliovirus type 2 sabin strain was removed from the trivalent opv during the global switch to bivalent opv to stop the emergence of vdpv from poliovirus type 2.3 the inactivated poliovirus vaccine (ipv) had been introduced, but it provided only limited a vaccine-preventable diseases and immunization, division of programmes for disease control, world health organization regional office for the western pacific, manila, philippines. b world health organization representative office for the philippines, manila, philippines. c research institute for tropical medicine, department of health, manila, philippines. d public health surveillance division, department of health, manila, philippines. published: 25 may 2022 doi: 10.5365/wpsar.2022.13.2.904 objective: in response to an outbreak of circulating vaccine-derived poliovirus (cvdpv) type 2 in the philippines in 2019–2020, several rounds of supplementary immunization activities using the monovalent type 2 oral poliovirus vaccine (opv) were conducted for the first time in the western pacific region. after use of the monovalent vaccine, the emergence of vaccine-derived poliovirus unrelated to the outbreak virus was detected in healthy children and environmental samples. this report describes the detection of this poliovirus in the philippines after use of the monovalent type 2 opv for outbreak response. methods: we describe the emergence of vaccine-derived poliovirus unrelated to the outbreak detected after supplementary immunization activities using the monovalent type 2 opv. this analysis included virus characterization, phylogenetic analyses and epidemiological investigations. results: three environmental samples and samples from six healthy children tested positive for the emergent vaccinederived poliovirus. all isolates differed from the sabin type 2 reference strain by 6–13 nucleotide changes, and all were detected in the national capital region and region 4, which had conducted supplementary immunization activities. discussion: since the 2016 removal of type 2 strains from the opv, vaccine-derived poliovirus outbreaks have occurred in communities that are immunologically naive to poliovirus type 2 and in areas with recent use of monovalent opv. to prevent the emergence and further spread of cvdpv type 2, several interventions could be implemented including optimizing outbreak responses by using the monovalent type 2 opv, accelerating the availability of the novel type 2 opv, strengthening routine immunization using inactivated polio vaccine and eventually replacing opv with inactivated poliovirus vaccine for routine immunization. emergence of vaccine-derived poliovirus type 2 after using monovalent type 2 oral poliovirus vaccine in an outbreak response, philippines sweetc b alipon,a yoshihiro takashima,a tigran avagyan,a varja grabovac,a syeda kanwal aslam,a benjamin bayutas,a josephine logronio,a xiaojun wang,b achyut shrestha,b sukadeo neupane,b maria concepcion roces,b lea necitas apostolc and nemia sucalditod correspondence to sweetc alipon (email: alipons@who.int) wpsar vol 13, no 2, 2022 | doi: 10.5365/wpsar.2022.13.2.904 https://ojs.wpro.who.int/2 alipon et alemergent vdpv2 after mopv2 use in the philippines from june 2019 to march 2021, a further 20 stool samples from 13 afp cases, two contacts of afp cases and five healthy children, plus 23 environmental samples tested positive for cvdpv2. geographically, this outbreak occurred in the luzon and mindanao groups of islands, with concentrated virus detection in barmm and ncr and other regions, including regions 3, 7, 10, 11 and 12. analyses revealed that these isolates were genetically linked to one another, and had between 61 and 71 nucleotide changes from the sabin type 2 reference strain. the last cvdpv2 isolate from a human came from a stool sample from a 1-year-old child from cabanatuan city, nueva ecija, who had onset of paralysis on 15 january 2020. the last cvdpv2 isolate detected in an environmental sample was collected on 16 january 2020 from the butuanon river in mandaue city, region 7. along with the cvdpv2 outbreak, vdpv2 was isolated in august 2019 from stool samples from an afp case with a primary immunodeficiency disorder residing in laguna, region 4a. genetic analysis showed 64–107 nucleotide changes for this isolate compared with the sabin type 2 reference strain, but it was not genetically linked with any other isolates from other sources in the country. the use of the monovalent type 2 opv for the cvdpv2 outbreak response in the philippines was approved on 24 september 2019. from october 2019 to december 2020, 15 sias were completed in outbreakaffected areas, utilizing more than 13 million doses of monovalent type 2 opv and achieving coverage of 79% to 102% (fig. 1). however, within 30–120 days of monovalent type 2 opv use, isolates of emergent vdpv2 were detected in several areas where the outbreak response had taken place, and these had between 6 and 13 nucleotide changes from the sabin type 2 reference strain, which suggests the emergence of a new strain. as there was no evidence of circulation, they were classified as ambiguous vdpv2. this report summarizes the emergence of vdpv2 following use of the monovalent type 2 opv to respond to the cvdpv2 outbreak in the philippines, and it contributes to the regional and global knowledge about and experience of the risks related to the use of monovalent type 2 opv and possible preventive and mitigation activities. mucosal immunity to stop the spread of poliovirus, and at the time of the switch, there was a severe shortage of the ipv so that large cohorts of newborns were left unvaccinated.4 as a result, the number of outbreaks from cvdpv type 2 (cvdpv2) has been increasing due to large gaps in population immunity to poliovirus type 2.5 the expanding global cohort of children without the immunity against poliovirus type 2 that would prevent transmission could result in established endemicity of vdpv.6 to combat the growing threat of cvdpv2, several interventions could be implemented including optimizing outbreak responses by using the monovalent type 2 opv, strengthening routine immunization by using ipv and accelerating the availability of the novel type 2 opv. however, use of the monovalent type 2 opv to control outbreaks of cvdpv2 carries the risk of seeding emergent strains of vdpv2 that have the potential for further circulation.7 this has been observed through molecular epidemiological analysis of cvdpv2 outbreaks that resulted from suboptimal coverage of supplementary immunization activities (sias) that used the monovalent type 2 opv within outbreak response zones or in contacts travelling outside of response zones.6,7 therefore, use of the monovalent type 2 opv in outbreak responses is governed by the strict criteria of the protocol of the global polio eradication initiative (gpei) and the decision to release the monovalent type 2 opv from global stocks, authorized by the director-general of the world health organization (who) based on the recommendations of the gpei’s eradication and outbreak management’s advisory group. on 19 september 2019, a polio outbreak was declared by the department of health in the philippines after confirmation of cvdpv2 in a child with acute flaccid paralysis (afp) that was reported from lanao del sur province in the bangsamoro autonomous region of muslim mindanao (barmm). the index child was a 3-year-old girl with no history of polio vaccination and onset of paralysis on 26 june 2019. poliovirus collected from stool in july 2019 had 65 nucleotide changes from the sabin type 2 reference strain and was genetically linked to isolates collected from july to august in environmental samples in manila, national capital region (ncr) and davao (mindanao), confirming widespread circulation of vdpv2 within the philippines. wpsar vol 13, no 2, 2022 | doi: 10.5365/wpsar.2022.13.2.904https://ojs.wpro.who.int/ 3 emergent vdpv2 after mopv2 use in the philippinesalipon et al fig. 1. timeline of supplementary immunization activities using the monovalent type 2 oral poliovirus vaccine and identification of ambiguous isolates of vaccine-derived poliovirus type 2, the philippines, 2019–2020 percentages in bold are coverage rates. afp: acute flaccid paralysis; avdpv2: ambiguous vaccine-derived poliovirus type 2; ncr: national capital region; nt: nucleotide changes; r: region; wrf: water reclamation facility. jan feb mar apr may jun jul aug sep oct decnovoct decnov 2019 2020 c20-036 oroquieta r10 6 nt es20-100 pasay wrf, ncr 10 nt s20-578* pasay, ncr c20-426 pasay, ncr 13 nt h20-217 pasay, ncr 13 nt es20-176 calamba, laguna r4a 6 nt c20-493 antipolo, rizal r4a 6 nt h20-406 antipolo, rizal r4a 6 nt round 0: 14–27 october 2019 (mindanao) 93% 4–8 november 2019 (mindanao) 95% round 1: 25 november–8 december 2019 (mindanao) 95% 27 january–9 february 2020 (ncr) 99% 20 july–16 august 2020 (regions 3 and 4a) 79% round 2: 20 january–2 february 2020 (mindanao) 99% 4 february–8 march 2020 (ncr) 102% 14 august–27 september 2020 (regions 3 and 4a) 85% es20-225 cainta, rizal r4a 6 nt environmental sample afp case* healthy child contact 3 1 3 3 m in da na o m in da na o m in da na o m in da na o + n cr n cr re gi on s 3 a nd 4 a h20-328 calamba, laguna r4a 11 nt * confirmed by positive contact c20-426 be determined. we analysed demographic, clinical and laboratory information recorded in the polio surveillance database and describe the emergent vdpv2 isolates in relation to the timeline of the sias that used the monovalent type 2 opv (fig. 1). this analysis included findings from virus characterization, phylogenetic analyses and epidemiological investigations. results from october 2019 to december 2020, three environmental samples and six healthy children tested positive for new vdpv2 unrelated to the outbreak virus. all isolates had between 6 and 13 nucleotide changes from the sabin type 2 reference strain, and all were detected in ncr and region 4, the regions that conducted sias using monovalent type 2 opv (fig. 2). the first emergent vdpv2 strain was detected in stool from a close contact of an afp case in misamis occidental province, region 10, in january 2020. this methods the polio surveillance system in the philippines follows the gpei protocol and includes afp surveillance conducted by the epidemiology and surveillance units of the department of health.8 this is supplemented by environmental surveillance conducted by the polio team at the research institute for tropical medicine, whereby environmental samples are collected from all 17 regions.9 at the research institute, all samples undergo testing for concentration of sewage, virus culture and intratypic differentiation for serotyping of polioviruses. every poliovirus type 2 isolate and discordant (non-sabin) poliovirus types 1 and 3 isolates are sent to the national institute of infectious diseases in japan for phylogenetic analyses using standardized who methods.10 samples are sequenced and phylogenetic trees are developed to determine the genetic linkage of the polioviruses and their relatedness to the sabin strain and to one another. using a global database of known cvdpvs, the genetic linkage of newly detected vdpvs to known vdpvs can wpsar vol 13, no 2, 2022 | doi: 10.5365/wpsar.2022.13.2.904 https://ojs.wpro.who.int/4 alipon et alemergent vdpv2 after mopv2 use in the philippines fig. 2. spot map of ambiguous vaccine-derived poliovirus type 2, the philippines, 2019–2020 afp: acute flaccid paralysis; avdpv2: ambiguous vaccine-derived poliovirus type 2; mopv2: monovalent type 2 oral poliovirus vaccine; ncr: national capital region; nt: nucleotide changes; wrf: water reclamation facility. s20-578 (pasay city) onset: 17 july 2020 age: 6 years sex: male vdpv2 (confirmed by positive contact c20426 [vdpv2]) c20-426 (pasay city) (contact of s20-578) date collected: 25 august 2020 vdpv2 (13 nt changes) c20-036 (oroquieta city, misamis occidental) date collected: 9 january 2020 vdpv2 (6 nt changes) h20-217 (pasay city) date collected: 22 september 2020 vdpv2 (13 nt changes) c20-493 (antipolo city) date collected: 12 october 2020 vdpv2 (6 nt changes) h20-328 (calamba city) date collected: 30 october 2020 vdpv2 (11 nt changes) h20-406 (antipolo city) date collected: 22 november 2020 vdpv2 (6 nt changes) es20-100 (pasay wrf) date collected: 29 june 2020 vdpv2 (10 nt changes) es20-176 (ligasong creek) date collected: 22 september 2020 vdpv2 (6 nt changes) es20-225 (cainta river) date collected: 20 october 2020 vdpv2 (6 nt changes) environmental sample afp case healthy child contact 3 1 3 3 mopv2 rounds in mindanao mopv2 rounds in ncr, region 3 and part of region 4a table 1. isolates of emergent vaccine-derived poliovirus type 2 collected from children in the philippines, 2019–2020 case no. (case identifier) age, sex city, region no. of opv or ipv doses received date of stool collection result no. of nucleotide changes from the sabin type 2 reference strain 1 (c20-036) 3 years, female oroquieta city, misamis occidental 5 9 january 2020 avdpv2 6 2 (s20-578) 6 years, male pasay city, national capital region 3 1: 12 august 2020 2: 13 august 2020 both negative close contact (c20-426) was positive 3 (c20-426) 1 year, male pasay city, national capital region 5 25 august 2020 avdpv2 13 4 (h20-217) 7 months, male pasay city, national capital region 1 22 september 2020 avdpv2 13 5 (c20-493) 2 years, male antipolo city, rizal 4 12 october 2020 avdpv2 6 6 (h20-328) 2 years, male calamba city, laguna 3 30 october 2020 avdpv2 11 7 (h20-406) 1 year, male antipolo city, rizal 2 22 november 2020 avdpv2 6, 7 avdpv2: ambiguous vaccine-derived poliovirus type 2; ipv: inactivated poliovirus vaccine; opv: oral poliovirus vaccine. wpsar vol 13, no 2, 2022 | doi: 10.5365/wpsar.2022.13.2.904https://ojs.wpro.who.int/ 5 emergent vdpv2 after mopv2 use in the philippinesalipon et al 7-month-old boy was identified who also tested positive for vdpv2 and whose sample had 13 nucleotide changes from the sabin type 2 reference strain. this child had received one dose of the monovalent type 2 opv during the sia in march. similarly, emergent vdpv2 isolates with six nucleotide changes from the sabin type 2 reference strain were detected in environmental samples in calamba, laguna, in region 4 in september 2020, within 30 days of the sia using the monovalent type 2 opv in laguna province. heightened afp surveillance was conducted in the city, which led to the detection of emergent vdpv2 in the stool sample of a healthy 2-year-old child. this child had received two doses of the monovalent type 2 opv during the sias in laguna in august and september 2020, and a stool sample was positive for vdpv2, and had 11 nucleotide changes from the sabin type 2 reference strain, within 45 days after the last dose of the monovalent type 2 opv. in antipolo, rizal, a close contact of an afp case tested positive for vdpv2 in november 2020. the close contact was a 2-year-old boy who had received two doses of the monovalent type 2 opv during the sias in august and september 2020 in rizal province, region 4. the isolated poliovirus had six nucleotide changes from the sabin type 2 reference strain. this case triggered a household survey of healthy children in the affected barangay and other high-risk baranwas within 60 days of the first sia delivering monovalent type 2 opv in mindanao in 2019. the case was a 3-year-old girl who received her first dose of the monovalent type 2 opv during the sia in november 2019. genetic analysis of the isolate showed six nucleotide changes from the sabin type 2 reference strain and revealed no genetic link to other cvdpv2 isolates. the second emergent vdpv2 isolate was detected in an environmental sample from pasay city, ncr, in june 2020. this was within 120 days of the sias using the monovalent type 2 opv in ncr. the virus had 10 nucleotide changes from the sabin type 2 reference strain and was not genetically linked to other known vdpv2 isolates. following this detection, further investigations were conducted, including searching for afp cases, conducting a household survey and collecting stool samples from healthy children in high-risk barangays (the smallest administrative unit in the philippines) in the catchment area of the environmental surveillance site in pasay city. these case-finding efforts identified a 6-year-old boy with paralysis whose stool samples were negative for poliovirus due to inadequate samples; however, the stool sample collected from his close contact, a 1-year-old boy, tested positive for vdpv2 and had 13 nucleotide changes from the sabin type 2 reference strain. the close contact had received two doses of the monovalent type 2 opv during the sias in january and february 2020. in the high-risk barangays neighbouring the barangay with the afp case, stool samples were collected from healthy children, and a avdpv2: ambiguous vaccine-derived poliovirus type 2. table 2. isolates of emergent vaccine-derived poliovirus type 2 collected in environmental samples, the philippines, 2020 sample no. (sample identifier) site round no. and date of supplementary immunization activity using monovalent type 2 oral poliovirus vaccine in area date of collection result no. of nucleotide changes from the sabin type 2 reference strain 1 (es20-100) pasay water reclamation facility pasay city, national capital region 1: 27 january–8 february 2020 2: 24 february–7 march 2020 29 june 2020 avdpv2 10 2 (es20-176) ligasong creek calamba city, laguna 1: 3–30 august 2020 2: 14–27 september 2020 22 september 2020 avdpv2 6 3 (es20-225) cainta river cainta, rizal 1: 24 august–6 september 2020 2: 14 september–1 october 2020 20 october 2020 avdpv2 6 wpsar vol 13, no 2, 2022 | doi: 10.5365/wpsar.2022.13.2.904 https://ojs.wpro.who.int/6 alipon et alemergent vdpv2 after mopv2 use in the philippines this cycle of polio associated with vdpv is likely to continue when a cvdpv2 outbreak response uses the monovalent type 2 opv to interrupt transmission. the detection of emergent vdpv2 in the philippines should serve as a warning not only for the philippines but also for other countries with suboptimal coverage of routine polio immunization. the risk of future cvdpv2 outbreaks appears to be a closer reality, given the scenario of fading type 2 immunity in opv-using countries coupled with recent use of the monovalent type 2 opv. in fact, the risk of a cvdpv outbreak is inevitable while there remain subpopulations with chronically low coverage of polio immunization and the use of any type of opv continues in routine and supplementary polio immunization activities. live opvs remain the workhorses of polio eradication programmes due to their ability to interrupt transmission. since the removal of type 2 poliovirus from the opv in 2016, the majority of cvdpv2 outbreaks reported globally have been detected in areas that recently used the monovalent type 2 opv or in areas that border those where the monovalent type 2 opv was used, reflecting the risk of vdpv2 emergence after the sabin type 2 vaccine strain was used in the period after the vaccine changed.6 to prevent the emergence and further spread of cvdpv2, several interventions could be implemented, including optimizing responses to outbreaks by using the monovalent type 2 opv, strengthening routine immunization using ipv, accelerating the availability of the novel type 2 opv and eventually replacing opv with ipv for routine immunization after carefully considering epidemiological and programmatic aspects. this report summarizes the findings of the investigation into the emergence of a vdpv2 outbreak in the philippines that occurred after the monovalent type 2 opv was used during 2019–2020, and it adds to the growing global evidence of vdpv2 emergence in the period after the vaccine changed. acknowledgements we would like to thank the staff members of the national, regional and city epidemiology and surveillance units who contributed to the investigation of this outbreak, the polio laboratory staff at the research institute for gays. a healthy 1-year-old child who had not received any doses of the monovalent type 2 opv during an sia tested positive for vdpv2, and the isolate had six nucleotide changes. lastly, in a neighbouring municipality in cainta, rizal province, emergent vdpv2 was detected in an environmental sample from the cainta river in october 2020, within 60 days after the sia using the monovalent type 2 opv; the environmental isolate had six nucleotide changes. a summary of the isolates is given in tables 1 and 2. discussion in response to the cvdpv2 outbreak in the philippines that comprised 20 cvdpv2 cases and contacts, 15 sias were conducted between october 2019 and december 2020 using the monovalent type 2 opv. more than 13 million doses of the monovalent type 2 opv were utilized. however, within 60–120 days of some of these sias, the emergent vdpv2 isolates were detected in the areas targeted by the outbreak response. these isolates were identified in the close contact of a child with paralysis, six healthy children and three environmental samples. all isolates had between 6 and 13 nucleotide changes from the sabin type 2 reference strain and no genetic linkage to previously detected vdpvs in the philippines. outbreaks of cvdpv are caused when the live, attenuated virus used in vaccines regains its neurovirulence, particularly in settings with chronically low coverage of routine and supplementary polio immunization or in immunodeficient individuals.11 the risk of further cvdpv will persist while any of the three sabin strains are used for vaccination, either in the bivalent opv or the monovalent type 2 opv. of the three types of vdpvs, the risk of cvdpv2 outbreaks is highest because more than 3 years have passed since cessation of the use of the sabin 2 vaccine strain, which has led to a decrease in mucosal immunity against type 2 poliovirus. any vdpv2 emergence has the potential to cause outbreaks in populations that are immunologically naive to poliovirus type 2. a similar situation was observed in central and western africa in 2019, where vdpv2 cases primarily affected type 2-naive children born after the switch from trivalent opv to bivalent opv.7 wpsar vol 13, no 2, 2022 | doi: 10.5365/wpsar.2022.13.2.904https://ojs.wpro.who.int/ 7 emergent vdpv2 after mopv2 use in the philippinesalipon et al 4. chumakov k, ehrenfeld e, agol vi, wimmer e. polio eradication at the crossroads. lancet glob health. 2021;9(8):e1172–5. doi:10.1016/s2214.109x(21)00205-9 pmid:34118192 5. global circulating vaccine-derived poliovirus (cvdpv). geneva: global polio eradication initiative, world health organization; 2021. available from: https://polioeradication.org/wp-content/uploads/2021/09/weekly-gpei-polio-analyses-cvdpv-20210831. pdf, accessed 17 september 2021. 6. alleman mm, jorba j, greene sa, diop om, iber j, tallis g, et al. update on vaccine-derived poliovirus outbreaks – worldwide, july 2019–february 2020. mmwr morb mortal wkly rep. 2020;60(16):489-95. doi:10.15585/mmwr.mm6916a1 pmid:32324719 7. macklin gr, o’reilly km, grassly nc, edmunds wj, mach o, santhana gopala krishnan r, et al. evolving epidemiology of poliovirus serotype 2 following withdrawal of the serotype 2 oral poliovirus vaccine. science. 2020;368:401–5. doi:10.1126/science.aba1238 pmid:32193361 8. manual of procedures for the philippine integrated disease surveillance and response, third edition. vol 1. manila: national epidemiology center, department of health; 2014. available from: https://doh.gov.ph/sites/default/files/publications/pidsrmop3ed_ vol1_2014.pdf, accessed 8 february 2022. 9. guidelines for environmental surveillance of poliovirus circulation. geneva: world health organization; 2003. available from: https://apps.who.int/iris/handle/10665/67854, accessed 17 september 2021. 10. polio laboratory manual, fourth edition. geneva: world health organization; 2004. available from: https://apps.who.int/iris/handle/10665/68762, accessed 8 february 2022. 11. alleman mm, jorba j, henderson e, diop om, shaukat s, traoré ma, et al. update on vaccine-derived poliovirus outbreaks – worldwide, january 2020–june 2021. mmwr morb mortal wkly rep. 2021;70(49):1691–9. doi:10.15585/mmwr.mm7049a1 pmid:34882653 tropical medicine, philippines, and the national institute of infectious diseases, japan, for providing the results and the phylogenetic analyses. conflicts of interest the authors declare no competing interests. ethics statement no ethics approval was required as this investigation was part of emergency response activities. funding none. references 1. ghendon y, robertson se. interrupting the transmission of wild polioviruses with vaccines: immunological considerations. bull world health organ. 1994;72(6):973–83. pmid:7867144 2. garon j, seib k, orenstein wa, ramirez gonzalez a, chang blanc d, zaffran m, et al. polio endgame: the global switch from topv to bopv. expert rev vaccines. 2016;15(6):693-708. doi:10.1586/14 760584.2016.1140041 pmid:26751187 3. global eradication of wild poliovirus type 2 declared. geneva: global polio eradication initiative, world health organization; 2015. available from: https://polioeradication.org/news-post/ global-eradication-of-wild-poliovirus-type-2-declared/, accessed 17 september 2021. seasonal influenza vaccine policies, recommendations and use in the world health organization’s western pacific region original research members of the western pacific region global influenza surveillance and response systema a full list of authors is included at the end of the manuscript. correspondence to jeffrey partridge (e-mail: partridgej@vn.cdc.gov). to cite this article: members of the western pacific region global influenza surveillance and response system. seasonal influenza vaccine policies, recommendations and use in the world health organization's western pacific region. western pacific surveillance and response journal, 2013, 4(3):51–59. doi:10.5365/wpsar.2013.4.1.009 abstract objective: vaccination is the most effective way to prevent seasonal influenza and its severe outcomes. the objective of our study was to synthesize information on seasonal influenza vaccination policies, recommendations and practices in place in 2011 for all countries and areas in the western pacific region of the world health organization (who). methods: data were collected via a questionnaire on seasonal influenza vaccination policies, recommendations and practices in place in 2011. results: thirty-six of the 37 countries and areas (97%) responded to the survey. eighteen (50%) reported having established seasonal influenza vaccination policies, an additional seven (19%) reported having recommendations for risk groups for seasonal influenza vaccination only and 11 (30%) reported having no policies or recommendations in place. of the 25 countries and areas with policies or recommendations, health-care workers and the elderly were most frequently recommended for vaccination; 24 (96%) countries and areas recommended vaccinating these groups, followed by pregnant women (19 [76%]), people with chronic illness (18 [72%]) and children (15 [60%]). twenty-six (72%) countries and areas reported having seasonal influenza vaccines available through public funding, private market purchase or both. most of these countries and areas purchased only enough vaccine to cover 25% or less of their populations. discussion: in light of the new who position paper on influenza vaccines published in 2012 and the increasing availability of country-specific data, countries and areas should consider reviewing or developing their seasonal influenza vaccination policies to reduce morbidity and mortality associated with annual epidemics and as part of ongoing efforts for pandemic preparedness. introduction influenza is an acute viral infection transmitted person to person predominately through droplet spread. worldwide, annual influenza epidemics result in about 3 to 5 million cases of severe illness and about 250 000 to 500 000 deaths.1 all age groups can be seriously affected, with the greatest risk of complications occurring among children aged under two years, adults 65 years or older, pregnant women and people of any age with certain chronic medical conditions or weakened immune systems.2 the most effective way to prevent seasonal influenza and its severe outcomes is through vaccination, and safe and effective vaccines have been used for more than 60 years.3 a recent systematic review of the scientific literature reported a pooled efficacy of 83% (95% confidence interval: 69%–91%) for trivalent live attenuated influenza vaccine in children six months to seven years of age.4 the same review reported that trivalent inactivated influenza vaccines had an efficacy of 59% (95% confidence interval: 51%–67%) in healthy adults 18–65 years of age and provided significant protection against medically attended influenza. there is also evidence demonstrating the socioeconomic benefits of vaccinating people against influenza.5–7 in the western pacific region of the world health organization (who), awareness of the public health importance of influenza and the need for pandemic preparedness has increased in recent years motivated by the re-emergence of highly pathogenic avian influenza a(h5n1) in 2003–2004 and subsequently by the occurrence of the influenza a(h1n1) pandemic in 2009. the region currently has three who collaborating centres for reference and research on influenza and 21 national influenza centres in 15 countries that monitor the impact and evolution of influenza viruses and provide isolates for global vaccine strain selection and formulation.8,9 despite the western pacific region contributing more than 76% of the total virus isolates submitted to the who global influenza surveillance response and system (gisrs) between 1998 and 2010 for vaccine strain selection,10 influenza vaccination programmes have not been established consistently throughout the region. these programmes facilitate governments’ health policies for influenza vaccination and provide the mechanisms for ensuring the target groups for vaccination actually receive vaccines. to describe seasonal influenza vaccination policies, recommendations and use in the western pacific region, who conducted a survey in 2012. this report summarizes the results from the survey in the context of the new who position paper on vaccines against influenza that recommended pregnant women be given the highest priority for vaccination; it also recommended seasonal influenza vaccination for, in no order of priority, health-care workers, children aged six to 59 months, the elderly and persons with chronic medical conditions.11 method data were collected via a survey conducted by who from july to october 2012. the questionnaire was sent electronically to all 37 countries and areas of who’s western pacific region (figure 1).12 data collection was supported by regional members of gisrs,13 staff of the expanded programme on immunization and who country or liaison offices. the questionnaire requested data and information on seasonal influenza vaccination policies, recommendations and practices in place in 2011, including: existence of a national vaccination policy; funding mechanisms for vaccines (public funding, private market purchase or both); recommendations for risk groups to target for vaccination; types of influenza vaccines available; number of vaccine doses purchased and distributed in 2011; the time period (months) when influenza vaccines were available for the 2011 southern hemisphere and the 2011–2012 northern hemisphere seasons; and the peak month(s) of influenza activity. incomplete surveys were followed up until all information was provided. for one area that did not respond to the survey, data were extracted from the who 2010 survey for the global mapping of seasonal influenza vaccine (unpublished data). the proportion of the total population potentially covered with influenza vaccine was calculated using country and area population data from the who web site.12 ethics review was not required for this study as it was a survey of policy and national-level practices, not a study involving individual human participants. figure 1. countries and areas in who’s western pacific region* click to download figure 1. jpg, 428kb * american samoa; australia; brunei darussalam; cambodia; china; cook islands; fiji; french polynesia; guam; hong kong (china); japan; kiribati; the lao people’s democratic republic; macao (china); malaysia; the marshall islands; micronesia, the federated states of; mongolia; nauru; new caledonia; northern mariana islands, the commonwealth of the; new zealand; niue; palau; papua new guinea; the philippines; the pitcairn islands; the republic of korea; samoa; singapore; solomon islands; tokelau; tonga; tuvalu; vanuatu; viet nam; and wallis and futuna. results data were available from 36 (97%) of the 37 countries and areas of the western pacific region; 35 countries and areas responded to the questionnaire and one had responded to the who 2010 survey for the global mapping of seasonal influenza vaccine. data were not available from the commonwealth of the northern mariana islands. seasonal influenza vaccination policies eighteen (50%) countries and areas, comprising 93% of the total population of the western pacific region, reported having established seasonal influenza vaccination policies; an additional seven (19%) reported providing influenza vaccination recommendations only for risk groups (but not as part of a vaccination policy). eleven countries and areas (30%) reported having no policy or recommendations in place. of the 25 countries and areas with policy or recommendations, health-care workers and the elderly were most frequently recommended for vaccination; 24 (96%) countries and areas recommended vaccinating these groups, followed by pregnant women (19 [76%]), people with chronic illness (18 [72%]) and children (15 [60%]). other groups included in policies or recommendations were children only or the elderly with chronic illnesses, laboratory workers and first responders, caregivers of high-risk persons and hajj pilgrims (table 1). table 1. recommendations for vaccine recipients by country and area, who western pacific region, 2011 click to download table 1. jpg, 740kb cdc – centers for disease control and prevention; hcw – health-care workers; m – months; n – no; y – years; y – yes. * countries and areas reported not having established policy but having recommendations for seasonal influenza vaccination. † data from the who 2010 global influenza vaccine survey. seasonal influenza vaccine use of the 36 participating countries and areas in the region, 26 (72%) reported that seasonal influenza vaccine was available through public funding, private market purchase or both (table 2). cambodia, cook islands, singapore and viet nam reported that seasonal influenza vaccine was available through private market purchase only. the remaining 22 countries and areas reported that influenza vaccine was purchased by the government (seven countries and areas) or was available through both government and private market purchase (15 countries and areas). ten (28%) countries and areas reported that seasonal influenza vaccine was not available. table 2. vaccination information from countries and areas reporting having seasonal influenza vaccines available in 2011, who western pacific region click to download table 2. jpg, 721kb ativ – adjuvanted trivalent inactivated influenza vaccine; laiv – live attenuated influenza vaccine; nh – northern hemisphere formulation; sh – southern hemisphere formulation; and tiv – trivalent inactivated influenza vaccine. * data from the who 2010 global influenza vaccine survey. † public funding limited to frontline health-care workers. ‡ estimation based on vaccine purchased by the government and claims made by private doctors to the government’s vaccine subsidy schemes. § public sector purchase figure, i.e. does not include the 9–10 million doses available through private market purchase. of the 26 countries and areas with influenza vaccine available, seven (27%) reported using only inactivated, non-adjuvanted, southern hemisphere formulation vaccine for the 2011 season. five countries and areas (19%) reported using both southern and northern hemisphere formulation vaccines, of which three used inactivated, non-adjuvanted vaccine and two used both non-adjuvanted and adjuvanted inactivated vaccines. the remaining 14 countries and areas (54%) reported using northern hemisphere formulation vaccines, 12 of which used inactivated, non-adjuvanted vaccines. palau reported using both inactivated, adjuvanted vaccine and live attenuated vaccine. wallis and futuna reported using inactivated, adjuvanted vaccine (table 2). for the 21 countries and areas that reported the number of doses of vaccine purchased, the estimated proportion of the total population that could be covered by the purchased amount ranged from 0.3% in cook islands to 99.7% in tokelau. most countries and areas purchased enough to cover less than 25% of their total populations. for the 17 countries and areas that reported the amount of vaccine distributed, the estimated proportion of the total population that could be covered again ranged from 0.3% in cook islands to 99.7% in tokelau, with most estimates being less than 20% (table 2). the majority of countries obtained their vaccine supply from international manufacturers. australia, china and the republic of korea reported both domestic production and importation of influenza vaccines. japan reported using only domestically produced vaccines (table 2). peak influenza seasons and vaccination timing reported periods of peak influenza activity tended to coincide with the winter and spring months in temperate countries and areas and throughout the year in tropical countries and areas. for those countries and areas using southern hemisphere formulation vaccine, peak months of activity occurred from june to november, except for macau (china) that reported having peak activity during february and march. most countries and areas using the northern hemisphere formulation vaccine reported peak influenza months from december to april, although peaks before this period were reported by seven countries and areas, five in the pacific. those countries and areas that reported using both the southern and northern hemisphere formulation vaccines tended to report influenza activity throughout the year. most countries and areas conducted their vaccination programmes in the months before or during periods of peak influenza activity (table 3). table 3. reported peak influenza month(s) and months of influenza vaccine availability, who western pacific region, 2011 click to download table 3. jpg, 508kb key: shaded months are the reported peak months for influenza illness; v – vaccine available. nh – northern hemisphere formulation; sh – southern hemisphere formulation; “–” – influenza vaccine currently not available. * american samoa and tokelau reported unknown vaccination month(s). † data from the who 2010 global influenza vaccine survey – seasonality and vaccine availability not reported. ‡ public sector-purchased vaccine available october–december. discussion of the 36 countries and areas included in this study, 18 (50%) reported having an established policy regarding seasonal influenza vaccination, which is a larger proportion than 40% of the 157 countries that reported having a policy in a global survey.14 seven (19%) additional countries and areas in the western pacific region reported providing recommendations for risk groups for seasonal influenza vaccination, but these were not part of an established policy. however, unlike the rapid increase from 2004 in the number of countries in the americas using seasonal influenza vaccine,15 only three (8%) countries and areas in the western pacific region reported introducing influenza vaccine after 2004. in 2011, influenza vaccine was not available in 10 (28%) countries and areas, and influenza vaccine policy or recommendations were not available in 11 (30%) countries and areas. therefore, the increase in influenza surveillance and response capacity and pandemic preparedness in the western pacific region in recent years16 has not been consistent across the region in the use of vaccines as an effective control measure. this is particularly true in pacific island nations. the 2012 who position paper on vaccines against influenza recommended that pregnant women be given the highest priority for vaccination in countries initiating or expanding seasonal influenza vaccination programmes. this recommendation was based on the risk of severe disease in this group, the evidence of the safety of trivalent inactivated influenza vaccines throughout pregnancy and the effectiveness of vaccines in preventing illness for the women and their infants. the vaccination of pregnant women has also b11een shown to be cost-effective in the united kingdom and northern ireland.17 although the proportion of countries and areas in the western pacific region that have recommended pregnant women as a risk group for vaccination (76%) is higher than the proportion reported from europe (37%),18 more work is needed to promote the inclusion of this risk group in existing and new policies and recommendations in the region. the new who position paper also recommended seasonal influenza vaccination for, in no order of priority, health-care workers, children aged six to 59 months, the elderly and persons with chronic medical conditions. all 18 countries and areas in the region with public policies for seasonal influenza vaccination recommended vaccination for health-care workers and the elderly, which is consistent with reports from european countries18 and the global vaccination survey.14 children were included in 15 (60%) country and area vaccination policies or recommendations in the region, a much larger proportion than that reported by six (22%) of 27 european countries.18 a global study comparing 10 countries in 2006 showed that the highest vaccination coverage rates for children were from the three asian countries in the study, suggesting that paediatric vaccination is important in the asia.19 persons at high risk of complications from influenza and/or those with chronic medical conditions were recommended for influenza vaccination in the policies of 18 (72%) countries and areas in the region, higher than the proportions reported from european countries.18 since 2006, there has been a global push to increase both the production and use of seasonal influenza vaccines through activities contained in the who global action plan for influenza vaccines.20 as a result, the number of countries that produce seasonal influenza vaccine has increased both globally and in the western pacific region.14,21,22 in 2008, who awarded grants to manufacturers in three countries in the region, namely china, the republic of korea and viet nam. the manufacturer in the republic of korea has since licensed both pandemic and trivalent seasonal vaccines; the other two manufacturers are at different stages of development.22 despite the increase in vaccine production, this study shows the lack of concomitant vaccine use as most countries and areas that reported influenza vaccine use reported purchasing and/or using only enough vaccine to cover less than 25% of their total populations. global seasonal influenza manufacturers reported that, despite growth in production capacity at the global, regional and national levels, more than two-thirds of countries distributed vaccine to cover only 10% of their populations.14 unfortunately, as risk-group population data were not collected by this study, it was not determined whether the reported number of doses of vaccine purchased by countries and areas were sufficient to cover the high-risk groups identified in vaccination policies or recommendations. the second who global action plan for influenza vaccines will place more focus on increasing seasonal vaccine use.20 reimbursement, communication, and, to a lesser extent, a country’s development status have been previously correlated with vaccine use.14 in china, the experiences in beijing and shaanxi suggest that effective promotional campaigns with reimbursement policies increase uptake in both highand low-income areas.23 similarly, in a survey of 10 countries, higher rates of vaccination were generally observed in countries with existing recommendations or vaccination programmes.19 one component of a successful vaccination programme is a surveillance system that monitors the impact of vaccination on disease burden. the results from this study show that most countries and areas schedule their vaccination campaign before or during their peak influenza season, but they also show that several countries and areas reported peak seasons inconsistent with their current vaccination schedule. given the progress made in influenza surveillance capacity development in the western pacific region in recent years, countries and areas are better able to understand the epidemiology of influenza in their populations, including seasonal patterns, and can now better match vaccination programmes with influenza seasonality.24 in addition, to support policy and vaccination recommendations, gisrs members in the region have developed a workplan to improve surveillance systems and to promote the implementation of special studies for additional data required.25 this study shows that more than two-thirds of the countries and areas in who’s western pacific region have either seasonal influenza vaccination policies or recommendations for vaccinating high-risk groups. in light of the new who position paper on vaccines against influenza published in 2012 and the increasing availability of country-specific data, countries and areas should consider reviewing or developing their seasonal influenza vaccination policies or recommendations to reduce morbidity and mortality associated with annual epidemics and as part of ongoing efforts for pandemic preparedness. conflicts of interest as the coordinating editor of wpsar was an author, another member of the editorial team managed this publication. funding none. authors members of the western pacific region global influenza surveillance and response system, who served as contributing authors for this study, are as follows: dominic dwyer (institute for clinical pathology and medical research, australia); ian barr, aeron hurt, anne kelso, patrick reading and sheena sullivan (who collaborating centre for reference and research on influenza, victorian infectious diseases reference laboratory, australia); philippe buchy (institut pasteur du cambodge, cambodia); hongjie yu and jiandong zheng (chinese center for disease control and prevention); yuelong shu and dayan wang (chinese national influenza center, institute for viral disease control and prevention, china); centre for health protection, department of health, hong kong (china), dr lam (health bureau, macao [china]); annette aguon and rita q oliva (department of public health and social services, guam); takato odagiri and masato tashiro (national institute for infectious diseases, japan); khebir verasahib (ministry of health, malaysia); mohd apandi yusof (institute for medical research, malaysia); pagbajabyn nymadawa and burmaa alexander (national influenza center, mongolia); anne-claire gourinat (institut pasteur de nouvelle-calédonie, new caldedonia); jean-paul grangeon (gouvernement de la nouvelle-calédonie, new caledonia); lance jennings (canterbury health laboratories, new zealand); sue huang (institute of environmental science and research, new zealand); paul horwood (papua new guinea institute of medical research, papua new guinea); marilla lucero, vito roque jr and lyndon lee suy (department of health, the philippines); peter cardon (medical officer, the pitcairn islands); amado tandoc iii (research institute for tropical medicine, the philippines); remigio m olveda (national influenza centre, philippines); chun kang and park young-joon (republic of korea centers for disease control and prevention); jeffery cutter, raymond lin and constance low (ministry of health, singapore); le thi quynh mai (national institute of hygiene and epidemiology, viet nam); amanda balish, james kile, shang mei, jeffrey mcfarland, ann moen, sonja olsen, gina samaan and xu xiyan (centers for disease control and prevention, united states of america); and nora chea, sergey diorditsa, keith feldon, kimberley fox, mendsaikhan jamsran, frank konings, hannah catherine lewis, michelle mcpherson, eric nilles, babatunde olowokure, jeffrey partridge (world health organization). references: influenza (seasonal). fact sheet no. 211. geneva, world health organization, 2012. available from: http://www.who.int/mediacentre/factsheets/fs211/en/index.html [accessed 11 december 2012]. wiselka m. influenza: diagnosis, management, and prophylaxis. bmj (clinical research edition), 1994, 308:1341–1345. doi:10.1136/bmj.308.6940.1341 pmid:8019225 hampson aw. vaccines for pandemic influenza. the history of our current vaccines, their limitations and the requirements to deal with a pandemic threat. annals of the academy of medicine, singapore, 2008, 37:510–517. pmid:18618064 osterholm mt et al. efficacy and effectiveness of influenza vaccines: a systematic review and meta-analysis. the lancet infectious diseases, 2012, 12:36–44. doi:10.1016/s1473-3099(11)70295-x pmid:22032844 baguelin m et al. health and economic impact of the seasonal influenza vaccination programme in england. vaccine, 2012, 30:3459–3462. doi:10.1016/j.vaccine.2012.03.019 pmid:22446636 postma mj et al. further evidence for favorable cost-effectiveness of elderly influenza vaccination. expert review of pharmacoeconomics & outcomes research, 2006, 6:215–227. doi:10.1586/14737167.6.2.215 pmid:20528557 prosser la et al. health benefits, risks, and cost-effectiveness of influenza vaccination of children. emerging infectious diseases, 2006, 12:1548–1558. doi:10.3201/eid1210.051015 pmid:17176570 list of who collaborating centres for reference and research on influenza. geneva, world health organization, 2012. available from: http://www.who.int/ influenza/gisrs_laboratory/collaborating_centres/list/en/index.html [accessed 11 december 2012]. list of national influenza centres of the western pacific region. manila, world health organization regional office for the western pacific, 2012. available from: http://www.wpro.who.int/topics/influenza/nic.pdf [accessed 11 december 2012]. oshitani h. influenza surveillance and control in the western pacific region. western pacific surveillance and response journal, 2010, 1(1):3–4. doi:10.5365/wpsar.2010.1.1.005 pmid:23908873 world health organization. vaccines against influenza who position paper – november 2012. weekly epidemiological record, 2012, 87:461–476. pmid:23210147 countries and areas. manila, world health organization regional office for the western pacific, 2012. available from: http://www.wpro.who.int/countries/en/ [accessed 13 august 2012]. sixth meeting of national influenza centres and influenza surveillance in the western pacific and south-east asia regions. manila, world health organization regional office for the western pacific, 2012. available from: http://www.wpro.who.int/ emerging_diseases/meetings/docs/6th.nic.meeting.report.pdf [accessed 11 december 2012]. palache a. seasonal influenza vaccine provision in 157 countries (2004–2009) and the potential influence of national public health policies. vaccine, 2011, 29:9459–9466. doi:10.1016/j.vaccine.2011.10.030 pmid:22024174 ropero-alvarez am et al. expansion of seasonal influenza vaccination in the americas. bmc public health, 2009, 9:361. doi:10.1186/1471-2458-9-361 pmid:19778430 world health organization. fifth meeting of national influenza centres – who western pacific and south-east asia regions. weekly epidemiological record, 2012, 87:61–64. pmid:22355834 jit m et al. the cost-effectiveness of vaccinating pregnant women against seasonal influenza in england and wales. vaccine, 2010, 29:115–122. doi:10.1016/j.vaccine.2010.08.078 pmid:21055501 mereckiene j et al. differences in national influenza vaccination policies across the european union, norway and iceland 2008–2009. euro surveillance: european communicable disease bulletin, 2010, 15(44):pii=19700. de lataillade c, auvergne s, delannoy i. 2005 and 2006 seasonal influenza vaccination coverage rates in 10 countries in africa, asia pacific, europe, latin america and the middle east. journal of public health policy, 2009, 30:83–101. doi:10.1057/jphp.2008.40 pmid:19367303 report of the second who consultation on the global action plan for influenza vaccines (gap). geneva, world health organization, 2011. partridge j, kieny mp, world health organization h1n1 influenza vaccine task force. global production of seasonal and pandemic (h1n1) influenza vaccines in 2009–2010 and comparison with previous estimates and global action plan targets. vaccine, 2010, 28:4709–4712. doi:10.1016/j.vaccine.2010.04.083 pmid:20488262 partridge j, kieny mp. global production capacity of seasonal influenza vaccine in 2011. vaccine, 2013, 31:728–731. doi:10.1016/j.vaccine.2012.10.111 pmid:23149268 feng l et al. seasonal influenza vaccine supply and target vaccinated population in china, 2004–2009. vaccine, 2010, 28:6778–6782. doi:10.1016/j.vaccine.2010.07.064 pmid:20688038 western pacific region global influenza surveillance and response system. epidemiological and virological characteristics of influenza in the western pacific region of the world health organization, 2006–2010. plos one, 2012, 7:e37568. doi:10.1371/journal.pone.0037568 pmid:22675427 biregional plan for further strengthening national influenza surveillance. guiding the way towards influenza control policy and regional surveillance. manila, world health organization regional office for the western pacific, 2012. available from: http://www.wpro.who.int/topics/influenza/influenzasurveillancefiveyear workplan_website.pdf [accessed 11 december 2012]. https://ojs.wpro.who.int/ 1wpsar vol 13, no 1, 2022 | doi: 10.5365/wpsar.2022.13.1.885 lessons from the field problem the world health organization (who) declared coronavirus disease 2019 (covid-19) a pandemic on 11 march 2020.1 severe covid-19 may require intensive care, which is limited in smaller, resource-poor nations. this paper describes how two small island nations managed the first wave of the pandemic. their handling of the pandemic during the first 3 months contained the spread. the lessons learned from their experience may assist small island developing states (sids) in who’s western pacific region. context maldives and trinidad and tobago are sids.2 maldives has a population of 437 535 persons living on 187 islands in the indian ocean3 and has a human development index score of 0.719.4 total health expenditures are 9.0% of gross domestic product.5 trinidad and tobago, in the atlantic ocean, has a population of 1.4 million persons and is also high on the human development index, with a score of 0.799.4 total health expenditures are 7.0% of gross domestic product.5 these countries were chosen for this study because they are small island states with relatively high scores on the human development index. they have similar climates, and both countries have experienced natural disasters and are engaged in ongoing planning and preparedness activities. they are similar to sids in the western pacific region, such as fiji,6 in that tourism is a major income generator for maldives and to a lesser extent for trinidad and tobago, and both depend on imports for many items. a faculty of medical sciences, the university of the west indies, st augustine, trinidad and tobago. b private physician, malé, maldives. c research development office, the maldives national university, malé, maldives. d health protection agency, malé, maldives. published: 31 march 2022 doi: 10.5365/wpsar.2022.13.1.885 problem: coronavirus disease 2019 (covid-19) was declared a pandemic on 11 march 2020. severe illness requires intensive care facilities, which are limited in smaller, resource-constrained settings. context: maldives and trinidad and tobago are small island developing states with comparable climates. similar to island nations in the western pacific region, they are prone to natural disasters and so engage in planning and preparedness activities on an ongoing basis. this paper describes the initial measures taken by both countries during the first wave of covid-19, from march to may 2020. action: in both countries, multisectoral high-level leadership allowed for timely and decisive actions. early school closures, early border closures and early lockdowns were enforced. mandatory mask wearing and physical distancing were instituted. cases and contacts were isolated in facilities away from public sector hospitals, and isolation was implemented at the government’s expense. volunteers were trained to manage dedicated hotlines. additionally, the governments held daily press briefings. outcome: during the first wave, maldives contained its epidemic to one geographical cluster; trinidad and tobago successfully avoided community spread, thus averting an overwhelmed health system. discussion: diligent contact tracing with quarantine implemented at the government’s expense successfully minimized spread in both countries. small countries need volunteers to help with activities such as contact tracing, and recruiting and training volunteers before a health emergency occurs is key. lessons learned from the experience of maldives and trinidad and tobago could serve as a model for other small island developing states, including those in the western pacific region. early covid-19 response in two small island developing states: maldives and trinidad and tobago shalini pooransingh,a abdul azeez yoosuf,b sheena moosa,c nishan ahmed,d satish jankiea and lexley pinto pereiraa correspondence to shalini pooransingh (email: shalini.pooransingh@sta.uwi.edu) wpsar vol 13, no 1, 2022 | doi: 10.5365/wpsar.2022.13.1.885 https://ojs.wpro.who.int/2 pooransingh et alcovid-19 early response both countries adopted a multisectoral approach. the early actions taken by both countries during their first wave of covid-19 resulted in maldives containing the epidemic to one geographical cluster, while trinidad and tobago managed to avoid community spread, thus preventing its health system from becoming overwhelmed. lessons learned multisectoral high-level leadership led to a timely response in maldives, the health emergency coordination committee, activated on 21 january 2020, coordinated the multiagency response. as the situation escalated, response coordination was handed to the national disaster management authority to facilitate multiagency coordination; health emergency operations were relocated to the national emergency operations centre on 1 march 2020. with this change, a national task force was established at the executive level, and the strategic decision-making body was chaired by the president. a national public health emergency was declared on 12 march 2020. in trinidad and tobago, a core team was formed to manage the response, comprising the minister of health, the minister of national security and the chief medical officer and his team of public health professionals at the ministry and county levels. communication was at the forefront of the response. in both countries, communication about the pandemic came from trusted sources. in maldives, communication was led by the president’s office, which held daily press briefings; multiskilled staff from across the government and private sectors facilitated content production and managed communication through mass and social media. at the national emergency operations centre, the call centre was operated by dedicated personnel and a large number of volunteers. in trinidad and tobago, the minister of health and the chief medical officer, along with subject matter experts, held daily press briefings that included clinical and epidemiological updates and information about the availability of testing facilities. potential mental health challenges from job loss, domestic violence and stay-athome restrictions were addressed by clinical psychologists. a hotline staffed by doctors was established as a resource for the public. this paper describes the initial measures taken by maldives and trinidad and tobago during their first waves of covid-19 (from 7 march in maldives and 12 march in trinidad and tobago to 31 may 2020) that helped keep their health systems from being overwhelmed. the descriptive reports on which this paper is based were made at each country’s government briefings. the first case of covid-19 in maldives was detected at a tourist resort on 7 march 2020; by 14 april, there were 20 confirmed imported cases, with 56 suspected cases in isolation and 152 contacts under quarantine. the first local case detected on 15 april in the capital, malé, prompted a lockdown of the greater malé area. cases increased during the following weeks, and by 31 may 2020, there were 1730 cases, 127 recoveries, 12 hospitalizations and 5 deaths.7 trinidad and tobago reported its first confirmed case of covid-19 on 12 march 2020 in a traveller returning from europe. on 13 march, a second case was confirmed, and by 19 march, nine cases were confirmed. on 21 march, 40 cases were confirmed in a group of 68 returning nationals who were aboard a cruise liner. the first death from covid-19 in trinidad and tobago occurred on 25 march, and by 31 may, there were 117 cases and 8 deaths.8 in the early phase, the majority of cases in maldives occurred among males (>80%; 1412/1730). in maldives, most cases were aged 21–40 years, while in trinidad and tobago, the majority of cases were aged 60–69 years. in maldives, the majority of cases occurred among foreign migrant workers (65%; 1124/1730), with one third observed among maldivians. in trinidad and tobago, most cases were imported, with 34% (40/117) occurring in one cluster on a cruise liner. action in maldives, the health protection agency is mandated to safeguard the nation’s public health. the director of public health heads the agency and reports to and advises the health minister. in trinidad and tobago, county medical officers of health are the public health officers in charge of each county’s surveillance and response activities. they report to the chief medical officer at the ministry of health. wpsar vol 13, no 1, 2022 | doi: 10.5365/wpsar.2022.13.1.885https://ojs.wpro.who.int/ 3 covid-19 early responsepooransingh et al 100 close contacts.11 this led to enforced movement restrictions and scaling up of risk communications. as a result, within 3 weeks of lockdown and enforcement, contact bubbles were reduced to eight persons per case. this contrasts with trinidad and tobago where enforcement of public health measures accompanied lockdown early in the epidemic (18 days after the first case), with citizens allowed outside only to visit supermarkets, pharmacies and hardware stores. community spread was not reported in trinidad and tobago at that time. multiagency action supported contact tracing in the containment phase surveillance with contact tracing and case investigation was supported by rapid response teams in maldives and by county office staff in trinidad and tobago. in both countries, additional health-care workers, volunteers and students were recruited and trained for contact tracing. contact tracing was prioritized in maldives, with near-universal contact tracing within 48 hours of case detection and cases isolated within 2 days. multiagency action supported by information technology allowed for speedy implementation of containment activities. the use of volunteers in both countries suggests that volunteers should be recruited and trained before a health emergency occurs.12 isolation at state expense likely delayed community transmission in trinidad and tobago, patients were isolated in facilities away from public sector hospitals and private nursing homes, and the government established two facilities with intensive care units (icus) and resources for highdependency care. health workers caring for patients were housed separately. suspected cases were isolated in facilities at the government’s expense. discharge from quarantine required two negative test results 24 hours apart. in maldives, an icu ward at the national referral hospital was designated to care for severe cases. one private hospital was commissioned to manage severe cases while work progressed to establish a separate hospital facility for these cases. quarantine and isolation facilities were established at resort islands managed by the national emergency operations centre. suspected cases preparedness activities were initiated early and focused on points of entry in both countries, preparedness activities were initiated approximately 6 weeks before who declared the pandemic. early interventions focused on points of entry. trinidad and tobago began its prevention and response efforts on 23 january 2020, implementing entry and exit screening at airports. in maldives, the early response focused on the tourism sector and travellers to facilitate early detection, contact tracing and isolation. although evidence supporting entry and exit screening is sparse, these activities can earn public confidence and raise awareness among the travelling public.9 in retrospect, the asymptomatic phase of the disease means that such individuals would have been missed during airport screening. border closures were implemented early in both countries, and as in several countries in the western pacific region, this measure was successful in limiting the entry of the virus and keeping case numbers low. public health and social measures were initiated early and adjusted as needed cinemas and educational institutions were closed when there were 13 cases in maldives and 5 in trinidad and tobago. borders were closed when maldives reached 14 cases and trinidad and tobago reached 10. lockdown of non-essential services occurred on 15 april in maldives and on 29 march in trinidad and tobago. lockdown in the latter included the closure of restaurants and a rapid scaling down of public gatherings from 25 to 5 persons; residents were permitted to visit only supermarkets, pharmacies and hardware stores (table 1; figs. 1 and 2). in maldives, lockdown measures were eased on 28 may, but physical distancing and mask wearing were made mandatory for essential services and their providers (table 1; fig. 1). in trinidad and tobago, face masks became mandatory in public places on 5 april, based on international guidance.10 on 11 may, lockdown measures were eased with a “no mask, no service” rule in effect (table 1; fig. 2). in maldives, in the early stages of the pandemic, community-based interventions and health risk communication did not have the expected impact on physical distancing despite the closure of educational institutions and some workplaces on 22 march because the contact tracing of the first community case identified more than wpsar vol 13, no 1, 2022 | doi: 10.5365/wpsar.2022.13.1.885 https://ojs.wpro.who.int/4 pooransingh et alcovid-19 early response laboratory testing supported the response in maldives, strengthening laboratory capacity required activating the emergency contingency budget and mobilizing aid resources to obtain materials for testing. the capacity for polymerase chain reaction testing was increased from 200 tests per day to 1000 tests per day in may 2020. laboratories in the private sector and the forensic laboratory at maldives police services were moin the community were isolated for monitoring in specially designated facilities. suspected cases were provided with food and essential commodities and supported by the maldives red crescent. in both countries, isolation of suspected cases in specially designated facilities at the government’s expense, rather than at home, likely contributed to containment of the outbreaks.13 table 1. timeline of public health and social measures and number of cases of covid-19, maldives and trinidad and tobago, march–may 2020 fig. 1. epidemic curve of covid-19, maldives, 7 march to 31 may 2020 measures maldives trinidad and tobago date no. of cases date no. of cases first case detected 7 march (imported) 1 12 march (imported) 1 closure of cinemas 16 march 13 16 march 5 closure of all educational institutions 22 march 13 16 march 5 borders closed 27 march (suspension of on-arrival visas) 14 22 march (closure includes returning nationals) 10 (plus 40 on a cruise ship) lockdown of non-essential businesses and services, with enforcement 15 april 21 29 march 38 (plus 40 on a cruise ship) easing of phase 1 lockdown 28 may 1528 11 may 116 wpsar vol 13, no 1, 2022 | doi: 10.5365/wpsar.2022.13.1.885https://ojs.wpro.who.int/ 5 covid-19 early responsepooransingh et al discussion prompt action was critical to contain the covid-19 pandemic early in both countries. keeping the numbers low is important for nations with limited resources and less sophisticated health-care systems to buy time until vaccines and medications become available. since the first wave of covid-19 (march to may 2020), both countries have experienced further waves. as of the time of writing, maldives experienced its latest surge in september 2021, and trinidad and tobago is in its fourth wave, with a surge in cases. trinidad and tobago was under a prolonged state of emergency from bilized. genomic sequencing is available through regional reference laboratories. trinidad and tobago followed who protocols14 for laboratory testing in april 2020: testing was widened to include frontline personnel in public sector facilities and elderly care facilities, and sentinel surveillance for influenza-like symptoms was implemented. during the initial phases, genomic sequencing was locally available only through the university of the west indies st augustine medical school. box 1 highlights key lessons learned during the early response in both countries. fig. 2. epidemic curve of covid-19, trinidad and tobago, 11 march to 31 may 2020 box 1. lessons learned • early lockdown requires enforcement if it is to be effective at preventing and containing the spread of disease. • strong health communication is essential: communities need to be made aware of the rationale for a lockdown and should be engaged in the response to the pandemic. • allowing people to isolate in a facility at the government’s expense appeared to contain the spread during the first wave of covid-19. • small countries may lack the human resources necessary to carry out sustained public health activities, such as contact tracing, implementing a rapid response and staffing hotlines. volunteers are a useful resource for these public health activities; potential volunteer pools should be identified. • taking a regional approach to guarantee laboratory access and vaccine procurement would ensure equitable access for smaller nations. wpsar vol 13, no 1, 2022 | doi: 10.5365/wpsar.2022.13.1.885 https://ojs.wpro.who.int/6 pooransingh et alcovid-19 early response conflicts of interest the authors declare no conflicts of interest. ethics approval ethical approval was not required as this paper contains no identifiable patient data. funding none. references 1. coronavirus disease (covid-19) pandemic. geneva: world health organization; 2021. available from: https://www.who. int/emergencies/diseases/novel-coronavirus-2019, accessed 22 october 2021. 2. sustainable development goals knowledge platform. small island developing states. new york, ny: united nations; 2021. available from: https://sustainabledevelopment.un.org/topics/ sids/list, accessed 22 october 2021. 3. maldives population projections 2014–2054. malé: maldives bureau of statistics; 2021. available from: http://statisticsmaldives.gov.mv/population-projection-2014-2054/#collapseone, accessed 22 october 2021. 4. human development data center. new york, ny: united nations development programme; 2020. available from: http://hdr.undp. org/en/data, accessed 22 october 2021. 5. global health observatory. current health expenditure (che) as percentage of gross domestic product (gdp) (%): data by country [online database]. geneva: world health organization; 2021. available from: https://apps.who.int/gho/data/node.main.ghedchegdpsha2011, accessed 22 october 2021. 6. tourism unit. suva: ministry of commerce, trade, tourism and transport; 2021. available from: https://www.mcttt.gov.fj/divisions/tourism-unit/, accessed 22 october 2021. 7. health protection agency covid-19 statistics dashboard [online database]. malé: ministry of health; 2020. available from: https://covid19.health.gov.mv/dashboard/, accessed 22 october 2021. 8. covid-19 dashboard. port of spain: ministry of health, trinidad and tobago; 2021. available from: https://experience.arcgis.com/ experience/59226cacd2b441c7a939dca13f832112/, accessed 22 october 2021. 9. mouchtouri va, christoforidou ep, an der heiden m, menel lemos c, fanos m, rexroth r, et al. exit and entry screening practices for infectious diseases among travelers at points of entry: looking for evidence on public health impact. int j environ res public health. 2019;16(23):4638. doi:10.3390/ijerph16234638 pmid:31766548 10. your guide to masks: wear a mask with the best fit, protection, and comfort for you. atlanta, ga: centers for disease control and prevention; 2021. available from: https://www.cdc.gov/ coronavirus/2019-ncov/prevent-getting-sick /cloth-face-coverguidance.html, accessed 22 october 2021. 11. updates as of 23:30. malé: ministry of health; 2021. available from: https://covid19.health.gov.mv/updates-as-of-2330/?c=0, accessed 22 october 2021. 16 may to 17 november 2021. from 4 october, fully vaccinated persons were once again allowed to visit cinemas and gyms, and schools reopened to fully vaccinated students who were in their last 4 years of secondary school. in maldives, school reopening has been staggered, with older students returning first, such as those sitting examinations. in trinidad and tobago, vaccination began in february 2021 with donated vaccines and the prioritization of health-care workers. in april 2021, those aged ≥60 years and those with comorbidities were prioritized, and by august 2021, vaccination was open to all persons aged ≥12 years, including persons from migrant communities. trinidad and tobago has achieved 46.3% full vaccination coverage of its eligible population. in maldives, vaccination commenced in february 2021 for those aged ≥65 years, persons with comorbidities and frontline workers (including foreign migrant workers). by april 2021, vaccination was available to everyone aged ≥18 years, including foreign migrants. maldives has achieved 67.5% full vaccination coverage of its eligible population. the responses of both countries during their first waves served to limit spread and prevent their health systems from being overwhelmed. lessons may also be derived from the management of the pandemic in the pacific island sids that closed their borders early. leaders in the pacific islands forum invoked the biketawa declaration to mount a collective response to the pandemic. additionally, a pacific action covid-19 preparedness and response plan was developed to reduce transmission and to manage cases. the plan included activities such as screening passengers at major checkpoints, implementing 14-day quarantine for contacts and closing entry to non-residents. it also included the sharing of resources among islands. the pacific humanitarian pathway on covid-19 is the region’s mechanism for enabling the political commitment to expedite assistance and foster cooperation among member countries. it also facilitates the provision of medical and humanitarian assistance from regional, international and development partners in a timely and equitable manner.15,16 in conclusion, ongoing planning and preparedness, multisectoral collaboration, and community engagement and participation are critical to ensuring a successful response to an outbreak such as covid-19.17,18 wpsar vol 13, no 1, 2022 | doi: 10.5365/wpsar.2022.13.1.885https://ojs.wpro.who.int/ 7 covid-19 early responsepooransingh et al 16. filho wl, lutz jm, sattler dn, nunn pd. coronavirus: covid-19 transmission in pacific small island developing states. int j environ res public health. 2020;17:5409. doi:10.3390/ ijerph17155409 pmid:32731327 17. from containment to suppression: covid-19 lessons from countries in the western pacific region – joint forum with the lancet covid19 commission: opening remarks from dr takeshi kasai, who regional director for the western pacific. manila: world health organization regional office for the western pacific; 2020. available from: https://www.who.int/westernpacific/newsroom/speeches/detail/from-containment-to-suppression-covid19-lessons-from-countries-in-the-western-pacific-region-joint-forum-with-the-lancet-covid19-commission, accessed 22 october 2021. 18. kasai t. from the “new normal” to a “new future”: a sustainable response to covid-19. lancet reg health west pac. 2020;4:100043. doi:10.1016/j.lanwpc.2020.100043 pmid:34013215 12. role of village health volunteers in avian influenza surveillance in thailand. new delhi: world health organization regional office for south-east asia; 2007. available from: https://apps.who.int/ iris/handle/10665/205876, accessed 22 october 2021. 13. dickens bl, koo jr, wilder-smith a, cook ar. institutional, not home-based, isolation could contain the covid-19 outbreak. lancet. 2020;395:1541–2. doi:10.1016/s0140-6736(20)310163 pmid:32423581 14. laboratory testing strategy recommendations for covid-19: interim guidance, 21 march 2020. geneva: world health organization; 2020. available from: https://apps.who.int/iris/handle/10665/331509, accessed 22 october 2021. 15. vandhana n. pacific islands forum foreign ministers agree to establish a pacific humanitarian pathway on covid-19. suva: pacific islands forum; 2020. available from: https://www.forumsec.org/2020/04/08/pacific-islands-forum-foreign-ministersagree-to-establish-a-pacific-humanitarian-pathway-on-covid-19/, accessed 8 december 2021. https://ojs.wpro.who.int/ 1wpsar vol 12, no 4, 2021 | doi: 10.5365/wpsar.2021.12.4.935 acknowledgement to wpsar reviewers, 2020-2021 the wpsar editorial team is grateful to all reviewers that have contributed their time and expertise to peer-review our articles. we thank them for their support. our apologies to those reviewers we may have inadvertently missed. our reviewers for articles finalised in 2020-2021 were: mohammad yazid abdad, stephen aichele, ananda amarasinghe, yuzo arima, yin myo aye, darryl wade barrett, nyambat batmunkh, leila bell, julie bines, david brett-major, simon burggraaf, hwang ching chan, po-lin chan, norziha che-him, young june choe, zhuo lin chong, hitesh chugh, paula couto, adam craig, zoe cutcher, siddhartha sankar datta, manuel dayrit, michael desjardins, ciao hien do, marion easton, socorro escalante, anthony eshofonie, roger evans, emma field, james fielding, shannon fleck-derderian, christopher fitzpatrick, paula fujiwara, kathleen gallagher, jun gao, philippe glaziou, shoshanna goldin, philip gould, varja grabovac, jin gwack, jose hagan, riitta-maija hamalainen, james heffelfinger, einar heldal, claire heney, bonnie henry, lai ming ho, andrew hodgetts, peter hoejskov, ben howden, masahiro ishikane, naoko ishikawa, tauhid islam, daiki kanbayashi, masaya kato, mariana kikuti, rama krishna, gary kuniyoshi, julia latash, eric lau, ben lilley, ying-ru lo, heidi lord, christopher lowbridge, l. ulzii-orshikh luvsansharav, john macarthur, john mackenzie, therese marfori, lisa mccallum, charlotte mckercher, lucy mcnamara, dubravka selenic minet, cameron moffatt, daphne moffett, matthew moore, keita morikane, david muscatello, karen nahapetyan, kien nguyen, tuan hai nguyen, takeshi nishijima, shingo nishiki, juhwan oh, kyung hyun oh, kazunori oishi, victoria oluwabunmi oladoyin, masaki ota, satoko otsu, amy parry, bev paterson, johnette agpoon peñas, quang duy pham, phuc h phan, saraswathi bina rai, salim reza, michaela riddell, olivier ronveaux, mika saito, timothy sloan-gardner, yoshiyuki sugishita, yat hung tam, junko tanaka, jade ll teng, yoser thamtono, john turnidge, mohammad helal uddin, kerri viney, cecilia xu, rajpal yadav, takashi yoshiyama, joon sup yeom, zaixing zhang, weigong zhoua, kathleen gallagher, jun gao, philippe glaziou, shoshanna goldin, philip gould, varja grabovac, jin gwack, jose hagan, riitta-maija hamalainen, james heffelfinger, einar heldal, claire heney, bonnie henry, lai ming ho, andrew hodgetts, peter hoejskov, ben howden, masahiro ishikane, naoko ishikawa, tauhid islam, daiki kanbayashi, masaya kato, mariana kikuti, rama krishna, gary kuniyoshi, julia latash, eric lau, ben lilley, ying-ru lo, heidi lord, christopher lowbridge, l. ulzii-orshikh luvsansharav, john macarthur, john mackenzie, therese marfori, lisa mccallum, charlotte mckercher, lucy mcnamara, dubravka selenic minet, cameron moffatt, daphne moffett, matthew moore, keita morikane, david muscatello, karen nahapetyan, kien nguyen, tuan hai nguyen, takeshi nishijima, shingo nishiki, juhwan oh, kyung hyun oh, kazunori oishi, victoria oluwabunmi oladoyin, masaki ota, satoko otsu, amy parry, bev paterson, johnette agpoon peñas, quang duy pham, phuc h phan, saraswathi bina rai, salim reza, michaela riddell, olivier ronveaux, mika saito, timothy sloan-gardner, yoshiyuki sugishita, yat hung tam, junko tanaka, jade ll teng, yoser thamtono, john turnidge, mohammad helal uddin, kerri viney, cecilia xu, rajpal yadav, takashi yoshiyama, joon sup yeom, zaixing zhang, weigong zhou https://ojs.wpro.who.int/ 1wpsar vol 13, no 2, 2022 | doi: 10.5365/wpsar.2022.13.2.914 covid-19: field investigation report i n australia, collaboration with leaders of culturally and linguistically diverse (cald) communities has been recommended for communication of coronavirus disease 2019 (covid-19) health information, particularly around vaccination.1,2 many refugee communities are tightly knit and rely on advice and guidance from community leaders.3 congolese immigrants are a newly emerging population in regions of australia, such as the hunter new england area, with most coming to australia as humanitarian arrivals. refugees from the democratic republic of the congo have been subject to human rights violations related to the country’s history of intermittent armed conflict and political unrest.4,5 most refugees from the democratic republic of the congo crossing the border reach rural settlements or camps in neighbouring burundi, rwanda, tanzania and uganda, where work and educational opportunities are limited.5 additionally, basic humanitarian needs have been further compromised by multiple ebola virus disease outbreaks since 2018.4 many congolese are multilingual, but it is estimated that less than 50% of congolese refugees speak english, and only 10% report the ability to read and write english well.5 by listening to community leaders, we explored and gained insights into the concept of leadership among a newly emerging congolese population in australia, and how leadership is being enacted during the covid-19 response. no similar work has been reported in australia or internationally. methods four participants of congolese or burundian background were recruited by purposive sampling among community leaders, after initial recommendation by a local refugee health nurse. the participants took part in semi-structured interviews as part of a larger project. three participants were interviewed together and one individually. a hunter new england health, wallsend, new south wales, australia. published: 24 june 2022 doi: 10.5365/wpsar.2022.13.2.914 objective: community leadership enhances collective action in times of uncertainty, such as during the coronavirus disease (covid-19) pandemic. this study explores the role of leadership related to the covid-19 response and information sharing among a newly emerging congolese community in the hunter new england region of australia. methods: semi-structured qualitative inquiry was used to interview four participants who were identified as being influential leaders of the local congolese community. the findings of this study were part of a larger exploration of covid-19 messaging among emerging culturally and linguistically diverse (cald) communities. two interviewers independently analysed the transcribed data before pairing their findings. narrative analysis was employed. results: two major themes were identified: leadership as an assigned and trusted role, and leadership as a continuous responsibility. several categories were identified within these themes, such as mutual connection, education level, multilingual ability and networking. discussion: the congolese community leaders reported feeling responsible and confident in their ability to proactively contribute to the local covid-19 response by enhancing communication within the community. by partnering with and learning from respected leaders in cald communities, government health services have the opportunity to improve how current public health messaging is developed. the role of leadership among a congolese community in australia in response to the covid-19 pandemic: a narrative study sunita j rebecca healey,a nafiseh ghafournia,a katarzyna bolsewicz,a karinne andricha and peter d masseya correspondence to sunita j rebecca healey (email: rebecca.healey@health.nsw.gov.au) wpsar vol 13, no 2, 2022 | doi: 10.5365/wpsar.2022.13.2.914 https://ojs.wpro.who.int/2 healey et alcommunity leaders’ roles and responses to covid-19 leadership as a socially assigned and trusted role participants told stories of leadership as a role bestowed by community members and of how that role was respected by work colleagues outside the community (table 1). they reported that the community’s perceptions about education level empowered a leader who could research and provide accurate advice and information. education boosted participants’ self-confidence, as one described: “i’m not the expert, but my level of education allows me to go seek the right level of education [information] that i can also spread”. being multilingual was advantageous in navigating and understanding media resources in english and other languages, and it provided participants with additional leverage to inquire, interpret and explain covid-19 information. mutual cultural understanding, sharing common languages and connection with the community were described by participants as factors contributing to trust and connectivity. one participant explained: “i share the same cultural background as community members, like people from burundi, and those that speak the languages i use … having supported different people and built trust from the community, it’s from mutual understanding and the relationship that makes me play a key role”. being trusted by the community strengthened the participants’ confidence to be leaders. one participant explained: “according to that trust, i feel free to interact with people who ask to know something”. leadership as a continuous responsibility the responsibility of leadership was seen as continual: one participant described “leading the community in our regular gathering”, and another explained that “we usually talk nearly every single day and pass what we have heard in the news in our local languages”. participants reported carrying various leadership responsibilities in ways that were caring and respectful; this was displayed through words such as “encourage”, “help”, “tell”, “contribute”, “share”, “benefit” and “connect”. participants reported how they carried out their leadership responsibilities and mobilized to help comresearchers from the multicultural health and refugee health service (mhrhs) conducted the interviews in english, exploring participants’ roles in relation to covid-19 information sharing. “community” was defined as “recently arrived refugee immigrants who identified as having democratic republic of the congo heritage, living in the hunter new england region”. participants often chose to broaden this term to include refugees of central african background living locally. “leadership” was ascertained by participants themselves. all four participants self-reported being leaders in their community, and this was corroborated by the other participants. the congolese have a strong oral tradition that values storytelling as a way of making sense of the world and conveying knowledge.6 narrative analysis was employed to interpret the roles and experiences through stories.7 two researchers analysed the data individually before combining to create a paired analysis for each transcript. researchers focused on the content of the stories and how the narrator organized information to convey meaning.8 similar concepts were grouped into categories, forming two overarching themes. results the participants comprised three women and one man, aged between 20 and 60 years. all could read, write and speak both swahili and english, and several minority languages. three participants provided additional information, reporting lived experiences as a refugee, attainment of tertiary education and holding employment positions in australia that were external to their roles with the african community. each participant shared stories using a similar structure, where the main point was given first and then explained. the participants circled back to their main points for emphasis and spoke confidently of community and culture. the narrative structure and the content of the participants’ narratives revealed two aspects of leadership in this resettled congolese community – that it is a socially assigned and trusted role, and it carries an ongoing responsibility. wpsar vol 13, no 2, 2022 | doi: 10.5365/wpsar.2022.13.2.914https://ojs.wpro.who.int/ 3 community leaders’ roles and responses to covid-19healey et al table 1. evidence supporting theme: leadership as a socially assigned and trusted role leadership as a socially assigned and trusted role participants’ quotes role bestowed by others yeah, the day i went to drop my cv and we talking and they say well we know you are a leader, and this is the refugee from there and we know that you help them, so we know you will help us as well ... and we work together. importance of education and english language skills the educational background i have back home and here, it added up to people to trust me, people to ask me things … and also the capacity of advocating on their behalf to gain the trust in the community, and also have something to contribute. [community members] contact me because they believe, as a leader, that i have done more research … so they just want to double check, because [for] some [of them] english language may still be low. shared language and culture so it’s just mutual connection, network, one-to-one talk, that helps channel information, and update one another. so most times, people would call and say “we heard about this” and ask “how much more did you hear about this”? and then you have to go through it and explain in a language they understand. because most of us, we share … the same language and background, so it’s an easy task to explain in their local language or in a language they understand better. relationship with trust i strongly believe that my role as a community connector, and also the trust the community has in me, has impacted me to do everything that i can offer to the community. table 2. evidence supporting theme: leadership as a continuous responsibility leadership as a continuous responsibility participants’ quotes responsibility as an ongoing phenomenon since i came ..., i have good relationship with my congolese community and also african community around ... over 10 years to get to know each other, and also to win trust from the community, because we are here to help each other. wherever help is needed, when i can respond to, i do that’s how … even when an issue arises, it’s easy to interact … the same way of sharing information about covid. responsibility to act then we come out with the idea, ok, let us translate. i did the translation in swahili, then i post on my whatsapp, then i say ok … just send me inbox and i will send you to read, the safety … about what the meaning of covid, what you must do, how you going to wash your hands, that stuff like that, the basic stuff. you see, we have that burden of getting people to know what is happening, especially about covid, because there is also a lot of misinformation. so when we get together, or when we have the opportunity to meet with someone, is trying to fix the information that they got that is not right. responsibilty to share accurate information if we come across something that is related to covid, before you send it out there, you have to do a little bit of research. so you check the correct source – the government, and if it’s something you heard from social media, if you compare it to what the government has is the same, that’s when you get that and post it on the status or post it on the whatsapp. so we need to ask questions, and so we can have answers to those question and be confident with whatever we are saying. responsibility to incorporate network and also the different work, different jobs i do … all this gives me the position and strength to share what i have to contribute to building the community strength. wpsar vol 13, no 2, 2022 | doi: 10.5365/wpsar.2022.13.2.914 https://ojs.wpro.who.int/4 healey et alcommunity leaders’ roles and responses to covid-19 the leadership role entrusted to the participants also brought ongoing responsibility and accountability. participants reported performing leadership roles by seeking out and conveying accurate covid-19 information to the community in ways that were understood by the community. similarly, in the ebola response, community engagement by health services that actively partnered with respected leaders and other community mobilizers was critical to success.10 during ebola outbreaks in central africa, members of communities bordering other countries trusted local leaders, not government health workers, as a source of information about ebola. similarly, the congolese community in australia has strong trust in community leaders. thus, public health solutions should be tailored to communities by listening to and learning from community leaders.11 furthermore, the ebola epidemic showed that a shift from the biomedical model for outbreak response towards a more holistic sociobehavioural model is necessary for policy-makers to achieve collective cooperation.12 such frameworks have been recommended for the covid-19 pandemic response worldwide.10,12 the thoughtful engagement of congolese community leaders has also been described in management of sensitive issues such as sexual and reproductive health.13 community leaders in the democratic republic of the congo hold strong influence over the community’s perception of sexual health, accessing of services, stigma and cultural taboos.13 by engaging community leaders respectfully with two-way discussions, leaders could become advocates for sensitive health issues within their community.13 respectful collaboration with community leaders allows public health messages to reach and be received by cald community members in a timely and meaningful way. the world health organization’s covid-19 global risk communication and community engagement strategy notes that community-centred participatory approaches provide opportunities for governments to support otherwise unreachable marginalized groups.10,14 this is done by identifying and collaborating with community leaders, to co-design and coordinate public health responses that are acceptable to the community.10,12 munities (table 2). for example, by interpreting and translating key public health messages and pitching them in ways that were understood by community members. one participant reflected: “most of us, we share the same language and background, so it’s an easy task to explain in their local language or in a language they understand”. participants described proactively using platforms familiar to community members (e.g. whatsapp). for example, participants called community members during lockdown periods, translated and voice-recorded covid-19 information and uploaded audio-links to share on social media. one participant explained that their response to act swiftly and dispel misinformation was in part “because as a community leader, my heart is to see people working within the regulation”. participants also took responsibility by passing on information to community members only after validating the information. one participant explained: “i like my source to be accurate; before spreading any information, i need to check the government and health website. that way i know”. lastly, participants described how networking opportunities allowed covid-19 information gained from their workplaces to benefit their community. one participant described the strength of their network in this way: “my tentacles reaches [sic] everywhere. so, in terms of getting useful information, it can come from anywhere”. discussion there is strong evidence supporting cald leader engagement in health care,1,2 but little is known about how community leadership is recognized and developed. some insights have emerged from this work where participants have become community leaders through social processes and recognition. commonality of culture and language were reported to be strong contributors to the community’s perception and trust of the participants as leaders. during the covid-19 pandemic in particular, being strong english speakers afforded our participants opportunities to network across african and non-african spaces, enhancing the flow of important public health messages. as described by the united nations high commissioner for refugees, higher-level education turns students into leaders.9 wpsar vol 13, no 2, 2022 | doi: 10.5365/wpsar.2022.13.2.914https://ojs.wpro.who.int/ 5 community leaders’ roles and responses to covid-19healey et al ethics statement this study received approval from the hunter new england human research ethics committee (approval no. 2020/eth02955). funding this project was funded by hunter new england health. references 1. seale h, heywood a, woodland l, harris-roxas b, mahimbo a, abdi i. enhancing and supporting the covid-19 vaccination program – focusing on culturally and linguistically diverse communities. sydney: university of new south wales; n.d. available from: https://sph.med. unsw.edu.au/sites/default/files/sphcm/news/enhancing-supportingcovid-19-vaccination-program.pdf, accessed 30 may 2021. 2. wild a, kunstler b, goodwin d, onyala s, zhang l, kufi m, et al. communicating covid-19 health information to culturally and linguistically diverse communities: insights from a participatory research collaboration. public health res pract. 2021;31(1):e3112105. doi:10.17061/phrp3112105 pmid:33690789 3. schmidt-sane mm, nielsen jo, chikombero m, lubowa d, lwanga m, gamusi j, et al. challenges to ebola preparedness during an ongoing outbreak: an analysis of borderland livelihoods and trust in uganda. plos one. 2020;15(3):e0230683. doi:10.1371/journal. pone.0230683 pmid:32214381 4. democratic republic of the congo refugee crisis explained. washington, dc: usa for unhcr, the un refugee agency; 2020. available from: https://www.unrefugees.org/news/democratic-republic-of-the-congo-refugee-crisis-explained/#who%20 is%20fleeing%20to%20the%20drc, accessed 14 july 2021. 5. ranard da. refugees from the democratic republic of the congo. washington, dc: cultural orientation resource center; 2014. available from: https://www.resettlement.eu/sites/icmc/files/ cal_congolesebackgrounder_013014_highres.pdf, accessed 27 september 2021. 6. tuwe k. the african oral tradition paradigm of storytelling as a methodological framework: employment experiences for african communities in new zealand. in: proceedings. 38th african studies association of australasia and the pacific conference, deakin university, australia, 28-30 october 2015. 7. green j, thorogood n. developing qualitative analysis. in: seaman j, editor. qualitative methods for health research, 4th ed. london: sage publications; 2018:285–311. 8. riessman, ck. narrative methods for the human sciences. thousand oaks, ca: sage publications; 2008. 9. stepping up: refugee education in crisis. geneva: unhcr, the un refugee agency; 2019. available from: https://www.unhcr.org/ steppingup/wp-content/uploads/sites/76/2019/09/education-report-2019-final-web-9.pdf, accessed 27 september 2021. 10. gilmore b, ndejjo r, tchetchia a, de claro v, mago e, diallo aa, et al. community engagement for covid-19 prevention and control: a rapid evidence synthesis. bmj glob health. 2020;5(10):e003188. doi:10.1136/bmjgh-2020-003188 pmid:33051285 the congolese community is diverse: the stories and experiences of the four english-speaking leaders interviewed may not represent other leaders in the hunter new england region and beyond, particularly those with limited english ability. the sociocultural context of communities may also impact the relationship between communities, leaders and governments, especially in settings of rapid change such as this pandemic; hence, governments need to be flexible and engaged. the lead mhrhs researchers are themselves of a cald background. therefore, particular stories and focus may have been drawn from the participants, bringing strength and opportunities for deeper conversation. the small number in this study suited the approach of narrative analysis – exploring the contextual stories and opinions of participants interviewed – but is a limitation. the covid-19 pandemic has precipitated responses from community leaders to fill a void in public health communication messaging. the congolese community in this study had access to people who were socially assigned and given responsibilities as leaders. these individuals were educated and multilingual, and had collaborative abilities and common cultural experiences. by nurturing two-way communication, government health services can learn and improve upon current methods of covid-19 messaging to reach cald communities, to further reduce risks to communities. the public health response in a pandemic should be underpinned by partnerships with leaders to reach common goals. further studies on leadership and engagement with cald communities are essential. acknowledgements the authors wish to respectfully acknowledge and thank the community leaders who shared their personal stories in this research study. conflicts of interest the authors are salaried employees of hunter new england health, under the new south wales ministry of health. wpsar vol 13, no 2, 2022 | doi: 10.5365/wpsar.2022.13.2.914 https://ojs.wpro.who.int/6 healey et alcommunity leaders’ roles and responses to covid-19 13. steven vj, deitch j, dumas ef, gallagher mc, nzau j, paluku a, et al. “provide care for everyone please”: engaging community leaders as sexual and reproductive health advocates in north and south kivu, democratic republic of the congo. reprod health. 2019;16(1):98. doi:10.1186/s12978-019-0764-z pmid:31286984 14. covid-19 global risk communication and community engagement strategy, december 2020 – may 2021: interim guidance, 23 december 2020. geneva: world health organization; 2020. available from: https://apps.who.int/iris/handle/10665/338057, accessed 27 february 2022. 11. risk communication and community engagement preparedness and readiness framework: ebola response in the democratic republic of congo in north kivu. geneva: world health organization; 2018. available from: https://apps. who.int/iris/handle/10665/275389, accessed 27 september 2021. 12. anoko jn, barry br, boiro h, diallo b, diallo ab, belizaire mr, et al. community engagement for successful covid-19 pandemic response: 10 lessons from ebola outbreak responses in africa. bmj global health 2020;4(suppl 7):e003121. doi:10.1136/bmjgh-2020-003121 pmid:32816819 https://ojs.wpro.who.int/ 1wpsar vol 12, no 2, 2021 | doi: 10.5365/wpsar.2020.11.2.016 outbreak investigation report i n december 2019, an outbreak of a novel coronavirus disease was reported from wuhan, china, in association with cases of severe pneumonia, and originally thought to be connected to a seafood market.1 novel coronavirus disease 2019 (covid-19), caused by the pathogen severe acute respiratory syndrome coronavirus 2 (sars-cov-2), has subsequently spread all over the world, with 1.5 million deaths as of early december 2020.2,3 viet nam shares a 1200 km border with china, previously had multiple direct flights from wuhan, and has had long-standing cultural and business ties with china, resulting in an increased risk of importation of sars-cov-2. the first covid-19 case in viet nam was detected in ho chi minh city on 22 january 2020. the patient was a chinese businessman from wuhan visiting his son, who subsequently became infected. shortly thereafter, a cluster of covid-19 cases was detected among vietnamese workers returning to the northern province of vinh phuc after 3 months of corporate training in wuhan. in the absence of approved, effective vaccines or therapeutics, intensive preventive measures were the recommended response to cases of covid-19.4 this investigation describes the characteristics of the first community outbreak in viet nam and the intensive intervention and preventive measures taken in response. methods setting vinh phuc province has an area of 1370.7 km2 and a population of 1 092 400 people. binh xuyen is one of seven districts in the province and includes 13 communes of approximately 10 000 people each. vinh phuc is approximately 51 km from hanoi, the capital of viet nam, and home to 8 million people. a national institute of hygiene and epidemiology, ministry of health, hanoi, viet nam. b agency of health examination and treatment, ministry of health, hanoi, viet nam. published: 27 april 2021 doi: 10.5365/wpsar.2020.11.2.016 objective: at the time of this study, the prevention of novel coronavirus disease 2019 (covid-19) relied solely on nonpharmaceutical interventions. implementation of these interventions is not always optimal and, consequently, several cases were imported into non-epidemic areas and led to large community outbreaks. this report describes the characteristics of the first community outbreak of covid-19 in viet nam and the intensive preventive measures taken in response. methods: cases were detected and tested for sars-cov-2 by real-time reverse transcriptase polymerase chain reaction. contact tracing and active surveillance were conducted to identify suspected cases and individuals at risk. clinical symptoms were recorded using a standardized questionnaire. results: in vinh phuc province from 20 january to 3 march 2020, there were 11 confirmed cases among 158 suspected cases and 663 contacts. nine of the confirmed cases (81.8%) had mild symptoms at the time of detection and two (18.2%) were asymptomatic; none required admission to an intensive care unit. five prevention and control measures were implemented, including quarantining a community of 10 645 individuals for 20 days. the outbreak was successfully contained as of 13 february 2020. discussion: in the absence of specific interventions, the intensive use of combined preventive measures can mitigate the spread of covid-19. the lessons learned may be useful for other communities. the first community outbreak of covid-19 in viet nam: description and lessons learned tran nhu duong,a le thi quynh mai,a nguyen tran hien,a ngu duy nghia,a nguyen trong khoa,b nguyen hai tuan,a tran anh tu,a ngo huy tu,a hoang vu mai phuonga and dang duc anha correspondence to dang duc anh (email: dda@nihe.org.vn). wpsar vol 12, no 2, 2021 | doi: 10.5365/wpsar.2020.11.2.016 https://ojs.wpro.who.int/2 duong et alfirst community outbreak of covid-19 in viet nam ethical considerations this investigation was approved by the institutional review board of the pasteur institute of ho chi minh city, the organization with oversight of national research protocols for covid-19. results the epidemiological characteristics were reported for 11 cases, 158 suspected cases and 214 close contacts. the intensive outbreak response, with its unique set of preventive measures, contributed to the successful containment of the covid-19 outbreak. epidemiology the first community outbreak of covid-19 occurred in vinh phuc province, where 11 cases were identified by contact tracing. to ensure complete case detection, attempts were made to identify all suspected cases between 30 january and 3 march 2020 – that is, from the day when the first case was detected to the last day of the lockdown. confirmed cases of the 158 suspected cases of covid-19, 11 cases were confirmed between 30 january and 3 march; the last confirmed case was identified on 12 february 2020 in vinh phuc province (table 1). five of these cases occurred among workers returning from wuhan (imported cases) and the remaining six were close contacts (locally transmitted cases) of the imported cases (fig. 1). nine of the confirmed cases (81.8%) occurred among binh xuyen residents: three cases were imported and six were locally transmitted (table 1). two subsequent cases (cases 10 and 11) were identified through contact tracing and regular follow up. of the two additional imported cases, one was a resident of the tam duong and one of the tam dao district (fig. 2). notably, all six locally transmitted cases could be linked either directly or indirectly to imported case number 2 (table 2, fig. 1). of the 11 confirmed cases, 8 were female (72.7%) and 3 were male (27.3%); the median age was 29.0 years (interquartile range [iqr]: 26.5–45.5). epidemiological investigation and laboratory methods we defined cases of covid-19 infection according to the viet nam ministry of health’s guidelines in effect at the time of our investigation.5 specifically, suspected cases of covid-19 infection were people with fever and cough, with or without shortness of breath, and either (i) a history of visiting wuhan, china, during the 14 days before onset of illness or (ii) close contact (within 2 m) with confirmed or suspected cases occurring from 17 january through 3 march 2020. this investigation was conducted from 20 january to 3 march 2020. confirmed cases were those who had laboratory confirmation of sars-cov-2 virus by real-time reverse-transcriptase polymerase chain reaction (rrt–pcr),6 regardless of whether they had symptoms. imported cases were defined as confirmed cases with a history of travel to an epidemic area within the 2 weeks before the date of onset of symptoms or the date of their first sample testing positive. locally transmitted covid-19 cases were defined as cases in vinh phuc province without a history of travel to an epidemic area. symptoms were recorded at onset or time of first positive test result. the duration of hospitalization and clinical outcomes were monitored for all confirmed cases. a close contact was defined as any individual who was within 2 m of a confirmed or suspected case during the case’s symptomatic period, including 3 days before symptom onset. a casual contact was defined as any individual who was further than 2 m from a confirmed or suspected case. we conducted a descriptive epidemiological analysis by characterizing all cases in terms of their demographics, clinical symptoms, interval from onset to hospital admission, if applicable, number of contacts and history of travel to an epidemic area. oropharyngeal swabs were collected from suspected cases and all of their contacts, including those without symptoms. testing by rrt–pcr was performed according to the charité institute of virology’s protocol, as recommended by the world health organization.6 wpsar vol 12, no 2, 2021 | doi: 10.5365/wpsar.2020.11.2.016https://ojs.wpro.who.int/ 3 first community outbreak of covid-19 in viet namduong et al table 1. results of case finding and contact tracing for novel coronavirus disease (covid-19), vinh phuc province, viet nam, january–march 2020 cases (18.2%) were asymptomatic at the collection date of their first specimen for testing by rrt–pcr, but the specimen tested positive. through case finding, we observed a decrease in the number of days that cases spent in the community before being hospitalized, with a median of 2 days (iqr: 2–3) for the five imported cases (cases 1, 2, 3, 4, 6) and 0 days (iqr: 0–0.75) for the six locally transmitted cases (cases 5, 7, 8, 9, 10, 11). the difference in delay in hospital admission between imported cases and locally transmitted cases was statistically nine confirmed cases (81.8%) had mild symptoms at the time of detection; no cases required admission to an intensive care unit. four out of five cases with imported covid-19 who had travelled to wuhan were symptomatic. the first case developed symptoms on 21 january 2020, 4 days after returning from wuhan (table 2). the most common symptoms were cough or fever, found in 8/11 cases (72.7%). two patients (18.2%) had both cough and fever (table 2). the less frequent symptoms of sore throat, headache, runny nose and fatigue were each found in one patient (9.1% for each of the four symptoms). two other confirmed location no. of confirmed cases no. of suspected cases with negative tests no. of close contacts no. of casual contacts all of vinh phuc province 11 147 214 449 binh xuyen district 9 99 149 200 son loi commune 6 40 70 52 all other communes 3 59 79 148 all other districts 2 48 65 249 0 1 2 3 15 j an ua ry 16 j an ua ry 17 j an ua ry 18 j an ua ry 19 j an ua ry 20 j an ua ry 21 j an ua ry 22 j an ua ry 23 j an ua ry 24 j an ua ry 25 j an ua ry 26 j an ua ry 27 j an ua ry 28 j an ua ry 29 j an ua ry 30 j an ua ry 31 j an ua ry 1 f eb ru ar y 2 f eb ru ar y 3 f eb ru ar y 4 f eb ru ar y 5 f eb ru ar y 6 f eb ru ar y 7 f eb ru ar y 8 f eb ru ar y 9 f eb ru ar y 10 f eb ru ar y 11 f eb ru ar y 12 f eb ru ar y 13 f eb ru ar y 14 f eb ru ar y 15 f eb ru ar y 16 f eb ru ar y 17 f eb ru ar y 18 f eb ru ar y 19 f eb ru ar y 20 f eb ru ar y 21 f eb ru ar y 22 f eb ru ar y 23 f eb ru ar y 24 f eb ru ar y 25 f eb ru ar y 26 f eb ru ar y 27 f eb ru ar y 28 f eb ru ar y 29 f eb ru ar y 1 m ar ch 2 m ar ch 3 m ar ch 4 m ar ch 5 m ar ch 6 m ar ch n um be r of c as es date of symptom onset , 2020 locally transmitted cases imported case return from wuhan lockdown implemented at commune lockdown lifted fig. 1. epidemic curve of novel coronavirus 2019 (covid-19) cases, by date of symptom onset, vinh phuc province, viet nam, january–february 2020 wpsar vol 12, no 2, 2021 | doi: 10.5365/wpsar.2020.11.2.016 https://ojs.wpro.who.int/4 duong et alfirst community outbreak of covid-19 in viet nam military school (described below), who was immediately transferred to the quang ha polyclinic hospital where a specimen was collected and subsequently tested positive by rrt–pcr. all 39 close contacts of the five imported cases were asymptomatic and were quarantined at the quang ha polyclinic and the military school, as were 95 other close contacts without symptoms. the remaining 80 close contacts were quarantined at home. outbreak response the field outbreak response was led by the vinh phuc provincial centre for disease control with support from the national institute of hygiene and epidemiology. the national steering committee for covid-19 prevention and control also deployed an expert technical significant (wilcoxon rank sum test: p = 0.011). the number of close contacts was not significantly different between the two groups (imported cases versus locally transmitted), with a median of 4 contacts (iqr: 4–6) of imported cases and 4.5 contacts (iqr: 4–5.75) of locally transmitted cases (p = 0.92). all cases recovered clinically, as assessed by the vietnamese ministry of health’s guidelines,7 and were discharged following two negative rrt–pcr tests of upper respiratory specimens collected at least 24 hours apart (table 2). close contacts a total of 214 close contacts were identified (table 1). six of these subsequently became confirmed cases, five of whom were tested and identified at home, and one, the father of case 2, who developed a sore throat and fatigue while quarantined at the local provincial fig. 2. map of binh xuyen district in vinh phuc province, viet nam, with an inset of son loi commune bold text indicates names of provinces. smaller text indicates commune names within the district. the circled numbers indicate the number of novel coronavirus 2019 (covid-19) cases in the relevant commune. green triangles indicate checkpoints. the dark blue dots indicate the locations of the quang ha polyclinic hospital and the provincial military school. wpsar vol 12, no 2, 2021 | doi: 10.5365/wpsar.2020.11.2.016https://ojs.wpro.who.int/ 5 first community outbreak of covid-19 in viet namduong et al contact tracing contact tracing was performed by the provincial centre for disease control. all suspected cases were interviewed to collect information about their close contacts, including health-care contacts, family members, coworkers, friends, neighbours, other social contacts and travelling companions. all contacts were subjected to quarantine and strict symptom monitoring. isolation and quarantine the five imported cases (cases 1–4, 6) were isolated and treated at the national hospital for tropical diseases in hanoi (table 2), since they were among the first imported cases in viet nam. outbreak surveillance team, a rapid response team, an expert treatment team and an infection control team to vinh phuc province to support local authorities in directing, monitoring and implementing all prevention activities. based on the descriptive epidemiology, interventions using a series of preventive measures were implemented. five doctors were deployed to each of the 13 commune health stations (chss) in the binh xuyen district (65 doctors in total) to ensure compliance with preventive measures. an additional 168 health-care workers at the district and commune levels were trained in case investigation, reporting, contact tracing, surface disinfection and the proper use of personal protective equipment (ppe). nhtd: national hospital for tropical diseases; qh poly: quang ha polyclinic hospital; nph: national paediatric hospital. a these patients were first admitted to quang ha polyclinic hospital (qh poly) then transferred to a national referral hospital to prevent complications; transfers included a patient with thrombocytopenia and a 3-month-old infant. b the outcome “survived” refers to clinical outcome at the time of hospital discharge. table 2. descriptive epidemiology of cases of novel coronavirus disease 2019 (covid-19), vinh phuc province, viet nam, 17 january to 26 february 2020 case gender age travel and contact history symptoms onset date hospital; date of admission date of discharge clinical outcomeb 1 male 29 years travelled from wuhan on 17 jan cough 21 jan nhtd; 23 jan 18 feb survived 2 female 24 years travelled from wuhan on 17 jan fever, cough, sore throat 25 jan nhtd; 26 jan 10 feb survived 3 female 29 years travelled from wuhan on 17 jan fever 26 jan nhtd; 2 feb 10 feb survived 4 male 30 years travelled from wuhan on 17 jan fever, cough 27 jan nhtd; 30 jan 10 feb survived 5 female 42 years visited case 2's home on 22 and 28 jan fever 31 jan qh poly; 31 jan 18 feb survived 6 female 29 years travelled from wuhan on 17 jan asymptomatic 3 jan qh poly; 5 feb 20 feb survived 7 female 49 years mother of case 2; same household cough 3 feb qh poly; 3 feb 18 feb survived 8 female 16 years younger sister of case 2; same household asymptomatic 4 feb qh poly;a 5 feb 20 feb survived 9 female 55 years visited case 2's home on 28 jan fever, headache 4 feb qh poly;a nhtd, 5 feb 18 feb survived 10 female 3 months stayed with case 2's family on 28–31 jan cough, runny nose 6 feb qh poly;a nph, 6 feb 20 feb survived 11 male 50 years father of case 2; same household fatigue 12 feb qh poly; 11 feb 26 feb survived wpsar vol 12, no 2, 2021 | doi: 10.5365/wpsar.2020.11.2.016 https://ojs.wpro.who.int/6 duong et alfirst community outbreak of covid-19 in viet nam community lockdown intensive lockdown measures were taken after the identification of three locally transmitted cases in the son loi commune on 7 february. we worked with local authorities and implemented preventive control measures in the commune. a 20-day lockdown of the entire commune of 10 645 residents began with the establishment of eight checkpoints on 8 february and four more were added between 9 and 13 february. the lockdown officially started at midnight on february 13. twelve checkpoints were established by 14 february and were in place until 3 march (fig. 2). the checkpoints were inspected regularly by 30 independent monitoring teams designated by the provincial steering committee for covid-19 prevention and control. residents of son loi were permitted to leave for work in nearby fields or emergency purposes, but they were required to register at checkpoints and inform local authorities of when they would return. visitors were only permitted to deliver supplies (e.g. food, water) to the checkpoints, from which they were collected and distributed within the commune. all task force staff and visitors without symptoms and with a forehead temperature <37.5 °c were permitted to enter. merchandise and vehicles entering and exiting son loi were inspected and disinfected with 0.1% chloramine b solution. shops with fixed prices for staple foods, such as rice, noodles, meat and vegetables, were established during the lockdown in each of the six hamlets of son loi. each member of the commune received a daily allowance of 40 000 vietnamese dong (us$ 1.70) for the 20-day duration of the lockdown. residents were recommended to clean their houses and domestic surfaces daily with 0.1% chloramine b solution, wear masks and stay home as much as possible. mass gatherings, such as festivals and weddings, were prohibited during the lockdown. risk communication messages were delivered three times a day via loudspeakers throughout the commune. a team of medical experts was sent to the son loi chs to support the rapid identification of suspected cases and to meet any emergency needs of the residents. two ambulances were always on duty at the chs. a the initial hospital isolation and treatment implemented in vinh phuc province occurred at the quang ha polyclinic hospital, a district hospital in binh xuyen. it was divided into six sections, one each for: • isolation and treatment of laboratory confirmed cases; • suspected cases with pending test results; • family members of confirmed cases; • symptomatic patients whose first covid-19 test was negative but who required 14 days of observation; • those who had recovered fully from covid-19; and • suspected cases and close contacts who tested positive for influenza or other respiratory viruses. patients in the isolation facility had their temperature and symptoms checked twice daily. for those with symptoms, temperature and symptom checks were performed four times per day. suspected cases from other districts were isolated at the vinh phuc provincial hospital. the local provincial military school was converted into a quarantine centre for close contacts who were not family members of cases. beds were placed 1 to 2 metres apart. those who were quarantined or isolated received three meals a day free of charge and full support and daily supplies. waste was separated into potentially contaminated waste (e.g. masks and tissues) and all other waste. temperature and symptom checks were conducted twice daily. we collected oropharyngeal specimens for laboratory testing from each contact under quarantine, once on day 2 and once on day 14 before discharge. we delivered risk communication messages to all quarantined contacts each day. four suspected cases were identified in the facility and were transferred to quang ha polyclinic. one of these four suspected cases became case 11. all discharged contacts from the quarantine centre remained under home quarantine for 2 more weeks. no locally transmitted cases were identified among health-care workers in the quang ha polyclinic or among staff at the military school quarantine centre. wpsar vol 12, no 2, 2021 | doi: 10.5365/wpsar.2020.11.2.016https://ojs.wpro.who.int/ 7 first community outbreak of covid-19 in viet namduong et al from wuhan or were in close contact with one of these people. given the transmissibility of sars-cov-2, this cluster had the potential to be much larger.4,5 the majority of clinical manifestations in the confirmed cases included cough or fever, or both.9 about 20% of cases were asymptomatic, a low prevalence compared with previous reports.10 the time from onset of symptoms or detection of a case to hospital admission for isolation and treatment was short, most likely due to the careful monitoring of suspected cases and close contacts at the hospital and at the quarantine centre. since cases may be infectious for 1–3 days before symptom onset and thus contribute to community transmission,11 it is crucial to identify both symptomatic and asymptomatic cases for isolation and quarantine.12–14 the interval from symptom onset to hospital admission or isolation was reduced from 2 days to 0 during this outbreak as a result of efforts by local public health staff to limit the spread of cases. the delay between symptom onset and isolation has been shown to have the largest role in determining the degree of community transmission from imported cases.15 therefore, early detection and careful monitoring of suspected cases and close contacts can reduce the time that potential cases spend in the community; by committing to early detection and careful monitoring, vinh phuc province may have limited the spread of covid-19 during the first community outbreak in viet nam. the control measures implemented in response to this outbreak occurred 3 days after locally transmitted cases were identified in the community. this quick response was feasible with the government’s assistance and because of the informed decisions made in near real-time by the national steering committee as its rapid response team was deployed to vinh phuc province. the establishment of quarantine and treatment facilities at the district level facilitated and supported timely case detection, contact tracing and quarantining of people at risk, which may have contributed to reducing the spread of covid-19 in the community. the decision to implement a community lockdown for 20 days was supported by vietnamese government decree no. 101/2010/nd-cp.16 similar measures were implemented in china in 2003 in response to severe acute respiratory syndrome17 and, more recently, in response to covid-19 in singapore.11 recent analysis suggests that increased compliance with community mitigation mobile x-ray unit was acquired by the son loi chs, a device not available at most chss in viet nam. active case finding active case finding was performed during the lockdown. a total of 29 community covid-19 prevention and control teams (cpcts) were formally established. the teams consisted of three or four members, and included village health-care workers, volunteers and community or family representatives. the teams performed daily house-to-house health checks, including taking the temperature of all household members and delivering risk mitigation messages. each household was provided with a thermometer so that symptomatic family members could have their temperature assessed and reported to the team by calling a dedicated phone number. no cases were identified during active case finding. general preventive measures for people in the commune, general preventive measures were required at all times, including wearing masks, using other ppe, disinfecting surfaces and using hand sanitizer. in addition to the recommended general preventive measures, all hospitalized patients, quarantined individuals, suspected cases and close contacts of confirmed cases were also required to wear masks at all times. all staff working at the chss, the military school and quang ha polyclinic; members of the cpcts; and personnel at other medical facilities in vinh phuc consistently wore a complete set of ppe, including a whole-body suit, gloves, eye protection and a surgical mask. all were encouraged to practice hand hygiene regularly, before and after meals, before and after caring for patients, and after using the toilet. surface disinfection of hallways with 0.1% chloramine b solution was performed daily in health-care and quarantine facilities. all vehicles entering and exiting the military school campus, cars transporting suspected cases and ambulances were disinfected daily with 0.1% chloramine b solution. discussion during the first community outbreak of covid-19 in viet nam, 11 of 158 (6.9%) suspected cases tested positive for covid-19, indicating a low rate of infection.8 these 11 cases were identified in people who returned wpsar vol 12, no 2, 2021 | doi: 10.5365/wpsar.2020.11.2.016 https://ojs.wpro.who.int/8 duong et alfirst community outbreak of covid-19 in viet nam in conclusion, in covid-19 response activities, the government’s assistance and the willingness of the community to adopt preventive measures are important in containing community outbreaks. when no vaccine is available, intensive interventions that involve a combination of preventive measures can mitigate spread of the disease. we believe that these experiences are useful for other communities that may need to respond to the covid-19 pandemic. acknowledgments the authors are grateful to the vingroup innovation foundation in viet nam, the centre for disease control and prevention of vinh phuc province and the district health centre of binh xuyen in vinh phuc province. the authors also acknowledge dr matthew r moore from the united states centers for disease control and prevention in viet nam for his for support in editing the manuscript. conflicts of interests the authors declare that there are no conflicts of interest. funding this study has been sponsored by the vingroup innovation foundation (grant number đtđlcn.32/20). the sponsor had no role in study design, data collection, data analysis and interpretation and no role in the decision to submit the manuscript for publication. references 1. sun p, lu x, xu c, sun w, pan b. understanding of covid-19 based on current evidence. j med virol. 2020;92(6):548–51. doi:10.1002/jmv.25722. 2. mccreary ek, pogue jm. coronavirus disease 2019 treatment: a review of early and emerging options. open forum infect dis. 2020;7(4):ofaa105. doi:10.1093/ofid/ofaa105. 3. covid-19 weekly epidemiological update – 8 december 2020. geneva: world health organization; 2020. available from: https:// www.who.int/publications/m/item/weekly-epidemiological-update8-december-2020, accessed 11 december 2020. 4. güner r, hasanoğlu i̇, aktaş f. covid-19: prevention and control measures in community. turk j med sci. 2020;50(si-1):571–7. doi:10.3906/sag-2004-146. 5. decision no. 343/qd-byt dated february 07, 2020 on promulgation of “interim guidelines for monitoring, prevention and control of covid-19”. hanoi: ministry of health; 2020. available from: https://thuvienphapluat.vn/van-ban/en/the-thao-y-te/decision343-qd-byt-2020-promulgation-of-interim-guidelines-for-monitoring-prevention-of-covid-19/436977/tieng-anh.aspx, accessed 22 september 2020. strategies, including physical distancing, when the number of cases is increasing can reduce community transmission.18 when first implemented, large-scale lockdown of communities can be highly disruptive. however, if it is implemented quickly and at a smaller scale, that disruption can be minimized and, importantly, disease transmission is more likely to be contained. in son loi commune, the lockdown was implemented for no longer than necessary, and the reason for it was to reduce pressure on the health, economic and social security of the people in the commune.19 our investigation took place at a time when there was no effective vaccine or treatment and the national public health response in viet nam was still developing. this created several challenges. for example, at the time when the employees returned from wuhan, there was no national or international guidance on how to detect or manage asymptomatic cases. therefore, we had to adopt what we believed to be sensible public health interventions, assuming that asymptomatic cases could transmit sars-cov-2 and, thus, isolating them as if they were infectious. the conventional rrt–pcr assay was not readily available at central laboratories before 30 january 2020, so we often erred on the side of isolation and quarantine, knowing that suspected cases and contacts might have to wait several days for test results. our investigation began near the time of the annual lunar new year (tet) holiday, the largest holiday in viet nam and a time when most government offices and businesses are closed. as such, we were not able to access all available resources. nevertheless, despite these challenges, we were able to contain the outbreak in vinh phuc and prevent further transmission. the experiences gained through the response to this outbreak were indispensable for the development of subsequent national guidelines.20–23 this investigation has several limitations. the five cases with a history of travel to an epidemic area were considered imported cases; however, we were unable to determine when and where they were infected with the sars-cov-2 virus. the transmission of pathogens among these five cases was unclear. furthermore, the effectiveness of each preventive measure was not separately assessed, so we do not know exactly which measures played key roles in the combined intervention. https://doi.org/10.1002/jmv.25722 https://www.ncbi.nlm.nih.gov/entrez/query.fcgi?cmd=retrieve&db=pubmed&list_uids=32096567&dopt=abstract https://doi.org/10.1093/ofid/ofaa105 https://www.who.int/publications/m/item/weekly-epidemiological-update-8-december-2020 https://www.who.int/publications/m/item/weekly-epidemiological-update-8-december-2020 https://www.who.int/publications/m/item/weekly-epidemiological-update-8-december-2020 https://doi.org/10.3906/sag-2004-146 https://thuvienphapluat.vn/van-ban/en/the-thao-y-te/decision-343-qd-byt-2020-promulgation-of-interim-guidelines-for-monitoring-prevention-of-covid-19/436977/tieng-anh.aspx https://thuvienphapluat.vn/van-ban/en/the-thao-y-te/decision-343-qd-byt-2020-promulgation-of-interim-guidelines-for-monitoring-prevention-of-covid-19/436977/tieng-anh.aspx https://thuvienphapluat.vn/van-ban/en/the-thao-y-te/decision-343-qd-byt-2020-promulgation-of-interim-guidelines-for-monitoring-prevention-of-covid-19/436977/tieng-anh.aspx wpsar vol 12, no 2, 2021 | doi: 10.5365/wpsar.2020.11.2.016https://ojs.wpro.who.int/ 9 first community outbreak of covid-19 in viet namduong et al 16. decree no. 101/2010/nd-cp dated september 30, 2010, on guildelines for the law on medical examination and treatment in terms of implementation of isolation measures, enforced isolation measures and specific anti-epidemic measures during the epidemic period. hanoi: government of viet nam; 2010. available from: https://vanbanphapluat.co/decree-101-2010-nd-cp-guildelines-lawon-examination-treatment-of-implementation-isolation-measures, accessed 21 october 2020. 17. twu sj, chen tj, chen cj, olsen sj, lee lt, fisk t, et al. control measures for severe acute respiratory syndrome (sars) in taiwan. emerg infect dis. 2003;9(6):718–20. doi:10.3201/ eid0906.030283. 18. lasry a, kidder d, hast m, poovey j, sunshine g, winglee k, et al. timing of community mitigation and changes in reported covid-19 and community mobility — four u.s. metropolitan areas, february 26–april 1, 2020. morb mortal wkly rep. 2020;69(15):451–7. doi:10.15585/mmwr.mm6915e2. 19. brooks sk, webster rk, smith le, woodland l, wessely s, greenberg n, et al. the psychological impact of quarantine and how to reduce it: rapid review of the evidence. lancet. 2020;395:912–20. doi:10.1016/s0140-6736(20)30460-8. 20. decision no. 963/qd-byt dated march 18, 2020, promulgation of interim guidance for monitoring, prevention and control of covid-19. hanoi: ministry of health; 2020. available from: https:// thuvienphapluat.vn/van-ban/the-thao-y-te/quyet-dinh-963-qdbyt-2020-huong-dan-tam-thoi-giam-sat-va-phong-chong-covid-19-437400.aspx, accessed 4 may 2020. 21. decision 904 /qd-byt dated march 16, 2020, guide to implementing medical isolation in areas with covid-19 outbreaks. hanoi: ministry of health; 2020. available from: https://thuvienphapluat.vn/van-ban/the-thao-y-te/quyet-dinh-904-qd-byt-2020so-tay-huong-dan-to-chuc-thuc-hien-cach-ly-y-te-vung-co-dichcovid-19-437253.aspx, accessed 20 october 2020. 22. decision no. 878/qd-byt dated march 03, 2020, on promulgation of the guidance on covid-19 quarantine at quarantine facilities. hanoi: ministry of health; 2020. available from: https://thuvienphapluat.vn/van-ban/the-thao-y-te/quyet-dinh-878-qd-byt-2020cach-ly-y-te-tai-co-so-cach-ly-tap-trung-phong-chong-dich-covid-19-437133.aspx, accessed 20 october 2020. 23. decision 879/qd-byt dated march 12, 2020, guidelines for medical isolation at homes or accommodations to prevent epidemic diseases covid-19. hanoi: ministry of health; 2020. available from: https://thuvienphapluat.vn/van-ban/the-thao-y-te/quyet-dinh879-qd-byt-2020-huong-dan-cach-ly-y-te-tai-nha-noi-luu-truphong-chong-dich-covid-19-437036.aspx, accessed 20 october 2020. 6. corman v, bleicker t, brünink s, drosten c, landt o, koopmans m, et al. diagnostic detection of 2019 novel coronavirus (2019ncov) by real-time rt-pcr. euro surveill. 2020;25(3):2000045. doi:10.2807/1560-7917.es.2020.25.3.2000045. 7. decision 322 /qd-byt guideline on the diagnosis and treatment of acute respiratory infections caused by new corona virus strains (2019-ncov). hanoi: ministry of health; 2020. available from: https://thuvienphapluat.vn/van-ban/the-thao-y-te/quyet-dinh322-qd-byt-2020-huong-dan-chan-doan-dieu-tri-viem-duongho-hap-cap-tinh-do-corona-434129.aspx, accessed 20 september 2020. 8. hsih wh, cheng my, ho mw, chou ch, lin pc, chi cy, et al. featuring covid-19 cases via screening symptomatic patients with epidemiologic link during flu season in a medical center of central taiwan. j microbiol immunol infect. 2020;53(3):459–66. doi:10.1016/j.jmii.2020.03.008. 9. guan w, ni z, hu y, liang w, ou c, he j, et al. clinical characteristics of coronavirus disease 2019 in china. n engl j med. 2020;382:1708–20. doi:10.1056/nejmoa2002032. 10. kimball a, hatfield km, arons m, james a, taylor j, spicer k, et al. asymptomatic and presymptomatic sars-cov-2 infections in residents of a long-term care skilled nursing facility – king county, washington, march 2020. morb mortal wkly rep. 2020;69(13):377–81. doi:10.15585/mmwr.mm6913e1. 11. wei we, li z, chiew cj, yong se, toh mp, lee vj. presymptomatic transmission of sars-cov-2 singapore, january 23-march 16, 2020. morb mortal wkly rep. 2020;69(14):411–5. doi:10.15585/ mmwr.mm6914e1. 12. cai j, sun w, huang j, gamber m, wu j, he g. indirect virus transmission in cluster of covid-19 cases, wenzhou, china, 2020. emerg infect dis. 2020;26(6):1343–5. doi:10.3201/ eid2606.200412. 13. kronbichler a, kresse d, yoon s, lee kh, effenberger m, shin j. il. asymptomatic patients as a source of covid-19 infections: a systematic review and meta-analysis. int j infect dis. 2020;98:180–6. doi:10.1016/j.ijid.2020.06.052. 14. le tqm, takemura t, moi ml, nabeshima t, nguyen lkh, hoang vmp, et al. severe acute respiratory syndrome coronavirus 2 shedding by travelers, vietnam, 2020. emerg infect dis. 2020;26(7):1624–6. doi:10.3201/eid2607.200591. 15. hellewell j, abbott s, gimma a, bosse ni, jarvis ci, russell tw, et al. feasibility of controlling covid-19 outbreaks by isolation of cases and contacts. lancet glob health. 2020;8(4):e488–96. doi:10.1016/s2214-109x(20)30074-7. https://vanbanphapluat.co/decree-101-2010-nd-cp-guildelines-law-on-examination-treatment-of-implementation-isolation-measures https://vanbanphapluat.co/decree-101-2010-nd-cp-guildelines-law-on-examination-treatment-of-implementation-isolation-measures file:///c:\users\mir\documents\m-work\who wpsar\january 2021\2 returned from au\(https:\thuvienphapluat.vn\van-ban\the-thao-y-te\quyet-dinh-963-qd-byt-2020-huong-dan-tam-thoi-giam-sat-va-phong-chong-covid-19-437400.aspx file:///c:\users\mir\documents\m-work\who wpsar\january 2021\2 returned from au\(https:\thuvienphapluat.vn\van-ban\the-thao-y-te\quyet-dinh-963-qd-byt-2020-huong-dan-tam-thoi-giam-sat-va-phong-chong-covid-19-437400.aspx file:///c:\users\mir\documents\m-work\who wpsar\january 2021\2 returned from au\(https:\thuvienphapluat.vn\van-ban\the-thao-y-te\quyet-dinh-963-qd-byt-2020-huong-dan-tam-thoi-giam-sat-va-phong-chong-covid-19-437400.aspx file:///c:\users\mir\documents\m-work\who wpsar\january 2021\2 returned from au\(https:\thuvienphapluat.vn\van-ban\the-thao-y-te\quyet-dinh-963-qd-byt-2020-huong-dan-tam-thoi-giam-sat-va-phong-chong-covid-19-437400.aspx https://thuvienphapluat.vn/van-ban/the-thao-y-te/quyet-dinh-904-qd-byt-2020-so-tay-huong-dan-to-chuc-thuc-hien-cach-ly-y-te-vung-co-dich-covid-19-437253.aspx https://thuvienphapluat.vn/van-ban/the-thao-y-te/quyet-dinh-904-qd-byt-2020-so-tay-huong-dan-to-chuc-thuc-hien-cach-ly-y-te-vung-co-dich-covid-19-437253.aspx https://thuvienphapluat.vn/van-ban/the-thao-y-te/quyet-dinh-904-qd-byt-2020-so-tay-huong-dan-to-chuc-thuc-hien-cach-ly-y-te-vung-co-dich-covid-19-437253.aspx https://thuvienphapluat.vn/van-ban/the-thao-y-te/quyet-dinh-904-qd-byt-2020-so-tay-huong-dan-to-chuc-thuc-hien-cach-ly-y-te-vung-co-dich-covid-19-437253.aspx https://thuvienphapluat.vn/van-ban/the-thao-y-te/quyet-dinh-878-qd-byt-2020-cach-ly-y-te-tai-co-so-cach-ly-tap-trung-phong-chong-dich-covid-19-437133.aspx https://thuvienphapluat.vn/van-ban/the-thao-y-te/quyet-dinh-878-qd-byt-2020-cach-ly-y-te-tai-co-so-cach-ly-tap-trung-phong-chong-dich-covid-19-437133.aspx https://thuvienphapluat.vn/van-ban/the-thao-y-te/quyet-dinh-878-qd-byt-2020-cach-ly-y-te-tai-co-so-cach-ly-tap-trung-phong-chong-dich-covid-19-437133.aspx https://thuvienphapluat.vn/van-ban/the-thao-y-te/quyet-dinh-878-qd-byt-2020-cach-ly-y-te-tai-co-so-cach-ly-tap-trung-phong-chong-dich-covid-19-437133.aspx https://thuvienphapluat.vn/van-ban/the-thao-y-te/quyet-dinh-879-qd-byt-2020-huong-dan-cach-ly-y-te-tai-nha-noi-luu-tru-phong-chong-dich-covid-19-437036.aspx https://thuvienphapluat.vn/van-ban/the-thao-y-te/quyet-dinh-879-qd-byt-2020-huong-dan-cach-ly-y-te-tai-nha-noi-luu-tru-phong-chong-dich-covid-19-437036.aspx https://thuvienphapluat.vn/van-ban/the-thao-y-te/quyet-dinh-879-qd-byt-2020-huong-dan-cach-ly-y-te-tai-nha-noi-luu-tru-phong-chong-dich-covid-19-437036.aspx https://dx.doi.org/10.2807%2f1560-7917.es.2020.25.3.2000045 https://thuvienphapluat.vn/van-ban/the-thao-y-te/quyet-dinh-322-qd-byt-2020-huong-dan-chan-doan-dieu-tri-viem-duong-ho-hap-cap-tinh-do-corona-434129.aspx https://thuvienphapluat.vn/van-ban/the-thao-y-te/quyet-dinh-322-qd-byt-2020-huong-dan-chan-doan-dieu-tri-viem-duong-ho-hap-cap-tinh-do-corona-434129.aspx https://thuvienphapluat.vn/van-ban/the-thao-y-te/quyet-dinh-322-qd-byt-2020-huong-dan-chan-doan-dieu-tri-viem-duong-ho-hap-cap-tinh-do-corona-434129.aspx https://doi.org/10.1016/j.jmii.2020.03.008 https://dx.doi.org/10.1056%2fnejmoa2002032 https://dx.doi.org/10.1056%2fnejmoa2002032 http://dx.doi.org/10.15585/mmwr.mm6913e1 https://www.ncbi.nlm.nih.gov/entrez/query.fcgi?cmd=retrieve&db=pubmed&list_uids=32240128&dopt=abstract doi: 10.3201/eid2607.200591 https://doi.org/10.1016/s2214-109x(20)30074-7 https://ojs.wpro.who.int/ 1wpsar vol 12, no 3, 2021 | doi:10.5365/wpsar.2020.11.4.002 original research v iet nam recorded its first two cases of infection with severe acute respiratory syndrome coronavirus 2 (sars-cov-2), the virus that causes novel coronavirus disease 2019 (covid-19), on 23 january 2020.1 as of 12 may 2021, the country had recorded 3658 covid-19 cases; 2636 (72.0%) people had recovered, 35 (1.0%) deaths were reported and 983 (26.9%) cases were still under observation.2 the serology and cell culture laboratory at the pasteur institute of nha trang is a biosafety level 2 facility that serves as the reference laboratory for 11 provinces in the central coast region of viet nam (fig. 1). between 9 march and 9 april 2020, the pasteur institute tested 6607 patient respiratory specimens (oral and nasopharyngeal swabs) for sarscov-2 using real-time reverse transcription polymerase chain reaction (rt-pcr). testing was conducted on repeated specimens from confirmed cases to monitor viral rna shedding and to inform medical management and disposition. during this time, 15 covid-19 cases were detected within the area serviced by the pasteur institute. binh thuan general hospital, located in one of the southern provinces in the central coast region (fig. 1), a pasteur institute of nha trang, nha trang, viet nam. b binh thuan general hospital, binh thuan, viet nam. c binh thuan center for disease control, binh thuan, viet nam. d united states centers for disease control and prevention, hanoi, viet nam. e provincial department of health, binh thuan, viet nam. published: 12 july 2021 doi:10.5365/wpsar.2020.11.4.002 objective: to determine whether environmental surface contamination with severe acute respiratory syndrome coronavirus 2 (sars-cov-2) occurred at a provincial hospital in viet nam that admitted patients with novel coronavirus disease 2019 (covid-19) and at the regional reference laboratory responsible for confirmatory testing for sars-cov-2 in 2020. methods: environmental samples were collected from patient and staff areas at the hospital and various operational and staff areas at the laboratory. specimens from frequently touched surfaces in all rooms were collected using a moistened swab rubbed over a 25 cm2 area for each surface. the swabs were immediately transported to the laboratory for testing by realtime reverse transcription polymerase chain reaction (rt-pcr). throat specimens were collected from staff at both locations and were also tested for sars-cov-2 using real-time rt-pcr. results: during the sampling period, the laboratory tested 6607 respiratory specimens for sars-cov-2 from patients within the region, and the hospital admitted 9 covid-19 cases. regular cleaning was conducted at both sites in accordance with infection prevention and control (ipc) practices. all 750 environmental samples (300 laboratory and 450 hospital) and 30 staff specimens were negative for sars-cov-2. discussion: ipc measures at the facilities may have contributed to the negative results from the environmental samples. other possible explanations include sampling late in a patient’s hospital stay when virus load was lower, having insufficient contact time with a surface or using insufficiently moist collection swabs. further environmental sampling studies of sarscov-2 should consider including testing for the environmental presence of viruses within laboratory settings, targeting the collection of samples to early in the course of a patient’s illness and including sampling of confirmed positive control surfaces, while maintaining appropriate biosafety measures. environmental sampling for sars-cov-2 at a reference laboratory and provincial hospital in central viet nam, 2020 thái hùng đỗ,a văn thành nguyễn,b thế hùng đinh,c xuân huy lê,a quang chiêu nguyễn,b văn quân lê,c bảo triệu nguyễn,a ngọc bích ngân nguyễn,b thị ngọc phúc nguyễn,c kim mai huỳnh,a hoàng long trịnh,a thị kim trang lê,a thùy dung diệp,a thủy thị thu đỗ,d hiền thị thu bùi,d alyssa m finlay,d quốc việt nguyễne and philip l gouldd correspondence to philip l gould (email: ffa9@cdc.gov) wpsar vol 12, no 3, 2021 | doi:10.5365/wpsar.2020.11.4.002 https://ojs.wpro.who.int/2 đỗ et alsars-cov-2 environmental sampling at a laboratory admitted to 3 separate rooms and had periodic testing of respiratory specimens for sars-cov-2 to monitor for illness and the clinical course. during the time the cases were hospitalized, there were other patients with other medical problems housed within different departments of the general hospital. the sars-cov-2 virus has been shown to persist on a variety of surfaces,4,5 with reports of environmental contamination in patient care settings.6–8 however, understanding is limited about environmental contamination in laboratories handling patient specimens. the objective of this study was to assess whether any environmental contamination occurred at the general hospital or the laboratory at the pasteur institute at the time when covid-19 cases were hospitalized postdiagnosis. cared for 9 of the 15 covid-19 cases from the central coast region (60%) from 9 march to 9 april 2020. the 9 cases were epidemiologically linked as one cluster, either as household contacts or close contacts at work. only the index case was symptomatic, with onset on 5 march and symptoms including fever, productive cough and sore throat; the index case was hospitalized on 9 march after a respiratory specimen tested positive for sars-cov-2 by real-time rt-pcr. the other 8 cases were identified through contact tracing from the index case or were subsequently identified positive contacts, and all were asymptomatic. all 9 cases were admitted to the general hospital between 9 and 11 march, due to viet nam’s policy of isolating positive cases within hospitals even when they are asymptomatic. the policy is a more aggressive isolation approach than that in many countries but contributes to the relative success in controlling the ongoing pandemic.3 the 9 patients were fig. 1. map of the central coast region of viet nam, showing the location of binh thuan general hospital and the pasteur institute of nha trang and the areas covered by the sampling for sars-cov-2, 2020 quang nam provincial hospital (1 case not associated with the binh thuan cluster; specimens sent to pasteur institute) provinces submitting ≥1 patient sample with a positive sars-cov-2 test result during the sampling period central provinces referring samples to pasteur institute of nha trang pasteur institute of nha trang binh thuan provincial hospital wpsar vol 12, no 3, 2021 | doi:10.5365/wpsar.2020.11.4.002https://ojs.wpro.who.int/ 3 sars-cov-2 environmental sampling at a laboratoryđỗ et al single swab dipped into a universal transport medium tube (utm 330c transport system 16×100 mm tube with 3 ml utm medium, copan diagnostics, murrieta, california, usa) was used to swab a 25 cm2 surface area and was immediately returned to the tube. specimens were either transported immediately or stored at 2–8 °c while awaiting transport to the laboratory and shipped to arrive at the laboratory within 72 hours from collection; at the laboratory, they were processed immediately or stored at –70 °c. laboratory testing all environmental samples, including from the patients’ room used as a control, were tested for sars-cov-2 by real-time rt-pcr using the charité berlin research institute protocol, including using positive and negative controls.10 the rna was extracted manually by using the qiaamp dsp viral rna mini extraction kit (qiagen, venlo, the netherlands) according to the manufacturer’s specifications. the positive controls were prepared by viet nam’s national institute for hygiene and epidemiology from cultured virus at 10–3 dilution derived from patients’ specimens and shared with the laboratory at the pasteur institute; cycle threshold (ct) values for the positive control were between 26 and 28 cycles. cleaning practices information on the cleaning regimens at the pasteur institute and the general hospital were obtained by the staff at each institution. results testing conducted at the pasteur institute during the environmental sampling period at the pasteur institute’s laboratory (23 march to 9 april 2020), the workload comprised testing for sars-cov-2 by real-time rt-pcr of 6607 respiratory specimens from patients. of these, 19 (0.3%) specimens were positive for sarscov-2 (fig. 2). • from patients a–h and j on 23 march (9 positive tests); • from patient b on 27 and 30 march and on 1 and 3 april (4 positive tests); methods sample collection staff at both binh thuan general hospital and the reference laboratory at the pasteur institute of nha trang were trained virtually in sample collection through lectures, demonstrations and a question and answer session. a rapid practical competency assessment was performed by observing staff conducting procedures via real-time video conferencing. at the general hospital, staff collected environmental samples during 6 days, between 26 and 31 march, from all 3 rooms (each with a separate bathroom) used to isolate covid-19 cases, 2 staff rooms used by health care workers caring for covid-19 cases and one control room where internal medicine patients were treated who had no signs and symptoms of or known epidemiological risk factors for covid-19, in accordance with world health organization (who) guidelines.9 frequently touched surfaces, including those touched by the covid-19 cases (e.g. light switches, doorknobs and bed rails; table 1), were sampled before and at least 1 hour after afternoon cleaning. at the pasteur institute, microbiology laboratory staff collected environmental samples from 6 rooms: those used for receiving, processing and extracting specimens, and preparing the master mix for rt-pcr; as well as the pcr machine room; and the staff room. frequently touched surfaces (e.g. doorknobs, countertops, light switches and faucet handles; table 2) likely to be touched by laboratory workers processing patients’ specimens were swabbed on 6 days between 23 march and 9 april. two samples were collected each day: 1 hour before and 1 hour after afternoon cleaning and decontamination. staff working in the hospital and the laboratory had throat specimens collected and tested by real-time rt-pcr at the pasteur institute before the environmental samples were collected in either location. surfaces were sampled using puritan standard sterile polyester tipped applicators with a solid polystyrene handle (number 25–806 1pd; puritan medical products, guilford, maine, usa). following who’s environmental sampling protocol,9 for each sample, a wpsar vol 12, no 3, 2021 | doi:10.5365/wpsar.2020.11.4.002 https://ojs.wpro.who.int/4 đỗ et alsars-cov-2 environmental sampling at a laboratory infection prevention and control practices the cleaning regimen at the general hospital included twice daily cleaning of surfaces – including medical equipment, beds, dining tables, television controls, call buttons, doors, bedside cupboards and bed rails – with a disinfectant solution containing 0.05% chlorine. cleaners worked in sequence from low-risk areas to high-risk areas. floors were also cleaned twice a day with the same disinfectant solution. at the pasteur institute twice weekly cleaning of surfaces, floors and doors was done with 0.05% chlorine solution. daily cleaning and disinfection of other surfaces (e.g. desks, biosafety cabinet floors, pipettes, doorknobs) • from patient g on 27 and 30 march and on 3 april (3 positive tests); • from a patient in quang nam (not part of the cluster in binh thuan, but who had tests submitted to the pasteur institute laboratory) on 23, 26 and 28 march (3 positive tests). two patients admitted to the general hospital had respiratory specimens that were positive for sars-cov-2 during the hospital’s environmental sampling period of 26–31 march 2020 (patients b and g). the ct values in the specimens positive for the e gene ranged from 20.00 to 31.57, with an average of 27.25; for the rdrp gene, the ct values ranged from 23.72 to 37.10, with an average of 31.30. table 1. locations where environmental surfaces were sampled for sars-cov-2 and number of samples collected from each surface at binh thuan general hospital, viet nam, 26–31 march 2020 a empty cells indicate that no samples were collected from that particular surface. surface sampled room and number of samplesa covid-19 patients control patients administration staff breakroom doorknob 36 2 12 bedside rails 36 2 call button 36 2 n95 respirator (of technician or nurse; sampled before and after use) 36 2 bedside daily medical record 36 2 air vent 36 2 bathroom doorknob 36 2 bathroom faucet handles 36 2 12 sink 36 2 computer keyboard 12 chart cover 12 telephone 12 staff clothing 12 tabletop 12 light switch 12 staff mobile phone 12 total samples collected (n = 450) 324 18 36 72 wpsar vol 12, no 3, 2021 | doi:10.5365/wpsar.2020.11.4.002https://ojs.wpro.who.int/ 5 sars-cov-2 environmental sampling at a laboratoryđỗ et al table 2. locations where environmental surfaces were sampled for sars-cov-2 and number of samples collected from each surface in the serology and cell culture laboratory at the pasteur institute of nha trang, viet nam, 23 march–9 april 2020 ppe: personal protective equipment; rt-pcr: real-time reverse transcription polymerase chain reaction. a empty cells indicate that no samples were collected from that particular surface. surface sampled room and number of samplesa specimen receiving specimen processing specimen extracting master mix room pcr machine room staff breakroom doorknob 12 12 12 12 biosafety cabinet floor 12 12 12 specimen testing request form 12 tabletop where specimens received 12 light switch 12 12 12 faucet handles 12 12 12 sample transfer pipette 12 12 ppe changing location floor 12 centrifuge 12 staff members’ blouses 12 pcr platform 12 computer keyboard and mouse 12 12 buttons on rt-pcr machine 12 test result form 12 total (n = 300) 72 84 72 24 24 24 environmental samples a total of 750 environmental specimens were collected (tables 1 and 2). at the pasteur institute, 300 environmental samples were collected from 6 rooms (table 2): • 72 from the specimen receiving room – 12 each (1 sample 2 times per day for 6 days) from the biosafety cabinet floor, patient request forms, specimen receiving table, light switch, faucet handles and doorknob; • 84 from the specimen processing room – 12 each (1 sample 2 times per day for 6 days) from the biosafety cabinet floor, light switches, doorknobs, faucet handles, sample transfer pipettes, centrifuge and floor of the changing station for personal protective equipment (ppe); was done with alcohol (70%) at the end of the day or when spills occurred. ultraviolet light was used for 15 minutes at the beginning and end of the workday to disinfect the laboratory. other infection prevention and control (ipc) measures at the pasteur institute included 24-hour room ventilation, with temperature and humidity checked daily. during the survey period, the average temperature was 23 ±2 °c and humidity was 62 ±5%. there are also exhaust fans to the outdoors and certified biosafety cabinets used to avoid potential aerosol and droplet exposure and these are either exhausted through a high-efficiency particulate air (hepa) filter (where samples are received) or to the outdoors (where samples are processed). while handling potentially infectious specimens, laboratory workers wear suits with hoods, eye protection, n95 respirators and gloves. wpsar vol 12, no 3, 2021 | doi:10.5365/wpsar.2020.11.4.002 https://ojs.wpro.who.int/6 đỗ et alsars-cov-2 environmental sampling at a laboratory • 24 from the staff breakroom – 12 each (1 sample 2 times per day for 6 days) from the computer mouse and keyboards and from test result forms; all 300 samples collected from the pasteur institute were negative for sars-cov-2. at the general hospital, 450 samples were collected from 6 rooms (table 1): • 324 from the 3 rooms where covid-19 patients were isolating – 12 samples (2 each day, 1 hour before and 1 hour after the afternoon cleaning for 6 days) from frequently touched sites including • 72 from the extraction room – 12 each (1 sample 2 times per day for 6 days) from the light switches, doorknobs, faucet handles, biosafety cabinet floors, sample transfer pipettes and staff members’ blouses; • 24 from the solution room – 12 each (1 sample 2 times per day for 6 days) from the pcr platform and doorknobs; • 24 from the pcr machine room – 12 each (1 sample 2 times per day for 6 days) from the computer mouse, computer keyboard and touchpad of the rt–pcr machine; fig. 2. timeline of hospitalization of covid-19 patients at the binh thuan general hospital and sampling of environmental surfaces at the pasteur institute of nha trang (23 march–9 april 2020) and the general hospital (26–31 march 2020). red arrows indicate patients’ positive sars-cov-2 specimens by date of collection and a grey x indicates a negative specimen. *patient was an imported case not connected to the binh thuan cluster environmental sampling at pint regional laboratory (23 march – 9 april 2020) environmental sampling at binh thuan general hospital (26 – 31 march 2020) covid-19 patients hospitalized at binh thuan general hospital (9 march – 10 april 2020) *66-year-old male covid-19 patient hospitalized in quang nam province (14 march – 5 april 2020) a – 51 years, female, imported index patient b – 64 years, female, maid of a c – 37 years, female, staff of a d – 59 years, male, husband of a e – 28 years, male, son of a f – 28 years, female, daughter-inlaw of a g – 13 years, male, son of c h – 2 years, female, daughter of e and f j – 47 years, female, mother of f 14 march 19 march 24 march 29 march 3 april 8 april9 march 2020 14 march 19 march 24 march 29 march 3 april 8 april9 march 2020 wpsar vol 12, no 3, 2021 | doi:10.5365/wpsar.2020.11.4.002https://ojs.wpro.who.int/ 7 sars-cov-2 environmental sampling at a laboratoryđỗ et al ence laboratory that provides sars-cov-2 testing for 11 provinces in viet nam’s central coast or within a provincial hospital caring for a cluster of covid-19 patients. the facilities’ ipc measures may have contributed to these findings. the laboratory was mechanically ventilated with fresh-air supply and exhaust fans and used certified biosafety cabinets to control potential aerosol and droplet exposure. staff also followed strict laboratory biosafety protocols. the hospital reported adherence to environmental cleaning and disinfection regimens using 0.05% chlorine solution twice daily, in accordance with national and who guidelines,11 all with the purpose of limiting surface contamination. the negative sars-cov-2 test results from routine screening of workers at both the hospital and laboratory during the study period further support the effectiveness of ipc measures and the lack of health care–associated transmission. another possible explanation for the lack of positive environmental samples from the hospital is that cases were no longer shedding virus at the time the environmental samples were collected. sampling occurred late in the patients’ clinical course, at 15–17 days after hospital admission following the index case’s positive specimen. sample collection was delayed while approvals to conduct the study were obtained. culturable virus is often absent from patients who have mild to moderate illness at days 8–9 post-symptom onset7 and low in asymptomatic patients.7,12–14 peak viral shedding occurs early, at around 4–6 days post-infection or a few days before and after onset of symptoms (when symptomatic),7,13–15 so the delay in sampling limits the interpretation of the quality of ipc practices. all but one of the covid-19 cases in this study were asymptomatic and, therefore, potentially had less viral shedding, making it less likely that positive environmental samples would be obtained. a recent study showed that the presence and concentration of environmental contamination with sars-cov-2 in patients’ rooms and air vents within those patients’ rooms were associated with patients being early in the course of their illness (having symptoms for <1 week), when viral loads are known to peak.7 also, viral remnants may have been rapidly degraded in the environment. additionally, as contamination is typically not uniformly distributed on surfaces, the sampling might have missed potential evidence of virus in areas not sampled, the doorknob, bed rails, call buttons, bedside daily medical records, air vents, private bathroom doorknobs and faucet handles, plus from the n95 respirator of the technician or nurse used in each room, sampled before and after use; • 18 from the room with the control patients – 2 samples from the same 9 locations as the patients’ rooms; • 36 from an administrative room – 2 samples per day from 3 locations: keyboard, chart cover and telephone; • 72 from a staff breakroom – 12 samples (2 each day, 1 hour before and 1 hour after the afternoon cleaning for 6 days) from the doorknob, faucet handles, tabletop, light switch, staff clothing and mobile phones. all 450 samples from the general hospital were negative for sars-cov-2. there were 20 health care workers at the general hospital and 10 laboratory workers at the pasteur institute involved in the study or in caring for patients who tested positive for sars-cov-2 by real-time rt–pcr; all 30 staff were tested at the start of the study period and were negative for sars-cov-2 by real-time rt-pcr. discussion all environmental samples collected from a hospital and reference laboratory setting in the central coast of viet nam that cared for and provided services for covid-19 patients were negative for sars-cov-2. the samples from the hospital room with control patients were included with an expectation that some of the environmental samples from other patients’ rooms might be positive, although this proved not to be the case in this investigation. specimens collected from staff members in both settings were also negative for sars-cov-2. surface samples comprised multiple, frequently touched locations within the hospital and the laboratory throughout the life cycle of the specimens, as well as other areas frequented by staff. to our knowledge, this investigation is the first to document environmental sampling for sars-cov-2 within a laboratory setting. this investigation did not provide any evidence of surface contamination occurring within either the referwpsar vol 12, no 3, 2021 | doi:10.5365/wpsar.2020.11.4.002 https://ojs.wpro.who.int/8 đỗ et alsars-cov-2 environmental sampling at a laboratory funding this study was funded by the us centers for disease control and prevention through a cooperative agreement (6nu2ggh001991) with the pasteur institute of nha trang. references 1. phan lt, nguyen tv, luong qc, nguyen tv, nguyen ht, le hq, et al. importation and human-to-human transmission of a novel coronavirus in vietnam. n engl j med. 2020;382(9):872–4. doi:10.1056/nejmc2001272 pmid:31991079 2. ministry of health covid-19 situation dashboard. hanoi (viet nam): ministry of health; 2021. available from: https://ncov.moh. gov.vn, accessed 20 april 2020. (in vietnamese) 3. van doremalen n, bushmaker t, morris dh, holbrook mg, gamble a, williamson bn, et al. aerosol and surface stability of sars-cov-2 as compared with sars-cov-1. n engl j med. 2020;382(16):1564–7. doi:10.1056/nejmc2004973 pmid:32182409 4. nguyen tv, tran qd, phan lt, vu ln, truong dtt, truong hc, et al. in the interest of public safety: rapid response to the covid-19 epidemic in vietnam. bmj glob health. 2021;6(1):e004100. doi:10.1136/bmjgh-2020-004100 pmid:33495284 5. chin awh, chu jts, perera mra, hui kpy, yen h-l, chan mcw, et al. stability of sars-cov-2 in different environmental conditions. lancet microbe. 2020;1(1):e10. doi:10.1016/s26665247(20)30003-3 pmid:32835322 6. jiang fc, jiang xl, wang zg, meng zh, shao sf, anderson bd, et al. detection of severe acute respiratory syndrome coronavirus 2 rna on surfaces in quarantine rooms. emerg infect dis. 2020;26(9):2162–4. doi:10.3201/eid2609.201435 pmid:32421495 7. chia py, coleman kk, tan yk, ong swx, gum m, lau sk, et al. detection of air and surface contamination by sars-cov-2 in hospital rooms of infected patients. nat commun. 2020;11(1):2800. doi:10.1038/s41467-020-16670-2 pmid:32472043 8. wu s, wang y, jin x, tian j, liu j, mao y. environmental contamination by sars-cov-2 in a designated hospital for coronavirus disease 2019. am j infect control. 2020;48(8):910–4. doi:10.1016/j.ajic.2020.05.003 pmid:32407826 9. surface sampling of coronavirus disease (covid-19): a practical “how to” protocol for health care and public health professionals, version 1.1. geneva: world health organization; 2020. available from: https://apps.who.int/iris/handle/10665/331058, accessed 20 april 2021. 10. corman vm, landt o, kaiser m, molenkamp r, meijer a, chu dk, et al. detection of 2019 novel coronavirus (2019-ncov) by real-time rt-pcr. euro surveill. 2020;25(3):2000045. doi:10.2807/15607917.es.2020.25.3.2000045 pmid:31992387 11. laboratory biosafety guidance related to coronavirus disease (covid-19): interim guidance, 28 january 2021. geneva: world health organization; 2020. available from: https://apps.who.int/ iris/handle/10665/339056, accessed 20 april 2020. 12. wölfel r, corman vm, guggemos w, seilmaier m, zange s, müller ma, et al. virological assessment of hospitalized patients with covid-2019. nature. 2020;581(7809):465–9. doi:10.1038/ s41586-020-2196-x pmid:32235945 or the contamination might have been below the limit of detection. given the use of a single swab per surface, it is possible that the swabs may not have remained sufficiently moist or that the contact time during collection may have been insufficient. the study design also did not include an experimentally contaminated surface to use as a known positive control while maintaining appropriate biosafety measures (e.g. using denatured virus). all of these may have contributed to the negative findings in this study. even so, virtual training was conducted for the staff who performed the sampling, and surface sampling technique was also observed in real time using a mobile phone with video access. recent environmental sampling of very-high-touch surfaces in public transportation venues at the height of the pandemic in italy have similarly returned negative results.16 in conclusion, our study found no environmental contamination by sars-cov-2 among 750 samples taken from a hospital treating covid-19 patients and a reference laboratory conducting testing for 11 provinces in viet nam. the facilities’ ipc measures may have contributed to these results, although other possible explanations include sampling late in the patient’s hospital stay, using insufficient contact time to collect samples or using insufficiently moist swabs. further environmental sampling studies of sars-cov-2 should consider including testing for the environmental presence of viruses within the laboratory setting and consider including additional quality assurance methods, such as a positive control surface, while ensuring appropriate biosafety measures. these studies should also strive to collect specimens as early as possible in each case’s infection to minimize potential loss due to reductions in viral load over time. disclaimer the findings and conclusions in this report are those of the authors and do not necessarily represent the views of the united states centers for disease control and prevention or the ministry of health of viet nam. acknowledgements the authors would like to thank the staff at binh thuan general hospital and the reference laboratory at the pasteur institute of nha trang for their support, and also thank the patients for their understanding. wpsar vol 12, no 3, 2021 | doi:10.5365/wpsar.2020.11.4.002https://ojs.wpro.who.int/ 9 sars-cov-2 environmental sampling at a laboratoryđỗ et al 15. zou l, ruan f, huang m, liang l, huang h, hong z, et al. sarscov-2 viral load in upper respiratory specimens of infected patients. n engl j med. 2020;382(12):1177–9. doi:10.1056/nejmc2001737 pmid:32074444 16. di carlo p, chiacchiaretta p, sinjari b, aruffo e, stuppia l, de laurenzi v, et al. air and surface measurements of sarscov-2 inside a bus during normal operation. plos one. 2020;15(11):e0235943. doi:10.1371/journal.pone.0235943 pmid:33151953 13. to kk, tsang ot, leung ws, tam ar, wu tc, lung dc, et al. temporal profiles of viral load in posterior oropharyngeal saliva samples and serum antibody responses during infection by sars-cov-2: an observational cohort study. lancet infect dis. 2020;20(5):565–74. doi:10.1016/s1473-3099(20)30196-1 pmid:32213337 14. zheng s, fan j, yu f, feng b, lou b, zou q, et al. viral load dynamics and disease severity in patients infected with sars-cov-2 in zhejiang province, china, january-march 2020: retrospective cohort study. bmj. 2020;369:m1443. doi:10.1136/bmj.m1443 pmid:32317267 https://ojs.wpro.who.int/ 1wpsar vol 12, no 4, 2021 | doi: 10.5365/wpsar.2021.12.4.844 original research p ublic health emergencies, such as outbreaks of emerging infectious diseases and natural disasters, pose threats to health security and economies in the world health organization’s (who’s) western pacific region.1,2 although the occurrence of such events is unpredictable, preparedness, prompt detection and rapid responses can reduce their impacts. in health emergencies, field epidemiologists play vital roles in the detection, verification, risk assessment, response and communication of events at the local, national and regional levels.3 a sufficient pool of competent field epidemiologists is necessary to respond to these events in a timely manner. field epidemiology training programmes (fetp) and modified field epidemiology training (fet) are implemented by countries, depending on a member state’s situation, capacity and needs.4 the who western pacific region’s field epidemiology fellowship programme is an applied epidemiology training programme provided by who’s regional office for the western pacific; for simplicity, participants are referred to throughout this paper as regional fellows. the objectives of this programme are to (i) strengthen countries’ capacities for surveillance and risk assessment, (ii) build a workforce to address public a who health emergencies programme, world health organization regional office for the western pacific, manila, philippines. published: 26 october 2021 doi: 10.5365/wpsar.2021.12.4.844 objective: the world health organization’s (who’s) field epidemiology fellowship programme in the western pacific region aims to strengthen countries’ capacities for surveillance and risk assessment and build a workforce to tackle public health emergencies. a survey was conducted to assess the on-the-job training experience of the regional fellows, evaluate the strengths of the programme and gain feedback on areas for improvement. methods: between 25 september and 25 october 2018, an online survey was sent to regional fellows who had participated in the programme between july 2006 and september 2018. the survey was shared with who country offices in the western pacific region and directly with graduates of the programme. responses were recorded electronically and analysed. results: a total of 53 former regional fellows responded (54% response rate; 53/98). at the time of programme participation, the fellows’ median age was 35, 62% (33/53) were female and 72% (38/53) were affiliated with a national or subnational health department. fellows gained experience in event-based surveillance and risk assessment and worked among a diverse group of professionals in various member states. altogether, 77% (41/53) of respondents believed that the programme had helped them move into a better career position with greater responsibility. ninety-four percent (50/53) would recommend the programme to their colleagues. discussion: alumni from the western pacific region’s field epidemiology fellowship programme perform key health security roles, particularly within governmental systems, and directly contribute to managing health emergencies in their countries, in the region and globally. the programme is building a workforce with surge capacity to ensure that public health events in the region can be addressed. furthermore, connections developed through the programme are helping to develop an alumni network, and enhance communications among member states and between member states and who. strengthening national, regional and global health capacity through the who western pacific region’s field epidemiology fellowship programme eri togami,a christopher lowbridge,a thilaka chinnayah,a masaya kato,a munehisa fukusumi,a jin gwack,a tamano matsui,a babatunde olowokurea and ailan lia correspondence to eri togami (email: togamie@who.int) wpsar vol 12, no 4, 2021 | doi: 10.5365/wpsar.2021.12.4.844 https://ojs.wpro.who.int/2 togami et alstrengthening health capacity though the who field epidemiology fellowship programme systematically evaluated. the objectives of this survey were to capture the on-the-job training experience of the fellows, evaluate the usefulness and strengths of the programme as an opportunity for fellows to develop competencies in surveillance and responding to health emergencies, and gain feedback on areas in which the programme could be strengthened. methods definitions for the purposes of this paper, “fet/p” is defined as fet, fetp or equivalent programmes that are implemented in individual countries. fetp is a two-year “learning by doing” training programme for field epidemiology. a modified version of the fetp is the fet, which is usually shorter and adapted to the country’s situation and needs while maintaining on-the-job mentorship and training. we differentiate these fet/ps from those of the regional fellows participating in the who western pacific region’s field epidemiology fellowship programme. survey development and platform the survey was developed with the online platform kobotoolbox, a tool developed by the harvard humanitarian initiative.6 kobotoolbox was selected because it was the most accessible platform for all countries in the western pacific region. the survey consisted of 34 questions, with 5 question types: binary choice, multiple choice, likert scale, ranking and free text. one question at the beginning of the survey was optional (name). eligibility and survey dissemination the western pacific region’s database of regional fellows was used to select those who had participated in the programme between july 2006 and september 2018. the url for the survey was shared via email with who country offices in brunei darussalam, cambodia, china, the lao people’s democratic republic, malaysia, mongolia, the philippines, singapore and viet nam. focal points for the who health emergencies programme in these countries disseminated the survey to graduates of the programme in their countries. alumni from australia, japan and the republic of korea were contacted directly by the survey team. these two methods were used because not all countries in the region have a health emergencies, (iii) provide the staff needed for surge capacity responses to public health emergencies, (iv) contribute to and improve who’s regional and global event-based surveillance and response systems, and (v) establish a regional network of programme alumni to facilitate information sharing and collaboration to enhance health security. the programme achieves these objectives by inviting fetp and fet trainees and graduates in the region to work with the who health emergency information management and risk assessment team in the health emergencies programme, usually for 7 to 9 weeks. regional fellows undergo on-the-job training in a multicultural and diverse work environment, improving their skills by applying an all-hazards approach to eventand indicator-based surveillance; risk assessment; health emergency information management; and responses to emerging infectious diseases, disasters and other unexpected events. upon completion of the programme, which may include a field deployment, the regional fellows return to their country and are expected to use their new knowledge and skills to contribute towards strengthening national and regional epidemiological and field capacity. originally published in 2006, the asia pacific strategy for emerging diseases and public health emergencies (apsed iii) is the third iteration of a regional framework aimed at implementing, maintaining and advancing the international health regulations (ihr) 2005 core capacities in the asia pacific. the western pacific region’s fellowship programme was established in 2006 to strengthen the capacities of member states and who to rapidly detect and respond to emerging infectious diseases and other acute public health events in the region. this is consistent with developing core capacities under ihr (2005).5 from 2006 to 2018, more than 130 public health officials, interns and volunteers from 13 member states participated in the region’s fellowship programme. in 2011, the programme changed from an individual, mentorship-based experience to a more structured format where regional fellows joined a public health intelligence team focused on event-based surveillance, signal verification, risk assessment and response. until now, the experiences of the regional fellows and their feedback on the programme had not been wpsar vol 12, no 4, 2021 | doi: 10.5365/wpsar.2021.12.4.844https://ojs.wpro.who.int/ 3 strengthening health capacity though the who field epidemiology fellowship programmetogami et al respondents were female (62%; 33/53), affiliated with a national or subnational ministry or department of health (72%; 38/53), an fet/p graduate at the time of the attachment (53%; 28/53) and attached to the regional office for the western pacific for between 7 and 9 weeks (57%; 30/53); 77% (41/53) of respondents self-identified as having a background in epidemiology and public health (table 1). the majority of fellows (66%; 35/53) indicated they thought the duration of the programme was of an appropriate length: of these, 21 participated for 7–9 weeks, 4 participated for 4–6 weeks, 8 participated for 10–12 weeks, 1 participated for >12 weeks and 1 participant did not provide a response for this question. among the 23% (12/53) of participants who indicated that the duration was too short, 6 participated for 8 weeks, 4 participated for 4 weeks, 1 participated for 6 weeks and 1 participated for 10 weeks. three fellows (6%; 3/53) indicated that the programme was too long, all of whom participated for 8 weeks. three fellows (6%, 3/53) did not provide a response for this question. assessment of the western pacific region’s field epidemiology fellowship programme the skills gained during the programme that helped regional fellows most in their current position were, in order of importance, (i) event-based surveillance (signal detection and screening); (ii) risk assessment; (iii) ihr (2005)-related communications and other communications, including signal verification; (iv) ability to work with a diverse group of professionals and with professionals from different countries; (v) knowledge of who’s role and function in health emergencies; and (vi) oral presentation skills in english. a majority of respondents agreed (53%; 28/53) or somewhat agreed (32%; 17/53) that they were given clear guidance and supervision during the programme. by year of participation, 67% (6/9) of those who participated in the individual mentorship-based programme between 2007 and 2010 and 94% (33/35) of those who participated in the structured programme between 2011 and 2018 agreed or somewhat agreed that they were given clear guidance and supervision during the programme. regional fellows expected to gain experience and knowledge in the areas of (i) risk assessment (25%; 13/53), (ii) event-based surveillance (21%; who country office. eligible alumni who did not respond were sent up to two reminder emails by the team. the survey link was open for 1 month, from 25 september to 25 october 2018. a total of 144 fellows were initially identified in the database. not all participants in the region’s fellowship programme were in fet/ps at the time of the survey or had previously participated in fet/ps. interns and volunteers were not eligible to participate in the survey because their learning needs and career trajectories may differ from those of alumni who were affiliated with member states’ governmental or other institutions. after removing duplicates, interns, volunteers and regional fellows whose active email addresses could not be determined, 98 former fellows were asked to participate in the survey. analysis survey responses were collected via the online platform. after the survey deadline passed, responses were analysed using microsoft excel and r statistical software, version 3.1.3. for binary, multiple choice and likert scale questions, the frequency and percentage of responses were calculated. for ranking questions, responses were calculated using standard methods for weighted averages – that is, weighted average = (w1x1 + w2x2 + …)/(total number of responses), where w is the weight according to rank (with the highest rank given the highest weight, the lowest rank given the lowest weight) and x is the number of responses. weighted averages are relative values that are used to compare responses. open-ended questions were analysed thematically and classified by theme. results a total of 135 regional fellows from 12 member states participated in the western pacific region’s field epidemiology fellowship programme, of whom 20% (27/135) participated during 2006–2010, 37% (50/135) during 2011–2014 and 42% (57/135) during 2015–2018; for <1% (1/135) the year of participation was unknown. of these 135 regional fellows, 98 were contacted and 53 responded (54% response rate) from 11 countries in the region (fig. 1 and 2). responses were received from former regional fellows who participated in the programme between 2007 and 2018. a majority of wpsar vol 12, no 4, 2021 | doi: 10.5365/wpsar.2021.12.4.844 https://ojs.wpro.who.int/4 togami et alstrengthening health capacity though the who field epidemiology fellowship programme fig. 2. response rate to the 2018 survey of fellows from who’s western pacific region field epidemiology fellowship programme, by member state. the numerators are the number of respondents from each country; the denominators are the total number of participants in the programme from each country during july 2006 to september 2018. (the number of respondents does not sum to 53 because three respondents did not provide information for this specific question.) a for singapore, one alumnus was identified in the database, but two alumni responded. fig. 1. indentification of eligible respondents for the 2018 survey of former fellows in who’s western pacific region field epidemiology fellowship programme fellows identified in database: 144 removed duplicates: 4 interns & volunteers: 5 contact details unavailable: 37 no response: 45 total number of eligible fellows: 135 number of fellows contacted: 98 number of survey respondents: 53 wpsar vol 12, no 4, 2021 | doi: 10.5365/wpsar.2021.12.4.844https://ojs.wpro.who.int/ 5 strengthening health capacity though the who field epidemiology fellowship programmetogami et al career progression and fet/p affiliation most former regional fellows were currently based in the country in which they had completed their fet/p (87%; 46/53), indicating a high retention rate in the country in which they were trained. their affiliations at the time of the survey in 2018 were a national ministry or department of health (55%; 29/53), subnational health department (17%; 9/53) 11/53), (iii) the structure and function of who in health emergencies (19%; 10/53), and (iv) outbreak and emergency responses (15%; 8/53). a majority of former fellows agreed (55%; 29/53) or somewhat agreed (32%; 17/53) that their expectations of the programme had been met. some reasons why expectations were not considered to have been met included a lack of field deployment, having to take on a teaching role for other fellows which impeded their own learning, and difficulty understanding the context of the risk assessment. table 1. demographic information about respondents to the 2018 survey of fellows from who’s western pacific region field epidemiology fellowship programme a fet/p is defined as fet, fetp or equivalent programmes that are implemented in individual countries. b “other” included one international fet/p candidate in thailand who was also a graduate of fet/p china, one staff at chinese center for disease control and prevention working closely with fet/p china, and one respondent who indicated no institutional affiliation. characteristic number % respondents 53 100 female 33 62 median age (range) 35 (26 to 48) affiliation at time of attachment national ministry or department of health 29 55 subnational health department office 9 17 university or research institute 7 13 health care facility (clinical practice) 3 6 other government sector, including agriculture, veterinary, environment, security 2 4 no institutional affiliation or no response 3 6 affiliation with fet/pa at the time of attachment (multiple selections possible) fet/p graduate 28 53 fet/p fellow 18 34 fet/p supervisor or mentor 6 11 fet/p programme coordinator 2 4 otherb or no response 6 11 duration of attachment 4–6 weeks 10 19 7–9 weeks 30 57 10–12 weeks 9 17 >12 weeks 1 2 no response 3 6 self-identified professional background (multiple selections possible) epidemiology and public health 41 77 medicine 13 25 international development 3 6 nursing 2 4 veterinary medicine 2 4 laboratory science 2 4 pharmacology 1 2 wpsar vol 12, no 4, 2021 | doi: 10.5365/wpsar.2021.12.4.844 https://ojs.wpro.who.int/6 togami et alstrengthening health capacity though the who field epidemiology fellowship programme regional fellowship at the time of the survey. all but one alumni (98%; 52/53) indicated that they have epidemiological expertise in public health emergencies, and 53% (28/53) have expertise in infection prevention and control. feedback and recommendations the top three aspects that the regional fellows most liked about the programme were (i) working in a diverse team with a good professional support system; (ii) gaining insight into the who system and response systems in other countries; and (iii) learning about surveillance – that is, about collecting information, and verifying, analysing and managing it, and conducting risk assessments. when regional fellows were asked about the shortcomings of the programme, the top three responses were (i) the need for extended working hours at times; (ii) the need to start tasks early in the day; and (iii) challenges with the team structure and mentoring. when asked which technical aspects could be improved, the top three concerns were (i) the lack of, or limited, time allocated for field work in countries; (ii) the limited number of analytical or in-depth projects; and (iii) limited learning or discussion sessions. respondents suggested providing more opportunities for field work or field investigation (n = 5), developing a structure to allow for continued collaboration and networking among regional fellows after completion of the programme (n = 5), reducing the workload of who staff to ensure they have more time for mentoring (n = 3) and providing more opportunities for in-depth projects, such as analytical tasks and programme assessments (n = 3). other suggestions included enrolling more participants from developing countries; ensuring that information about the objectives, setting and scope of the programme are shared with potential fellows prior to them enrolling; and providing regional fellows with opportunities to interact with other teams and divisions at the regional office for the western pacific. almost all former regional fellows (96%; 51/53) wished to stay in contact with the fellowship programme and other former fellows. overall, 94% (50/53) of former fellows would either highly recommend or recommend the programme to their colleagues. or a university or research institute (13%; 7/53). two former regional fellows worked at who, one as a staff member and one through an epidemiology consulting company. altogether, 64% (34/53) did not change their affiliation from when they joined the western pacific region’s fellowship programme to when they participated in the survey. among those who changed affiliations, five changed from a national or subnational health department to a university, research institute or other organization; one moved from a subnational to a national health department; one moved from a national to a subnational health department; and four moved from a university, research institute or other organization to a governmental institution. former regional fellows currently engage in surveillance and risk assessment (81%; 43/53), outbreak management (66%; 35/53), rapid response activities in their country (60%; 32/53), health emergency events (57%; 30/53) and rapid response activities outside of their country (25%; 13/53). it was reported that the programme had helped 77% (41/53) of respondents move to a better career position with greater responsibility. stratified by the year of participation, the programme helped 87% (13/15) of regional fellows who had participated between 2007 and 2012 and 69% (20/29) of those who had participated between 2013 and 2018 in their career progression. a majority (61%, 11/18) of those who were fet/p fellows, 64% (18/28) of those who were fet/p graduates and all (100%, 6/6) of those who were fet/p supervisors or mentors at the time they were regional fellows continued to be involved in fet/p programmes in various leadership roles (table 2). altogether, 3 of 11 former fet/p fellows; 5 of 18 fet/p graduates (another 5 of 18 did not indicate their years of participation); and 3 of 6 former fet/p supervisors or mentors who were affiliated with fet/ps at the time of the survey were regional fellows between 2007 and 2012. almost all respondents were available and willing to take part in response activities to address outbreaks or public health emergencies within (98%; 52/53) or outside of (79%; 42/53) the country in which they were based. only 40% (21/53) had engaged in such response activities outside of their country since completing the wpsar vol 12, no 4, 2021 | doi: 10.5365/wpsar.2021.12.4.844https://ojs.wpro.who.int/ 7 strengthening health capacity though the who field epidemiology fellowship programmetogami et al table 2. changes in the affiliations of regional fellows who had an association with fet/ps from the time of participation in who’s western pacific region field epidemiology fellowship programme to the time of the survey in 2018 member states, and between member states and who, because it is uniquely designed to bring together professionals from a variety of disciplines, nations and experiences. this diversity enriches the regional fellows’ experiences through mutual learning and crosscultural interaction, and it helps them gain competencies to respond to health emergencies in various contexts.9 former fellows ranked the team’s diversity as the most important characteristic of the programme, and almost all fellows wished to stay in contact with the programme and other fellows through a more structured channel, in addition to personal communications. the regional office for the western pacific responded to this feedback and brought fellowship alumni together for the first alumni meeting in tokyo, japan, in november 2018 to continue fostering robust and long-term relationships among alumni in the region.10 in combination with official platforms and communication channels, this alumni network could act as an incubator for catalysing new ideas and implementing innovative tools in the region. for example, the network could play a key role in familiarizing public health officials with and supporting implementation of useful tools such as epidemic analysis for response decision-making, which aims to utilize multisource data for decision-making during an emergency response,11 thereby facilitating timely detection and rapid responses. the western pacific region’s field epidemiology fellowship programme has trained a pool of experts who can be recruited to respond to health emergencies, as evidenced by the response to the novel coronavirus disease 2019 pandemic. from january to october 2020, discussion the western pacific region’s field epidemiology fellowship programme is unique within who and is designed to build capacity for detecting and responding to emerging infectious diseases and other acute public health events in the region, in keeping with the objectives of apsed iii.1 our findings provide insights into the experience of the regional fellows who have completed the programme. we found that these experiences were positive and that regional fellows felt they had gained new skills and knowledge that have enabled them to progress in their careers. alumni of the regional fellowship programme perform key health security roles, particularly within governmental systems, and directly contribute to managing health emergencies within their countries, in the region and globally. individuals who participated in the programme continue to be involved in national fet/ps in their home countries in supervisory, coordinating or teaching roles. the guidance from alumni in leadership roles who have gained technical and interpersonal skills through the programme plays a key role in providing good mentorship to trainees and implementing a successful fet/p.7,8 through mentoring, teaching, training, supervising and directly working with fet/ps, there are opportunities for competencies gained through the regional fellowship to be passed down to the next generation of trainees, which could further contribute to strengthening countries’ capacities to address health emergencies. the regional fellowship programme is helping to maintain connections and communication among position in fet/p at the time of regional fellowshipa affiliated with fet/p at the time of the 2018 surveyb n in any capacity fet/p supervisor fet/p teacher, trainer, lecturer fet/p programme coordinator or facilitator host for overseas fet/p fellows fet/p fellow 18 11 5 5 3 n/a fet/p graduate 28 18 11 10 2 1 fet/p supervisor or mentor 6 6 5 2 3 n/a a four respondents indicated they had more than one role at the time of their regional fellowship (i.e. fet/p graduate and fet/p supervisor or mentor), and therefore are counted twice in this table. b respondents who were affiliated with fet/ps at the time of the survey were able to select multiple roles as applicable (e.g. fet/p supervisor and fet/p teacher, trainer, lecturer). wpsar vol 12, no 4, 2021 | doi: 10.5365/wpsar.2021.12.4.844 https://ojs.wpro.who.int/8 togami et alstrengthening health capacity though the who field epidemiology fellowship programme the contribution of stakeholders in the region and their continued efforts to advocate and strengthen the health security workforce. conflicts of interest none ethics statement this work was considered a routine continuous quality improvement activity of the who regional office for the western pacific. as such, ethical clearance from a health research ethical review committee was not obtained. all collected data were de-identified prior to analysis, and only aggregated results have been shared to protect the confidentiality of survey participants. funding none references 1. asia pacific strategy for emerging diseases and public health emergencies (apsed iii). advancing implementation of the international health regulations (2005): working together towards health security. manila: world health organization, regional office for the western pacific; 2017. available from: https://iris.wpro.who.int/ handle/10665.1/13654, accessed 17 august 2021. 2. lowbridge c, chiew m, russell k, yamagishi t, olowokure b, li a. regional event-based surveillance in who’s western pacific region. western pac surveill response j. 2020;11(2):11–19. doi:10.5365/wpsar.2018.9.5.009 pmid:33537160 3. emergency response framework (erf), second edition. geneva: world health organization; 2017. available from: https://apps.who. int/iris/handle/10665/258604, accessed 17 august 2021. 4. 2nd workshop for field epidemiology training programme in the western pacific region, manila, philippines, 29-30 november 2010: report. manila: who regional office for the western pacific, 2010. available from: https://apps.who.int/iris/handle/10665/207151, accessed 17 august 2021. 5. international health regulations (2005), third edition. geneva: world health organization; 2016. available from: https://apps.who. int/iris/handle/10665/246107, accessed 17 august 2021. 6. kobotoolbox [website]. cambridge, ma (usa): havard humanitarian initiative; 2021. available from: https://www.kobotoolbox. org/. 7. schneider d, evering-watley m, walke h, bloland pb. training the global public health workforce through applied epidemiology training programs: cdc’s experience, 1951–2011. public health rev. 2011;33:190–203. doi:10.1007/bf03391627 8. forbes o, davis s, dyda a, rosewell a, williams s, kirk m, et al. field epidemiology training programmes in the asia-pacific: what is best practice for supervision? western pac surveill response j. 2019;10(4):9-17. doi:10.5365/wpsar.2019.10.1.007 pmid:32133206 seven former graduates contributed to the pandemic response as part of who’s incident management support team at the regional office and at who headquarters, according to an internal tally; many more alumni are contributing to the response through their respective governments.12 the regional fellowship is fulfilling one of its objectives by building a workforce to provide surge capacity for public health emergencies in the region. alumni highlighted a desire to gain field experience and the need for opportunities for more in-depth analytical and project-based work. in this regard, the regional fellows’ training experiences could be augmented by work with national fet/ps, such as through field investigations and epidemiological analyses. additionally, in response to suggestions from this survey, the regional office has modified the daily team schedule to allow regional fellows to complete tasks without working extended hours. sharing information about the objectives, setting and scope of the programme before participants apply to and participate in it is key to setting expectations for incoming fellows. there are limitations to this survey, such as the relatively low response rate and small sample size. nevertheless, it is the first study to comprehensively summarize the outcomes of the regional fellowship programme. the findings of this survey have been and will be used to continually improve the programme. within the apsed iii framework, the regional fellowship programme is effective for training future leaders in field epidemiology to respond to health emergencies, developing professional relationships among member states in the region, and strengthening national and regional capacities. the regional fellowship model may be applicable to similar settings. acknowledgements we thank the government of japan for funding the regional field epidemiology fellowship programme and partners who supported the implementation of the programme. we thank the fet/p coordinators, focal points and graduates across the western pacific region and colleagues at training programs in epidemiology and public health interventions network, as well as colleagues at the wpro health emergencies programme who provided support for this work. we acknowledge wpsar vol 12, no 4, 2021 | doi: 10.5365/wpsar.2021.12.4.844https://ojs.wpro.who.int/ 9 strengthening health capacity though the who field epidemiology fellowship programmetogami et al 11. epidemic analysis for response decision-making: systematic organization of multi-source information to inform response decisions. manila: world health organization, regional office for the western pacific; 2020. available from: https://apps.who.int/iris/handle/10665/333046, accessed 17 august 2021. 12. asean, china, japan, korea epidemiology experts share disease surveillance experiences on covid-19. in: association of southeast asian nations [website]. jakarta: asean; 2020. available from: https://aseanplusthree.asean.org/asean-china-japan-koreaepidemiology-experts-share-disease-surveillance-experiences-oncovid-19/, accessed 17 august 2021. 9. thacker sb, dannenberg al, hamilton dh. epidemic intelligence service of the centers for disease control and prevention: 50 years of training and service in applied epidemiology. am j epidemiol. 2001;154(11):985–92. doi:10.1093/aje/154.11.985 pmid:22135393 10. training programs in epidemiology and public health interventions network (tephinet). fetp updates october-december 2018. tephinet; 2019. available from: https://www.tephinet. org/fetp-updates-october-december-2018, accessed 17 august 2021. https://ojs.wpro.who.int/ 1wpsar vol 13, no 4, 2022 | doi: 10.5365/wpsar.2022.13.4.972 regional analysis t uberculosis (tb) continues to be a major global health challenge. despite a concerted global effort to eliminate it, tb remains one of the leading infectious causes of death globally. in 2020, an estimated 10 million incident cases of tb and 1.5 million tb-related deaths occurred worldwide.1 a major threat to the global effort to end tb is drug-resistant tb (dr-tb), which is caused by organisms that are resistant to any drugs used for tb, including multidrug-resistant tb (mdr-tb), which does not respond to isoniazid and rifampicin, the two most effective first-line anti-tb drugs.2 dr-tb is a threat because specialized laboratory infrastructure and diagnostics are required for dr-tb, leading to substantial underdiagnosis of dr-tb, especially in lowand middleincome countries (lmics); also, treatment outcomes are often poor because treatment of dr-tb is of long duration and involves toxic and expensive medicines. in lmics, dr-tb can be a huge burden on health systems and can contribute to a high proportion of patients and their families experiencing catastrophic health costs. dr-tb diagnosis and treatment have changed radically in the past decade, in accordance with recommendations from the world health organization (who), including rapid and simple diagnosis and shorter treatment duration with new and repurposed drugs (table 1).3–11 the who western pacific region is home to 1.9 billion people in 37 countries and areas. the region is diverse, ranging from a large country with a population of more than 1 billion to small pacific island countries with a end tb and leprosy unit, world health organization regional office for the western pacific, manila, philippines. b independent consultant, cavite, philippines. published: 19 december 2022 doi: 10.5365/wpsar.2022.13.4.972 background: diagnosis and treatment of drug-resistant tuberculosis (dr-tb) have radically changed in accordance with recommendations from the world health organization (who) in the past decade, allowing rapid and simple diagnosis and shorter treatment duration with new and repurposed drugs. methods: a descriptive analysis of the status and progress of dr-tb diagnosis and treatment in six priority countries in the western pacific region was conducted using information from interviews with countries and the who tb database. results: over the past decade, the use of xpert mtb/rif has increased in the six priority countries, in parallel with implementation of national policies and algorithms to use xpert mtb/rif as an initial diagnostic test for tb and detection of rifampicin resistance. this has resulted in increases in the number of people diagnosed with multidrug-resistant or rifampicin-resistant tb (mdr/rr-tb). shorter treatment regimens with new and repurposed drugs have also been adopted for mdr/rr-tb cases, alongside a decentralized model of care, leading to improved treatment outcomes. discussion: the western pacific region has achieved considerable progress in the diagnosis and treatment of dr-tb, in line with the evolving who recommendations in the past decade. the continued commitment of member states is needed to address remaining challenges, such as the impact of the coronavirus disease pandemic, suboptimal management and health system issues. progress on diagnosis and treatment of drug-resistant tuberculosis in line with world health organization recommendations in six priority countries in the western pacific region kyung hyun oh,a maria imelda quelapio,b fukushi morishita,a kalpeshsinh rahevar,a manami yanagawaa and tauhid islama correspondence to kyung hyun oh (email: ohk@who.int) wpsar vol 13, no 4, 2022 | doi: 10.5365/wpsar.2022.13.4.972 https://ojs.wpro.who.int/2 oh et alprogress on diagnosis and treatment of dr-tb in the western pacific table 1. who recommendations on diagnosis and treatment for dr-tb, 2013–2021 mdr-tb: multidrug-resistant tuberculosis; naat: nucleic acid amplification test; rr-tb: rifampicin-resistant tuberculosis; sl-lpa: second-line line probe assay; tb: tuberculosis; xpert mtb/rif: an automated naat for mycobacterium tuberculosis complex and resistance to the drug rifampicin. group a: levofloxacin/moxifloxacin, bedaquiline and linezolid. group b: clofazimine and cycloserine/terizidone. group c: ethambutol, delamanid, pyrazimide, imipenem-cilastatin, meropenem, amikacin/streptomycin, ethionamide/prothionamide and p-aminosalicylic acid. year diagnosis treatment 2013 xpert mtb/rif to be used as the initial diagnostic test in adults and children suspected of having mdrtb or hiv-associated tb rather than conventional microscopy, culture and drug susceptibility testing.3 2016 for patients with confirmed rr-tb or mdr-tb, sl-lpa may be used as the initial test to detect resistance to fluoroquinolones, instead of phenotypic culture-based drug susceptibility testing.4 in patients with rr-tb or mdr-tb who were not previously treated with second-line drugs and in whom resistance to fluoroquinolones and second-line injectable agents was excluded or is considered highly unlikely, a shorter mdr-tb regimen of 9–12 months may be used instead of the longer regimens.7 2017 xpert mtb/rif ultra is non-inferior to the current xpert mtb/rif for the diagnosis of mtb and the detection of rifampicin resistance and can be used as an alternative to the latter in all settings.5 in patients who require tb retreatment, the category ii regimen should no longer be prescribed, and drug susceptibility testing should be conducted to inform the choice of treatment regimen.11 2018 in patients with confirmed rifampicin-susceptible and isoniazid-resistant tb, treatment with rifampicin, ethambutol, pyrazinamide and levofloxacin is recommended for a duration of 6 months.10 2019 in mdr/rr-tb patients on longer regimens, all three group a agents and at least one group b agent should be included, to ensure that treatment starts with at least four tb agents likely to be effective and that at least three agents are included for the rest of the treatment after bedaquiline is stopped. if only one or two group a agents are used, both group b agents are to be included. if the regimen cannot be composed with agents from groups a and b alone, group c agents are to be added.9 kanamycin and capreomycin are not to be included in the treatment of mdr/rr-tb patients on longer regimens.9 2020 a shorter all-oral bedaquiline-containing regimen of 9–12 months duration is recommended in eligible patients with confirmed mdr/rr-tb who have not been exposed to treatment with second-line tb medicines used in this regimen for more than 1 month, and in whom resistance to fluoroquinolones has been excluded.8 a treatment regimen lasting 6–9 months, composed of bedaquiline, pretomanid and linezolid (bpal), may be used under operational research conditions in mdr-tb patients with tb that is resistant to fluoroquinolones, who have either had no previous exposure to bedaquiline and linezolid or have been exposed for no more than 2 weeks.8 2021 in people with bacteriologically confirmed pulmonary tb, low complexity automated naats may be used on sputum for the initial detection of resistance to isoniazid and fluoroquinolones, rather than culturebased phenotypic drug susceptibility testing.6 wpsar vol 13, no 4, 2022 | doi: 10.5365/wpsar.2022.13.4.972https://ojs.wpro.who.int/ 3 progress on diagnosis and treatment of dr-tb in the western pacificoh et al • proportion of people diagnosed with mdr/rr-tb and enrolled in mdr-tb treatment in the same year (this can be more than 100% owing to cases that are enrolled in the year after they are diagnosed); • percentage of mdr/rr-tb cases tested for susceptibility to fluoroquinolones; • number of mdr/rr-tb cases treated with bedaquiline, shorter regimen and all-oral longer regimen; and • treatment outcomes for mdr/rr-tb cases started on treatment.1,16 information on the countries’ status was obtained through interviews, supported by follow-up communication and rglc country monitoring missions. between july and november 2021, interviews with pmdt focal points of the national tb programmes from the six priority countries were conducted virtually using a structured questionnaire. further information was updated after follow-up communications or subsequent rglc country monitoring missions in 2021. information on the countries’ progress was collected from the who database, to which countries and areas annually report data on tb care and prevention via an electronic platform.17 all data analyses and visualizations were conducted using the statistical software package r 4.1.1 (comprehensive r archive network at https://cran.rproject.org/). results status of dr-tb diagnosis the six priority countries are at different stages in their uptake of who recommendations on diagnostic tools and algorithms for dr-tb (table 2). national policies and algorithms indicate universal access to drug susceptibility testing in all priority countries. although xpert mtb/rif is used as an initial diagnostic test for tb and rifampicin resistance detection in all priority countries, in cambodia and viet nam it does not cover the entire population. in cambodia, xpert mtb/rif was used for all initial diagnostic testing in some areas; in other areas, it was limited to high-risk groups, such as previously treated cases and people living with hiv. the country aims to expand its universal use to all presumptive a few thousand residents, and from countries with a high tb burden to countries in the pre-elimination stage.12 five countries (china, mongolia, papua new guinea, the philippines and viet nam) in the region are on the who global list of 30 countries with a high burden of tb and multidrug-resistant or rifampicin-resistant tb (mdr/rrtb) for 2021–2025.13 countries and areas of the region have striven to adopt the changing who recommendations for the diagnosis and treatment of dr-tb. the regional green light committee (rglc), established in 2011 as a regional dr-tb advisory committee to who, has supported the scale-up of the programmatic management of dr-tb (pmdt) in countries with a high mdr/ rr-tb burden in the region.14 this analysis provides an overview of the status and progress of dr-tb diagnosis and treatment in six priority countries in the western pacific region in line with who recommendations. methods the western pacific regional framework to end tb: 2021–2030 indicates 10 priority countries in the region.15 six countries that are directly supported by rglc – cambodia, the lao people’s democratic republic, mongolia, papua new guinea, the philippines and viet nam – were selected for this descriptive analysis of the status and progress of dr-tb diagnosis and treatment using information from interviews with countries and the who tb database. indicators to assess current diagnosis and treatment processes for dr-tb were based on recommendations in the latest who guidelines; they included: • use of xpert mtb/rif, xpert mtb/rif ultra (xpert ultra) and xpert mtb/xdr for diagnostic tests; • use of shorter all-oral bedaquiline-containing regimens; • discontinuation of kanamycin and capreomycin for mdr/rr-tb; and • use of a bedaquiline, pretomanid and linezolid (bpal) regimen.6,8 indicators to assess the progress of diagnosis and treatment for dr-tb were from the latest who global tb reports; they included: • percentage of tb patients tested for rifampicin resistance; wpsar vol 13, no 4, 2022 | doi: 10.5365/wpsar.2022.13.4.972 https://ojs.wpro.who.int/4 oh et alprogress on diagnosis and treatment of dr-tb in the western pacific table 2. status of dr-tb diagnosis in priority countries in the western pacific region in 2021 item cambodia lao pdr mongolia papua new guinea philippines viet nam xpert mtb/ rif used as an initial diagnostic test for tb and rifampicin resistance detection in some areas (all areas by 2023) yes yes yes yes yes (only for high-risk groups and people with abnormal lesion on chest x-ray) national policy and algorithm indicate universal access to drug susceptibility testing yes yes yes yes yes yes number of genexpert machines (per 1 million population) 107 (6.4) 57 (7.8) 42 (12.7) 85 (9.6) 587 (5.4) 285 (3.0) use of xpert ultra replacing xpert mtb/rif since 2019 together with xpert mtb/rif since 2021 together with xpert mtb/rif since 2021 together with xpert mtb/rif since 2017 together with xpert mtb/rif since 2020 together with xpert mtb/rif since 2018 use of xpert mtb/xdr no planned in 2022 no planned in 2022 planned in 2022 planned in 2022 fl-lpa used to detect isoniazid resistance among rifampicinsusceptible tb yes (ad hoc since 2019) no no no no no fl-lpa used to detect isoniazid resistance among rifampicinresistant tb yes (ad hoc since 2018) no yes (routinely since 2016) yes (routinely) yes (routinely since 2021) yes (ad hoc since 2016) sl-lpa used as an initial test to detect fluoroquinolone resistance among confirmed mdr/rr-tb yes (since 2017) yes (since 2016) yes (since 2016) yes yes (since 2017) yes (since 2016) use of truenat planned as a pilot in 2022 no no no planned as a pilot in 2022 planned as a pilot in 2022 phenotypic drug susceptibility testing for new and repurposed drugs no lzd (bdq, cfz, dlm planned) bdq, cfz, lzd no no bdq, cfz, dlm, lzd (pa planned) bdq: bedaquiline; cfz: clofazimine; dlm: delamanid; fl-lpa: first-line line probe assay; lzd: linezolid; mdr/rr-tb: multidrug-resistant tuberculosis or rifampicin-resistant tuberculosis; pa: pretomanid; pdr: people’s democratic republic; sl-lpa: second-line line probe assay; tb: tuberculosis; xpert mtb/rif: an automated nucleic acid amplification test for mycobacterium tuberculosis complex and resistance to the drug rifampicin; xpert ultra: xpert mtb/rif ultra. wpsar vol 13, no 4, 2022 | doi: 10.5365/wpsar.2022.13.4.972https://ojs.wpro.who.int/ 5 progress on diagnosis and treatment of dr-tb in the western pacificoh et al guinea) increased between 2017 and 2020, with some fluctuations (fig. 1). the number of people diagnosed with mdr/rr-tb and the number starting on treatment per year in all countries has increased since 2010 (fig. 2). however, in the lao people’s democratic republic, mongolia and the philippines, there was a decrease in the number of mdr/rr-tb cases diagnosed in 2020 compared with 2019. this decrease started in 2014 in mongolia. the proportion of enrolment in treatment among diagnosed cases exceeded 80% in 2020 in mongolia (104%) and viet nam (89%), whereas it was 80% or below in the lao people’s democratic republic (80%), papua new guinea (76%) and the philippines (78%). the percentage of mdr/rr-tb cases tested for susceptibility to fluoroquinolones in four priority countries between 2015 and 2020 (no reports from cambodia and papua new guinea) varied with increased coverage in mongolia and viet nam (fig. 3). status of dr-tb treatment the six priority countries are also at different stages in the uptake of who recommendations for dr-tb treatment (table 3). the category ii regimen for retreatment cases has been discontinued in all priority countries. however, the who-recommended regimen for rifampicin-susceptible and isoniazid-resistant tb (hr-tb) is used only in cambodia, mongolia, papua new guinea and viet nam. shorter injectable-containing regimens started in all priority countries between 2013 and 2017. in accordance with the 2020 update of the who guidelines on dr-tb treatment,8 the shorter all-oral bedaquiline-containing regimen has been used in cambodia, the lao people’s democratic republic, mongolia, the philippines and viet nam since 2020, with the shorter injectable-containing regimen being phased out accordingly. as per the 2019 who consolidated guidelines on dr-tb treatment,9 standardized longer regimens for fluoroquinolone-susceptible or fluoroquinolone-resistant mdr/rr-tb have been revised in cambodia, mongolia, papua new guinea, the philippines and viet nam, prioritizing group a drugs including bedaquiline and linezolid. kanamycin and capreomycin were no longer included in the treatment of mdr/rr-tb patients on longer regimens in all priority countries by 2020. among the medicines recommended for use in longer regimens,9 the following cases nationwide by 2023. in viet nam, xpert mtb/rif is limited to high-risk groups such as people living with hiv, children and people with abnormal lesions on chest x-ray. in priority countries, the number of genexpert machines per 1 million population ranges from three to 12.7 nationwide. xpert mtb/rif ultra (xpert ultra) has been introduced in all priority countries. in cambodia, xpert ultra had already replaced xpert mtb/rif at the time of the interview. in the other priority countries, xpert ultra is being used together with xpert mtb/rif. there are also plans to introduce xpert mtb/xdr in 2022 in the lao people’s democratic republic, papua new guinea, the philippines and viet nam. in cambodia, first-line line probe assays (fl-lpas) are used to detect isoniazid resistance among rifampicinsusceptible tb cases only on an ad hoc basis. however, in mongolia, papua new guinea and the philippines, fl-lpas are routinely used to detect isoniazid resistance among rifampicin-resistant tb cases, and in cambodia and viet nam, they are used in such cases but on an ad hoc basis. second-line line probe assays (sl-lpas) are used as an initial test to detect fluoroquinolone resistance among confirmed mdr/rr-tb cases in all priority countries. the use of truenat (a point-of-care rapid molecular test) for detection of tb and rifampicin resistance is planned as a pilot project in 2022 in cambodia, the philippines and viet nam. as the use of new and repurposed drugs in shorter and longer regimens is scaled up in priority countries, phenotypic drug susceptibility testing for those drugs is conducted or planned. in the lao people’s democratic republic, drug susceptibility testing for linezolid is in place, and drug susceptibility testing for bedaquiline, clofazimine and delamanid is planned. in mongolia, drug susceptibility testing for bedaquiline, linezolid and clofazimine is conducted. in viet nam, drug susceptibility testing for bedaquiline, linezolid, clofazimine and delamanid is conducted and drug susceptibility testing for pretomanid is planned. progress of dr-tb diagnosis the percentage of new and previously treated tb patients tested for rifampicin resistance in four of the priority countries (no reports from cambodia and papua new wpsar vol 13, no 4, 2022 | doi: 10.5365/wpsar.2022.13.4.972 https://ojs.wpro.who.int/6 oh et alprogress on diagnosis and treatment of dr-tb in the western pacific fig. 1. percentage of new and previously treated tb patients tested for rifampicin resistance in four priority countries, 2017–2020 (no reports from cambodia and papua new guinea) fig. 2. number of people diagnosed with mdr/rr-tb and enrolled in mdr-tb treatment in six priority countries, 2010–2020 ! year p er ce nt ag e (% ) new retreatment lao pdr philippines viet nam mongolia pdr: people’s democratic republic pdr: people’s democratic republic wpsar vol 13, no 4, 2022 | doi: 10.5365/wpsar.2022.13.4.972https://ojs.wpro.who.int/ 7 progress on diagnosis and treatment of dr-tb in the western pacificoh et al various treatment adherence interventions for mdr/ rr-tb patients are offered in the six priority countries (table 2). material support (e.g. lunch, transport and cash transfer) is provided in all priority countries. psychological support is offered in cambodia, the lao people’s democratic republic, mongolia and papua new guinea. patient and staff education is provided in all priority countries. digital medication monitoring has been implemented as a pilot project in the philippines and viet nam. several treatment administration options for mdr/ rr-tb patients are provided in priority countries. in cambodia and viet nam, the main mode of treatment administration is community-based directly observed treatment (dot) by health-care workers or family members. in mongolia, papua new guinea and the philippines, both facility-based dot by health-care workers and community-based dot by family members are used. in the lao people’s democratic republic, the main modality drugs are unavailable: imipenem-cilastatin and meropenem in cambodia; cycloserine, imipenem-cilastatin, meropenem, streptomycin and p-aminosalicylic acid in the lao people’s democratic republic; none in mongolia; imipenem-cilastatin and meropenem in papua new guinea; meropenem in the philippines; and meropenem in viet nam. the bpal regimen recommended in 2019 for operational research has been used in the lao people’s democratic republic, the philippines and viet nam since 2020 or 2021. mongolia commenced the bpal regimen under programmatic conditions in 2021. culture monitoring for mdr/rr-tb patients on treatment is conducted monthly in all priority countries except for papua new guinea. elective partial lung resection (lobectomy or wedge resection) alongside a recommended mdr-tb regimen is being undertaken in mongolia and the philippines. fig. 3. percentage of mdr/rr-tb cases tested for susceptibility to fluoroquinolones in four priority countries, 2015–2020 (no reports from cambodia and papua new guinea) pdr: people’s democratic republic ! p er ce nt ag e (% ) year lao pdr philippines viet nam mongolia wpsar vol 13, no 4, 2022 | doi: 10.5365/wpsar.2022.13.4.972 https://ojs.wpro.who.int/8 oh et alprogress on diagnosis and treatment of dr-tb in the western pacific table 3. status of dr-tb treatment in priority countries in the western pacific region in 2021 item cambodia lao pdr mongolia papua new guinea philippines viet nam discontinuation of category ii regimen yes (in 2020) yes (in 2018) yes (in 2020) yes (in 2017) yes (in 2017) yes (in 2018) 6 rez-lfx for hr-tb yes (since 2018) no yes (since 2020) yes (since 2020) no yes (since 2018) shorter injectablecontaining regimen 2017–2021 2013–2020 2016–2020 yes (since 2016) 2015–2021 2016–2020 shorter all-oral bedaquilinecontaining regimen yes (since 2020) yes (since 2020) yes (since 2020) no yes (since 2020) yes (since 2021) standardized longer regimen for fluoroquinolonesusceptible mdr/ rr-tb 6 months bdq-lfx-lzdcfz/12–14 months lfx-lzdcfz or 12–14 months lfx-cfz-cs n/a (shorter all-oral bdqcontaining regimen solely used) 6 months of 2–3 in group a & 1–2 in group b & 1–2 in group c/ 12–14 months of 1–2 in group a & 1–2 in group b & 1–2 in group c 6 months bdqlfx-lzd-cfz/12 months lfx-lzdcfz 6 months lfx-bdq-lzdcfz/12–14 months lfx-lzdcfz bdq-lfx-lzdcfz-1 in group c or lfx-lzd-cfzcs-1 in group c standardized longer regimen for fluoroquinoloneresistant mdr/ rr-tb 6 months bdq-lzd-cfzcs-dlm/12–14 months lzdcfz-cs n/a (bpal solely used) n/a (individualized) 6 months bdqlzd-cfz-cs/12–14 months lzd-cfzcs n/a (individualized) discontinuation of kanamycin and capreomycin for mdr/rr-tb yes (in 2020) yes (in 2019) yes (in 2020) yes (in 2020) yes (in 2019) yes (in 2020) unavailable drugs in longer regimens ipm-cln, mpm cs, ipm-cln, mpm, s, pas none ipm-cln, mpm mpm mpm use of bpal regimen no yes (under or conditions since 2020) yes (under programmatic conditions since 2021) no yes (under or conditions since 2021) yes (under or conditions since 2021) culture monitoring for mdr/rr-tb monthly monthly monthly irregular due to laboratory instability monthly monthly elective partial lung resection no no yes no yes no treatment adherence interventions material support (us$ 30 per month) psychological support patient education staff education material support (us$ 5 per day) psychological support patient education staff education material support (lunch & transportation) psychological support patient education staff education material support (us$ 57–100 per month) psychological support patient education staff education material support (us$ 18 per week) patient education staff education digital medication monitor (pilot) material support (us$ 10 per month) patient education staff education digital medication monitor (pilot) treatment administration options communitybased dot by healthcare workers or family members facility-based dot by health-care workers facility-based dot by healthcare workers communitybased dot by family members vot (pilot) facility-based dot by healthcare workers communitybased dot by family members facility-based dot by healthcare workers communitybased dot by family members vot (pilot) communitybased dot by health-care workers or family members vot (pilot) model of care mainly ambulatory care mainly hospitalization hospitalization until sputum conversion followed by ambulatory care mainly ambulatory care mainly ambulatory care hospitalization up to 1 month followed by ambulatory care bdq: bedaquiline; bpal: bedaquiline, pretomanid and linezolid; cfz: clofazimine; cs: cycloserine; dlm: delamanid; dot: directly observed treatment; e: ethambutol; hrtb: rifampicin-susceptible, isoniazid-resistant tuberculosis; ipm-cln: imipenem-cilastatin; lfx: levofloxacin; lzd: linezolid; mdr/rr-tb: multidrug-resistant tuberculosis or rifampicin-resistant tuberculosis; mpm: meropenem; or: operational research; pas: p-aminosalicylic acid; pdr: people’s democratic republic; r: rifampicin; rez-lfx: rifampicin, ethambutol, pyrazinamide and levofloxacin; s: streptomycin; vot: video-observed treatment; z: pyrazinamide. group a: levofloxacin/moxifloxacin, bedaquiline and linezolid. group b: clofazimine and cycloserine/terizidone. group c: ethambutol, delamanid, pyrazimide, imipenem-cilastatin, meropenem, amikacin/streptomycin, ethionamide/prothionamide and p-aminosalicylic acid. wpsar vol 13, no 4, 2022 | doi: 10.5365/wpsar.2022.13.4.972https://ojs.wpro.who.int/ 9 progress on diagnosis and treatment of dr-tb in the western pacificoh et al also, the number of xpert mtb/rif sites and genexpert machines has increased, with the eligibility criteria extended to all people to be evaluated for tb. as a result, the number of people diagnosed with mdr/rr-tb and the percentage of tb patients tested for rifampicin resistance have also increased. for dr-tb treatment, shorter regimens for mdr/rr-tb treatment are used, with the shorter all-oral bedaquiline-containing regimen replacing the shorter injectable-containing regimen. new and repurposed drugs have been included in shorter or longer regimens, and kanamycin and capreomycin have been withdrawn. the model of care for mdr/rr-tb treatment is transitioning towards decentralization and increased use of ambulatory care. consequently, the treatment outcomes for mdr/rr-tb cases have improved in these priority countries. the rglc has supported the scale-up of programmatic management of dr-tb in priority countries.14 in accordance with who recommendations, the committee has provided technical inputs to national strategies or guidelines related to dr-tb; assisted in national capacitybuilding activities (e.g. in-person workshops or webinars); and conducted annual rglc monitoring missions, where members of the committee and who staff have provided recommendations and have monitored countries’ actions to previous recommendations.14,18 therefore, most of the new diagnostics and regimens have been implemented in a timely manner in the priority countries. covid-19 has impacted the diagnosis and treatment of tb and dr-tb since 2020.19 the decrease in the number of mdr/rr-tb cases diagnosed in the lao people’s democratic republic, mongolia and the philippines in 2020 can be attributed to the decrease in tb notifications due to restricted visits to health facilities and the repurposing of tb staff and facilities for the covid-19 response. genexpert machines have been repurposed for covid-19 diagnosis; also, stockouts of cartridges and a lack of equipment maintenance may have contributed to the decrease in mdr/rr-tb diagnoses. despite these difficulties, covid-19 has facilitated innovations in dr-tb treatment.20 all priority countries have expedited the transition from injectable-containing shorter or longer regimens to all-oral shorter or longer regimens, to minimize patient visits to health facilities. hospitalization for treatment and facility-based dot has been minimized, and community-based dot has been facilitated in all priority countries. also, the use of digital is facility-based dot by health-care workers during hospitalization. video-observed treatment (vot) has been conducted as a pilot project in mongolia, the philippines and viet nam. mdr/rr-tb patients are treated mainly through ambulatory care in papua new guinea and the philippines, whereas most patients are treated during hospitalization in the lao people’s democratic republic. in mongolia, patients are hospitalized until their sputum conversion from positive to negative, and in viet nam, patients are hospitalized for up to 1 month. in cambodia, patients were hospitalized for the first week for a workup and monitoring of a new regimen before the coronavirus disease (covid-19) pandemic; however, this practice has since been restricted to ambulatory care only. progress of dr-tb treatment where data were available, the number of mdr/rr-tb cases treated with bedaquiline and the shorter regimen between 2015 and 2019 increased in all six priority countries, although there were decreases observed between 2018 and 2019 in cambodia, the lao people’s democratic republic and the philippines (fig. 4). the use of the all-oral longer regimen increased between 2019 and 2020 in the philippines (no report from the other countries). treatment outcomes for mdr/rr-tb cases started on treatment in 2014–2018 in the six priority countries differed (fig. 5). the proportion of cases with treatment success increased in the lao people’s democratic republic (from 67% in 2014 to 84% in 2018) and the philippines (from 46% in 2014 to 67% in 2018), mainly due to a reduction in the proportion of treatment failure in the lao people’s democratic republic and to patient loss to follow-up in the philippines. the proportion of cases with treatment success was similar each year in mongolia and viet nam, and fluctuated from year to year in cambodia and papua new guinea. discussion dr-tb diagnosis and treatment in the western pacific region have changed drastically over the past decade. as shown by the six priority countries, national policies and algorithms now recommend xpert mtb/rif as an initial diagnostic test for tb and rifampicin resistance detection; wpsar vol 13, no 4, 2022 | doi: 10.5365/wpsar.2022.13.4.972 https://ojs.wpro.who.int/10 oh et alprogress on diagnosis and treatment of dr-tb in the western pacific that there may be an insufficient number of laboratories for sl-lpa for nationwide coverage. for example, in the philippines, a large country, there was only one laboratory functional for sl-lpa between 2020 and 2021 from among three designated laboratories, because one facility was repurposed for covid-19 testing and another had never started sl-lpa testing. it has been reported from the field that sl-lpa may be underused in areas where xpert mtb/rif-confirmed rr-tb patients are initiated on mdr-tb treatment without sl-lpa testing against national guidelines. there may also be missing data on sllpa results during the recording and reporting process. with the lao people’s democratic republic, papua new guinea, the philippines and viet nam soon to introduce xpert mtb/xdr, a new landscape of drug susceptibility testing for fluoroquinolones is expected. due to the underuse of fl-lpa and regimens for hr-tb in most priority countries, diagnosis and treatment of hr-tb remain limited in the region. fl-lpa or the soon-to-be-introduced xpert mtb/xdr should be further used to detect isoniazid resistance in cases of rifampicintechnology such as vot was accelerated in three priority countries during the pandemic. this analysis shows that there is still a gap in enrolment in treatment for cases diagnosed with mdr/rr-tb in some priority countries. programme staff in the field have reported that this might be due to several factors, including death or loss to follow-up of cases before treatment commencement; significant delay in diagnosis due to the long turnaround time of sl-lpa or phenotypic drug susceptibility testing results; and delay in treatment due to health system challenges including drug supply interruption, stockouts or insufficient staff capacities, or inaccuracies in recording and reporting from paper-based systems. there should be a focus on addressing these factors for more timely patient treatment enrolment in those countries. although sl-lpa has been successfully promoted as initial drug susceptibility testing for fluoroquinolones in all priority countries, for various reasons, coverage is suboptimal in some of these countries. one issue is fig. 4. number of mdr/rr-tb cases treated with all-oral longer regimen, bedaquiline and shorter regimen in six priority countries, 2015–2020 ! year n u m b er o f ca se s all-oral longer regimen bedaquiline shorter regimen lao pdrcambodia papua new guinea philippines viet nam mongolia pdr: people’s democratic republic wpsar vol 13, no 4, 2022 | doi: 10.5365/wpsar.2022.13.4.972https://ojs.wpro.who.int/ 11 progress on diagnosis and treatment of dr-tb in the western pacificoh et al call bias from pmdt focal points, despite verification by follow-up communication or subsequent rglc missions. although attempts were made to refer to official documents, some answers were provided based on memory. notwithstanding these limitations, this analysis provides a comprehensive and practical insight into the progress of pmdt in these six priority countries in the region. in conclusion, these six priority countries in the western pacific region, in collaboration with the rglc, have achieved considerable progress in the diagnosis and treatment of dr-tb in line with the evolving who recommendations over the past decade. automated nucleic acid amplification tests and shorter all-oral regimens containing new and repurposed drugs are now used for dr-tb diagnosis and treatment in the region, leading to reductions in the case-detection gap and enhanced treatment outcomes. however, several challenges remain, particularly the impact of the covid-19 pandemic, suboptimal patient management and health system issues. susceptible tb (at least among retreatment cases), given the high rate of isoniazid resistance in some countries. moreover, the regimen for hr-tb should be implemented in more of the priority countries. there was static and fluctuating mdr/rr-tb treatment success in some priority countries, despite the roll-out of shorter regimens. although they are shorter, these regimens do not guarantee improved treatment outcomes because they still require clinical management, strong patient support and monitoring systems to ensure patient adherence to treatment. in those countries, expansion of shorter regimens should be reinforced by optimal management and supportive health systems for improved treatment outcomes. our analysis has several limitations. first, there were no reported data for some indicators for certain years or from particular countries in the who database, impeding a complete analysis. second, there is a possibility of repdr: people’s democratic republic fig. 5. treatment outcomes for mdr/rr-tb cases started on treatment in six priority countries, 2014–2018 wpsar vol 13, no 4, 2022 | doi: 10.5365/wpsar.2022.13.4.972 https://ojs.wpro.who.int/12 oh et alprogress on diagnosis and treatment of dr-tb in the western pacific 6. who consolidated guidelines on tuberculosis module 3: diagnosis – rapid diagnostics for tuberculosis detection, 2021 update. geneva: world health organization; 2021. available from: https://apps.who. int/iris/handle/10665/342331, accessed 19 july 2022. 7. who treatment guidelines for drug-resistant tuberculosis, 2016 update. geneva: world health organization; 2016. available from: https://apps.who.int/iris/handle/10665/250125, acessed 19 july 2022. 8. who consolidated guidelines on tuberculosis module 4: treatment – drug-resistant tuberculosis treatment. geneva: world health organization; 2020. available from: https://apps.who.int/iris/handle/10665/332397, accessed 19 july 2022. 9. who consolidated guidelines on drug-resistant tuberculosis treatment. geneva: world health organization; 2019. available from: https://apps.who.int/iris/handle/10665/311389, accessed 19 july 2022. 10. who treatment guidelines for isoniazid-resistant tuberculosis: supplement to the who treatment guidelines for drug-resistant tuberculosis. geneva: world health organization; 2018. available from: https://apps.who.int/iris/handle/10665/260494, accessed 19 july 2022. 11. guidelines for the treatment of drug-susceptible tuberculosis and patient care, 2017 update. geneva: world health organization; 2017. available from: https://apps.who.int/iris/handle/10665/255052, accessed 19 july 2022. 12. morishita f, viney k, lowbridge c, elsayed h, oh kh, rahevar k, et al. epidemiology of tuberculosis in the western pacific region: progress towards the 2020 milestones of the end tb strategy. western pac surveill response j. 2020;11(4):10–23. doi:10.5365/ wpsar.2020.11.3.002 pmid:34046237 13. who global lists of high burden countries for tuberculosis (tb), tb/hiv and multidrug/rifampicin-resistant tb (mdr/rr-tb), 2021–2025: background document. geneva: world health organization; 2021. available from: https://apps.who.int/iris/handle/10665/341980, accessed 19 july 2022. 14. islam t, marais bj, nhung nv, chiang cy, yew ww, yoshiyama t, et al. western pacific regional green light committee: progress and way forward. int j infect dis. 2015;32:161–5. doi:10.1016/j. ijid.2015.01.001 pmid:25809774 15. western pacific regional framework to end tb: 2021–2030. manila: who regional office for the western pacific; 2022. available from: https://apps.who.int/iris/handle/10665/352278, accessed 19 july 2022. 16. global tuberculosis report 2020. geneva: world health organization; 2020. available from: https://apps.who.int/iris/handle/10665/336069, accessed 19 july 2022. 17. global tuberculosis programme: tuberculosis data. geneva: world health organization. available from: https://www.who.int/ teams/global-tuberculosis-programme/data, accessed 19 july 2022. 18. yassin ma, samson k, wandwalo e, grzemska m, gegia m, nwaneri n, et al. performance-based technical support for drug-resistant tb responses: lessons from the green light committee. int j tuberc lung dis. 2020;24(1):22–7. doi:10.5588/ijtld.19.0376 pmid:32005303 19. dheda k, perumal t, moultrie h, perumal r, esmail a, scott aj, et al. the intersecting pandemics of tuberculosis and covid-19: population-level and patient-level impact, clinical presentation, and corrective interventions. lancet respir med. 2022;10(6):603–22. doi:10.1016/s2213-2600(22)00092-3 pmid:35338841 20. chiang cy, islam t, xu c, chinnayah t, garfin amc, rahevar k, et al. the impact of covid-19 and the restoration of tuberculosis services in the western pacific region. eur respir j. 2020;56(4):2003054. doi:10.1183/13993003.03054-2020 pmid:32978310 the continued commitment of countries to a speedy recovery from covid-19, patient-centred care, capacity building and a robust health system is needed to continue progressing towards ending dr-tb in the region. acknowledgements the authors wish to thank the national tb programmes and their partners in cambodia, the lao people’s democratic republic, mongolia, papua new guinea, the philippines and viet nam for their participation in the interviews and for providing information. they are also grateful to members of the regional green light committee, western pacific region for their input on the study design and results. conflicts of interest the authors have no conflicts of interest to declare. ethics statement ethical clearance was not required because this report was part of a regular evaluation of programme performance. funding none. references 1. global tuberculosis report 2021. geneva: world health organization; 2021. available from: https://apps.who.int/iris/handle/10665/346387, accessed 19 july 2022. 2. dheda k, gumbo t, maartens g, dooley ke, mcnerney r, murray m, et al. the epidemiology, pathogenesis, transmission, diagnosis, and management of multidrug-resistant, extensively drug-resistant, and incurable tuberculosis. lancet respir med. 2017;s22132600(17)30079-6. doi:10.1016/s2213-2600(17)30079-6 pmid:28344011 3. automated real-time nucleic acid amplification technology for rapid and simultaneous detection of tuberculosis and rifampicin resistance: xpert mtb/rif assay for the diagnosis of pulmonary and extrapulmonary tb in adults and children: policy update. geneva: world health organization; 2013. available from: https://apps.who. int/iris/handle/10665/112472, accessed 19 july 2022. 4. the use of molecular line probe assays for the detection of resistance to second-line anti-tuberculosis drugs: policy guidance. geneva: world health organization; 2016. available from: https://apps. who.int/iris/handle/10665/246131, accessed 19 july 2022. 5. who meeting report of a technical expert consultation: non-inferiority analysis of xpert mtf/rif ultra compared to xpert mtb/ rif. geneva: world health organization; 2017. available from: https://apps.who.int/iris/handle/10665/254792, accessed 19 july 2022. https://ojs.wpro.who.int/ 1wpsar vol 14, no 1, 2023 | doi: 10.5365/wpsar.2023.14.1.996 regional analysis t uberculosis (tb) remains a disease with a major global impact. in 2020, an estimated 9.9 million people developed tb; there were an estimated 1.3 million deaths among human immunodeficiency virus (hiv)-negative tb cases and an estimated 214 000 deaths among hiv-positive tb cases reported worldwide.1 the world health organization (who) western pacific region, which consists of 37 countries and areas, accounted for 18% of these estimated cases. from 2015 to 2020, the estimated global tb incidence and number of deaths declined by 6% and 13%, respectively, with annual reductions of 1.2% and 2.6%, respectively. the population of the 20 pacific island countries and areas (pics) of the western pacific region included in this paper is approximately 3.4 million. the pics are made up of around 1300 islands with limited transport services between them.2,3 economic status varies by country and area, with gross national income data available for six of the 16 pics which are classified as highincome countries, while the remainder are classified as middle-income countries.4 twelve pics are supported by the global fund to fight aids, tuberculosis and malaria, three of which are classified as high-income countries.5 the estimated tb incidence in the pics is lower than other countries in the western pacific.6 however, the epidemiology of tb is diverse, ranging from countries with high tb burdens to those in the pre-elimination stage (defined as <10 tb cases per million).7 among the pics, kiribati, the marshall islands and the federated states of micronesia had a high estimated tb incidence per capita in 2020.8 some countries reported a low a world health organization regional office for the western pacific, manila, philippines. b world health organization, geneva, switzerland. c division of pacific technical support, world health organization, suva, fiji. published: 22 february 2023 doi: 10.5365/wpsar.2023.14.1.996 objective: tuberculosis (tb) is one of the most important infectious diseases with an estimated 9.9 million people falling ill globally in 2020. we describe the epidemiology of tb in the pacific island countries and areas (pics) to inform potential priority actions to implement the western pacific regional framework to end tb 2021–2030. methods: a descriptive analysis was conducted using annual tb surveillance data submitted by national tb programmes to the world health organization (who) and tb burden estimates (incidence rates and number of deaths) generated by who for the pics, for the period 2000–2020. we also analysed tb case numbers, multidrug-resistant/rifampicin-resistant tb (mdr/rr-tb), recent risk factor indicators and treatment outcomes. results: the estimated tb incidence rate in the pics increased between 2000 and 2020 from 62 to 69 per 100 000 population, with an 8% reduction observed since 2015. tb cases increased by 29% during 2000–2020, with 1746 cases in 2020 and a high proportion in children (19%). bacteriological diagnosis was used for 58% of total tb cases, although some countries reported clinical diagnoses in over 60% of cases. from 2015 to 2019, 52 mdr/rr-tb cases were reported and there were 94 tb/hiv coinfected cases in 2015–2020. treatment success was 74% in 2019 due to 18% of cases being unevaluated. in 2020, the estimated proportion of tb cases attributable to smoking, malnutrition, alcohol abuse and diabetes was 17%, 16%, 11% and 9%, respectively. discussion: there was an increasing trend in tb cases, estimated incidence and deaths between 2000 and 2020. laboratory services were scaled up in some pics and case-finding activities greatly contributed to the detection of cases. in order to end the incidence of tb, continued efforts on case finding, contact investigation and scaling up tb preventive treatment should be prioritized. at the same time, collaboration with other sectors for risk factor management and decentralized management need to be considered. epidemiology of tuberculosis in the pacific island countries and areas, 2000–2020 manami yanagawa,a fukushi morishita,a kyung hyun oh,a kalpeshsinh rahevar,a tauhidul abm islamb and subhash yadavc correspondence to manami yanagawa (email: yanagawam@who.int) wpsar vol 14, no 1, 2023 | doi: 10.5365/wpsar.2023.14.1.996 https://ojs.wpro.who.int/2 yanagawa et altb epidemiology in the pacific rates and deaths.11 methods used to estimate the tb disease burden are described in the technical annexes of the report.12 the descriptive analysis included estimated incidence and deaths, case numbers (totals, by type of tb and diagnosis category), numbers of multidrug-resistant/ rifampicin-resistant tb (mdr/rr-tb) cases detected and enrolled in multidrug-resistant tuberculosis (mdrtb) treatment and key indicators of collaborative tb/hiv activities. the proportion of bacteriologically confirmed, clinically diagnosed pulmonary tb (ptb) and extrapulmonary tb (eptb) cases, as well as age and sex distributions and treatment outcomes, were compared across countries and areas. the proportion of tb cases attributable to alcohol abuse, diabetes mellitus, smoking and undernutrition were also analysed. the estimated numbers of cases attributable to these risk factors generated by who data were used to make an overall comparison of the cases in the pics and the western pacific region. the number of pics with these estimations is limited and, therefore, the risk factors vary. the definitions of cases and treatment outcomes were in accordance with the who reporting framework for tb.13 the diagnosis category was changed in 2013 when new case definitions of bacteriologically confirmed tb and clinically diagnosed tb were introduced to replace smear-positive and smear-negative tb, respectively, to align with the increased availability of xpert testing. most of the analyses, such as age and sex distribution, hiv testing data and treatment outcomes, are of incident cases which were redefined as “new and relapse (or previous history unknown)” cases, regardless of bacteriological confirmation. estimated incidence and deaths, 95% confidence intervals (ci) and total case numbers for the subregion were calculated by aggregating existing burden estimates and data from each country and area. we used population estimates from the united nations population division to calculate rates per capita where required. data analyses and visualization were conducted with the statistical software package r 4.1.2 (comprehensive r archive network: https://cran.r-project.org/). only those countries and areas that had data for each variable, with more than five cases between 2015 and 2020, were included in the analyses. treatment success rate despite the relatively young age group affected.6 in 2015, the regional framework for action on implementation of the end tb strategy in the western pacific 2016–2020 was endorsed by the who regional committee for the western pacific,9 following the release of the end tb strategy.10 since then, recommended interventions from the framework have been implemented in countries and areas to achieve the 2020 milestones and targets. the new western pacific regional framework to end tb 2021–2030 was endorsed by the regional committee in october 2021.8 the framework is intended to support member states in making further progress towards ending tb. in this paper, we describe the epidemiology of tb in the pics by analysing existing tb surveillance and burden estimate data available in the who global tb programme for the period 2000–2020, focusing particularly on 2015 and 2020. the results may inform potential priority actions required to implement the western pacific regional framework to end tb 2021–2030 in the pics. methods this descriptive analysis used annual tb surveillance data submitted by national tb programmes to who and tb burden estimates (incidence and mortality) generated by who for the pics for the period 2000–2020. this timeframe was selected as burden estimates were available for that period. a baseline of 2015 was used to monitor progress against the milestones and targets set by the end tb strategy and the regional framework for 2016–2020. routine tb surveillance data were submitted annually by 20 national tb programmes in the pics – american samoa, the cook islands, fiji, french polynesia, guam, kiribati, the marshall islands, the federated states of micronesia, nauru, new caledonia, niue, the northern mariana islands, palau, samoa, the solomon islands, tokelau, tonga, tuvalu, vanuatu and wallis and futuna – referred to as a subregion in this paper. the pitcairn islands are excluded from annual tb data collection and are not included in the analysis. the verified data are published on the who website in the annual global tuberculosis report 2022, together with estimates of the tb disease burden, which are measured by incidence wpsar vol 14, no 1, 2023 | doi: 10.5365/wpsar.2023.14.1.996https://ojs.wpro.who.int/ 3 tb epidemiology in the pacificyanagawa et al were bacteriologically confirmed in 2020, with clinically diagnosed cases accounting for the rest. the proportion of eptb among all tb cases was 29% (n = 513/1746) in 2020. by country and area, between 2000 and 2020, tb cases increased in fiji (from 144 to 431), kiribati (from 252 to 385) and the marshall islands (from 34 to 147) (fig. 4). tb cases decreased between 2000 and 2020 in new caledonia, the northern mariana islands, samoa, tonga, vanuatu and wallis and futuna, with some fluctuations observed over the period. in samoa, tb cases decreased by 70% (from 43 to 13) over the same period. age and sex distribution tb cases with data on age and sex were reported from 16 pics in 2020. among these 1695 cases, 56% (n = 945) were male, 19% (n = 328) were children aged <15 years and 8% (n = 141) were older adults aged ≥65 years. in the subregion, the notification rate was higher for older age groups, with the highest rate for both males and females aged 55–65 years (117 cases and 79 cases per 100 000 population, respectively) (fig. 5). notification rates were higher in males aged ≥25 years, while they were higher for females among children and younger adults. high tb notification rates were reported for children aged <15 years for both sexes in the marshall islands, at over 250 per 100 000 population. also, the marshall islands had the highest proportion of tb cases in children at 37% (n = 54/147). in kiribati and tuvalu, rates of over 800 per 100 000 population were reported for males aged 55–64 years (fig. 5). diagnosis category and type of tb diagnosis category and type of tb were reported from 20 pics, four of which were excluded from the analysis as they reported less than five cases cumulatively between 2015 and 2020. bacteriological diagnosis was more common compared to clinical diagnosis in 2020 in 13 of the 16 pics that reported diagnosis category (fig. 6) with 58% of ptb cases in 2020 being bacteriologically confirmed (n = 4809/8302). there were higher proportions of clinical diagnosis for ptb cases in the federated states of micronesia (69% from 2015 to 2020), fiji (53% from 2019 to 2020) and the marshall islands (80% from 2018 results estimates of tb burden the estimated incidence rate of tb in the subregion increased from 62 (95% ci: 46–80) per 100 000 population in 2000 to 75 (95% ci: 57–96) per 100 000 population in 2015, before decreasing to 69 (95% ci: 54–86) per 100 000 population in 2020 (fig. 1a). this equates to an estimated 1680 cases (95% ci: 1266–2185) in 2000, 2390 cases (95% ci: 1825–3061) in 2015 and 2356 cases (95% ci: 1827–2936) in 2020. the estimated number of tb deaths increased from 176 (95% ci: 126–234) in 2000 to 212 (95% ci: 158–281) in 2015 and further increased to 268 (95% ci: 188–366) in 2020 (fig. 1b). the estimated tb incidence rate and the number of deaths among people living with hiv (plhiv) per 100 000 population in 2020 have remained low in the pics at 0.9 (95% ci: 0.5–2.0) and 10 (95% ci: 9–13), respectively. by country and area, the marshall islands and kiribati had the highest estimated tb incidence rates of 483 (95% ci: 370–611) and 425 (95% ci: 323–540) per 100 000 population, respectively (fig. 2). fiji had the highest estimated number of tb cases (n = 590), followed by kiribati (n = 510), the solomon islands (n = 450) and the marshall islands (n = 290). these four pics accounted for 78% of the total cases in the subregion. american samoa, samoa and wallis and futuna had an estimated tb incidence rate of <10 cases per 100 000 population in 2020. tb cases the number of reported tb cases (new and relapse) in the subregion has increased over the last two decades, ranging from 1229 in 2002 to 1991 in 2018 (fig. 3). between 2000 and 2020, the number of tb cases increased by 29% to 1746 in 2020. the number of bacteriologically confirmed or smear-positive tb cases increased by 66%, from 485 in 2000 to 804 in 2020. the number of clinically diagnosed or smear-negative cases ranged from 474 in 2000 to 429 in 2020, with some fluctuations. the number of eptb cases increased by 55%, from 331 in 2000 to 513 in 2020. among new and relapse ptb cases, 65% (n = 804/1233) wpsar vol 14, no 1, 2023 | doi: 10.5365/wpsar.2023.14.1.996 https://ojs.wpro.who.int/4 yanagawa et altb epidemiology in the pacific coinfection receiving antiretroviral therapy (art) were available from eight pics. the prevalence of hiv among tb cases and the proportion of tb and hiv coinfection receiving art have been sparsely recorded or reported by the majority of pics. data on plhiv eligible for tb preventive treatment and plhiv who were started on the treatment were not available in any of the pics. the proportion of tb cases with hiv status recorded in the subregion increased from 33% in 2003 to 71% in 2020 (fig. 8). this proportion varies by pic, with 100% reported in fiji, the northern mariana islands, palau and samoa in 2020, and less than 50% reported in french polynesia (43%), kiribati (42%) and the solomon islands (38%). the number of reported tb cases coinfected with hiv was low in the subregion, with 94 cases reported between 2015 and 2020 (16 cases per year on average, 0.8% [n = 94/11 311] of total notified cases). the prevalence of hiv among tb cases who were tested for hiv has remained below 5%, except for 2004 when to 2020). in the marshall islands, the number of ptb cases that were clinically diagnosed increased from 83 in 2017 to 321 in 2018. the proportion of ptb among new and relapse cases in the subregion between 2015 and 2020 was 78% (8752/11 189). drug-resistant tb mdr/rr-tb cases were reported from 15 pics between 2015 and 2019, while five pics (the cook islands, nauru, niue, tonga and wallis and futuna) reported no cases. there were 52 mdr/rr-tb cases detected, of which 87% (n = 45) were enrolled in mdr-tb treatment. the number of mdr/rr-tb cases fluctuated between eight and 14 per year with nine cases in 2019 (fig. 7). the highest number of mdr/rr-tb cases was reported in kiribati with nine detected and treated. indicators of collaborative tb/hiv activities data on known hiv status and hiv prevalence were available from 18 pics, and data on cases of tb and hiv fig. 1. (a) estimated tb incidence and notification rates of new and relapse tb cases, and (b) estimated number of tb deaths in pacific island countries and areas (including among people living with hiv), 2000–2020 in ci d en ce a n d n o ti � ca ti o n r at e p er 1 00 0 00 p o p u la ti o n to ta l t b d ea th s estimated incidence rate estimated incidence rate (hiv positive) noti�cation rate estimated number of deaths estimated number of deaths (hiv positive) 2020 milestone 2020 milestone wpsar vol 14, no 1, 2023 | doi: 10.5365/wpsar.2023.14.1.996https://ojs.wpro.who.int/ 5 tb epidemiology in the pacificyanagawa et al fig. 2. estimated number of tb cases and tb incidence rate per 100 000 population in pacific island countries and areas, 2020 estimated incidence rate estimated number of cases es ti m at ed n u m b er o f c as es estim ated in cid en ce rate p er 100 000 p o p u latio n treatment success rates of 90% or more were reported in eight pics for the 2019 patient cohort, and 100% in american samoa, the cook islands, palau and tonga (fig. 10). eight of the 16 pics had treatment success rates of less than 90%, while four of the pics reported less than 85%: tuvalu, the federated states of micronesia, french polynesia and fiji reported 84%, 81%, 80% and 31%, respectively. in fiji, 58% of cases (n = 333/572) were either not evaluated or did not have their treatment outcome recorded. risk factors data on the estimated proportion of tb cases attributable to alcohol abuse, diabetes mellitus, smoking and undernutrition are available for 12, 13, 10 and seven pics, respectively. these proportions were 17% (n = 226/1299) for smoking, 16% (n = 206/1297) for undernutrition, 11% (n = 154/1392) for alcohol abuse and 9% (n = 133/1509) for diabetes mellitus. the 9% (n = 2/22) was observed due to a small number of cases tested and detected. despite the decrease in hiv prevalence among tb cases in the subregion, there has been an increase in fiji, from a low of 0.8% in 2005 to 6.2% in 2019 and 5.0% in 2020. the proportion of tb and hiv coinfected cases receiving art was 79% in 2020, a decrease from over 88% reported between 2009 and 2019 (fig. 8). fiji submitted 81% (n = 109/135) of the data on art. treatment outcomes treatment outcomes were reported from 19 pics for the 2019 patient cohort, of which three pics reported no cases. the treatment success rate was 74% for new and relapse cases, 44% for retreatment cases (excluding relapse) and 57% for hiv-positive tb cases (fig. 9). approximately 18% of the new and relapse cases were not evaluated on their treatment outcomes. wpsar vol 14, no 1, 2023 | doi: 10.5365/wpsar.2023.14.1.996 https://ojs.wpro.who.int/6 yanagawa et altb epidemiology in the pacific fig. 3. number of tb notifications by diagnosis category in pacific island countries and areas, 2000–2020 fig. 4. number of tb notifications (new and relapse) by year in pacific island countries and areas that provided data, 2000–2020 n u m b er o f c as e n o ti �c at io n s n u m b er o f cases b y d iag n o sis categ o ry case noti�cations new pulmonary smear-positive (pre-2013) new pulmonary laboratory-con�rmed cases new pulmonary smear-negative/unknown/not done/other (pre-2013) new pulmonary clinically diagnosed cases new extrapulmonary relapse (pre-2013) treatment after failure/default/others (pre-2013) previously treated cases, excluding relapses others (i.e. history unknown) (pre-2013) n u m b er o f n o ti �e d t b c as es wpsar vol 14, no 1, 2023 | doi: 10.5365/wpsar.2023.14.1.996https://ojs.wpro.who.int/ 7 tb epidemiology in the pacificyanagawa et al fig. 5. age and sex distribution of tb notifications (new and relapse) per 100 000 population in the subregion overall and in pacific island countries and areas that provided data, 2020 r at e p er 1 00 0 00 p o p u la ti o n proportion of cases attributable to diabetes mellitus was higher in pics compared to the proportion in the entire western pacific region at 6%. conversely, the proportion of cases attributable to the other risk factors was almost the same or lower in pics than in the region overall, where it was 17% for smoking, 20% for undernutrition and 16% for alcohol abuse. among the pics, the highest proportions of tb cases attributable to smoking and undernutrition were estimated in the solomon islands at 19% (n = 61/170) and 31% (n = 100/321), respectively. of the 13 pics with data available for diabetes mellitus, the proportion was highest in nauru at 12% (n = 2/17) and in the marshall islands at 12% (n = 17/147), followed by kiribati at 10% (n = 39/385). of the 12 pics with data available for alcohol abuse, vanuatu reported the highest proportion at 13% (n = 11/83), followed by the solomon islands at 12% (n = 38/321). tb preventive treatment in 2020, of the 19 pics that reported case notification data, 53% reported the number of household contacts of new and relapse ptb cases that were bacteriologically confirmed and started on tb preventive treatment. in these pics, the number of contacts identified totalled 3049 in 2020. of those, 38% (n = 1159/3049) started tb preventive treatment, 19% (n = 220/1159) of whom were children aged under 5 years. discussion this analysis showed increases in the estimated tb incidence rates and the number of tb cases and deaths in the pacific islands subregion between 2000 and 2020. there was an increased proportion of bacteriological confirmation for tb diagnosis, increased hiv testing coverage in tb patients and sustained high art coverage in the wpsar vol 14, no 1, 2023 | doi: 10.5365/wpsar.2023.14.1.996 https://ojs.wpro.who.int/8 yanagawa et altb epidemiology in the pacific mdr/rr-tb: multidrug-resistant/rifampicin-resistant tuberculosis; mdr-tb: multidrug-resistant tuberculosis. fig. 6. number of tb notifications by year and type of diagnosis in pacific island countries and areas that provided data, 2015–2020 fig. 7. number of mdr/rr-tb cases reported and enrolled in mdr-tb treatment in pacific island countries and areas that provided data, 2015–2019 pr o p o rt io n b y ty p e o f d ia g n o si s (% ) extrapulmonary pulmonary clinically diagnosed pulmonary bacteriologically con�rmed n u m b er o f m d r/ rr -t b c as es detected mdr/rr-tb 2015 15 10 5 0 2016 2017 2018 2019 treatment enrolled wpsar vol 14, no 1, 2023 | doi: 10.5365/wpsar.2023.14.1.996https://ojs.wpro.who.int/ 9 tb epidemiology in the pacificyanagawa et al art: antiretroviral therapy. fig. 8. known hiv status, hiv prevalence in tb patients and antiretroviral therapy coverage for tb/hiv patients in pacific island countries and areas that provided data, 2003–2020 fig. 9. tb treatment outcomes by patient category in pacific island countries and areas that provided data, 2019 treatment success new and relapse tb retreatment, excluding relapse new and relapse hiv-positive tb failure died lost to follow-up not evaluated ades. increases in notifications can be driven by various factors including the improvement of tb screening, implementation of active case finding activities,14 improved recording and reporting,15 and increased tb transmission within the community. in fiji, for example, the tb notification rate in the younger population increased in the early 2010s, which might indicate increased community transmission.16 at 19%, the proportion of tb cases in children from the subregion in 2020 was higher than the who western pacific region at 4% and the global proportion at 12%. this underscores the importance of intensifying household contact investigation to cut the chain of transmission. in the marshall islands, case notifications sharply increased in 2018, mostly small number of patients requiring art. the results also highlighted a high proportion of tb cases in the younger population, poor treatment outcomes in some pics, and a large number of tb cases with underlying diabetes mellitus and other risk factors. pics have diverse tb burdens, with fiji, kiribati, the marshall islands and the solomon islands all considered high tb burden countries in the pacific, which was confirmed by the results of this analysis. in these pics, increased efforts to strengthen national tb programmes and secure domestic and external support are essential. the number of tb notifications increased in fiji, kiribati and the marshall islands over the last two decpe rc en ta g e (% ) wpsar vol 14, no 1, 2023 | doi: 10.5365/wpsar.2023.14.1.996 https://ojs.wpro.who.int/10 yanagawa et altb epidemiology in the pacific rif. the number of xpert testing sites has increased over time in fiji, kiribati, the solomon islands and vanuatu,11 which may have contributed to the early detection of drug-resistant tb cases and improved the proportion of bacteriological confirmation in tb diagnoses. treatment outcomes among mdr/rr-tb cases were not analysed in this report as the data were not available. this might be due to a lack of follow-up, recording or reporting. hiv prevalence among tb cases in the subregion was low, although an increased prevalence was reported in fiji. this is probably due to an increase in new hiv infections among the general population in fiji, which increased from 0.15 per 1000 population among adults aged 15–49 in 2010 to 0.32 per 1000 population in 2021.20 it is strongly recommended that plhiv be systematically screened for tb disease at each visit to a health facility.21 proper management of hiv, including initiation and continuation of art, is essential to prevent the development of tb disease among plhiv.22 simultaneously, continuous hiv screening among tb in clinically diagnosed cases. this is probably due to population-based screening programmes for latent and active tb which were conducted on ebeye and majuro islands in 2017 and 2018, covering nearly 75% of the national population.17 such population-based mass screening and treatment of latent and active tb has the potential to reduce the incidence of tb in a short period17 and could be a key intervention in advancing efforts to eliminate tb in pics, given their geographical isolation and limited population size.18 the number of reported mdr/rr-tb cases has increased but fluctuated over the last two decades, as observed in the western pacific region where small numbers and irregular mdr-tb caseloads were reported in the selected pics.19 since this report in 2014, kiribati has detected its first mdr/rr-tb cases with three each year since 2017.7 other areas, such as french polynesia and guam, have consistently reported mdr/rr-tb cases since 2015. these diagnoses may reflect improved surveillance systems and the expanded use of xpert mtb/ fig. 10. treatment outcomes among new and relapse tb cases in pacific island countries and areas that provided data, 2019 wpsar vol 14, no 1, 2023 | doi: 10.5365/wpsar.2023.14.1.996https://ojs.wpro.who.int/ 11 tb epidemiology in the pacificyanagawa et al methods of estimation that are based on surveys due to the strong stochasticity of the reported cases. secondly, the observed increase in the estimated number of deaths in 2020 might not reflect the actual number of deaths in the subregion. while the modelled estimate accounted for the shortfall in tb case detection due to the disruption of health services caused by the coronavirus disease (covid-19) pandemic, most pics reported no or limited covid-19 community transmission in 2020. therefore, extensive tb service disruption was unlikely. data submitted by the pics are often incomplete. notably, data on age and sex distribution and hiv test results were missing for 71% and 76% of the cohort, respectively. hence, some data shown in this report might not represent the subregion. in conclusion, the number of notified tb cases in pics has increased over the years, with signs of ongoing active community transmission, and the burden is distributed unevenly across countries and areas. the ongoing effort to scale up laboratory services is an achievement, and the implementation of community-based screening appears promising especially in small island settings. greater effort and investment are needed to reach the unreached population including those who have risk factors and socioeconomic and geographical disadvantages. furthermore, strengthening routine contact investigation, scaling up tb preventive treatment, and ensuring proper management of tb cases and comorbidities through a patient-centred approach are priority interventions to end tb in the context of pics. conflicts of interest the authors have no conflicts of interest to declare. ethics statement ethics approval was not required as we used publicly available, routinely collected and anonymized surveillance data. funding none. references 1. global tuberculosis report 2021. geneva: world health organization; 2021. available from: https://www.who.int/publications/i/ item/9789240037021, accessed 15 september 2022. patients and timely initiation of treatment among hiv coinfected cases is imperative.23 management of diabetes mellitus should be highlighted in the subregion, considering its high prevalence among the general population. of the 16 pics with these data available, nine reported a prevalence higher than 20% in 2021.24 among them, six were ranked in the top 10 countries with the highest prevalence of diabetes mellitus, with french polynesia exceeding 25%. for optimal management of diabetes mellitus, it is important to ensure accessibility to primary health-care services and community-level health promotion programmes targeting younger age groups.25 additionally, close collaboration and coordination between multiple disease programmes and sectors are crucial in addressing tb and its risk factors simultaneously.8 treatment success for new and relapse tb cases in the pics that reported the data was 74%. this is low when compared to the whole western pacific region where it has been approximately 90% over the past decade,5 and to the global data where it was 86% in 2019.1 the treatment success rate was low in fiji due to the high proportion of unevaluated cases, which may be attributable to the recent transition from the global fund-supported vertical programme, resulting in limited human resources responsible for recording and reporting. there are several more pics with success rates below 90%. these rates might be attributable to delays in diagnosis and treatment due to limited access to health facilities that provide tb services, coupled with the unique geographical challenges of pics. this may be underpinned by fear of financial burden and stigma. for example, in vanuatu, the majority of tb cases report having experienced stigma after diagnosis, and more than half of patients first consult a traditional healer due to the cost and distance to health facilities.26 this analysis has several limitations. there is great uncertainty in the estimated incidence rates and number of deaths as evidenced by the wide range of confidence intervals. firstly, estimated tb incidence is calculated based on case notifications with a standard adjustment or adjustments made based on expert opinions, which might not reflect the actual incidence.12 most pics have their mortality estimates indirectly derived from the incidence. in settings with a limited number of notified cases, modelled estimates are less appropriate compared to other https://www.who.int/publications/i/item/9789240037021 https://www.who.int/publications/i/item/9789240037021 wpsar vol 14, no 1, 2023 | doi: 10.5365/wpsar.2023.14.1.996 https://ojs.wpro.who.int/12 yanagawa et altb epidemiology in the pacific 15. understanding and using tuberculosis data. geneva: world health organization; 2014. available from: https://www.who.int/ publications/i/item/9789241548786, accessed 15 september 2022. 16. pezzoli l, gounder s, tamani t, daulako mr, underwood f, mainawalala s, et al. tuberculosis, fiji, 2002–2013. emerg infect dis. 2016;22(3):547–9. doi:10.32032/eid2203.151903 pmid:26890215 17. ragonnet r, williams bm, largen a, nasa j, jack t, langinlur mk, et al. estimating the long-term effects of mass screening for latent and active tuberculosis in the marshall islands. int j epidemiol. 2022;51(5):1433–45. doi:10.1093/ije/dyac045 pmid:35323964 18. coleman m, hill j, timeon e, tonganibeia a, eromanga b, islam t, et al. population-wide active case finding and prevention for tuberculosis and leprosy elimination in kiribati: the pearl study protocol. bmj open. 2022;12(4):e055295. doi:10.1136/ bmjopen-2021-055295 pmid:35414551 19. islam t, hiatt t, hennig c, nishikiori n. drug-resistant tuberculosis in the who western pacific region. western pac surveill response j. 2014;5(4):34–46. doi:10.5365/wpsar.2014.5.4.007 pmid:25685604 20. evidence to action. data dashboard. hiv and aids data hub for asia pacific, 2021. bangkok: unaids; 2022. available from: https://aphub.unaids.org/, accessed 15 september 2022. 21. who consolidated guideline on tuberculosis, module 2: screening: systematic screening for tuberculosis disease. geneva: world health organization; 2021. available from: https://www.who.int/ publications/i/item/9789240022676, accessed 15 september 2022. 22. sadirova d, grigoryan r, parpieva n, barotova v, trubnikov a, kalandarova l, et al. incidence rate and risk factors for tuberculosis among people living with hiv: a 2015–2017 cohort from tashkent, uzbekistan. int j environ res public health. 2021;18(11):5746. doi:10.3390/ijerph18115746 pmid:34071899 23. implementing the end tb strategy: the essentials. geneva: world health organization; 2015. available from: https://www.who.int/ publications/i/item/implementing-the-end-tb-strategy, accessed 15 september 2022. 24. idf diabetes atlas, 10th edition. brussels: international diabetes federation; 2021. available from: https://diabetesatlas.org/atlas/ tenth-edition/, accessed 15 september 2022. 25. ofanoa m, tekeraoi r, dalmia p, ram k, pal m, nosa v, et al. patient perspectives of diabetes and diabetic retinopathy services in kiribati: a qualitative study. asia pac j public health. 2021;33(6–7):740–6. doi:10.1177/1010539520977313 pmid:33287551 26. viney ka, johnson p, tagaro m, fanai s, linh nn, kelly p, et al. tuberculosis patients’ knowledge and beliefs about tuberculosis: a mixed methods study from the pacific island nation of vanuatu. bmc public health. 2014;14:467. doi:10.1186/1471-2458-14467 pmid:24885057 2. nunn pd, kumar l, eliot i, mclean rf. classifying pacific islands. geosci lett. 2016;3:7. doi:10.1186/s40562-016-0041-8 3. pacific transport sector assessment, strategy, and road map 2021– 2025. manila: asian development bank; 2021. available from: https://www.adb.org/documents/pacific-transport-assessmentstrategy-road-map-2021-2025, accessed 15 september 2022. 4. world bank country and lending groups. washington (dc): world bank; 2022. available from: https://datahelpdesk.worldbank.org/ knowledgebase/articles/906519-world-bank-country-and-lendinggroups, accessed 15 september 2022. 5. regional impact report, global fund’s investments in the pacific region. geneva: the global fund; 2019. available from: https://www. theglobalfund.org/media/8544/publication_pacificregionimpact_ report_en.pdf, accessed 15 september 2022. 6. morishita f, viney k, lowbridge c, elsayed h, oh kh, rahevar k, et al. epidemiology of tuberculosis in the western pacific region: progress towards the 2020 milestones of the end tb strategy. western pac surveill response j. 2020;11(4):10–23. doi:10.5365/ wpsar.2020.11.3.002 pmid:34046237 7. towards tuberculosis elimination: an action framework for low-incidence countries. geneva: world health organization; 2014. available from: https://www.who.int/publications/i/ item/9789241507707, accessed 15 september 2022. 8. western pacific regional framework to end tb: 2021–2030. manila: who regional office for the western pacific; 2022. available from: https://apps.who.int/iris/handle/10665/352278, accessed 15 september 2022. 9. regional framework for action on implementation of the end tb strategy in the western pacific, 2016–2020. manila: who regional office for the western pacific; 2016. available from: https://apps. who.int/iris/handle/10665/208331, accessed 18 november 2022. 10. end tb strategy. geneva: world health organization; 2015. available from: https://www.who.int/teams/global-tuberculosis-programme/ the-end-tb-strategy, accessed 15 september 2022. 11. global tuberculosis programme [online database]. geneva: world health organization; 2022. available from: https://www.who. int/teams/global-tuberculosis-programme/data, accessed 15 september 2022. 12. global tuberculosis report 2021: methods used by who to estimate the global burden of tb disease: technical annexes. geneva: world health organization; 2021. available from: https://www.who.int/ publications/digital/global-tuberculosis-report-2021/technicalannexes, accessed 15 september 2022. 13. definitions and reporting framework for tuberculosis – 2013 revision (updated december 2014 and january 2020). geneva: world health organization; 2013. available from: https://apps.who. int/iris/bitstream/handle/10665/79199/9789241505345_eng. pdf?sequence=1, accessed 15 september 2022. 14. viney k, hoy d, roth a, kelly p, harley d, sleigh a. epidemiology of tuberculosis in the pacific, 2000 to 2013. western pac surveill response j. 2015;6(3):59–67. doi:10.5365/wpsar.2015.6.1.001 pmid:26668768 https://www.who.int/publications/i/item/9789241548786 https://www.who.int/publications/i/item/9789241548786 https://aphub.unaids.org/ https://www.who.int/publications/i/item/9789240022676 https://www.who.int/publications/i/item/9789240022676 https://www.who.int/publications/i/item/implementing-the-end-tb-strategy https://www.who.int/publications/i/item/implementing-the-end-tb-strategy https://diabetesatlas.org/atlas/tenth-edition/ https://diabetesatlas.org/atlas/tenth-edition/ https://www.adb.org/documents/pacific-transport-assessment-strategy-road-map-2021-2025 https://www.adb.org/documents/pacific-transport-assessment-strategy-road-map-2021-2025 https://datahelpdesk.worldbank.org/knowledgebase/articles/906519-world-bank-country-and-lending-groups https://datahelpdesk.worldbank.org/knowledgebase/articles/906519-world-bank-country-and-lending-groups https://datahelpdesk.worldbank.org/knowledgebase/articles/906519-world-bank-country-and-lending-groups https://www.theglobalfund.org/media/8544/publication_pacificregionimpact_report_en.pdf https://www.theglobalfund.org/media/8544/publication_pacificregionimpact_report_en.pdf https://www.theglobalfund.org/media/8544/publication_pacificregionimpact_report_en.pdf https://www.who.int/publications/i/item/9789241507707 https://www.who.int/publications/i/item/9789241507707 https://apps.who.int/iris/handle/10665/352278 https://apps.who.int/iris/handle/10665/208331 https://apps.who.int/iris/handle/10665/208331 https://www.who.int/teams/global-tuberculosis-programme/the-end-tb-strategy https://www.who.int/teams/global-tuberculosis-programme/the-end-tb-strategy https://www.who.int/teams/global-tuberculosis-programme/data https://www.who.int/teams/global-tuberculosis-programme/data https://www.who.int/publications/digital/global-tuberculosis-report-2021/technical-annexes https://www.who.int/publications/digital/global-tuberculosis-report-2021/technical-annexes https://www.who.int/publications/digital/global-tuberculosis-report-2021/technical-annexes https://apps.who.int/iris/bitstream/handle/10665/79199/9789241505345_eng.pdf?sequence=1 https://apps.who.int/iris/bitstream/handle/10665/79199/9789241505345_eng.pdf?sequence=1 https://apps.who.int/iris/bitstream/handle/10665/79199/9789241505345_eng.pdf?sequence=1 www.wpro.who.int/wpsar 1wpsar vol 12, no 1, 2021 | doi: 10.5365/wpsar.2020.11.1.014 perspective a college of medicine, university of the philippines manila, manila, philippines. b school of medicine and public health, ateneo de manila university, pasig city, philippines. published: 5 february 2021 doi: 10.5365/wpsar.2020.11.1.014 the philippine health system and the threat of public health emergencies d espite improvements during the past decade, the philippines continues to face challenges in responding to public health emergencies because of poorly distributed resources and capacity. the philippines has 10 hospital beds and six physicians per 10 000 people.1,2 and only about 2335 critical care beds nationwide.3 the available resources are concentrated in urban areas, and rural areas have only one physician for populations up to 20 000 people and only one bed for a population of 1000.4 disease surveillance capacity is also unevenly distributed among regions and provinces. the primary care system comprises health centres and community health workers, but these are generally ill-equipped and poorly resourced, with limited surge capacity, as evidenced by lack of laboratory testing capacity, limited equipment and medical supplies, and lack of personal protective equipment for health workers in both primary care units and hospitals.5 local government disaster preparedness plans are designed for natural disasters and not for epidemics. inadequate, poorly distributed resources and capacity nationally and subnationally have made it difficult to respond adequately to public health emergencies in the past, as in the case of typhoon haiyan in 2013.6 the typhoon affected 13.3 million people, overwhelming the government’s capacity to mobilize human and financial resources rapidly to affected areas.7 failure to deliver basic needs and health services resulted in disease outbreaks, including a community outbreak of gastroenteritis.8 access to care has improved in recent years due to an increase in the number of private hospital beds;5 however, improvements in private sector facilities mainly benefit people who can afford them, in both urban and rural areas. in this paper, we describe the challenges and early response of the philippine government, focusing on travel restrictions, community interventions, risk communication and testing, from 30 january 2020 when the first case was reported, to 21 march 2020. early response to covid-19 travel restrictions travel restrictions in the philippines were imposed as early as 28 january, before the first confirmed case was reported on 30 january (fig. 1a).9 after the first few covid-19 cases and deaths, the government conducted contact tracing and imposed additional travel restrictions,10 with arrivals from restricted countries subject to 14-day quarantine and testing. while early response to covid-19 in the philippines arianna maever l. amit,a,b veincent christian f. pepitoa,b and manuel m. dayritb correspondence to arianna maever l. (email: alamit@up.edu.ph) lowand middle-income countries (lmics) with weak health systems are especially vulnerable during the covid-19 pandemic. in this paper, we describe the challenges and early response of the philippine government, focusing on travel restrictions, community interventions, risk communication and testing, from 30 january 2020 when the first case was reported, to 21 march 2020. our narrative provides a better understanding of the specific limitations of the philippines and other lmics, which could serve as basis for future action to improve national strategies for current and future public health outbreaks and emergencies. wpsar vol 12, no 1, 2021 | doi: 10.5365/wpsar. 2020.11.1.014 www.wpro.who.int/wpsar2 amit et alearly response to covid-19 in the philippines only briefly, as the number of confirmed cases increased in the weeks that followed.11 fig. 1b shows all interventions, including travel restrictions undertaken before 6 march, when the government declared the occurrence of community spread, and after 11 march, when who declared covid-19 a pandemic. travel restrictions in the early phase of the covid-19 response prevented spread of the disease by potentially infected people, travellers from countries not on the list of restricted countries were not subject to the same screening and quarantine protocols. the restrictions were successful in delaying the spread of the disease fig. 1a. new cases of covid-19 in the philippines, 30 january–21 march 2020 community transmission reported in the philippines n um be r of n ew c as es 01 feb 2020 0 20 40 60 80 15 feb 2020 01 mar 2020 15 mar 2020 declaration of state of public health emergency who declares covid-19 a pandemic fig. 1b. timeline of key events and developments in the philippines, 30 january–21 march 2020 travel restrictions hubei province, china mainland china, hong kong sar (china), macau sar (china) taiwan (china) republic korea (select areas) flexible work arrangements prohibition of mass gatherings suspension of classes metro manila under ecq ecq extended to entire luzon ramping up of testing capacity field testing of local test kits community transmission reported in the philippines 01 feb 2020 15 feb 2020 15 mar 202001 mar 2020 declaration of state of public health emergency who declares covid-19 a pandemic community interventions testing wpsar vol 12, no 1, 2021 | doi: 10.5365/wpsar.2020.11.1.014www.wpro.who.int/wpsar 3 early response to covid-19 in the philippinesamit et al that health systems were not overwhelmed.14 while the lockdown implemented by the government applied only to the island of luzon, local governments in other parts of the country followed this example and also locked down. the ecq gave the country the opportunity to mobilize resources and organize its pandemic response, which was especially important in a country with poorly distributed, scarce resources and capacity. risk communication the government strengthened and implemented national risk communication plans to provide information on the new disease. the government conducted daily press briefings, sponsored health-related television and internet advertisements and circulated infographics on social media. misinformation and conspiracy theories about covid-19 were nevertheless a challenge for a population that spends more than 10 hours a day on the internet.15,16 these spread quickly and became increasingly difficult to correct. furthermore, the government’s messages did not reach all households, despite access community interventions the government declared “enhanced community quarantine” (ecq) for metro manila between 15 march and 14 april (fig. 2a), which was subsequently extended to the whole island of luzon (fig. 2b). the quarantine consisted of: strict home quarantine in all households, physical distancing, suspension of classes and introduction of work from home, closure of public transport and non-essential business establishments, prohibition of mass gatherings and non-essential public events, regulation of the provision of food and essential health services, curfews and bans on sale of liquor and a heightened presence of uniformed personnel to enforce the quarantine procedures.12 ecq – an unprecedented move in the country’s history – was modelled on the lockdown in hubei, china, which was reported to have slowed disease transmission.13 region-wide disease control interventions, such as quarantining of the entire luzon island, were challenging to implement because of their scale and social and economic impacts, but they were deemed necessary to “flatten the curve” so fig. 2. provinces placed under enhanced community quarantine (ecq). (2a) the government declared ecq in metro manila effective 15 march 2020; (2b) the government declared ecq on the entire island of luzon effective 17 march 2020. 2a 2b wpsar vol 12, no 1, 2021 | doi: 10.5365/wpsar. 2020.11.1.014 www.wpro.who.int/wpsar4 amit et alearly response to covid-19 in the philippines ness, surveillance and testing capacity in particular is a lesson that the philippines and other lmics should learn from covid-19. acknowledgements none conflict of interests none reported funding not applicable references 1. hospital beds (per 1,000 people). washington, dc: world bank; 2020. available from: https://data.worldbank.org/indicator/ sh.med.beds.zs. 2. world bank open data. washington, dc: world bank; 2019. available from: https://data.worldbank.org/, accessed 18 march 2020. 3. phua j, faruq mo, kulkarni ap, redjeki is, detleuxay k, mendsaikhan n, et al. asian analysis of bed capacity in critical care (abc) study investigators, and the asian critical care clinical trials group. critical care bed capacity in asian countries and regions. crit care med. 2020;48(5):654–62. 4. human resources for health country profiles: philippines. manila: who regional office for the western pacific; 2013. available from: https://iris.wpro.who.int/bitstream/handle/10665.1/7869/9789290616245_eng.pdf. 5. dayrit m, lagrada l, picazo o, pons m, villaverde m. the philippines health system review. new delhi: who regional office for south-east asia; 2018. available from: https://apps.who.int/iris/ handle/10665/274579, accessed 28 august 2020. 6. mcpherson m, counahan m, hall jl. responding to typhoon haiyan in the philippines. west pac surveill response. 2015 nov 6;6(suppl1):1–4. doi:10.5365/wpsar.2015.6.4.hyn_026 7. santiago jss, manuela ws jr, tan mll, sañez sk, tong azu. of timelines and timeliness: lessons from typhoon haiyan in early disaster response. disasters. 2016;40(4):644–67. 8. ventura rj, muhi e, de los reyes vc, sucaldito mn, tayag e. a community-based gastroenteritis outbreak after typhoon haiyan, leyte, philippines, 2013. west pac surveill response. 2015;6(1):1–6. 9. inter-agency task force for the management of emerging infectious diseases. resolution no. 01. recommendations for the management of the novel coronavirus situation. manila: department of health; 2020. available from: https://www.officialgazette. gov.ph/downloads/2020/01jan/20200128-iatf-resolutionno-1-rrd.pdf, accessed 3 june 2020. 10. february files. manila: civil aeronautics board; 2020. available from: https://www.cab.gov.ph/announcements/category/february-16, accessed 19 march 2020. to health services and information, resulting in limited knowledge of preventive practices, except for handwashing.17 testing testing is key to controlling the pandemic but was done on a small scale in the philippines. as of 19 march, fewer than 1200 individuals had been tested,11 as only the research institute for tropical medicine located in metro manila performed tests and assisted subnational reference laboratories in testing.18 no positivity rates for rt-pcr tests were reported until early april 2020. because of the limited capacity for testing at the start of the pandemic, the department of health imposed strict protocols in order to ration testing resources while ramping up testing capacity. most tests were conducted for individuals in urban areas, where the incidence was highest.19 conclusions at the start of the covid-19 pandemic, the country’s initial response lacked organizational preparedness to counter the public health threat. the philippines’ disease surveillance system could conduct contact tracing, but this was overwhelmed in the early phases of outbreak response. similarly, in february, only one laboratory could conduct reverse transcriptase polymerase chain reaction (rt–pcr) testing, so the country could not rapidly deploy extensive laboratory testing for infected cases. in addition, the primary care system of the philippines did not serve as a primary line of defence, as people went straight to hospitals in urban areas, overwhelming critical care capacity in the early stages of the covid-19 pandemic. in response to the early phase of the pandemic, the government of the philippines implemented travel restrictions, community quarantine, risk communication and testing; however, the slow ramping up of capacities particularly on testing contributed to unbridled disease transmission. by 15 october, the number of confirmed cases had exponentially grown to 340,000 of which 13.8% were deemed active.11 the lack of pandemic preparedness had left the country poorly defended against the new virus and its devastating effects. investing diligently and consistently in pandemic preparedhttps://data.worldbank.org/indicator/sh.med.beds.zs https://data.worldbank.org/indicator/sh.med.beds.zs https://data.worldbank.org/ https://apps.who.int/iris/handle/10665/274579 https://apps.who.int/iris/handle/10665/274579 https://www.officialgazette.gov.ph/downloads/2020/01jan/20200128-iatf-resolution-no-1-rrd.pdf https://www.officialgazette.gov.ph/downloads/2020/01jan/20200128-iatf-resolution-no-1-rrd.pdf https://www.officialgazette.gov.ph/downloads/2020/01jan/20200128-iatf-resolution-no-1-rrd.pdf https://www.cab.gov.ph/announcements/category/february-16 https://www.cab.gov.ph/announcements/category/february-16 wpsar vol 12, no 1, 2021 | doi: 10.5365/wpsar.2020.11.1.014www.wpro.who.int/wpsar 5 early response to covid-19 in the philippinesamit et al 11. updates of novel coronavirus disease (covid-19). manila: department of health; 2020. available from: https://www.doh.gov. ph/2019-ncov, accessed 16 october 2020. 12. marquez c. palace releases temporary guidelines on metro manila community quarantine. inquirer news. 14 march 2020. available from: https://newsinfo.inquirer.net/1241790/palace-releases-temporary-guidelines-on-metro-manila-community-quarantine, accessed 18 april 2020. 13. leung k, wu jt, liu d, leung gm. first-wave covid-19 transmissibility and severity in china outside hubei after control measures, and second-wave scenario planning: a modelling impact assessment. lancet. 2020;395(10233):1382–93. 14. wilder-smith a, freedman do. isolation, quarantine, social distancing and community containment: pivotal role for old-style public health measures in the novel coronavirus (2019-ncov) outbreak. j travel med. 2020;27(2). 15. digital 2020: the philippines. datareportal – global digital insights. available from: https://datareportal.com/reports/digital2020-philippines, accessed 28 august 2020. 16. nicomedes cjc, avila rma. an analysis on the panic during covid-19 pandemic through an online form. j affect disord. 2020;276:14–22. 17. lau ll, hung n, go dj, ferma j, choi m, dodd w, et al. knowledge, attitudes and practices of covid-19 among income-poor households in the philippines: a cross-sectional study. j glob health. 2020;10(1). 18. nuevo ce, sigua ja, boxshall m. wee co pa, yap me. scaling up capacity for covid-19 testing in the philippines. coronavirus (covid-19) blog posts collection. london: bmj journals; 2020. available from: https://blogs.bmj.com/bmjgh/2020/06/05/scaling-up-capacity-for-covid-19-testing-in-the-philippines/, accessed 28 august 2020. 19. decision tool for 2019 novel coronavirus acute respiratory disease (2019-ncov ard) health event as of january 30, 2020. manila: department of health; 2020. available from: https://www.doh. gov.ph/sites/default/files/health-update/covid-19-advisory-no2. pdf, accessed 28 august 2020. https://www.doh.gov.ph/2019-ncov https://www.doh.gov.ph/2019-ncov https://newsinfo.inquirer.net/1241790/palace-releases-temporary-guidelines-on-metro-manila-community-quarantine https://newsinfo.inquirer.net/1241790/palace-releases-temporary-guidelines-on-metro-manila-community-quarantine https://datareportal.com/reports/digital-2020-philippines https://datareportal.com/reports/digital-2020-philippines https://blogs.bmj.com/bmjgh/2020/06/05/scaling-up-capacity-for-covid-19-testing-in-the-philippines/ https://blogs.bmj.com/bmjgh/2020/06/05/scaling-up-capacity-for-covid-19-testing-in-the-philippines/ https://www.doh.gov.ph/sites/default/files/health-update/covid-19-advisory-no2.pdf https://www.doh.gov.ph/sites/default/files/health-update/covid-19-advisory-no2.pdf https://www.doh.gov.ph/sites/default/files/health-update/covid-19-advisory-no2.pdf https://ojs.wpro.who.int/ 1wpsar vol 14, no 1, 2023 | doi: 10.5365/wpsar.2023.14.1.953 brief report s ince early 2020, health systems around the world have faced challenges in adequately responding to the coronavirus disease (covid-19) pandemic. systems have adapted to the evolving epidemic, and different measures have been implemented at different times in different contexts. evaluating responses to significant public health events such as outbreaks of infectious diseases is often not prioritized or undertaken due to a lack of resources or time, despite its established importance in improving future preparedness and response measures.1–3 notable examples of evaluations of responses to major infectious disease outbreaks include those for the 2014–20154 ebola virus disease epidemic in the european union and the 20135 h1n1 influenza epidemics in canada and the united states of america. evaluations have also been conducted for responses to natural disasters, such as the 2017 wildfires in portugal6 and hurricane katrina in the united states in 2005.7 in 2015, the world health organization (who) developed the after-action review (aar) toolkit as a component of the international health regulations (2005; ihr).8–11 aars aim to assess the what, how and why of a response to a significant public health event, to identify the best practices and challenges encountered during the response, and to propose midand long-term actions for improvement. the who aar methods were developed to evaluate responses generally to any type of public health event.11 aars consist of nine pillars for which best practices, challenges and lessons learned are to be identified: (i) country-level coordination and monitoring, (ii) risk communication, (iii) surveillance, (iv) points of entry, (v) the national laboratory system, (vi) infection prevention and control, (vii) case management, (viii) operations and logistics and (ix) maintaining health services.11 conducting and reporting on an aar requires three steps: (i) objective observation (i.e. a structured review of response activities); (ii) an analysis of gaps, best practices and contributing factors to the results of the response; and (iii) identification of areas for improvement and proposed follow-up actions. who suggests four methods that can be used to conduct an aar: (i) debriefings, (ii) working groups, (iii) interviews with key informants and (iv) mixed-methods studies. depending on the context, aars can be conducted in different formats and cover different areas of the response. who also suggests that the findings of evaluations are compared against the ihr (2005) core capacities.11 final results should be summarized in a qualitative format, and evaluations by participants contributing to it are encouraged. it is unclear to what extent who’s aar methods are being used to assess public health responses to events involving emerging infectious diseases and, in particular, how closely such evaluations follow who guidance. we undertook a rapid review of the global literature with the objective of understanding how the who aar methods are being used to assess public health responses to infectious disease events. we searched pubmed using different combinations of keywords such as “after action review”, “infectious disease”, “world health organization”, “epidemic”, “outbreak” and “emergency” (table 1). we also searched a department of communicable diseases control, national institute of hygiene and epidemiology, hanoi, viet nam. b national centre for epidemiology and population health, college of health and medicine, australian national university, canberra, australian capital territory, australia. c the kirby institute, university of new south wales, sydney, new south wales, australia. published: 22 march 2023 doi: 10.5365/wpsar.2023.14.1.953 after-action reviews for emergency preparedness and response to infectious disease outbreaks ha-linh quach,a,b khanh cong nguyena and florian vogtb,c correspondence to ha-linh quach (email: u7061726@alumni.anu.edu.au) wpsar vol 14, no 1, 2023 | doi: 10.5365/wpsar.2023.14.1.953 https://ojs.wpro.who.int/2 quach et ala rapid review of after-action reviews methodology three aars13–15 used who-recommended methods in combination with other evaluation tools, such as document reviews or surveys in addition to quantitative assessments. the remaining five16–20 strictly followed who’s nine evaluation pillars and three steps, and were conducted as conferences that brought together all stakeholders. four of the eight reports used working groups,16–19 three used debriefings13–15 and one used key-informant interviews,20 following who’s aar readyto-use toolkits. public health systems were a common focus of evaluations, appearing in seven aars,13–19 while another aar focused on a hospital setting.20 five aars were conducted at the local level in response to outbreaks13–15,19,20 and three at the national level.16–18 three aars included participants’ evaluations of and feedback on the aar method.17–19 although the overall assessment of the suitability of aars to connect stakeholders, provide a platform for ideas and to pool experiences was positive, as evidenced by responses from more than 80% of participants in each of these three studies, only half of the participants agreed that aars actually achieved their objectives.17–19 in terms of strengthening interdisciplinary collaboration and coordination, less than 20% of participants in these studies rated this as being accomplished by the aar.17–19 additionally, the importhe who strategic partnership for health security and emergency preparedness’ after action review database,12 who’s main public repository for aars. we included all articles and reports in english published or uploaded from january 2015 to december 2021 that described using who aar methods to evaluate responses to infectious disease outbreaks. reports or publications were excluded if they were incomplete, did not use the who aar toolkit, were not published in english or did not evaluate infectious disease events. results were merged, duplicates removed and the remaining reports screened against the inclusion and exclusion criteria, and reasons for exclusion were documented. for the included reports, we extracted the key characteristics of the aar method for use in a descriptive analysis. we also assessed how closely the included aars followed the who aar methods and how effective the methods were in assessing the response. the following data were extracted from each record: general information, including authors and year of publication; setting; scope of evaluation (national, regional or agency level); the event being evaluated; and the year of the event. the reports were then compared against who’s aar guideline (table 2). after screening 86 records, 8 were included in the analysis, 4 from the who aar database and 4 peer-reviewed articles retrieved from pubmed (fig. 1, table 3). table 1. search terms used and number of records retrieved from pubmed for study of after-action reviews that use who criteria, 2015–2021 search fields searched query (filter: english) no. of records 1 all after action review 49 2 all infectious disease 677 493 3 all epidemic or outbreak or emergency 549 053 4 all world health organization 98 489 5 all infectious disease or epidemic or outbreak or emergency (searches 2 and 3 combined) 1 176 137 6 all after action review and infectious disease or epidemic or outbreak or emergency (searches 1 and 5 combined) 20 7 all after action review and world health organization (searches 1 and 4 combined) 4 8 all after action review and infectious disease or epidemic or outbreak or emergency or after action review and world health organization (searches 6 and 7 combined) 22 9 date of publication (2015[date publication]: 2021[date publication]) 8 222 679 10 all after action review and infectious disease or epidemic or outbreak or emergency or after action review and world health organization and (2015[date publication]: 2021[date publication]) (searches 8 and 9 combined) 16 wpsar vol 14, no 1, 2023 | doi: 10.5365/wpsar.2023.14.1.953https://ojs.wpro.who.int/ 3 a rapid review of after-action reviews methodologyquach et al from the completed reports, it is evident that who’s methods were not always strictly followed, but they were often used in combination with other methods for qualitative and quantitative assessment. while the qualitative element of who’s aar toolkit seems to have been easier to follow in conference settings with all relevant stakeholders present, several aars required methodological modifications, using, for example, surveys or document reviews, and also incorporated quantitative methods, depending on the local context. one of who’s main recommendations for conducting aars is to compare the outcomes of the response with the ihr (2005) core capacities – a country-level assessment – yet this comparison was not done in any of the studies included in our analysis. who’s aar methodology is relatively broad and geared towards whole-of-system evaluations. the nine aar evaluation pillars and the accompanying toolkit are also rather general. as a result, aars were more frequently used for evaluations of districtand national-level systems rather than for specific systems (e.g. surveillance systems, national laboratories or point-of-entry screening). however, assessments should be conducted for all levels and aspects of health systems to ensure a comprehensive response; therefore, aar toolkits should tance of allowing aar methods to be adjusted to best fit their purposes (e.g. for smaller-level analyses, such as within a unit, region or single institution) is highlighted by the fact that three of the eight reports did not strictly follow who’s aar structure.13–15 the importance of making modifications to conduct a more focused system evaluation was also flagged by sorbello et al.20 as a way to improve follow-up actions within local contexts and to enhance multidisciplinary cooperation. despite being recommended by who, none of the aars used the ihr (2005) core capacities as a comparator. only a limited number of aars have been published in the scientific and grey literature. as of august 2022, the global public repository for aars at who12 listed 81 entries since 2016. however, 66 (88%) of the 75 entries categorized as having been conducted were incomplete, of which 41 were older than 2 years and hence are unlikely to ever be finalized. furthermore, many entries had only minimal information about the setting and category of emergency, and were without much content about the aar itself. it was also often difficult to establish whether an aar had actually been conducted and completed successfully. the problem of identifying and accessing information about aars has also been recognized in a recent review from australia.21 table 2. data extracted from reports of after-action reviews that use who criteria, 2015–2021 data extracted variable format who guideline: debriefing, working group, key-informant interviews or mixed-methods study other pillar of evaluation who guideline: (i) country-level coordination and monitoring; (ii) risk communication; (iii) surveillance; (iv) points of entry; (v) the national laboratory system; (vi) infection prevention and control; (vii) case management; (viii) operations and logistics; and (ix) maintaining health services other phases of evaluation who guideline: design, preparation and implementation other comparison with international health regulations (2005) core capacities who guideline: yes no final evaluation by participants who guideline: yes no reporting format who guideline: qualitative format with three-part structure: (i) objective observation (i.e. a structured review of response activities); (ii) analysis of gaps, best practices and contributing factors to the results of the response; (iii) identification of areas for improvement and proposals for follow-up actions other follow-up plan for improvement who guideline: yes no wpsar vol 14, no 1, 2023 | doi: 10.5365/wpsar.2023.14.1.953 https://ojs.wpro.who.int/4 quach et ala rapid review of after-action reviews methodology table 3. summary of articles and reports included in the study of after-action reviews that use who criteria, 2015–2021 author (year) publication type setting scope of evaluation event under evaluation (year) evaluation approaches areas being evaluated application of who aar methodology mase et al. (2017)13 peerreviewed journal article ohio, usa public health departments h1n1 influenza mass vaccination campaign (2017) document review debriefings questionaire survey (1) mass vaccination (2) volunteer management (3) community mitigation (4) interoperable communications (5) risk communication (6) epidemiological surveillance and investigation £ followed aar structure s followed aar pillars for evaluation (focus on vaccination) s followed aar approaches (in combination) £ comparison with ihr (2005) s followed aar qualitative reporting format £ final evaluation from participants tapo et al. (2021)14 peerreviewed journal article vanuatu international health centre covid-19 epidemic (2020) document review debriefing (1) coordination and staffing (2) pre-arrival preparations (3) pre-departure preparations (point of origin) (4) upon arrival at the airport in vanuatu (5) check in to quarantine facilities (6) during quarantine (7) quarantine discharge £ followed aar structure s followed aar pillars for evaluation (focus on point of entry) s followed aar approaches (in combination) £ comparison with ihr (2005) s followed aar qualitative reporting format £ final evaluation from participants boland et al. (2017)15 peerreviewed journal article sierra leone district health system, port loko district and kambia district ebola virus disease outbreak (2014–2017) document review debriefing questionnaire survey (1) environment and infrastructure (2) sociocultural aspects (3) political and organizational aspects £ followed aar structure £ followed aar pillars for evaluation s followed aar approaches (in combination) £ comparison with ihr (2005) s followed aar qualitative reporting format (in combination with quantitative report) £ final evaluation from participants wpsar vol 14, no 1, 2023 | doi: 10.5365/wpsar.2023.14.1.953https://ojs.wpro.who.int/ 5 a rapid review of after-action reviews methodologyquach et al author (year) publication type setting scope of evaluation event under evaluation (year) evaluation approaches areas being evaluated application of who aar methodology nigeria centre for disease control and who (2017)16 non-peer reviewed report nigeria national public health system lassa fever outbreak (2016–2017) working groups (1) coordination (2) epidemiological surveillance (3) case management and infection prevention and control (4) national laboratory system (5) logistics (6) risk communication s followed aar structure s followed aar pillars for evaluation s followed aar approaches £ comparison with ihr (2005) s followed aar qualitative reporting format £ final evaluation from participants nigeria centre for disease control and who (2018)17 non-peer reviewed report nigeria national public health system lassa fever outbreak (2018) working groups (1) coordination and logistics (2) case management, safe burial, and infection prevention and control (3) risk communication and social mobilization (4) national laboratory system (5) epidemiological surveillance s followed aar structure s followed aar pillars for evaluation s followed aar approaches £ comparison with ihr (2005) s followed aar qualitative reporting format s final evaluation from participants nigeria centre for disease control and who (2018)18 non-peer reviewed report nigeria national public health system national cerebrospinal meningitis outbreak (2017–2018) working groups (1) coordination (2) epidemiological surveillance (3) case management (4) risk communication and social mobilization (5) national laboratory system (6) logistics for vaccination s followed aar structure s followed aar pillars for evaluation s followed aar approaches £ comparison with ihr (2005) s followed aar qualitative reporting format s final evaluation from participants wpsar vol 14, no 1, 2023 | doi: 10.5365/wpsar.2023.14.1.953 https://ojs.wpro.who.int/6 quach et ala rapid review of after-action reviews methodology who issued a modified version of its methods for aars at the beginning of the covid-19 pandemic, known as intra-action reviews (iars), to meet the need to rapidly assess health systems’ performance during the ongoing pandemic. as of august 2022, there were 144 iars listed in the who database;22 129 of them (89.6%) were categorized as conducted, but only 19 of these (14.7%) were accompanied by a completed report, suggesting there are issues in finalization and publication similar to those for aars. iars include four additional pillars that are relevant to the ongoing covid-19 pandemic: (i) covid-19 vaccination, (ii) vulnerable and marginalized populations, (iii) national legislation and financing, and (iv) public health and social measures.23 however, only two be flexible enough to be adapted to different jurisdictions and scopes of assessment to accommodate diverse evaluation needs. thus, modifications to who’s aar guidance are important to ensure that relevant information can be gathered from a wider range of sources and a more diverse group of stakeholders to fully consider local contexts and different scopes of evaluation. furthermore, understanding ihr (2005) core capacities could offer important lessons for conducting aars. however, comparison against ihr (2005) core capacities is rarely done as part of aars despite being encouraged by who. we also found that several aars in the who repository were implemented without assessments from participants and stakeholders. author (year) publication type setting scope of evaluation event under evaluation (year) evaluation approaches areas being evaluated application of who aar methodology nigeria centre for disease control and who (2018)19 non-peer reviewed report nigeria public health system, maiduguri borno state cholera outbreak in camp for displaced people (2017) working groups (1) coordination and logistics (2) epidemiological surveillance and the national laboratory system (3) case management, and infection prevention and control (4) risk communication and community engagement (5) water, sanitation and hygiene (6) oral cholera vaccination s followed aar structure s followed aar pillars for evaluation s followed aar approaches £ comparison with ihr (2005) s followed aar qualitative reporting format s final evaluation from participants sorbello et al. (2021)20 peer-reviewed journal article italy hospital of san raffaele scientific institute, milan covid-19 epidemic (2020) keyinformant interviews (1) staff management (2) logistics and supplies (3) covid-19 diagnosis and clinical management (4) risk communication s followed aar structure s followed aar pillars for evaluation (modified to quantitative ranking of effectiveness) s followed aar approaches £ comparison with ihr (2005) £ followed aar qualitative reporting format s final evaluation from participants aar: after-action review; ihr: international health regulations; who: world health organization. wpsar vol 14, no 1, 2023 | doi: 10.5365/wpsar.2023.14.1.953https://ojs.wpro.who.int/ 7 a rapid review of after-action reviews methodologyquach et al of aars, which hindered our ability to obtain sufficient information about their reflections on the suitability of the aar method to achieve its objectives. all of these constraints could be resolved through more stringent reporting requirements for aars. unfortunately, there is no formal requirement to report on and publish aars upon completion or to finalize reports in a timely manner. especially during the covid-19 pandemic, as more and more health systems need up-to-date data on effective and ineffective measures for addressing the pandemic, it is important to disseminate these evaluations widely and rapidly to ensure that incremental and strategic improvements are made to health-care systems worldwide. however, it seems that covd-19-specific iars suffer from the same issues as aars in terms of insufficient conclusions and lack of publication of reviews. it is crucial to evaluate public health systems regularly during a prolonged and evolving event such as the covid-19 pandemic. selecting appropriate methods for these evaluations is important to their successful implementation and to ultimately improve and adapt responses to the pandemic. considering the variability of the covid-19 pandemic and countries’ public health capacities, a global methodology such as who’s aar toolkit needs to be sufficiently adaptable to local contexts and priorities, and also able to gain the most value from stakeholders’ practical experiences during the response. the covid-19-specific iar adaptation of the aar is a laudable example of this type of approach, and future pandemics might require similar adaptations. furthermore, more subnational reviews, which have been proposed in the latest version of the iar, are needed to enable better operational analysis of public health responses in specific high-priority areas. importantly, the reporting and publication of completed aars should be strengthened to allow public health responders and researchers from other countries and settings to benefit from the knowledge generated and lessons learned to strengthen the capacities of health-care systems to respond to future health emergencies.23 conflicts of interest the authors have no conflicts of interest to declare. ethics statement not applicable. iars categorized as conducted in the database included information about covid-19 vaccination, and none of the iars provided information about the other three pillars. therefore, it is unclear whether iars have contributed to improving evaluations of health system responses. the iar adaptation of the aar remains relatively broad and geared towards national-level responses. similar to aars, we believe that iars would greatly benefit from regular evaluation of the methodology itself to better guide and prepare countries and health-care systems for future, protracted health emergencies beyond the covid-19 pandemic.23 we acknowledge several limitations to our work. first, the small number of included records did not allow for strong conclusions. second, there were many aars listed in the who repository that did not have a completed report, which again led to only a small number of records being included in our study and possible publication bias in our assessment. third, the range of countries with completed aars was limited and quite focused on who’s african region, which restricts the generalizability of our findings. fourth, less than half of the included studies reported on participants’ evaluations fig. 1. flow chart of studies and reports retrieved from pubmed for assessment of after-action reviews that use who criteria, 2015–2021 73 reports from who’s database 16 articles from pubmed 89 records included for screening 0 duplicates removed 89 records screened 8 articles included records excluded 9 3 4 61 4 due to wrong focus (not infectious diseases) due to wrong study design not in english incomplete not conducted wpsar vol 14, no 1, 2023 | doi: 10.5365/wpsar.2023.14.1.953 https://ojs.wpro.who.int/8 quach et ala rapid review of after-action reviews methodology 12. after action review (aar) [online database]. geneva: world health organization; 2022. available from: https://extranet.who.int/sph/ after-action-review, accessed 2 september 2022. 13. mase wa, bickford b, thomas cl, jones sd, bisesi m. afteraction review of the 2009–10 h1n1 influenza outbreak response: ohio’s public health system’s performance. j emerg manag. 2017;15(5):325–34. doi:10.5055/jem.2017.0340 pmid:29165783 14. tapo ps, knox tb, van gemert-doyle c, manwo o, iavro e, williams w, et al. lessons from covid-19-free vanuatu: intensive health operations for phase 1 of repatriation and quarantine, may–july 2020. western pac surveill response j. 2021;12(1):61–8. doi:10.5365/ wpsar.2020.11.4.004 pmid:34094627 15. boland st, polich e, connolly a, hoar a, sesay t, tran aa. overcoming operational challenges to ebola case investigation in sierra leone. glob health sci pract. 2017;5(3):456–67. doi:10.9745/ ghsp-d-17-00126 pmid:28751468 16. 2016/2017 lassa fever outbreak: after action review, 21–22 august 2017. abuja: nigeria centre for disease control; 2017. available from: https://extranet.who.int/sph/sites/default/files/%28ennigeria%29%20-%20lassa%20fever%20aar_2017.pdf, accessed 1 december 2022. 17. 2018 lassa fever outbreak: after action review, 5–7 june 2018. abuja: nigeria centre for disease control; 2018. available from: https://extranet.who.int/sph/sites/default/files/document-library/ document/aar%20lassa%20fever%20nigeria%20%285-7%20 june%202018%29.pdf, accessed 1 december 2022. 18. report of the national 2017/2018 cerebrospinal meningitis outbreak response: after action review meeting, 13th–15th august, 2018. abuja: nigeria centre for disease control; 2018. available from: https://extranet.who.int/sph/sites/default/files/document-library/ document/aar%20meningitis%20nigeria%20%2813-15%20 aug%202018%29.pdf, accessed 1 december 2022. 19. after action review for cholera, maiduguri borno state, nigeria. abuja: nigeria centre for disease control; 2018. available from: https://extranet.who.int/sph/sites/default/files/document-library/ document /a ar%20cholera%20nigeria%20%2829-31%20 may%202018%29.pdf, accessed 1 december 2022. 20. sorbello s, bossi e, zandalasini c, carioli g, signorelli c, ciceri f, et al. after action reviews of covid-19 response: case study of a large tertiary care hospital in italy. 2021;36(5):1758–71. doi:10.1002/ hpm.3258 pmid:34096091 21. dalton cb, kirk md, durrheim dn. using after-action reviews of outbreaks to enhance public health responses: lessons for covid-19. med j aust. 2022;216(1):4–9. doi:10.5694/mja2.51289 pmid:34554574 22. intra-action review (iar) [online database]. geneva: world health organization; 2022. available from: https://extranet.who.int/sph/ intra-action-review, accessed 31 august 2022. 23. guidance for conducting a country covid-19 intra-action review (iar), 23 july 2020. geneva: world health organization; 2020. available from: https://apps.who.int/iris/handle/10665/333419, accessed 31 august 2022. funding none. references 1. alwan na. surveillance is underestimating the burden of the covid-19 pandemic. lancet. 2020;396(10252):e24. doi:10.1016/ s0140-6736(20)31823-7 pmid:32861312 2. williams i, essue b, nouvet e, sandman l, razavi sd, noorulhuda m, et al. priority setting during the covid-19 pandemic: going beyond vaccines. bmj glob health. 2021;6(1):e004686. doi:10.1136/bmjgh-2020-004686 pmid:33461979 3. public health surveillance for covid-19: interim guidance, 22 july 2022. geneva: world health organization; 2022. available from: https://apps.who.int/iris/handle/10665/360580, accessed 1 december 2022. 4. stoto ma, nelson c, hidgon ma, kraemer j, singleton cm. learning about after action reporting from the 2009 h1n1 pandemic: a workshop summary. j public health manag pract. 2013;19(5):420– 7. doi:10.1097/phh.0b013e3182751d57 pmid:23518591 5. masotti p, green me, birtwhistle r, gemmill i, moore k, o’connor k, et al. ph1n1 – a comparative analysis of public health responses in ontario to the influenza outbreak, public health and primary care: lessons learned and policy suggestions. bmc public health. 2013;13:687. doi:10.1186/1471-2458-13-687 pmid:23890226 6. stoto ma, nelson c, piltch-loeb r, mayigane ln, copper f, chungong s. getting the most from after action reviews to improve global health security. global health. 2019;15(1):58. doi:10.1186/ s12992-019-0500-z pmid:31601233 7. miller h, mcnamara j, jui j. hurricane katrina (or-2 dmat) after action report: new orleans airport, august 31–september 10, 2005. washington (dc): homeland security digital library; 2005. available from: https://www.hsdl.org/c/abstract/?docid=766144, accessed 1 december 2022. 8. international health regulations (2005): ihr monitoring and evaluation framework. geneva: world health organization; 2018. available from: https://apps.who.int/iris/handle/10665/276651, accessed 1 december 2022. 9. country implementation guidance: after action reviews and simulation exercises under the international health regulations 2005 monitoring and evaluation framework (ihr mef). geneva: world health organization; 2018. available from: https://apps.who.int/ iris/handle/10665/276175, accessed 1 december 2022. 10. the recommendations of the review committee on second extensions for establishing national public health capacities and on ihr implementation. geneva: world health assembly; 2015. available from: https://apps.who.int/iris/handle/10665/253234, accessed 1 december 2022. 11. guidance for after action review (aar). geneva: world health organization; 2019. available from: https://apps.who.int/iris/handle/10665/311537, accessed 21 may 2021. https://apps.who.int/iris/handle/10665/276175 https://extranet.who.int/sph/after-action-review https://extranet.who.int/sph/sites/default/files/document-library/document/aar%20lassa%20fever%20nigeria%20%285-7%20june%202018%29.pdf https://extranet.who.int/sph/sites/default/files/document-library/document/aar%20meningitis%20nigeria%20%2813-15%20aug%202018%29.pdf https://extranet.who.int/sph/sites/default/files/document-library/document /aar%20cholera%20nigeria%20%2829-31%20may%202018%29.pdf https://extranet.who.int/sph/intra-action-review https://ojs.wpro.who.int/ 1wpsar vol 14, no 1, 2023 | doi: 10.5365/wpsar.2023.14.1.984 original research t he coronavirus disease (covid-19) pandemic has been ongoing since march 2020 and, as of early january 2023, there have been more than 666 million reported cases and more than 6.7 million reported deaths globally.1 the numbers of daily or weekly covid-19 cases and deaths have been used to assess the impact of the pandemic. however, while data on covid-19-related deaths have been widely reported, the quality, accuracy and timeliness of mortality data can be influenced by country-specific factors such as covid-19 testing capacity, population and per capita income,2,3 and are often under-reported or delayed especially in low-income countries.4,5 therefore, reported covid-19 mortality data may not reflect the full impact of the pandemic. an assessment by the world health organization (who) of 133 countries in 2020 found that almost 40% of the world’s deaths were not registered.6 one method to standardize estimates of covid-19 deaths is through measurement of excess mortality, defined as “the increase of all-cause mortality over the mortality expected based on historic trends”.7 p-score is an associated index of excess mortality and represents the percentage of excess deaths relative to the expected deaths.8 in a 2020 study, excess mortality and p-scores were reported for most countries, particularly those in central and south america,8 with global estimates of excess mortality for 2021 of 18.2 million people, more than three times the reported global covid-19 deaths.7 excess mortality and p-scores provide more realistic a san beda university college of medicine, manila, philippines. b ateneo de manila university school of medicine and public health, pasig, philippines. published: 22 march 2023 doi: 10.5365/wpsar.2023.14.1.984 objective: excess mortality is an indicator of the impact of the coronavirus disease (covid-19) pandemic. this study aims to describe excess mortality in the philippines from january 2020 to december 2021 using an online all-cause mortality and excess mortality calculator. methods: all-cause mortality datasets from 2015 to 2021 from the philippine statistics authority were obtained and analysed using the world health organization western pacific regional office all-cause mortality calculator. expected mortality, excess mortality and p-scores were obtained using two models, 5-year averages and negative binomial regression, for total deaths and by administrative region. results: reported national all-cause mortality exceeded the expected mortality in august 2020 and from january to november 2021, peaking in september 2021 at 104 per 100 000. total excess mortality using negative binomial regression was -13 900 deaths in 2020 and 212 000 deaths in 2021, peaking in september 2021. p-scores were -2% in 2020 and 33% in 2021, again peaking in september 2021 at 114%. reported covid-19 deaths accounted for 20% of excess deaths in 2021. in 2020, consistently high p-scores were recorded in the national capital region from july to september and in the bangsamoro autonomous region in muslim mindanao from june to july. in 2021, most regions recorded high p-scores from june to october. discussion: tracking excess mortality using a robust, accessible and standardized online tool provided a comprehensive assessment of the direct and indirect impacts of the covid-19 pandemic in the philippines. furthermore, analysis by administrative region highlighted the key regions disproportionately affected by the pandemic, information that may not have been fully captured from routine covid-19 surveillance. using an online calculator to describe excess mortality in the philippines during the covid-19 pandemic julius r migriño, jra,b and ma rosario bernardo-lazarob correspondence to julius r migriño, jr (email: jrmjrmd-1@yahoo.com) wpsar vol 14, no 1, 2023 | doi: 10.5365/wpsar.2023.14.1.984 https://ojs.wpro.who.int/2 migriño et alcovid-19 excess mortality in the philippines • expected all-cause mortality and 95% prediction intervals using nbr. this statistic uses an nbr approach to estimate deaths for 2020 and 2021 using data from 2015 to 2019. this technique is preferred since it allows for overdispersion and can also account for low or zero counts. the mean parameter (𝜆𝑡) for the counts is modelled as log 𝜆𝑡 = 𝑐(𝑡) + 𝑡𝑟𝑒𝑛𝑑(𝑡) + 𝑋𝑡𝛽 where c(t) is the annual cycle in all-cause mortality, modelled as a piecewise cyclic cubic spline function, trend(t) is the non-cyclic cubic spline function of all-cause mortality over time, and xt is for arbitrary time-varying covariates. • excess mortality. excess mortality was calculated using the formula and values were calculated per region and per month for 2020 and 2021. excess mortality counts were computed using both 5ya and nbr expected mortality. • p-scores of excess mortality. p-score was calculated using the formula and is expressed as percentages. these values were calculated per region and per month for 2020 and 2021 and were also computed using both 5ya and nbr expected mortality. total excess mortality and p-scores were calculated using both 5ya and nbr expected mortality. however, only nbr was used to calculate excess mortality and p-scores per administrative region due to its increased accuracy and adoption by who. reported covid-19 deaths per month for 2020 and 2021 were also extracted from the who coronavirus (covid-19) dashboard.16 the ratio of covid-19 deaths to excess deaths was calculated using the formula all raw data on reported mortality as well as calculated statistics were tabulated. time-series line graphs for reported mortality, expected mortality and p-scores estimates of the true mortality during the covid-19 pandemic, which includes estimates of underreported covid-19 deaths as well as indirect deaths, that is, those from other diseases.8,9 the philippines is an archipelagic lower middleincome country divided into 13 administrative regions (map 1). country data on mortality are available from both the philippine statistics authority (psa) and the department of health (doh). the psa data are obtained from death certificates, whereas the doh data are obtained from mortality reports sent to the doh epidemiology bureau.10 there have been several reports on excess mortality in the philippines, with low and negative excess mortality reported compared to other countries in the region;7,11 one study also reported that the excess mortality rate in the philippines was almost 3.5 times the recorded number of covid-19 deaths.7 the world health organization western pacific regional office all-cause mortality calculator (“acm calculator”) is an open-source online tool developed to calculate expected all-cause mortality, excess mortality and p-scores from mortality data. all-cause mortality can also be calculated by age, sex and administrative state or region if the disaggregated mortality data are indexed in the calculator. the results can then be displayed using tables and graphs. the acm calculator estimates excess mortality and p-scores using two approaches: historical 5-year averages (5ya) and a non-parametric negative binomial regression (nbr) model.12 the aim of this study is to describe excess mortality in the philippines at national and regional levels during the covid-19 pandemic (2020 and 2021) using data generated by the acm calculator. methods mortality data from publicly available psa reports13 from 2015 to 2021 were obtained by year, month and region. these data were encoded into a blank template provided by the acm calculator website and used to generate the following statistics in the calculator.14,15 • expected all-cause mortality and 95% confidence intervals using 5ya. this statistic takes the monthly average and 95% confidence intervals of the reported mortality using data from 2015 to 2019. excess mortality = reported mortality expected mortality p-score = x 100 excess mortality expected mortality ratio = x 100 covid-19 deaths excess mortality wpsar vol 14, no 1, 2023 | doi: 10.5365/wpsar.2023.14.1.984https://ojs.wpro.who.int/ 3 covid-19 excess mortality in the philippinesmigriño et al the total excess mortality using the nbr method for the philippines was -13 900 deaths, or -13 deaths per 100 000 population for 2020, and 212 900 deaths or 193 deaths per 100 000 population for 2021. p-scores were -2% for 2020 and 33% for 2021 (table 1). the highest excess mortality (56 per 100 000 population) and p-score (114%) were recorded in september 2021. the calculated excess mortality was lower using nbr compared to 5ya across all time points (table 1). the ratio of reported covid-19 deaths to calculated excess mortality was -66% in 2020 and 20% in 2021, the latter suggesting that reported covid-19 deaths in the country only accounted for about 20% of excess mortality in 2021. monthly ratios ranged from -360% in october to 142% in september of 2020 (interquartile were generated, and box plots for excess mortality were created. data entry, cleaning and processing were completed in microsoft excel. results in 2020, reported mortality in the philippines peaked during august at 52 per 100 000 population, with the lowest mortality rate reported in april at 41 per 100 000. in 2021, the peak occurred in september at 104 per 100 000, with the lowest rate observed for december at 44 per 100 000 (fig. 1). the reported mortality for the philippines exceeded the upper bound of the expected mortality in august 2020 and from january to november 2021, while mortality was lower than expected in march and april 2020 and in december 2021 (fig. 1). map 1. administrative map of the philippines, 2019 barmm: bangsamoro autonomous region in muslim mindanao; car: cordillera administrative region; ncr: national capital region. map revised from dakilang isagani own work. source: authors; map adapted from felipe_aira’s municipal and city map of the philippines (cc by-sa 4.0. see: https://commons.wikimedia.org/w/index. php?curid=81166427). wpsar vol 14, no 1, 2023 | doi: 10.5365/wpsar.2023.14.1.984 https://ojs.wpro.who.int/4 migriño et alcovid-19 excess mortality in the philippines 5ya: 5-year average; nbr: negative binomial regression. discussion by using the acm calculator, we showed that the reported all-cause mortality in the philippines exceeded expectations in july and august 2020, which coincided with the peak of the country’s second wave17 in august 2020. most months in 2021 recorded a higher mortality rate than expected, which peaked in september. this coincided with the spread of the delta variant across the western pacific region and throughout the country.17 as there is a lack of published studies on excess mortality by region for the philippines, we also calculated excess mortality and p-scores by administrative region. unlike the results for the philippines overall, most regions had negative p-scores during july and august 2020. however, the high p-scores in ncr, region vii and barmm contributed significantly to the total allcause mortality recorded during those months. barmm and ncr recorded positive excess mortality and high p-scores consistently from the start of the pandemic despite having highly different local government structures, population demographics, population density and distribution, and even geospatial characteristics. during 2021, most regions recorded positive excess mortality and p-scores for most months, and all contributed to the higher-than-expected national all-cause mortality rate reported in 2021. this provides further evidence of the country-wide spread of covid-19 during 2021. range = 56%) and from -44% in december to 159% in november of 2021 (interquartile range = 15%) (fig. 2). in the analysis by administrative region, only the national capital region (ncr) reported positive excess mortality of 14 100 deaths or 105 per 100 000 in 2020, while all administrative regions reported positive excess mortality in 2021 (table 2). overall, for both years, ncr had the highest excess mortality, with region iv-a and region iii ranking second and third, respectively. the regions with the highest excess mortality rates in 2021 were regions i, iii and iv-a, while bangsamoro autonomous region in muslim mindanao (barmm) had the lowest excess mortality (table 2). when assessing p-scores per region per month for 2020 and 2021 (fig. 3; table 3), the top three highest monthly p-scores occurred in september 2021 from region i at 183%, region iii at 160% and region ii at 153%. up until june 2020, most regions had negative p-scores, whereas in june 2020 only three regions had negative p-scores. ncr had high p-scores (that is, greater than the 75th percentile) from july to september 2020, while barmm had high p-scores in june and july. in 2021, there were high p-scores for most regions from june to october, while ncr had high p-scores from march to may and from august to september. barmm consistently had high p-scores from january to september 2021. fig. 1. number of reported deaths and expected deaths calculated using the negative binomial regression and 5-year average methods, the philippines, 2020 and 2021 0 10000 20000 30000 40000 50000 60000 70000 80000 90000 100000 110000 120000 130000 jan feb mar apr may jun jul aug sep oct nov dec jan feb mar apr may jun jul aug sep oct nov dec n um be r of d ea th s 2020 2021 95% confidence interval (5ya) 95% confidence interval (nbr) recorded mortality expected mortality (5ya) expected mortality (nbr) wpsar vol 14, no 1, 2023 | doi: 10.5365/wpsar.2023.14.1.984https://ojs.wpro.who.int/ 5 covid-19 excess mortality in the philippinesmigriño et al table 1. reported number of deaths and number, rate and p-score of excess deaths calculated using the negative binomial regression and 5-year average methods, the philippines, 2020 and 2021 year and month reported mortalityb excess deaths using negative binomial regression excess deaths using 5-year average method number (rate per 100 000 population) number (rate per 100 000 population)b p-score (%)c number (rate per 100 000 population)b p-score (%)c 2020 totala 613 900 (563) -13 900 (-13) -2% 27 200 (25) 5% january 53 500 (49) -200 (0) 0% 1500 (1) 3% february 46 300 (42) -3500 (-3) -7% 800 (1) 2% march 46 000 (42) -6600 (-6) -12% -1900 (-2) -4% april 44 800 (41) -5500 (-5) -11% -2500 (-2) -5% may 50 300 (46) -1300 (-1) -3% 1100 (1) 2% june 48 500 (44) -1500 (-1) -3% 2400 (2) 5% july 54 400 (50) 2000 (2) 4% 5600 (5) 11% august 56 800 (52) 3400 (3) 6% 6300 (6) 12% september 54 000 (49) 1400 (1) 3% 4600 (4) 9% october 54 200 (50) -500 (0) -1% 2900 (3) 6% november 51 600 (47) -1200 (-1) -2% 2900 (3) 6% december 53 700 (49) -400 (0) -1% 3700 (3) 7% 2021 totala 853 100 (774) 212 900 (193) 33% 266 400 (242) 45% january 57 600 (52) 2700 (2) 5% 5600 (5) 11% february 53 100 (48) 4000 (4) 8% 7700 (7) 17% march 61 600 (56) 7900 (7) 15% 13 700 (12) 29% april 67 900 (62) 16 500 (15) 32% 20 700 (19) 44% may 71 400 (65) 18 600 (17) 35% 22 300 (20) 45% june 66 900 (61) 15 900 (14) 31% 20 800 (19) 45% july 75 200 (68) 21 600 (20) 40% 26 300 (24) 54% august 95 700 (87) 41 100 (37) 75% 45 200 (41) 89% september 115 000 (104) 61 200 (56) 114% 65 600 (60) 133% october 82 400 (75) 26 500 (24) 47% 31 100 (28) 61% november 57 400 (52) 3400 (3) 6% 8700 (8) 18% december 48 900 (44) -6500 (-6) -12% -1100 (-1) -2% a cumulative counts of excess mortality per year may not reflect the sum of values shown due to rounding. b mortality counts 100 and above were rounded to the nearest 100; mortality counts below 100 were rounded to the nearest 10; rates were rounded to the nearest integer. c p-scores were rounded to the nearest integer. labour mobility may have also played a role in excess deaths. however, the above-mentioned local study found low correlation between mobility and covid-19 deaths.20 aron et al. recommended supplementing region-based disaggregation analysis with analyses by age, sex and socioeconomic categories (such as inequality and urban density) to reveal “the effectiveness of different types of policy”.21 nonetheless, an analysis disaggregated by region could contribute to the assessment of the impact of the covid-19 pandemic, particularly by identifying specific areas that are disproportionately affected. overcrowding was identified as a factor affecting excess mortality in chile.18 in this study, regions with the highest population density (that is, ncr, region iii and region v-a)19 also had the highest total excess mortality from 2020 to 2021. a local study showed a strong positive correlation (r = 0.92) between covid-19 deaths and regional population density, as well as between the number of intensive care unit beds and doctors absent due to being in quarantine (r = 0.92 and 0.85, respectively).20 regions iii and iv-a border ncr with many workers regularly travelling to ncr from these regions, suggesting wpsar vol 14, no 1, 2023 | doi: 10.5365/wpsar.2023.14.1.984 https://ojs.wpro.who.int/6 migriño et alcovid-19 excess mortality in the philippines fig. 2. reported covid-19 deaths and number of excess deaths calculated using the negative binomial regression method,a the philippines, 2020 and 2021 a error bars represent the 95% prediction intervals. table 2. number of excess deaths calculated using the negative binomial regression method by administrative region, the philippines, 2020 and 2021 region number of excess deaths (rate per 100 000 population) by yeara 2020 2021 2020 and 2021b ncr 14 100 (105) 22 500 (161) 36 600 region i -1800 (-33) 16 200 (304) 14 400 region ii -3200 (-86) 8900 (240) 5700 region iii -6600 (-53) 33 800 (270) 27 200 region iv-a -6200 (-39) 39 500 (241) 33 200 region iv-b -1900 (-58) 4800 (148) 2900 region v -5200 (-86) 9400 (152) 4200 region vi -4100 (-52) 15 800 (198) 11 600 region vii -900 (-11) 15 500 (192) 14 600 region viii -2700 (-58) 7200 (150) 4600 region ix -2100 (-55) 6900 (182) 4800 region x -2500 (-49) 6300 (124) 3800 region xi -1400 (-27) 9000 (167) 7600 region xii -1700 (-40) 8700 (174) 7000 region xiii -1900 (-69) 4200 (152) 2300 barmm -90 (-2) 1300 (30) 1200 car -1200 (-65) 3400 (186) 2200 barmm: bangsamoro autonomous region in muslim mindanao; car: cordillera administrative region; ncr: national capital region. a mortality counts 100 and above were rounded to the nearest 100; mortality counts below 100 were rounded to the nearest 10; rates were rounded to the nearest integer. b totals of excess mortality for 2020 and 2021 may not reflect the sum of values shown due to rounding. wpsar vol 14, no 1, 2023 | doi: 10.5365/wpsar.2023.14.1.984https://ojs.wpro.who.int/ 7 covid-19 excess mortality in the philippinesmigriño et al barmm: bangsamoro autonomous region in muslim mindanao; car: cordillera administrative region; ncr: national capital region. a p-scores were rounded to the nearest integer. fig. 3. p-scoresa calculated using the negative binomial regression method by administrative region and month, the philippines, 2020 and 2021 covid-19 mortality data did not include deaths at home or in care facilities where covid-19 testing was not routinely carried out.27 the philippines doh released several advisories which acknowledged delays in reporting of covid-19 mortality data, citing logistical delays from local government units and health-care providers as well as technical issues with the information system as possible reasons for delayed reporting.29,30 often considered the most reliable epidemic indicator internationally, reporting of daily deaths may be unreliable and may peak at times that appear contradictory to patterns of confirmed cases.31 indirect deaths caused by the pandemic also contribute to the excess mortality counts,11,32 but the exact proportion of indirect deaths is difficult to ascertain, varying by country, state or even locality. based on our study, indirect deaths appear to be a significant contributor to excess mortality, possibly responsible for as much as 80% of the excess deaths in 2021. in one study in the united states of america, drug overdoses, homicides, suicides and unintentional injuries may have contributed to non-covid-19 excess deaths in 2020,25 while a study in latvia documented varying noncommunicable diseases contributing to excess mortality, such while this study showed that the patterns of allcause mortality and excess mortality were similar to reported covid-19 deaths in the philippines, these reported covid-19 deaths only accounted for 20% of the excess mortality in 2021. a recent global study estimated this proportion at 29% for the philippines from 2020 to 2021, compared to around 85% in high-income countries such as belgium and sweden.9 the commission on population and development in the philippines also acknowledged that covid-19 was a major contributor to excess mortality in 2021.22 discrepancies in excess deaths versus reported covid-19 deaths suggest that there may be: (1) underreporting of actual covid-19 deaths; (2) a large cohort of deaths indirectly caused by the pandemic that are not covid-19 deaths; or (3) a combination of both.23–27 delays in reporting contribute to underreporting of covid-19 deaths, as can the varying quality, intensity and timing of testing and location of death. early in the pandemic, data quality was recognized as a possible factor in underestimating covid-19 deaths, especially in developing countries.3 in some states in the united states of america, increases in excess deaths corresponded to increases in testing intensity.28 in italy, wpsar vol 14, no 1, 2023 | doi: 10.5365/wpsar.2023.14.1.984 https://ojs.wpro.who.int/8 migriño et alcovid-19 excess mortality in the philippines table 3. p-scoresa calculated using the negative binomial regression method by administrative region and month, the philippines, 2020 and 2021 p-score (%), 2020 region jan feb mar apr may jun jul aug sep oct nov dec ncr 8 14 -6 10 6 21 43 44 45 13 0 16 region i -1 -2 -17 -24 6 12 -5 -15 -1 -7 -9 6 region ii -15 -7 -27 -34 -2 -1 -10 -14 -3 -15 -15 -20 region iii -15 -17 -39 -41 -8 23 1 -11 8 -7 -3 4 region iv-a -17 -15 -28 -37 -7 17 1 -1 17 -3 -4 -4 region iv-b -17 -19 -33 -42 -3 2 -3 -12 3 -3 -4 -1 region v -13 -39 -44 -33 -4 0 -7 -6 16 0 -25 -7 region vi -15 -13 -10 -28 0 5 -7 -15 11 -3 -14 -6 region vii -14 -9 -7 -11 -7 20 21 4 13 -5 -23 -2 region viii -25 -4 -15 -29 -13 -19 -4 -15 3 -4 -5 9 region ix -46 -12 -19 -23 -21 12 -7 -20 6 -6 3 6 region x -11 -11 -31 -22 -11 0 -4 -13 6 -3 -5 -2 region xi -3 -11 -6 -10 -16 3 -5 -8 6 -6 -7 10 region xii -12 -37 -13 -20 -9 10 3 -13 9 -11 14 -12 region xiii -17 -17 -21 -25 -21 -9 -11 -15 3 2 -6 -3 barmm -51 1 -39 -57 -36 46 35 14 17 21 1 29 car -15 -2 -27 -31 -11 8 -9 -17 -13 -18 -10 -4 p-score (%), 2021 region jan feb mar apr may jun jul aug sep oct nov dec ncr -17 5 53 87 40 13 21 65 80 15 -5 -12 region i 9 7 -2 18 46 33 55 102 183 60 17 -4 region ii 3 0 3 45 56 24 22 75 153 88 5 -13 region iii 6 4 13 45 58 29 45 117 160 42 3 -11 region iv-a 6 8 19 51 43 33 49 102 151 36 0 -5 region iv-b 2 1 -3 3 24 31 32 45 85 87 27 -12 region v 12 7 7 12 23 47 35 15 73 65 8 -12 region vi 1 4 2 7 22 43 42 46 101 67 10 -5 region vii 6 12 14 10 14 20 55 117 84 45 12 -23 region viii 14 19 12 19 30 47 44 42 58 33 12 -10 region ix 11 3 9 8 40 36 25 37 112 92 26 -11 region x 12 14 8 -12 17 7 50 111 76 25 -3 -40 region xi 10 20 10 13 18 39 37 37 98 37 9 -11 region xii 20 13 13 20 31 47 43 55 118 53 10 0 region xiii 10 11 -13 18 29 48 35 26 68 62 17 -11 barmm 77 62 42 50 61 70 48 37 93 25 -26 -72 car 5 6 17 47 36 15 22 46 130 95 12 -15 barmm: bangsamoro autonomous region in muslim mindanao; car: cordillera administrative region; ncr: national capital region. a p-scores were rounded to the nearest integer. wpsar vol 14, no 1, 2023 | doi: 10.5365/wpsar.2023.14.1.984https://ojs.wpro.who.int/ 9 covid-19 excess mortality in the philippinesmigriño et al income countries.1 additionally, mortality data are often preliminary which suggests that the earlier data may be more incomplete.7 the acm calculator assumes that reported counts are the actual values and that reports are complete and accurate, but it does not currently account for reporting delays. this may explain the overestimation of our data compared to studies from older datasets. therefore, the results of the acm calculator should be interpreted with caution, particularly when there are timeliness issues and reporting delays.12,14 second, our dataset did not contain disaggregated data on age, sex and other factors associated with excess mortality, which limited our analysis to administrative regions. lastly, we were not able to account for regional variations in testing and reporting accuracy and capacity that may have influenced the dataset. analysing excess mortality provided a more comprehensive picture of the direct and indirect impacts of the covid-19 pandemic in the philippines. while the pattern of excess mortality was similar to reported covid-19 deaths, the reported covid-19 deaths only accounted for a small proportion of excess deaths. we therefore recommend incorporating excess mortality analysis during surveillance of similar events such as outbreaks and pandemics. our analysis by administrative region highlighted the key regions disproportionately affected by the pandemic, which is information that may not have been fully captured from national covid-19 surveillance. we recommend that excess mortality be calculated using ageand sex-disaggregated data, as well as other studies on the indirect factors that may contribute to excess mortality. standardizing the methods of analysing and reporting excess mortality would assist in contextualizing information from different sources. we also recommend the use of open-source tools such as the acm calculator to monitor excess mortality especially in low-resource countries, as these tools can provide standardized and timely information that may help decision-makers to optimize the use of health resources and subsequently contribute to the achievement of sustainable development goals in strengthening the capacity of developing countries for early warning, risk reduction and management of national and global health risks. acknowledgements the authors would like to thank colleagues for their creative and operational support. this research was supas circulatory diseases, neoplasms, diabetes mellitus and chronic lower respiratory diseases.33 data from the philippines on non-covid-19 causes of death in 2021 compared to 2020 showed increases in deaths due to ischaemic heart disease (30%), cerebrovascular disease (15%), diabetes mellitus (21%), hypertensive disease (32%) and malnutrition (47%).22 cancer-related deaths decreased by 10%, but this was partly attributed to “covid[-19] cases [crowding] out actual and undiagnosed cancer patients”.22 excess mortality is often calculated using two general models: historical (for example, 5-year) averages and nbr. nbr models can be used for data with low or zero counts, and can account for overdispersion, seasonal fluctuations within a given year, secular trends in data, reporting delays and other time-sensitive covariates, such as internal and external movement of populations or periods with low reporting activities (for example, holidays).7,12,14 although we used both models to calculate total excess mortality, our analysis focused on the nbr model for two reasons: (1) the accuracy of the nbr model in the acm calculator was validated in its documentation;14 and (2) who recently released a document detailing the use of regression models in estimating excess mortality data.15 the cumulative 2020–2021 excess mortality estimates from our study using the nbr estimate (199 000) was closer to the estimate (184 000) from a 2022 global study9 from the same time period which used poisson modelling and a recent who-modelled estimate (185 300) as reported in may 2022.24 our result using the 5ya model (293 600) was closer to the projected excess deaths (254 897) from a local presentation which also used historical averages and mid-2021 data.32 variations in study findings are often influenced by the completeness and reliability of the all-cause mortality data used as well as backward revisions of preliminary data.7 although the trend of excess deaths from both methods used in this study were consistent, the total number of excess deaths differed, suggesting that analysis of excess mortality data should take into account the method used to calculate the excess deaths. there were several limitations to this study. mortality reporting systems do not cover all deaths, especially in low-resource settings, with civil registration of deaths noted to be as low as 20% in some lowand middlewpsar vol 14, no 1, 2023 | doi: 10.5365/wpsar.2023.14.1.984 https://ojs.wpro.who.int/10 migriño et alcovid-19 excess mortality in the philippines 10. mapa ds. causes of deaths in the philippines (preliminary): january to october 2021. quezon city: philippine statistics authority; 2022. available from: https://psa.gov.ph/vital-statistics/id/165640%5d**, accessed 26 february 2022. 11. del castillo fa. negative covid-19 excess mortality in the philippines: outcome of public health measure or product of incomplete data? j public health (oxf). 2022;44(2):e291–2. doi:10.1093/pubmed/fdab203 pmid:34109401 12. duan m, handcock ms, blackburn b, kee f, biaukula v, matsui t, et al. tool for tracking all-cause mortality and estimating excess mortality to support the covid-19 pandemic response: all-cause mortality calculator for covid-19 response. western pac surveill response j. 2022;13(2):1–7. doi:10.5365/wpsar.2022.13.2.921 pmid:36276174 13. vital statistics: reports. quezon city: philippine statistics authority; 2022. available from: https://psa.gov.ph/vital-statistics, accessed 15 november 2022. 14. methodology used in “tracking all cause of death and estimating excess mortality during the covid-19 pandemic: statistical and computational tools”. los angeles (ca): university of california department of statistics; 2021. available from: https://github.com/ handcock/wproacm/wiki/files/wproacm_methodology.pdf, accessed 23 february 2022. 15. methods for estimating the excess mortality associated with the covid-19 pandemic. geneva: world health organization; 2022. available from: https://www.who.int/publications/m/item/methodsfor-estimating-the-excess-mortality-associatedwith-the-covid-19pandemic, accessed 17 october 2022. 16. who coronavirus (covid-19) dashboard. geneva: world health organization; 2020. available from: https://covid19.who.int, accessed 3 november 2020. 17. toole m. the philippines passes the 2 million mark as covid-19 cases surge in southeast asia. the conversation; 2021. available from: http://theconversation.com/the-philippines-passes-the-2million-mark-as-covid-19-cases-surge-in-southeast-asia-167186, accessed 9 july 2022. 18. alfaro t, martinez-folgar k, vives a, bilal u. excess mortality during the covid-19 pandemic in cities of chile: magnitude, inequalities, and urban determinants. j urban health. 2022;99(5):922–35. doi:10.1007/s11524-022-00658-y pmid:35688966 19. mapa ds. highlights of the population density of the philippines 2020 census of population and housing (2020 cph). quezon city: philippine statistics authority; 2021. available from: https://psa.gov. ph/content/highlights-population-density-philippines-2020-censuspopulation-and-housing-2020-cph, accessed 13 july 2022. 20. talabis das, babierra al, buhat ca, lutero ds, quindala km 3rd, rabajante jf. local government responses for covid-19 management in the philippines. bmc public health. 2021;21(1):1711. doi:10.1186/s12889-021-11746-0 pmid:34544423 21. aron j, muellbauer j, giattino c, ritchie h. a pandemic primer on excess mortality statistics and their comparability across countries. our world in data; 2020. available from: https://ourworldindata. org/covid-excess-mortality, accessed 6 august 2022. 22. popcom: 2021 ‘deadliest’ in phl history with 879k lives lost as ‘covid’ accounts for 146k deaths in 2.5 years. national capital region: commission on population and development; 2022. available from: https://ncr.popcom.gov.ph/2022/09/09/popcom2021-deadliest-in-phl-history-with-879k-lives-lost-as-covidaccounts-for-146k-deaths-in-2-5-years%ef%bf%bc/, accessed 18 october 2022. ported by the san beda university college of medicine and the ateneo school of medicine and public health. conflicts of interest the authors have no conflicts of interest to declare. ethics statement the study was reviewed and approved on 1 july 2022 by the ateneo school of medicine and public health research ethics committee under the study protocol id: smph mortality 2022. funding a partial operational grant for the study was provided by the san beda university office of research and innovation. references 1. covid-19 coronavirus pandemic. worldometer [online database]; 2020. available from: https://www.worldometers.info/coronavirus/, accessed 5 january 2023. 2. bayati m. why is covid-19 more concentrated in countries with high economic status? iran j public health. 2021;50(9):1926–9. doi:10.18502/ijph.v50i9.7081 pmid:34722396 3. schellekens p, sourrouille dm. covid-19 mortality in rich and poor countries: a tale of two pandemics? washington (dc): world bank; 2020. available from: https://openknowledge.worldbank.org/ handle/10986/33844, accessed 26 february 2022. 4. li r, pei s, chen b, song y, zhang t, yang w, et al. substantial undocumented infection facilitates the rapid dissemination of novel coronavirus (sars-cov-2). science. 2020;368(6490):489–93. doi:10.1126/science.abb3221 pmid:32179701 5. lau h, khosrawipour t, kocbach p, ichii h, bania j, khosrawipour v. evaluating the massive underreporting and undertesting of covid-19 cases in multiple global epicenters. pulmonology. 2021;27(2):110– 5. doi:10.1016/j.pulmoe.2020.05.015 pmid:32540223 6. score for health data technical package: global report on health data systems and capacity, 2020. geneva: world health organization; 2021. available from: https://apps.who.int/iris/ handle/10665/339125, accessed 26 february 2022. 7. karlinsky a, kobak d. tracking excess mortality across countries during the covid-19 pandemic with the world mortality dataset. elife. 2021;10:e69336. doi:10.7554/elife.69336 pmid:34190045 8. kapitsinis n. the underlying factors of excess mortality in 2020: a cross-country analysis of pre-pandemic healthcare conditions and strategies to cope with covid-19. bmc health serv res. 2021;21(1):1197. doi:10.1186/s12913-021-07169-7 pmid:34736434 9. wang h, paulson kr, pease sa, watson s, comfort h, zheng p, et al. estimating excess mortality due to the covid-19 pandemic: a systematic analysis of covid-19-related mortality, 2020–21. lancet. 2022;399(10334):1513–36. doi:10.1016/s01406736(21)02796-3 pmid:35279232 https://openknowledge.worldbank.org/handle/10986/33844 https://apps.who.int/iris/handle/10665/339125 https://github.com/handcock/wproacm/wiki/files/wproacm_methodology.pdf https://psa.gov.ph/content/highlights-population-density-philippines-2020-censuspopulation-and-housing-2020-cph https://ourworldindata.org/covid-excess-mortality wpsar vol 14, no 1, 2023 | doi: 10.5365/wpsar.2023.14.1.984https://ojs.wpro.who.int/ 11 covid-19 excess mortality in the philippinesmigriño et al 29. statement on concerns re data management and reporting. manila: philippine department of health; n.d. available from: https:// doh.gov.ph/press-release/statement-on-concerns-redata-management-and-reporting, accessed 18 october 2022. 30. doh addresses information system failure to reflect accurate numbers. manila: philippine department of health; 2021. available from: https://doh.gov.ph/doh-press-release/doh-addressesinformation-system-failure-to-reflect-accuratenumbers, accessed 17 october 2022. 31. caldwell jm, de lara-tuprio e, teng tr, estuar mrje, sarmiento rfr, abayawardana m, et al. understanding covid-19 dynamics and the effects of interventions in the philippines: a mathematical modelling study. lancet reg health west pac. 2021;14:100211. doi:10.1016/j.lanwpc.2021.100211 pmid:34308400 32. briones kjs, del mundo mdc. excess deaths associated with the covid-19 pandemic in the philippines. quezon city: philippine statistics authority; n.d. available from: https://psa.gov.ph/sites/ default/files/session%2010.2_michael%20dominic%20c.%20 del%20mundo_crvs%20paper%2c%20academe%20-%20 study%20on%20excess%20mortality%20and%20projections. pdf, accessed 29 november 2022. 33. gobina i, avotinš a, kojalo u, strēle i, pildava s, villeruša a, et al. excess mortality associated with the covid-19 pandemic in latvia: a population-level analysis of all-cause and noncommunicable disease deaths in 2020. bmc public health. 2022;22(1):1109. doi:10.1186/s12889-022-13491-4 pmid:35659648 23. the true death toll of covid-19: estimating global excess mortality. geneva: world health organization; 2022. available from: https:// www.who.int/data/stories/the-true-death-toll-of-covid-19-estimatingglobal-excess-mortality, accessed 23 february 2022. 24. global excess deaths associated with covid-19 (modelled estimates). geneva: world health organization; 2022. available from: https://www.who.int/data/sets/global-excess-deathsassociated-with-covid-19-modelled-estimates, accessed 17 october 2022. 25. fairman ka, goodlet kj, rucker jd, zawadzki rs. unexplained mortality during the us covid-19 pandemic: retrospective analysis of death certificate data and critical assessment of excess death calculations. bmj open. 2021;11(11):e050361. doi:10.1136/ bmjopen-2021-050361 pmid:34785551 26. excess deaths associated with covid-19. atlanta (ga): centers for disease control and prevention; 2022. available from: https:// www.cdc.gov/nchs/nvss/vsrr/covid19/excess_deaths.htm, accessed 23 february 2022. 27. rizzo m, foresti l, montano n. comparison of reported deaths from covid-19 and increase in total mortality in italy. jama intern med. 2020;180(9):1250–2. doi:10.1001/jamainternmed.2020.2543 pmid:32702088 28. weinberger dm, chen j, cohen t, crawford fw, mostashari f, olson d, et al. estimation of excess deaths associated with the covid-19 pandemic in the united states, march to may 2020. jama intern med. 2020;180(10):1336–44. doi:10.1001/ jamainternmed.2020.3391 pmid:32609310 https://psa.gov.ph/sites/default/files/session%2010.2_michael%20dominic%20c.%20del%20mundo_crvs%20paper%2c%20academe%20-%20study%20on%20excess%20mortality%20and%20projections.pdf https://ojs.wpro.who.int/ 1wpsar vol 13, no 4, 2022 | doi: 10.5365/wpsar.2022.13.4.894 original research c ervical cancer, which is caused by persistent human papillomavirus (hpv) infection usually by oncogenic/high-risk hpv type(s), is the fourth leading cause of cancer mortality among women globally, with an estimated 570 000 new cases and 311 000 deaths in 2018.1 the majority of these cases occur in lowand middle-income countries (lmics), primarily due to the low uptake of hpv vaccination, lack of robust hpv screening programmes and limited treatment options.2 in response to the global public health burden, in 2020, the world health organization (who) set a threshold of four cervical cancer cases per 100 000 women for the elimination of cervical cancer as a public health problem and launched the 90-70-90 targets, aiming to fully immunize 90% of girls against hpv by 15 years of age, screen 70% of a pasteur institute of ho chi minh city, ho chi minh city, viet nam. b department of infectious disease epidemiology, london school of hygiene and tropical medicine, london, united kingdom. c national institute of hygiene and epidemiology, hanoi, viet nam. d school of public health, university of hong kong, hong kong, sar (china). e public health england, modelling and economics unit, london, united kingdom. f new vaccines, murdoch children’s research institute, parkville, victoria, australia. g department of paediatrics, the university of melbourne, parkville, victoria, australia. h centre de recherche du chu de québec-université laval, quebec, canada. i department of social and preventive medicine, université laval, quebec, canada. j department of obstetrics and gynaecology, the university of melbourne, parkville, victoria, australia. k centre for women’s infectious diseases research, the royal women’s hospital, parkville, australia. * these authors are joint first authors. # these authors are joint last authors. published: 7 november 2022 doi: 10.5365/wpsar.2022.13.4.894 objective: female sex workers (fsws) are at high risk of human papillomavirus (hpv) infections and cervical cancer due to their high number of sexual partners. the objectives of this study were to determine the prevalence of hpv and identify risk factors for high-risk hpv infection among fsws in hanoi and ho chi minh city (hcmc), viet nam. methods: a cross-sectional study was conducted in hanoi and hcmc between december 2017 and may 2018. we surveyed and screened 699 fsws aged ≥18 years for hpv infection and abnormal cytology. a multivariable modified cox regression model was used to determine risk factors for high-risk hpv infection. results: the overall prevalence of any hpv, high-risk hpv and hpv-16/18 infection in the 699 fsws was 26.3%, 17.6% and 4.0%, respectively, and were similar in both cities. multiple infections were identified in 127 participants (69.0%). hpv-52 was the most prevalent (7%), followed by hpv-58 (6%). abnormal cytology was detected in 91 participants (13.0%). fsws who are divorced (adjusted prevalence ratio [apr]: 1.96, 95% confidence interval [ci]: 1.01–3.81), widowed (apr: 3.26, 95% ci: 1.49–7.12) or living alone (apr: 1.85, 95% ci: 1.01–3.39) were associated with a higher prevalence of high-risk hpv infection. discussion: almost one in five fsws in viet nam are infected with high-risk hpv. this highlights the importance of prevention strategies such as hpv vaccination and screening in this high-risk group. prevalence and risk factors for human papillomavirus infection among female sex workers in hanoi and ho chi minh city, viet nam: a cross-sectional study quang duy pham,a* kiesha prem,b* tuan anh le,c nguyen van trang,c mark jit,b,d,e tuan anh nguyen,c van cao,a tam-duong le-ha,a mai thi ngoc chu,c ly thi khanh le,c zheng quan toh,f,g marc brisson,h,i suzanne garland,j,k gerald murray,j,k kathryn bright,f duc anh dang,c hau phuc trana# and edward kim mulhollandb,f,g# correspondence to hau phuc tran (email: hautran68@gmail.com) and kim mulholland (email: kim.mulholland@lshtm.ac.uk) wpsar vol 13, no 4, 2022 | doi: 10.5365/wpsar.2022.13.4.894 https://ojs.wpro.who.int/2 pham et alprevalence and risk factors for hpv among fsws in viet nam methods study design this cross-sectional study was conducted in collaboration with the hiv/aids centres of hanoi and hcmc and district health facilities. the study population were women aged 18–50 years old of vietnamese nationality in hanoi and hcmc who have been engaging in transactional sex (sex in exchange for money, goods or drugs) in the month prior to the study. sample size calculation based on hpv prevalence of 70%, a desired precision of 5%, and a design effect of 2 to address the increase in the variance derived from the cluster design of this survey, determined that 646 fsws were required to obtain 80% power with a two-sided 5% significance level. a target of 700 (350 fsws per site) was recruited to allow for 5–10% participant refusal and invalid sample results. we used a two-stage recruitment strategy. first, four out of 30 administrative districts in hanoi and five out of 24 administrative districts in hcmc were purposively selected based on the mapping of fsw venues, the fsw population size overseen by the provincial aids centres, and the participation in hiv sentinel surveillance among fsws. within the selected districts, 212 active venues for transactional sex in hanoi (estimated range of fsws: 580–1330) and 516 venues in hcmc (estimated range of fsws: 2700–4800) were identified. sex work locations included: (i) street-based venues, for example, streets, parks, and other open public places such as under bridges; and (ii) entertainment-based venues, for example, cafes, restaurants, hotels, motels, nightclubs, karaoke lounges, sauna/massage parlours and billiards clubs. second, a sampling framework based on the estimated number of fsws obtained during the mapping exercise was created for the venue-based fsws. the target subsample sizes for each selected district were proportional to the estimated population size of fsws, and venues for recruitment were randomly sampled until the sample size was reached. all street-based or entertainment-based fsws seen at each venue were invited to participate in the study. visit timing varied across venue types, from daytime for entertainment-based fsws to night-time for street-based fsws. women who were menstruating at enrolment were advised to return and women for cervical cancer by 35 years of age and treat 90% of those diagnosed.3 however, the ongoing global pandemic of coronavirus disease of 20194 has presented challenges to countries in implementing this strategy. in viet nam, cervical cancer is the second most common cancer in women, affecting more than 9000 women from 2016–2017, of whom more than 40% died.5 this is most likely an underestimation due to underreporting of cases in rural viet nam.1 in 2016, the viet nam ministry of health (moh) and partners launched the national action plan on prevention and control of cervical cancer 2016–2025, which aims to provide hpv vaccination to 25% of all girls and women, to provide cervical cancer screening to 60% of women aged 30–54 years, to increase early diagnosis of cervical cancer by 40% and to reduce premature cervical cancer mortality by 20% by 2025.6,7 these targets have since been deemed unrealistic due to the limited results of cervical cancer prevention and control programmes since the strategic plan was disseminated.8 hpv is one of the most common sexually transmitted infections (stis) worldwide,9 with high-risk sexual behaviour being the leading risk factor for infection and subsequent cervical cancer. this includes having multiple sexual partners, early initial sexual intercourse and a compromised immune system.10,11 female sex workers (fsws) are at high risk of hpv infection due to their having multiple sexual partners. it is also common for them to harbour multiple hpv genotypes and cervical cytological abnormalities.12,13 previous studies in southern and northern viet nam found very high hpv prevalence among fsws (49.5–85%), with the majority (up to 90%) being high-risk hpv types.13,14 it was estimated that there are more than 10 000 fsws in ho chi minh city (hcmc) alone, with the actual numbers to be higher due to challenges in capturing this hard-toreach population.15 targeting this high-risk group will be important in reducing the cervical cancer burden in viet nam. the objective of this study was to determine the prevalence of hpv and identify risk factors for high-risk hpv infection among fsws in hanoi and hcmc. the findings from this study are expected to inform the viet nam moh on cervical cancer prevention strategies. wpsar vol 13, no 4, 2022 | doi: 10.5365/wpsar.2022.13.4.894https://ojs.wpro.who.int/ 3 prevalence and risk factors for hpv among fsws in viet nampham et al one senior cytologist examined the pap smears with assistance from the thinprep imaging system. hpv detection and genotyping hpv detection and genotyping were performed in two steps. first, nucleic acid extraction was performed using the cador pathogen 96 qiacube ht kit (qiagen, hilden, germany) on an automated platform followed by amplification with pgmy9/11 system by polymerase chain reaction (pcr).17 positive pcr samples were genotyped using genoflow hpv array test kit (diagcor bioscience, hong kong special administrative region [china]), which identified 33 hpv types (17 high-risk types: 16, 18, 31, 33, 35, 39, 45, 51, 52, 53, 56, 58, 59, 66/68, 73, 82; 16 low-risk types: 6, 11, 40/61, 42, 43/44, 54/55, 70, 57/71, 72, 81, 84/26). human leukocyte antigen (hla) and beta-globulin genes were used as internal controls for the pgmy9/11 pcr and geneflow kit, respectively. samples negative for the hla gene were considered invalid and were not included in the analysis. hpv labnet was used to validate hpv detection and genotyping using 40 study samples from each site: approximately 90% agreement was achieved between the laboratories, as previously reported.18 statistical analysis we analysed participants’ socio-demographic characteristics and compared fsws in hanoi and hcmc using the chi-square test or fisher’s exact test for categorical variables and student’s t-test or the mann-whitney u test for continuous variables where appropriate. the prevalence of hpv was unweighted due to the lack of reliable data on size estimates and characteristics of the fsw population in both cities. the exact binomial clopper-pearson method was used to estimate 95% confidence intervals (ci) of hpv infection. hpv types were categorized into high-risk and lowrisk, and modified cox regression analysis was performed to determine factors associated with high-risk hpv infection. the multivariable model included known risk factors for high-risk hpv positivity (for example, smoking), variables with p<0.25 in the bivariate regression models and variables with the wald statistic of p>0.10 in reduced models. we compared nested models using the likelihood ratio test. we explored co-linearity (for example, between ages at enrolment and sexual debut) and resume their participation after their period had ended. a participant information sheet was provided and written informed consent obtained from all participants. demographic and behavioural data collection the survey questionnaire included socio-demographic characteristics, smoking, alcohol and/or drug use, sexual behaviours (such as age of sexual debut, sexual acts and sexual partners), menstrual cycle, presence of vaginal bleeding after sex and history of pregnancy. in order to ensure participants’ confidentiality and safety, face-to-face interviews were conducted in a private room at the district health centres. no identifying information (for example, identity card numbers or addresses) was collected. late in the study period, sex work-related questions, that is the number of years selling sex and the number of clients in the last month, were added to the survey questionnaire. each interview lasted approximately 30 minutes. the participants received 80 000 vietnamese dongs, approximately us$4, for their participation in this study. clinical examination, specimen collection and hpv screening a physical and speculum examination was conducted by trained gynaecologists. cervical swabs were collected and stored in a vial containing 20 ml preservcyt® solution (hologic inc., ma, united states of america). at the district health centres, specimens collected from hanoi and hcmc were stored at room temperature and transferred weekly to the national institute of hygiene and epidemiology in hanoi and the pasteur institute in hcmc, respectively. at these institutes, specimens were tested for hpv dna and sent to the national hospital of obstetrics and gynecology in hanoi and the hung vuong hospital in hcmc, respectively, for papanicolaou (pap) testing using liquid-based cytology (thinprep pap test, hologic inc., on, canada). so as to avoid contamination, separate aliquots were used for hpv dna testing and for cytological examination. the bethesda system was used to report pap smear results, which are categorized as atypical squamous cells of undetermined significance, low-grade squamous intraepithelial lesion, atypical squamous cells, highgrade squamous intraepithelial lesion or squamous cell carcinoma.16 in each city, one cytological technician and wpsar vol 13, no 4, 2022 | doi: 10.5365/wpsar.2022.13.4.894 https://ojs.wpro.who.int/4 pham et alprevalence and risk factors for hpv among fsws in viet nam squamous intraepithelial lesions. in hanoi, squamous cell carcinoma was identified in a 33-year-old fsw, with hpv-31 present in samples. high-risk hpv prevalence among younger fsws (<25 years old) was higher in hanoi (27%) than in hcmc (12.5%), while fsws aged 30–34 years had higher prevalence of high-risk hpv and hpv-16/18 prevalence in hcmc than in hanoi (fig. 2). although these analyses were not statistically significant, increasing age was associated with lower risk of both high-risk hpv infection (unadjusted prevalence ratio [pr]: 0.98, 95% ci: 0.96–1, p=0.035) and hpv-16/18 infection (unadjusted pr: 0.95, 95% ci: 0.91–1, p=0.042) (table 3). approximately 25% of fsws reported their duration of sex work and number of sex clients in the past month. fsws in hanoi who had engaged in sex work for ≥20 years had higher prevalence of high-risk hpv than those with <20 years, whereas fsws in hcmc who had engaged in sex work for <10 years had a higher prevalence of high-risk hpv compared to those with ≥10 years. additionally, fsws who had more clients in the past month had higher prevalence of high-risk hpv (supplementary fig. 1). risk factors for high-risk hpv infection fsws who were married (adjusted pr [apr]: 2.94, 95% ci: 1.29–6.68, p=0.010), divorced (apr: 1.96, 95% ci: 1.01–3.81, p=0.047) or widowed (apr: 3.26, 95% ci: 1.49–7.12, p=0.003) had higher prevalence of highrisk hpv infection compared to those who were never married. compared to living with friends, living alone was associated with a higher risk of high-risk hpv infection (apr: 1.85, 95% ci: 1.01–3.39, p=0.046). in our study cohort, fsws were less likely to be infected with high-risk hpv if they had given birth (apr: 0.62, 95% ci: 0.38–1.00, p=0.048) or reported consumption of drugs (apr: 0.41, 95% ci: 0.17–0.97, p=0.042) (table 3). the risk factors for fsws (n=171) who responded to the sex work-related questions are presented in supplementary table 1; there was no evidence of possible interactions or co-linearity (for example, between age at enrolment and sexual debut) and possible interaction terms (for example, between marital status and parturition, and between drug use and type of sex worker). possible interaction terms (for example, between marital status and parturition, and drug use and type of sex worker). variables with p values ≤0.05 were considered statistically significant. data analyses were performed using r software. results participant characteristics there were 699 fsws recruited from 67 and 48 active venues for transactional sex in hanoi and hcmc between december 2017 and may 2018, respectively, with the last 171 participants responding to the additional sex work-related questions. participants had a median age of 37 years (range 18–52) and a median age of sexual debut of 19 years (range 11–40). the highest education attained for most participants was secondary school (40.3%). compared to fsws in hcmc, a higher number in hanoi obtained education beyond primary school (p<0.01), had heard of hpv prior to this study (p<0.01) and lived alone (p<0.01) (table 1). participants had an average of 11 sexual partners, including both clients and personal partners in the month prior to the study (table 1). hpv prevalence and cytology the prevalence of hpv among the 349 fsws screened in hanoi was 27.7% and among the 350 fsws screened in hcmc it was 24.9%. the prevalence of high-risk hpv types was similar between the cities (fig. 1). the prevalence of any high-risk hpv infection was 16.4% (95% ci: 12–21.6%) and 18.2% (95% ci: 14.8–22.1%) for fsws who reported consistent and inconsistent condom use, respectively. low-risk hpv types were generally more common among fsws in hanoi than hcmc, but this was not statistically significant (fig. 1). hpv type 52 was the most common type (7%) among fsws in both cities, followed by types 58 (6%) and 66 (4%). the prevalence of infection with multiple hpv types was 18.1% (95% ci: 15.4–21.2%) and was similar between both cities (fig. 1). the bivariate relationship between pap cytology and hpv prevalence among the fsws is shown in table 2; 13.0% of the fsws had abnormal pap cytology and hpv-16/18 accounted for a third of high-grade wpsar vol 13, no 4, 2022 | doi: 10.5365/wpsar.2022.13.4.894https://ojs.wpro.who.int/ 5 prevalence and risk factors for hpv among fsws in viet nampham et al hcmc: ho chi minh city. a the number of female sex workers who answered questions related to sex work was 171. table 1. participants’ demographic and behavioural characteristics by city, hanoi and hcmc, december 2017 to may 2018 characteristics of female sex workers hanoi (n=349) hcmc (n=350) total (n=699) p demographics n (%) n (%) n (%) age, in years, median (range) 35 (18–49) 39 (19–52) 37 (18–52) <0.001 age of sexual debut, in years, median (range) 18 (11–27) 19 (14–40) 19 (11–40) <0.001 kinh ethnicity 336 (96.3) 347 (99.1) 683 (97.7) 0.012 highest education attained <0.001 no formal education 5 (1.4) 22 (6.3) 27 (3.9) primary 51 (14.6) 147 (42) 198 (28.3) secondary 159 (45.6) 123 (35.1) 282 (40.3) high school or vocational school 115 (33.0) 54 (15.4) 169 (24.2) college or university 19 (5.4) 4 (1.1) 23 (3.3) marital status <0.001 never married 80 (22.9) 30 (8.6) 110 (15.7) married 60 (17.2) 106 (30.3) 166 (23.7) separated 83 (23.8) 45 (12.9) 128 (18.3) divorced 88 (25.2) 132 (37.7) 220 (31.5) widowed 38 (10.9) 33 (9.4) 71 (10.2) living arrangements <0.001 with friends 68 (19.5) 39 (11.1) 107 (15.3) with husband, boyfriend, male partner 77 (22.1) 119 (34.0) 196 (28.0) alone 150 (43.0) 81 (23.1) 231 (33.0) temporary housing or with family members 54 (15.4) 111 (31.7) 165 (23.6) behaviour ever smoked 72 (20.6) 101 (28.9) 173 (24.7) 0.015 ever consumed alcohol 230 (65.9) 234 (66.9) 464 (66.4) 0.85 ever been pregnant 319 (91.4) 306 (87.4) 625 (89.4) 0.068 number of times pregnant, median (range) 3 (1–20) 2 (1–8) 3 (1–20) <0.001 ever given birth 269 (77.1) 279 (79.7) 548 (78.4) 0.013 number of times given birth, median (range) 1 (0–5) 1 (0–5) 1 (0–5) <0.001 ever had abortion 253 (72.5) 152 (43.4) 405 (57.9) <0.001 number of abortions, median (range) 2 (1–20) 1 (1–8) 2 (1–20) <0.001 ever used contraception 331 (94.8) 263 (75.1) 594 (85.0) <0.001 consistent condom use 131 (37.4) 114 (32.6) 245 (35.1) <0.001 age started selling sex, median (range) 25 (17–35) 22 (16–42) 24 (16–42) <0.001 number of sexual partners in the last 12 months, median (range) 2 (1–30) 1 (1–65) 1 (1–65) <0.001 number of sex clients in the last month, median (range)a 15 (3–31) 8 (0–35) 10 (0–35) 0.006 street-based sex worker 44 (12.6) 46 (13.1) 90 (12.9) 0.92 ever consumed drugs 32 (9.2) 34 (9.7) 66 (9.4) 0.9 wpsar vol 13, no 4, 2022 | doi: 10.5365/wpsar.2022.13.4.894 https://ojs.wpro.who.int/6 pham et alprevalence and risk factors for hpv among fsws in viet nam fig. 1. prevalence of high-risk and low-risk hpv types among female sex workers in hanoi and hcmc, december 2017 to may 2018 hcmc: ho chi minh city; hpv: human papillomavirus. the exact binominal method was used to estimate 95% confidence intervals of hpv infection for hanoi in northern viet nam (in red) and hcmc in southern viet nam (in blue). high-risk hpv types include 16, 18, 31, 33, 35, 39, 45, 51, 52, 53, 56, 58, 59, 66/68, 73 and 82, and low-risk hpv types include 6, 11, 34, 40/61, 42, 43/44, 54/55, 57/71, 70, 72, 81 and 84/26. pacific countries (31.6–57.2%).23–26 this may be due to a number of reasons. first, the global fund-supported free condom distribution programmes have been largely implemented for fsws in viet nam through communitybased organizations, and private and public clinics since 2015.27 second, our cohort was older and had fewer clients/sexual partners compared to previous studies in southern14 and northern viet nam.13 third, we recruited a higher proportion of venue-based fsws rather than street-based fsws, who have higher rates of stis including hiv.28,29 fourth, the regions are different than in the other studies. our finding that one in 10 fsws had abnormal cytology supports the need for a national cervical cancer screening programme in viet nam. who recommends discussion in this survey of fsws in hanoi and hcmc, the prevalence of hpv was 27.7% and 24.9%, respectively, with almost one in five having high-risk hpv types. hpv types were similar between hanoi and hcmc with the most common high-risk hpv types being hpv-52, -58 and -66. fsws who were divorced, widowed or living alone had higher prevalence of high-risk hpv infection. this, as well as being infected with multiple hpv types, has been reported in this group in previous studies,19–22 and highlights this group as being susceptible to hpv diseases. the hpv prevalence observed in our study is lower than previous surveys conducted among fsw populations in viet nam (49.5–85%)13,14 and other western wpsar vol 13, no 4, 2022 | doi: 10.5365/wpsar.2022.13.4.894https://ojs.wpro.who.int/ 7 prevalence and risk factors for hpv among fsws in viet nampham et al fig. 2. prevalence of high-risk hpv and hpv-16/18 by age among female sex workers in hanoi and hcmc, december 2017 to may 2018 table 2. prevalence of hpv infection by cytological result among female sex workers in hanoi and hcmc, december 2017 to may 2018 low-grade lesions high-grade lesions cancer cytological results total n (%) normal ascus lsil asc-h hsil scc totala 699 (100) 607 (86.8) 52 (7.4) 19 (2.7) 4 (0.6) 15 (2.1) 1 (0.1) hpv type at time of survey 16 21 (3.0) 12 (2.0) 1 (1.9) 4 (21.1) 0 (0) 4 (26.7) 0 (0) 18 10 (1.4) 7 (1.2) 1 (1.9) 1 (5.3) 0 (0) 1 (6.7) 0 (0) 16 or 18 28 (4.0) 17 (2.8) 2 (3.8) 4 (21.1) 0 (0) 5 (33.3) 0 (0) 16, 18, 31, 33, 45, 52 or 58 92 (13.2) 65 (10.7) 6 (11.5) 8 (42.1) 2 (50.0) 10 (66.7) 1 (100) 6, 11, 16 or 18b 43 (6.2) 29 (4.8) 2 (3.8) 6 (31.6) 0 (0) 6 (40.0) 0 (0) 6, 11, 16, 18, 31, 33, 45, 52 or 58c 100 (14.3) 71 (11.7) 6 (11.5) 9 (47.4) 2 (50.0) 11 (73.3) 1 (100) high-risk hpv typesd 123 (17.6) 85 (14.0) 9 (17.3) 13 (68.4) 2 (50.0) 13 (86.7) 1 (100) low-risk hpv typese 109 (15.6) 88 (14.5) 10 (19.2) 8 (42.1) 1 (25.0) 2 (13.3) 0 (0) undetermined hpv type 15 (2.1) 12 (2.0) 3 (5.8) na na na na all values are presented as n (%). asc-h: atypical squamous cells cannot exclude hsil; ascus: atypical squamous cells of undetermined significance; hcmc: ho chi minh city; hpv: human papillomavirus; hsil: high-grade squamous intraepithelial lesion; lsil: low-grade squamous intraepithelial lesion; na: not applicable; scc: squamous cell carcinoma. the bethesda system was used to report pap smear results. a there was one sample insufficient for cytological testing. b hpv types covered in the licensed 4-valent vaccine. c hpv types covered in the licensed 9-valent vaccine. d high-risk hpv types: 16, 18, 31, 33, 35, 39, 45, 51, 52, 53, 56, 58, 59, 66/68, 73, 82. e low-risk hpv types: 6, 11, 34, 40/61, 42, 43/44, 54/55, 57/71, 70, 72, 81, 84/26. hcmc: ho chi minh city; hpv: human papillomavirus. high-risk hpv types include 16, 18, 31, 33, 35, 39, 45, 51, 52, 53, 56, 58, 59, 66/68, 73 and 82. error bars represent 95% confidence intervals. wpsar vol 13, no 4, 2022 | doi: 10.5365/wpsar.2022.13.4.894 https://ojs.wpro.who.int/8 pham et alprevalence and risk factors for hpv among fsws in viet nam table 3. correlations of factors associated with high-risk hpv infection among female sex workers in hanoi and hcmc, december 2017 to may 2018 any high-risk hpva bivariate analysis multivariable analysis variables n n % p pr (95% ci) p apr (95% ci) p age 0.98 (0.96–1) 0.04 0.98 (0.95–1) 0.06 age of sexual debut 0.94 (0.89–0.99) 0.09 0.95 (0.90–1.01) 0.09 educational levelb low 225 44 19.6 0.40 1 high 474 79 16.7 0.84 (0.58–1.21) 0.35 marital status never married 110 16 14.5 0.44 1 1 married 166 32 19.3 1.36 (0.75–2.48) 0.31 2.94 (1.29–6.68) 0.01 separated 128 18 14.1 0.96 (0.49–1.89) 0.92 1.48 (0.72–3.05) 0.29 divorced 220 39 17.7 1.24 (0.69–2.22) 0.47 1.96 (1.01–3.81) <0.05 widowed 71 17 23.9 1.74 (0.88–3.44) 0.11 3.26 (1.49–7.12) <0.01 other 4 1 25.0 1.82 (0.24–13.76) 0.56 3.21 (0.40–25.89) 0.27 living arrangements with friends 107 14 13.1 0.14 1 1 with husband, boyfriend, male partner 196 33 16.8 1.31 (0.70–2.46) 0.39 1.16 (0.54–2.49) 0.70 alone 231 51 22.1 1.78 (0.98–3.21) 0.06 1.85 (1.01–3.39) <0.05 temporary housing or with family members 165 25 15.2 1.17 (0.61–2.25) 0.64 1.37 (0.70–2.70) 0.36 ever smoked 173 32 18.5 0.81 1.08 (0.72–1.61) 0.72 1.23 (0.80–1.88) 0.36 ever consumed alcohol 464 77 16.6 0.38 0.83 (0.58–1.2) 0.33 ever been pregnant 625 102 16.3 0.02 0.54 (0.34–0.87) <0.01 ever given birth 548 89 16.2 0.09 0.7 (0.47–1.03) 0.07 0.62 (0.38–1.00) <0.05 ever had abortion 405 67 16.5 0.46 0.86 (0.60–1.23) 0.39 ever used contraception 594 102 17.1 0.57 0.84 (0.53–1.35) 0.48 consistent condom use 244 40 16.4 0.61 0.89 (0.61–1.3) 0.54 ever consumed drugs 66 6 9.1 0.08 0.47 (0.21–1.06) 0.07 0.41 (0.17–0.97) 0.04 type of sex work street-based 90 9 10.0 0.06 1 1 venue-based 609 114 18.7 1.96 (1–3.87) 0.05 1.85 (0.93–3.67) 0.08 ever heard of hpv 160 25 15.6 0.54 0.85 (0.55–1.31) 0.46 0.95 (0.90–1.01) 0.09 ever heard of hpv vaccines 154 29 18.8 0.73 1.1 (0.73–1.67) 0.65 ever heard of cervical cancer 325 53 16.3 0.47 0.86 (0.60–1.23) 0.41 ever heard of cervical cancer screening 241 36 14.9 0.34 0.72 (0.40–1.28) 0.26 study site hanoi, north viet nam 349 63 18.1 0.83 1 hcmc, south viet nam 350 60 17.1 0.94 (0.66–1.35) 0.75 apr: adjusted prevalence ratio; hcmc: ho chi minh city; hpv: human papillomavirus; pr: prevalence ratio. a high-risk hpv types: 16, 18, 31, 33, 35, 39, 45, 51, 52, 56, 58, 59, 66/68. b low: primary or no formal education; high: secondary and above. wpsar vol 13, no 4, 2022 | doi: 10.5365/wpsar.2022.13.4.894https://ojs.wpro.who.int/ 9 prevalence and risk factors for hpv among fsws in viet nampham et al in estimating hpv prevalence among fsws. second, our study cohort was older than previous cohorts and most participants were from venue-based work locations, which may not reflect the true hpv prevalence among the fsw population in viet nam. however, our cohort may be more representative of persistent hpv infection and risk of cervical cancer. third, our cohort was selected as they were willing to speak with non-government organizations (ngos) and public health officials. since data were incomplete on the response rate among potential participants, the degree to which they were interested in participating in this study is unknown. hence, findings from this study should be interpreted with caution. fourth, self-reporting during face-to-face interviews could limit the reliability of information on sexual risk behaviours and drug use. fifth, our study did not record the vaccination status of fsws. some may have been vaccinated because of other research studies or small pilot vaccination programmes, thus directly or indirectly protecting them from hpv-16 and -18 infection. lastly, the small number of fsws with high-grade squamous intraepithelial lesions or cervical cancer limited our ability to identify their association with hpv infection. conclusions we found high prevalence of high-risk hpv infection among fsws in hanoi and hcmc, highlighting the need for a targeted hpv prevention campaign. we recommend hpv prevention strategies such as screening every 5–10 years from age 25 as previously described by who30 and hpv vaccination targeting this vulnerable group of women. these strategies will protect fsws from hpvassociated diseases including cervical cancer, and also help to reduce hpv transmission within the community and the overall cervical cancer burden in viet nam and other lmics with similar settings. acknowledgements we thank the study participants for their involvement. we also thank the study staff from the hiv/aids departments, centers for disease control and prevention in hanoi and hcmc for their help in this study. we also thank hannah shilling and steph atchison from the who labnet (western pacific region) and the department of obstetrics and gynaecology, university of melbourne, australia, for conducting the assay validation. screening and treating from age 30, with regular screening every 5–10 years.30 for high-risk women, such as fsws or those infected with hiv, hpv screening may need to start earlier.31 hpv-52 was the most prevalent hpv type among fsws in our cohort, consistent with previous studies of fsws in viet nam.13,14 hpv-58 and hpv-66 were the second and third most prevalent types in our cohort. both hpv-52 and -58 are included in the nonavalent hpv vaccine, while limited cross-protection against these types has been shown from both the bivalent and quadrivalent vaccines.32 this suggests that the nonavalent vaccine may be more appropriate for this high-risk group. hpv vaccination is recommended for individuals before sexual debut, as the vaccines do not clear existing hpv infection,33 although there may still be benefits to women with existing hpv infection, including fsws.34 these benefits include protection against re-infection and infection with other hpv types, reducing their overall risk of hpv-associated diseases such as cervical cancer, as well as preventing transmission within the community.34 fsws who reported consuming drugs or having given birth were less likely to be infected with high-risk hpv; however, these results need to be interpreted with caution. those who had given birth were almost a decade older than those who had not (median age 38 versus 29 years, respectively), and fsws who consumed drugs had fewer sexual partners than those who reported no drug use (median 8 versus 10 partners per month, respectively). a review on stis among fsws reported an increased risk of infection among drug-using fsws, possibly due to limited access to health care.35 furthermore, strict anti-drug laws in viet nam discourage disclosing drug consumption among this already vulnerable population, which may have introduced misclassification which could bias the association. our study has several limitations. first, we only recruited fsws from two main cities in viet nam, and the prevalence of high-risk hpv was lower than expected. therefore, caution must be taken in generalizing these findings to the entire population of fsws in the country. the non-random selection of survey districts in the two cities may have an unweighted procedure for prevalence and characteristics of the fsw population due to the shortage of data on size estimates, leading to additional biases wpsar vol 13, no 4, 2022 | doi: 10.5365/wpsar.2022.13.4.894 https://ojs.wpro.who.int/10 pham et alprevalence and risk factors for hpv among fsws in viet nam 7. national action plan on prevention and control of cervical cancer 2016–2025. hanoi: viet nam ministry of health; 2016 [in vietnamese]. available from: http://mch.moh.gov.vn/van-ban/ van-ban-phap-quy/van-banbieu-mau/-ke-hoach-hanh-dongquoc-gia-ve-du-phong-va-kiem-soat-ung-thu-co-tu-cung-giaidoan-2016-2025-804.html, accessed 10 december 2021. 8. pham t, bui l, kim g, hoang d, tran t, hoang m. cancers in vietnam-burden and control efforts: a narrative scoping review. cancer control. 2019;26(1):1073274819863802. doi:10.1177/1073274819863802 pmid:31319695 9. human papillomavirus (hpv) and cervical cancer. geneva: world health organization; 2019. available from: https://www.who.int/ news-room/fact-sheets/detail/cervical-cancer, accessed 29 april 2022. 10. dempsey af. human papillomavirus: the usefulness of risk factors in determining who should get vaccinated. rev obstet gynecol. 2008;1(3):122–8. pmid:19015763 11. johnson am, mercer ch, beddows s, de silva n, desai s, howell-jones r, et al. epidemiology of, and behavioural risk factors for, sexually transmitted human papillomavirus infection in men and women in britain. sex transm infect. 2012;88(3):212–7. doi:10.1136/sextrans-2011-050306 pmid:22261135 12. jia h, wang x, long z, li l. human papillomavirus infection and cervical dysplasia in female sex workers in northeast china: an observational study. bmc public health. 2015;15:695. doi:10.1186/ s12889-015-2066-x pmid:26202513 13. hoang ht, ishizaki a, nguyen ch, tran vt, matsushita k, saikawa k, et al. infection with high-risk hpv types among female sex workers in northern vietnam. j med virol. 2013;85(2):288–94. doi:10.1002/jmv.23456 pmid:23161344 14. hernandez by, vu nguyen t. cervical human papillomavirus infection among female sex workers in southern vietnam. infect agent cancer. 2008;3:7. doi:10.1186/1750-9378-3-7 pmid:18433504 15. le g, khuu n, tieu vtt, nguyen pd, luong hty, pham qd, et al. population size estimation of venue-based female sex workers in ho chi minh city, vietnam: capture-recapture exercise. jmir public health surveill. 2019;5(1):e10906. doi:10.2196/10906 pmid:30694204 16. solomon d, davey d, kurman r, moriarty a, o’connor d, prey m, et al. the 2001 bethesda system: terminology for reporting results of cervical cytology. jama. 2002;287(16):2114–9. doi:10.1001/ jama.287.16.2114 pmid:11966386 17. human papillomavirus laboratory manual, 1st ed., 2009. geneva: world health organization; 2010. available from: https://apps.who. int/iris/handle/10665/70505, accessed 29 april 2022. 18. tuan la, prem k, pham qd, toh zq, tran hp, nguyen pd, et al. anal human papillomavirus prevalence and risk factors among men who have sex with men in vietnam. int j infect dis. 2021;112:136–43. doi:10.1016/j.ijid.2021.09.016 pmid:34517047 19. van sn, khac mn, dimberg j, matussek a, henningsson aj. prevalence of cervical infection and genotype distribution of human papilloma virus among females in da nang, vietnam. anticancer res. 2017;37(3):1243–7. doi:10.21873/anticanres.11440 pmid:28314288 20. vu l, le h, luong o, tran h, nguyen n, luu h. prevalence of cervical human papillomavirus infection among married women in hanoi, vietnam, 2010. asia pac j public health. 2012;24(2):385– 90. doi:10.1177/1010539510393727 pmid:21362673 21. vu lt, bui d, le ht. prevalence of cervical infection with hpv type 16 and 18 in vietnam: implications for vaccine campaign. bmc cancer. 2013;13:53. doi:10.1186/1471-2407-13-53 pmid:23374877 conflicts of interest suzanne m. garland has received grants through her institution from merck and has delivered lectures and received speaking fees from msd for work performed in her personal time. all other authors report no conflicts of interest. ethics approval the study protocol was reviewed and approved by both local and international review boards of the national institute of hygiene and epidemiology, viet nam (reference number: irb-vn01057-13/2017) and the ethics board of the london school of hygiene and tropical medicine (reference number: 14207). data availability statement the data that support this study will be shared upon reasonable request to the corresponding author. funding this work was supported by the uk medical research council and the vietnamese ministry of science and technology as part of the uk-vietnam research collaboration (newton fund), project number hnqt/spdp/03.16. references 1. bray f, ferlay j, soerjomataram i, siegel rl, torre la, jemal a. global cancer statistics 2018: globocan estimates of incidence and mortality worldwide for 36 cancers in 185 countries. ca cancer j clin. 2018;68(6):394–424. doi:10.3322/caac.21492 pmid:30207593 2. toh zq, licciardi pv, russell fm, garland sm, batmunkh t, mulholland ek. cervical cancer prevention through hpv vaccination in lowand middle-income countries in asia. asian pac j cancer prev. 2017;18(9):2339–43. doi:10.22034/apjcp.2017.18.9.2339 pmid:28950675 3. global strategy to accelerate the elimination of cervical cancer as a public health problem. geneva: world health organization; 2020. available from: https://www.who.int/publications/i/ item/9789240014107, accessed 10 december 2021. 4. li j, lai s, gao gf, shi w. the emergence, genomic diversity and global spread of sars-cov-2. nature. 2021;600:408–18. doi:10.1038/s41586-021-04188-6 pmid:34880490 5. tran kn, park y, kim bw, oh j-k, ki m. incidence and mortality of cervical cancer in vietnam and korea (1999–2017). epidemiol health. 2020;42:e2020075. doi:10.4178/epih.e2020075 pmid:33332935 6. national strategy for the prevention and control of noncommunicable diseases 2015-2025. hanoi: viet nam ministry of health; 2015 [in vietnamese]. available from: http://vncdc.gov.vn/files/ document/2016/4/chien-luoc-quoc-gia-phong-chong-benh-khonglay-nhiem.pdf, accessed 10 december 2021. wpsar vol 13, no 4, 2022 | doi: 10.5365/wpsar.2022.13.4.894https://ojs.wpro.who.int/ 11 prevalence and risk factors for hpv among fsws in viet nampham et al 29. le tt, nguyen qc, tran ht, schwandt m, lim hj. correlates of hiv infection among street-based and venue-based sex workers in vietnam. int j std aids. 2016;27(12):1093–103. doi:10.1177/0956462415608556 pmid:26424161 30. who guideline for screening and treatment of cervical pre-cancer lesions for cervical cancer prevention, second edition: web annex a: syntheses of evidence. geneva: world health organization; 2021. available from: https://www.who.int/publications/i/ item/9789240030824, accessed 1 december 2021. 31. comprehensive cervical cancer control: a guide to essential practice, 2nd ed. geneva: world health organization; 2014. available from: https:// apps.who.int/iris/bitstream/handle/10665/144785/9789241548953_ eng.pdf, accessed 28 april 2022. 32. malagon t, drolet m, boily mc, franco el, jit m, brisson j, et al. cross-protective efficacy of two human papillomavirus vaccines: a systematic review and meta-analysis. lancet infect dis. 2012;12(10):781–9. doi:10.1016/s1473-3099(12)70187-1 pmid:22920953 33. hildesheim a, herrero r, wacholder s, rodriguez ac, solomon d, bratti mc, et al. effect of human papillomavirus 16/18 l1 viruslike particle vaccine among young women with preexisting infection: a randomized trial. jama. 2007;298(7):743–53. doi:10.1001/ jama.298.7.743 pmid:17699008 34. schim van der loeff mf, vorsters a, marra e, van damme p, hogewoning a. should female sex workers be offered hpv vaccination? hum vaccin immunother. 2019;15(7–8):1544–8. doi:10.108 0/21645515.2019.1602432 pmid:31063078 35. cwikel jg, lazer t, press f, lazer s. sexually transmissible infections among female sex workers: an international review with an emphasis on hard-to-access populations. sex health. 2008;5(1):9– 16. doi:10.1071/sh07024 pmid:18361849 22. pham th, nguyen th, herrero r, vaccarella s, smith js, nguyen thuy tt, et al. human papillomavirus infection among women in south and north vietnam. int j cancer. 2003;104(2):213– 20. doi:10.1002/ijc.10936 pmid:12569577 23. miyashita m, agdamag dm, sasagawa t, matsushita k, salud lm, salud co, et al. high-risk hpv types in lesions of the uterine cervix of female commercial sex workers in the philippines. j med virol. 2009;81(3):545–51. doi:10.1002/jmv.21416 pmid:19152419 24. matsushita k, sasagawa t, miyashita m, ishizaki a, morishita a, hosaka n, et al. oral and cervical human papillomavirus infection among female sex workers in japan. jpn j infect dis. 2011;64(1):34–9. pmid:21266753 25. choi bs, kim o, park ms, kim ks, jeong jk, lee js. genital human papillomavirus genotyping by hpv oligonucleotide microarray in korean commercial sex workers. j med virol. 2003;71(3):440– 5. doi:10.1002/jmv.10498 pmid:12966552 26. tideman rl, thompson c, rose b, gilmour s, marks c, van beek i, et al. cervical human papillomavirus infections in commercial sex workers-risk factors and behaviours. int j std aids. 2003;14(12):840–7. doi:10.1258/095646203322556192 pmid:14678594 27. vietnam authority for hiv/aids control. report on implementation results in 2021 of the global fund supported project on hiv/aids in vietnam and the implementation plan for 2022 [in vietnamese]. nha trang: annual workshop [presentation]; march 2022. 28. nadol p, hoang tv, le lv, nguyen ta, kaldor j, law m. high hiv prevalence and risk among male clients of female sex workers in hanoi and ho chi minh city, vietnam. aids behav. 2017;21(8):2381–93. doi:10.1007/s10461-017-1751-4 pmid:28324199 https://ojs.wpro.who.int/ 1wpsar vol 12, no 2, 2021 | doi: 10.5365/wpsar.2020.11.4.001 original research c oronavirus disease 2019 (covid-19) presents an enormous challenge to public health. by 18 april 2020, 140 million cases had been reported across 222 countries and areas, with an estimate of 3 million people having died.1 the overwhelming attention placed on covid-19 and the volume of research published in the early months of this pandemic (over 4100 papers in pubmed to the end of april 2020) create challenges for public health responders attempting to understand the epidemiology of this disease. there is a need to distil and synthesize the findings that are most relevant to inform public health interventions. estimates of the transmission parameters of a pathogen are required as soon as practicable, to inform the public health response. with known pathogens, public health responders can use data and estimates from previous outbreaks to make evidence-based decisions. however, with an emerging pathogen, such as severe acute respiratory syndrome coronavirus 2 (sarscov-2), past outbreaks may provide limited utility; hence, epidemic parameters must be estimated from early cases and detected transmission events. a successful outbreak response is informed by rapid data collection and analysis, to understand the dynamics of disease spread and identify appropriate, informed interventions. understanding disease transmission of a new pathogen requires knowledge of the incubation period, serial interval and reproduction number. the basic reproduction number is the expected or average number of secondary cases that result from one infected person if no individuals in the population are immune to the pathogen and no measures are in place to reduce spread. in practice, pathogens rarely propagate freely through a population because individuals change their behaviour or governments enact public health interventions. the effective reproduction number is the expected or average number of secondary cases in a population where some individuals are immune or interventions to limit spread are in place. a national centre for epidemiology and population health, australian national university, canberra, australian capital territory, australia. published: 11 may 2021 doi: 10.5365/wpsar.2020.11.4.001 early reports of epidemiological parameters of the covid-19 pandemic keeley allen,a amy elizabeth parrya and kathryn glassa correspondence to keeley allen (email: keeley.allen@anu.edu.au) background: the emergence of a new pathogen requires a rapid assessment of its transmissibility, to inform appropriate public health interventions. methods: the peer-reviewed literature published between 1 january and 30 april 2020 on covid-19 in pubmed was searched. estimates of the incubation period, serial interval and reproduction number for covid-19 were obtained and compared. results: a total of 86 studies met the inclusion criteria. of these, 33 estimated the mean incubation period (4–7 days) and 15 included estimates of the serial interval (mean 4–8 days; median length 4–5 days). fifty-two studies estimated the reproduction number. although reproduction number estimates ranged from 0.3 to 14.8, in 33 studies (63%), they fell between 2 and 3. discussion: studies calculating the incubation period and effective reproduction number were published from the beginning of the pandemic until the end of the study period (30 april 2020); however, most of the studies calculating the serial interval were published in april 2020. the calculated incubation period was similar over the study period and in different settings, whereas estimates of the serial interval and effective reproduction number were setting-specific. estimates of the serial interval were shorter at the end of the study period as increasing evidence of pre-symptomatic transmission was documented and as jurisdictions enacted outbreak control measures. estimates of the effective reproduction number varied with the setting and the underlying model assumptions. early analysis of epidemic parameters provides vital information to inform the outbreak response. wpsar vol 12, no 2, 2021 | doi: 10.5365/wpsar.2020.11.3.011 https://ojs.wpro.who.int/2 allen et alearly reports of epidemiological parameters of the covid-19 pandemic and potentially not modifying their behaviour, this study refers to all estimates of the reproduction number as the effective reproduction number. we searched peer-reviewed published research articles from pubmed using the terms “coronavirus” and “novel” or “new” or “covid” or “wuhan” or “ncp” or “ncov” for articles published online until 30 april 2020. the literature search ran from 24 february 2020 to 12 may 2020. all articles were imported to zotero 5.0.87 for review. eligible articles were reviewed for date of online publication, study period, sample size, setting, method of calculating epidemic parameters, assumptions used to inform these calculations and output measures (including the approach to estimating uncertainty). studies were included in this review if they reported estimates of at least one of the relevant epidemic parameters and were written in english. any articles published before 1 november 2019, pre-prints, grey literature and case reports were excluded. ethics and permissions ethical approval was not sought for this review of existing, publicly available peer-reviewed literature. results the pubmed search returned 4426 articles published online up to 30 april 2020. of these articles, 3581 were excluded at the screening assessment and a further 759 at the eligibility assessment, giving a total of 86 included studies. the results of the search and eligibility assessment are shown in fig. 1. of the 86 included studies, 15 calculated more than one epidemic parameter of interest. sixty of the 86 studies used data from mainland china for part or all of their analysis, and 11 specifically analysed outbreak data from hubei province or the city of wuhan. incubation period a total of 33 studies estimated the incubation period of covid-19 (table 1). mean estimates were reported in 15 studies, ranging from 1.8 to 9.9 days; however, 44% of the mean estimates were 5–6 days. the shortest mean estimate (incubation period = 1.8 days) was calculated the distribution of the incubation period is crucial for determining the length of quarantine for potentially exposed individuals and travellers.2–4 estimates of the serial interval provide public health responders with an idea of the time available to identify and isolate potential cases before they can spread the disease to others.5,6 the reproduction number of a disease provides a population-wide estimate of the scale of a potential outbreak and a baseline to test the effectiveness of different interventions in limiting disease transmission.7–9 although highly influential, early estimates of the incubation period, serial interval and reproduction number are generally based on small sample sizes that may not be representative of the wider population at risk.7,9,10 although some literature reviews have reviewed the epidemiology of covid-19,11–14 they have not collated the estimates of epidemic parameters from the initial period of the covid-19 pandemic. the aim of this study was to collate and compare the characteristics of the covid-19 pandemic up to 30 april 2020. methods studies that describe or estimate the epidemic characteristics of the covid-19 pandemic until 30 april 2020 were collected. epidemiological parameters were limited to the incubation period, the serial interval and the reproduction number. the incubation period is the length of time experienced by an individual case from the point of infection to the start of symptom onset. the serial interval refers to the mean length of time between successive cases in a chain of transmission, measured as the length of time from symptom onset in a primary case to symptom onset in a secondary case. both the incubation period and serial interval in this analysis are measured in days. over the course of the covid-19 pandemic so far, governments have enacted public health interventions at different times and to different extents. individual behaviours have changed at different rates as individuals have learned about covid-19 and responded to media reports, government messaging and their understanding of risk. several estimates of the reproduction number overlap periods when governments have enacted significant public health interventions. although this study focuses on estimates from the early stages of the outbreak, when most of the population were susceptible wpsar vol 12, no 2, 2021 | doi: 10.5365/wpsar.2020.11.3.011https://ojs.wpro.who.int/ 3 early reports of epidemiological parameters of the covid-19 pandemicallen et al from returned travellers from hubei province in china, using their last day of travel as their date of exposure.29 one study’s mean estimate of 9.9 days was calculated from a series of 14 cases in viet nam.33 a further 22 estimates of the incubation period were summarized by their median. these studies were generally reporting on a specific cluster or outbreak investigation, and median estimates largely ranged from 4 to 7 days. estimates outside of this range were calculated from case series; for example, a median range of 1–4 days was found among eight participants39 and an estimated 8-day incubation period for a study involving 19 participants.27 the distribution of the mean and median incubation estimates by sample size of the study is shown in fig. 2. a further three studies only included a range of observed incubation periods. the longest incubation period from these studies was 16 days, recorded in an outbreak investigation in mainland china.36 additional estimates of the 95th percentile of the incubation period ranged from 10.3 days (95% confidence interval [ci]: 8.6–14.1)17 to 14 days (95% ci: 12.2–15.9).47 fig. 1. preferred reporting items for systematic reviews and meta-analysis diagram of study selection reasons for exclusion at screening assessment • articles focused on diagnostics (n = 406) • articles focused on therapeutics (n = 636) • articles report laboratory studies (n = 330) • articles are not peer-reviewed (n = 13) • articles are not in english (n = 141) • articles focused on emergency and health-care management (n = 686) • articles are not related to covid-19 (n = 228) • case reports (n = 165) • articles report guidelines or consensus statements (n = 177) • editorials, commentaries or letters (n = 616) • review articles (n = 158) • articles focused on covid-19 in animals (n = 25) reasons for exclusion at eligibility assessment • articles focused on diagnostics (n = 47) • articles focused on therapeutics (n = 11) • articles report laboratory studies (n = 35) • articles are not peer-reviewed (n = 9) • articles are not in english (n = 35) • articles focused on emergency and health-care management (n = 67) • articles are not related to covid-19 (n = 11) • case reports (n = 41) • articles report guidelines or consensus statements (n = 1) • editorials, commentaries or letters (n = 117) • review articles (n = 109) • articles focused on covid-19 in animals (n = 1) • epidemiological studies that do not contain relevant parameters (n = 275) id en ti fi ed s cr ee n in g e lig ib ili ty in cl u d ed records identified through pubmed search (n = 4426) records screened (n = 4426) records excluded (n = 3581) full-text articles assessed for eligibility (n = 845) full-text articles excluded, with reasons (n = 759) studies included in the qualitative analysis (n = 86) wpsar vol 12, no 2, 2021 | doi: 10.5365/wpsar.2020.11.3.011 https://ojs.wpro.who.int/4 allen et alearly reports of epidemiological parameters of the covid-19 pandemic study authors online publication date study period sample size setting estimate (days)* uncertainty estimate (days) uncertainty measure chan et al.15 24 january 2020 26 december 2019 –15 january 2020 5 mainland china 3–6 range li et al.16 29 january 2020 up to 22 january 2020 10 wuhan/hubei 5.2 4.1–7.0 95% ci backer, klinkenberg and wallinga17 6 february 2020 20 january 2020 –28 january 2020 88 international 6.4 5.6–7.7 95% cri ki and task force for 2019-ncov18 9 february 2020 20 january 2020 –8 february 2020 28 republic of korea 3.9; [3.0] 0–15 range jiang, rayner and luo19 13 february 2020 up to 8 february 2020 50 mainland china 4.9 4.4–5.5 95% ci linton et al.20 17 february 2020 17 december 2019 –31 january 2020 158 international 5.6; [4.6] 4.4–7.4; 3.7–5.7 95% cri xu et al.21 19 february 2020 10 january 2020 –26 january 2020 56 mainland china [4] 3–5 iqr tian et al.22 27 february 2020 20 january 2020 –10 february 2020 203 mainland china [6.7] ± 5.2 sd cai et al.23 28 february 2020 19 january 2020 –3 february 2020 10 mainland china 6.5 2–10 range guan et al.24 28 february 2020 up to 23 january 2020 291 mainland china [4] 2–7 iqr liu et al.25 3 march 2020 1 january 2020 –5 february 2020 58 mainland china 6.0; [5.0] 3–8; 1–16 iqr; range lauer et al.26 10 march 2020 4 january 2020 –24 february 2020 181 international [5.1] 4.5–5.8 95% ci zhao et al.27 12 march 2020 23 january 2020 –5 february 2020 19 mainland china [8] 6–11 iqr pung et al.28 16 march 2020 18 january 2020 –10 february 2020 17 singapore [4] 3–6; 1–11 iqr; range leung29 18 march 2020 20 january 2020 –12 february 2020 105 mainland china (travelled to hubei) 1.8 1.0–2.7 95% ci 70 mainland china (local transmission) 7.2 6.1–8.4 95% ci chang et al.30 23 march 2020 28 january 2020 –9 february 2020 15 mainland china [5] 1–6 range jin et al.31 24 march 2020 17 january 2020 –8 february 2020 21 mainland china – gi symptoms [4] 3–7 iqr 195 mainland china – no gi symptoms [5] 3–8 iqr zhang et al.32 2 april 2020 19 january 2020 –17 february 2020 49 mainland china 5.2 1.8–12.4 95% ci le et al.33 2 april 2020 17 january 2020 –14 february 2020 12 viet nam 9.9 ± 5.2 sd zhu and chen34 2 april 2020 1 december 2019 –23 january 2020 not specified mainland china, hong kong (sar) china, macau (sar) china, taiwan (china) 5.67 1–14 range table 1. estimated incubation period of covid-19 from included epidemiological parameters studies published between 1 january and 30 april 2020 wpsar vol 12, no 2, 2021 | doi: 10.5365/wpsar.2020.11.3.011https://ojs.wpro.who.int/ 5 early reports of epidemiological parameters of the covid-19 pandemicallen et al *mean estimates. median estimates are shown in [square brackets]. multiple estimates of incubation period for the same population within the same study are shown in the same row and separated by a semicolon. estimates of the incubation period in the same study for different populations are shown in separate rows. ci: confidence interval; cri: credible interval; gi: gastrointestinal; iqr: interquartile range; sd: standard deviation. notes: sample size reported in table 1 is the sample size used to calculate the incubation period, not necessarily the whole study sample. all estimates are reported to one decimal place, except where stating findings from papers that did not provide that level of precision. study authors online publication date study period sample size setting estimate (days)* uncertainty estimate (days) uncertainty measure han et al.35 6 april 2020 31 january 2020 –16 february 2020 25 mainland china – adults [5] 3–12 range 7 mainland china – children [4] 2–12 range shen et al.36 7 april 2020 8 january 2020 –26 february 2020 6 mainland china [7.5] 1–16 range sanche et al.37 7 april 2020 15 january 2020 –30 january 2020 24 mainland china 4.2 3.5–5.1 95% ci ghinai et al.38 8 april 2020 february–march 2020 15 united states of america 4.3; [4] 1–7 range huang et al.39 10 april 2020 23 january 2020 –20 february 2020 8 mainland china [2] 1–4 range zheng et al.40 10 april 2020 17 january 2020 –7 february 2020 161 mainland china [6] 3–8 range xia et al.41 12 april 2020 23 january 2020 –18 february 2020 10 china incl. hong kong (sar) china, macau (sar) china, taiwan (china) 7.0 ± 2.59; 2–14 sd; range chen et al.42 14 april 2020 28 january 2020 –11 february 2020 12 mainland china 8.0 1–13 range song et al.43 23 april 2020 16 january 2020 –29 january 2020 22 mainland china 2–13 range jiang et al.44 23 april 2020 23 january 2020 –13 february 2020 4 mainland china 9–13 range nie et al.45 27 april 2020 19 january 2020 –8 february 2020 2907 mainland china [5] 2–8 iqr yu et al.46 29 april 2020 up to 19 february 2020 132 mainland china [7.2] 6.4–7.9 95% ci bi et al.47 30 april 2020 14 january 2020 –12 february 2020 138 mainland china [4.8] 4.2–5.4 95% ci serial interval of the 15 studies that included a serial interval, eight were published in april 2020. mean serial interval estimates were calculated in 14 studies and ranged from 3.1 to 7.5 days (table 2). the estimated serial intervals were longer in studies published at the start than at the end of the study period, with a mean interval of 7.5 days in late january 2020 and a mean of 4–5 days in early march 2020. estimates published from march 2020 onwards included transmission pairs with negative serial intervals, or intervals shorter than the incubation period, suggesting possible pre-symptomatic transmission. mean estimates of the serial interval that included negative transmission pairs generally ranged from 3.9 to 5.8 days (table 2). the four median serial interval estimates ranged from 1.0 to 5.4 days. excluding the estimate of 2 days from a case series of eight cases,39 the median serial interval ranged from 4.0 to 5.4 days (table 2). reproduction number there were 90 estimates of the reproduction number from 52 studies across three world health organization (who) regions: western pacific region, european region and region of the americas. reproduction number estimates ranged from 0.3 to 14.8. of the 90 reported wpsar vol 12, no 2, 2021 | doi: 10.5365/wpsar.2020.11.3.011 https://ojs.wpro.who.int/6 allen et alearly reports of epidemiological parameters of the covid-19 pandemic discussion this study provides a review of estimated epidemic parameters of the covid-19 outbreak up to 30 april 2020. estimates of the incubation period were similar across the study period, with a mean estimated value of 5–6 days and a range of 2–14 days. estimates of the serial interval shortened over the study period, from 7.5 days in late january 2020 to a mean of 4–5 days in early march 2020. estimates of the reproduction number varied in the studies collated up to 30 april 2020. although some estimates of the reproduction number were as high as 14.8, over half were between 2 and 4. the higher estimates demonstrate the impact of the setting, individual behaviours and public health interventions – the highest estimates were associated with cruise ships,64,67,68 whereas the lowest estimates were generally calculated in areas with a rapid response to an outbreak.18,55,74,78 the incubation period reflects the growth of a virus in an individual, and thus is largely a biological function that would not be expected to vary with changes in human behaviour and wider public health interventions. variations in the incubation period reported in this study estimates, 33 estimates (37%) were between 2 and 3, and 20 estimates (22%) were between 3 and 4 (table 3). the initial low estimate of 0.3 relied on the early assumption that the pathogen was primarily spread through zoonotic transmission.56 other estimates of the reproduction number under 1 were reported in jurisdictions with rapid public health interventions during the study period, including the republic of korea and singapore.18,55,74 the highest reproduction number estimate (14.8) was from analyses of transmission dynamics onboard the diamond princess cruise ship.67 the distribution of reproduction number estimates by the assumed serial interval is shown in fig. 3. just over half (n = 50) of the 90 reproduction number results used an estimate of the serial interval to calculate the reproduction number. serial interval estimates used to estimate the reproduction number ranged from 449 to 10 days, with the latter taken from the estimated serial interval for severe acute respiratory syndrome (sars) in early outbreaks.100 studies generally applied serial intervals from the earliest covid-19 estimate of 7.5 days16 and the accepted serial interval of sars of 8.4 days.100 note: the confidence intervals (cis) of estimates are not shown in the figure. cis are reported in table 1. the estimate from nie et al.45 of a median of 5 days is not shown because the sample size (n = 2907) is significantly larger than other studies. fig. 2. incubation period estimates and sample size of study (n = 28 studies, 35 estimates) published between 1 january and 30 april 2020 0 2 4 6 8 10 12 0 50 100 150 200 250 300 350 in cu b at io n p er io d ( d ay s) sample size incubation period estimates and sample size of study (n = 28 studies, 35 estimates) in cu ba ti on p er io d (d ay s) sample size wpsar vol 12, no 2, 2021 | doi: 10.5365/wpsar.2020.11.3.011https://ojs.wpro.who.int/ 7 early reports of epidemiological parameters of the covid-19 pandemicallen et al *mean estimates. median estimates are shown in [square brackets]. multiple estimates of serial interval for the same population within the same study are shown in the same row and separated by a semicolon. estimates of the serial interval in the same study for different populations are shown in separate rows. bci: bayesian confidence interval; ci: confidence interval; cri: credible interval; sd: standard deviation. notes: sample size reported is the sample size used to calculate the serial interval, not necessarily the whole study sample. all estimates are reported to one decimal place, except where stating findings from papers that did not provide that level of precision. table 2. estimated serial interval from included covid-19 epidemiological parameters studies published between 1 january and 30 april 2020 study authors online publication date study period sample size transmission pairs setting estimate (days)* uncertainty estimate (days) uncertainty measure li et al.16 29 january 2020 up to 22 january 2020 10 6 wuhan/hubei 7.5 5.3–19.0 95% ci ki and task force for 2019-ncov18 9 february 2020 20 january 2020 –8 february 2020 28 12 republic of korea 6.6; [4.0] 3–15 range liu et al.25 3 march 2020 1 january 2020 –5 february 2020 15 single intracluster transmission cases 12 clusters mainland china 5.5 56 single co-exposure cases 56 clusters mainland china 3.1 nishiura et al.48 4 march 2020 up to 12 february 2020 not specified 28 – all pairs international [4.0] 3.1–4.9 95% cri 18 – most certain pairs international [4.6] 3.5–5.9 95% cri pung et al.28 16 march 2020 up to 15 february 2020 4 3 singapore 3–8 range du et al.49 19 march 2020 21 january 2020 –8 february 2020 752 468 mainland china 4.0 3.5–4.4 95% ci wu et al.50 19 march 2020 1 december 2019 –28 february 2020 not specified 43 international 7 5.8–8.1 95% ci zhang et al.32 2 april 2020 19 january 2020 –17 february 2020 63 35 mainland china 5.1 3.1–11.6 95% ci ji et al.51 7 april 2020 23 january 2020 –27 march 2020 51 32 wuhan/hubei 6.5 6.3 sd huang et al.39 10 april 2020 23 january 2020 –20 february 2020 9 8 mainland china [1] 0–4 range wang et al.52 10 april 2020 11 january 2020 –16 february 2020 115 85 wuhan/hubei 5.5 ± 2.7 sd he et al.53 15 april 2020 7 january 2020 –4 march 2020 not specified 77 international 5.8; [5.2] 4.8–6.8; 4.1–6.4 95% ci kwok et al.54 23 april 2020 23 january 2020 –13 february 2020 38 26 hong kong (sar) china 4.6 3.4–5.9 95% bci 26 – adjusted for right truncation hong kong (sar) china 4.8 3.5–6.9 95% cri bi et al.47 27 april 2020 14 january 2020 –12 february 2020 not specified 48 mainland china 6.3; [5.4] 5.2–7.6; 4.4–6.5 95% ci ganyani et al.55 30 april 2020 14 january 2020 –27 february 2020 54 4 clusters singapore 5.2 –3.4–13.9 95% cri 114 16 clusters mainland china 3.9 –4.5–12.5 95% cri wpsar vol 12, no 2, 2021 | doi: 10.5365/wpsar.2020.11.3.011 https://ojs.wpro.who.int/8 allen et alearly reports of epidemiological parameters of the covid-19 pandemic table 3. estimated reproduction number from included covid-19 epidemiological parameters studies published between 1 january and 30 april 2020 study authors online publication date study period sample size method setting estimate uncertainty interval uncertainty measure wu et al.56 23 january 2020 10 january 2020 –12 january 2020 41 zoonotic transmission – cauchemez et al. 2013111 wuhan/ hubei 0.3 0.17–0.44 95% ci li et al.16 29 january 2020 up to 22 january 2020 425 transmission model with renewal equations wuhan/ hubei 2.2 1.4–3.9 95% ci riou and althaus57 30 january 2020 up to 18 january 2020 50 stochastic transmission model wuhan/ hubei 2.2 1.4–3.8 90% hdi zhao et al.58 30 january 2020 10 january 2020 –24 january 2020 2033 exponential growth model method mainland china 2.24 –3.58 1.96–2.55 to 2.89– 4.39 95% ci wu et al.59 31 january 2020 1 december 2019 –28 january 2020 55 differential equation – seir compartment model international 2.68 2.47–2.86 95% cri zhao et al.60 1 february 2020 1 december 2019 –24 january 2020 41 exponential growth model method mainland china 2.56 2.49–2.63 95% ci tang et al.61 7 february 2020 10 january 2020 –15 january 2020 41 differential equation – seir compartment model mainland china 6.47 5.71–7.23 95% ci ki and task force for 2019ncov18 9 february 2020 20 january 2020 – 8 february 2020 26 estimated from transmission chains republic of korea 0.48 0.25–0.84 95% ci zhou et al.62 12 february 2020 up to 25 january 2020 2820 differential equation – seir compartment model mainland china 2.83–3.28 jung et al.63 14 february 2020 31 december 2019 –24 january 2020 92 exponential growth model method mainland china 2.1; 3.2 2.0–2.2; 2.7–3.7 95% ci zhang et al.64 22 february 2020 up to 16 february 2020 355 cori et al. methodology112 cruise ship 2.28 2.06–2.52 95% ci lai et al.65 25 february 2020 up to 4 february 2020 52 coalescent-based exponential growth and a birth-death skyline method mainland china 2.6 2.1–5.1 95% ci chen et al.66 28 february 2020 7 december 2019 –1 january 2020 not specified bats-hostsreservoir-people transmission network model wuhan/ hubei 3.58 rocklov, sjodin and wildersmith67 28 february 2020 21 january 2020 –19 february 2020 3700 differential equation – seir compartment model cruise ship 14.8 mizumoto and chowell68 29 february 2020 20 january 2020 –17 february 2020 3711 discrete time integral equation cruise ship 5.8 0.6–11.0 95% cri fang, nie and penny69 6 march 2020 20 january 2020 –29 february 2020 35 329 differential equation – seir compartment model mainland china 2.35–3.21 wpsar vol 12, no 2, 2021 | doi: 10.5365/wpsar.2020.11.3.011https://ojs.wpro.who.int/ 9 early reports of epidemiological parameters of the covid-19 pandemicallen et al study authors online publication date study period sample size method setting estimate uncertainty interval uncertainty measure zhou et al.70 10 march 2020 10 january 2020 –31 january 2020 44 differential equation – seir compartment model mainland china 5.3167 kucharski et al.71 11 march 2020 1 december 2019 –11 february 2020 not specified differential equation – seir compartment model wuhan/ hubei 2.35 1.15–4.77 95% ci yang and wang72 11 march 2020 23 january 2020 –10 february 2020 not specified differential equation – seir compartment model wuhan/ hubei 4.25 zhao and chen73 11 march 2020 20 january 2020 –30 january 2020 not specified differential equation – seir compartment model mainland china 4.7092 choi and ki74 12 march 2020 29 december 2019 –3 january 2020 not specified differential equation – seir compartment model wuhan/ hubei 4.028 4.010– 4.046 95% ci 20 january 2020 –17 february 2020 30 republic of korea 0.555 0.509– 0.602 95% ci kuniya75 13 march 2020 15 january 2020 –29 february 2020 239 differential equation – seir compartment model japan 2.6 2.4–2.8 95% ci remuzzi and remuzzi76 13 march 2020 19 february 2020 –8 march 2020 unclear exponential growth model method italy 2.76–3.25 li et al.77 16 march 2020 10 january 2020 –23 january 2020 801 differential equation – seir compartment model mainland china 2.38 2.03–2.77 95% cri shim et al.78 17 march 2020 20 january 2020 –26 february 2020 6284 generalized growth model republic of korea 1.5 1.4–1.6 95% ci du et al.49 19 march 2020 21 january 2020 –8 february 2020 752 not stated mainland china 1.32 1.16–1.48 95% ci wu et al.50 19 march 2020 1 december 2019 –28 february 2020 45 771 differential equation – seir compartment model wuhan/ hubei 1.94 1.83–2.06 95% cri yuan et al.79 28 march 2020 23 february 2020 –9 march 2020 not specified exponential growth model method; wallinga time dependent method italy 3.27; 3.10 3.17–3.38; 2.21–4.11 95% ci france 6.32; 6.56 5.72–6.99; 2.04–12.26 95% ci spain 5.08; 3.95 4.51–5.74; 0–10.19 95% ci germany 6.07; 4.43 5.51–6.69; 1.83–7.92 95% ci anastassopoulou et al.80 31 march 2020 11 january 2020 –10 february 2020 not specified differential equation – seir compartment model wuhan/ hubei 4.6 3.56–5.65 90% ci ferretti et al.81 31 march 2020 up to end march 2020 40 transmission pairs exponential growth model method mainland china 2 1.7–2.5 90% ci huang et al.82 31 march 2020 13 january 2020 –9 march 2020 80 754 differential equation – seir compartment model mainland china 2.23–2.51 wpsar vol 12, no 2, 2021 | doi: 10.5365/wpsar.2020.11.3.011 https://ojs.wpro.who.int/10 allen et alearly reports of epidemiological parameters of the covid-19 pandemic study authors online publication date study period sample size method setting estimate uncertainty interval uncertainty measure tian et al.83 31 march 2020 31 december 2019 –23 january 2020 not specified differential equation – seir compartment model mainland china 3.15 3.04–3.26 95% bci zhu and chen34 2 april 2020 1 december 2019 –23 january 2020 not specified poisson transmission model mainland china 2.47 2.39–2.55 95% ci sanche et al.37 7 april 2020 15 january 2020 –30 january 2020 140 differential equation – seir compartment model mainland china 5.7 3.8–8.9 95% ci zhao et al.84 8 april 2020 1 december 2019 –8 january 2020 not specified differential equation – seir compartment model wuhan/ hubei 2.5 2.4–2.7 95% ci pan, liu and wang85 10 april 2020 5 december 2019 –8 march 2020 32 583 cori et al. methodology112 wuhan/ hubei 3.82 3.72–3.93 95% cri abbott et al.86 14 april 2020 up to 25 january 2020 1975 stochastic branching process model mainland china 2.8–3.8 puci et al. 14 april 2020 22 march 2020 –29 march 2020 975 differential equation – seir compartment model italy 1.82 1.51–2.01 95% ci du et al.87 16 april 2020 1 december 2019 –22 january 2020 19 exponential growth method mainland china 1.9 1.47–2.59 95% cri torres-roman et al.88 17 april 2020 6 march 2020 –15 march 2020 not specified cori et al. methodology112 peru 2.97 tsang et al.89 20 april 2020 15 january 2020 –3 march 2020 not specified exponential growth model mainland china 2.8–3.5 muniz rodriguez et al.90 22 april 2020 19 february 2020 –19 march 2020 978 exponential growth model; renewal equations method islamic republic of iran 4.4; 3.5 3.9–4.9; 1.3–8.1 95% ci zhuang et al.91 22 april 2020 up to 5 march 2020 not specified stochastic model, maximum likelihood estimation approach italy 2.6; 3.3 2.3–2.9; 3.0–3.6 95% ci republic of korea 2.6; 3.2 2.3–2.9; 2.9–3.5 95% ci gatto et al.92 23 april 2020 24 february 2020 –23 march 2020 107 differential equation – seir compartment model italy 3.6 3.49–3.84 95% ci han et al.93 23 april 2020 21 january 2020 –15 february 2020 482 exponential growth model method mainland china 2.9 1.8–4.5 95% ci caicedo-ochoa et al.94 25 april 2020 up to 23 march 2020 (first 10 days after reaching 25 cases in each location) not specified cori et al. methodology112 two serial intervals used: 7.5 days; 4.7 days spain 6.48; 2.9 5.97–7.02; 2.67–3.14 95% cri italy 6.41; 2.83 6.11–6.71; 2.70–2.96 95% cri ecuador 12.86; 3.95 12.05–13.68; 3.70–4.21 95% cri panama 7.19; 3.67 6.37–8.08; 3.25–4.13 95% cri brazil 6.53; 2.91 5.85–7.25; 2.60–3.23 95% cri chile 5.79; 2.67 5.32–6.28; 2.45–2.89 95% cri colombia 5.65; 2.67 5.04–6.29; 2.38–2.98 95% cri peru 5.24; 2.36 4.68–5.83; 2.11–2.63 95% cri mexico 4.94; 2.42 4.37–5.56; 2.14–2.72 95% cri wpsar vol 12, no 2, 2021 | doi: 10.5365/wpsar.2020.11.3.011https://ojs.wpro.who.int/ 11 early reports of epidemiological parameters of the covid-19 pandemicallen et al study authors online publication date study period sample size method setting estimate uncertainty interval uncertainty measure bi et al.47 27 april 2020 14 january 2020 –12 february 2020 48 estimated from transmission chains mainland china 0.4 0.3–0.5 95% ci distante et al.95 27 april 2020 up to 29 march 2020 not specified exponential growth method italy 3.6 ndairou et al.96 27 april 2020 4 january 2020 –9 march 2020 not specified differential equation – seir compartment model wuhan/ hubei 0.945 peirlinck et al.97 27 april 2020 21 january 2020 –4 april 2020 311 357 differential equation – seir compartment model united states of america 5.3 ± 0.95 sd adegboye et al.98 28 april 2020 27 february 2020 –11 april 2020 318 cori et al. methodology112 nigeria 2.71 ganyani et al.55 30 april 2020 14 january 2020 –27 february 2020 91 exponential growth model method singapore 1.25 1.17–1.34 95% cri 135 exponential growth model method mainland china 1.41 1.26–1.58 95% cri ivorra et al.99 30 april 2020 1 december 2019 –29 march 2020 not specified differential equation – seir compartment model mainland china 4.2732 multiple estimates of the reproduction number for the same population within the same study are shown in the same row and separated by a semicolon. estimates of the incubation period in the same study for different populations are shown in separate rows. bci: bayesian confidence interval; ci: confidence interval; cri: credible interval; hdi: high density interval; sd: standard deviation; seir: susceptible-exposed-infected-recovered. notes: sample size reported is the sample size used to calculate the serial interval, not necessarily the whole study sample. all estimates are reported to the number of decimal places provided in each study. fig. 3. estimated reproduction number and serial interval of the model (n = 23 studies, 50 estimates) published between 1 january and 30 april 2020 0 2 4 6 8 10 12 14 16 0 2 4 6 8 10 12 es ti m at ed r ep ro d u ct io n n u m b er serial interval used in model (days) estimated reproduction number and serial interval of the model (n = 23 studies, 50 estimates) note: the confidence intervals (cis) of estimates are not shown in the figure. cis are reported in table 3. e st im at ed r ep ro du ct io n n um b er serial interval used in model (days) wpsar vol 12, no 2, 2021 | doi: 10.5365/wpsar.2020.11.3.011 https://ojs.wpro.who.int/12 allen et alearly reports of epidemiological parameters of the covid-19 pandemic and time periods. the reproduction number was estimated to be 2.2 in studies published in january and february 2020,16,57 but increased to 4 in articles published in march and april 2020.72,74,80 the epidemiological parameters reviewed share some similarities to that of sars and middle east respiratory syndrome (mers), two diseases caused by coronaviruses that have caused significant outbreaks in the early 21st century. the estimates of the range and mean of the incubation period of covid-19 are similar to that of sars (2–10 days, mean of 5–6 days)2,100,107 and mers (2–14 days, median of 5–6 days).107,108 however, the estimated serial interval for covid-19 is shorter than the observed intervals for sars (8.4 days)100 and mers (7.6–12.6 days).108,109 the later estimates of the covid-19 serial interval published in april 2020 are shorter than the estimates for the incubation period, suggesting the potential for pre-symptomatic transmission, which has not been observed for sars or mers.100,108,110 the estimated reproduction number of covid-19 is similar to the estimates for the 2002–2003 sars outbreak.100 this study has some important limitations. it provides a descriptive assessment and does not include meta-analysis or recalculations of results. the use of different methods and different outputs from each study limits the capacity for meta-analysis. this review may also be impaired by publication bias. several included studies were based on small sample sizes, which led to imprecise results. the ongoing pandemic requires the active involvement of public health researchers to assess unfolding situations and advise on local responses. fulfilling crucial roles as the pandemic unfolded may have limited the potential to publish findings, restricting our understanding of epidemic parameters in real time and reducing the representativeness of the results. this potential publication bias may also explain in part the overrepresentation of data from mainland china although covid-19 has led to outbreaks worldwide. nevertheless, the early published estimates included in this study have been used worldwide to inform public health responses, and they provide the best available evidence in the timeframe of this study. only studies written in english were included in this review. this excludes many early estimates writmay, in part, result from the study designs adopted. several estimates of the incubation period were reported directly from cluster investigations, often with low sample sizes. studies with more than 20 participants had less variation between estimates than studies with smaller sample sizes. the definition of exposure, including the potential for continuous exposure in a household, may also have influenced results by artificially lengthening or shortening the incubation period, depending on study design and differences in local epidemiological reporting protocols. the serial interval and reproduction number are likely to be influenced by public health interventions, social behaviours and political decisions. estimates of these two epidemic characteristics are therefore setting-specific, which may explain the variance across the results in this study. the serial interval estimates also changed as new information about the pathogen came to light, primarily the potential for pre-symptomatic and pauci-symptomatic transmission.101–106 however, these revised estimates of the serial interval were rarely used to revise reproduction number estimates. a longer serial interval results in a higher estimate of the reproduction number. the earliest published estimate by li et al.’s study (first published online on 29 january 2020)16 of six transmission pairs in wuhan was higher than most of the later estimates. that estimate was applied as an assumed serial interval in 10 studies published in march and april 2020,37,63–65,68,85,89,93–95 despite not being used in li et al.’s own calculation of the reproduction number.16 these early studies have been used to inform national and regional responses to the covid-19 pandemic, and they demonstrate the importance of and reliance on early estimates to inform future research and public health decision-making. variations in the estimated reproduction number may also occur due to other assumptions applied in calculations. the initial estimate of the reproduction number of 0.3 assumed zoonotic transmission as the primary mode of transmission, based on the information available at the time.56 the method applied may also influence the final estimate of the reproduction number. this is evident in the studies estimating the reproduction number of the wuhan outbreak from december 2019 to mid-february 2020, which increased in later publications that used the same data sources wpsar vol 12, no 2, 2021 | doi: 10.5365/wpsar.2020.11.3.011https://ojs.wpro.who.int/ 13 early reports of epidemiological parameters of the covid-19 pandemicallen et al reference values to enable a timely response to potential future outbreaks of covid-19 and any future emerging coronaviruses and other potential pandemic diseases. conflicts of interest none declared. funding none. references 1. weekly epidemiological update on covid-19 20 april 2021. geneva: world health organization; 2021. available from: https:// www.who.int/publications/m/item/weekly-epidemiological-updateon-covid-19---20-april-2021, accessed 23 april 2021. 2. farewell vt, herzberg am, james kw, ho lm, leung gm. sars incubation and quarantine times: when is an exposed individual known to be disease free? stat med. 2005 nov 30;24(22):3431– 45. doi:10.1002/sim.2206 pmid:16237660 3. nishiura h. early efforts in modeling the incubation period of infectious diseases with an acute course of illness. emerg themes epidemiol. 2007 may 11;4(1):2. doi:10.1186/1742-7622-4-2 pmid:17466070 4. nishiura h. determination of the appropriate quarantine period following smallpox exposure: an objective approach using the incubation period distribution. int j hyg environ health. 2009 jan;212(1):97– 104. doi:10.1016/j.ijheh.2007.10.003 pmid:18178524 5. fine pem. the interval between successive cases of an infectious disease. am j epidemiol. 2003 dec 1;158(11):1039–47. https:// doi.org/10.1093/aje/kwg251 pmid:14630599 6. ma y, horsburgh cr, white lf, jenkins he. quantifying tb transmission: a systematic review of reproduction number and serial interval estimates for tuberculosis. epidemiol infect. 2018 sep;146(12):1478–94. doi:10.1017/s0950268818001760 7. becker ng, wang d, clements m. type and quantity of data needed for an early estimate of transmissibility when an infectious disease emerges. euro surveill. 2010 jul 1;15(26):19603. pmid:20619130 8. caley p, philp dj, mccracken k. quantifying social distancing arising from pandemic influenza. j r soc interface. 2008 jun 6;5(23):631– 9. doi:10.1098/rsif.2007.1197 pmid:17916550 9. nishiura h, chowell g, safan m, castillo-chavez c. pros and cons of estimating the reproduction number from early epidemic growth rate of influenza a (h1n1) 2009. theor biol med model. 2010 jan 7;7(1):1. doi:10.1186/1742-4682-7-1 pmid:20056004 10. mercer gn, glass k, becker ng. effective reproduction numbers are commonly overestimated early in a disease outbreak. stat med. 2011 apr 30;30(9):984–94. doi:10.1002/sim.4174 pmid:21284013 11. chang t-h, wu j-l, chang l-y. clinical characteristics and diagnostic challenges of pediatric covid-19: a systematic review and meta-analysis. j formos med assoc. 2020 may;119(5):982–9. doi:10.1016/j.jfma.2020.04.007 pmid:32307322 12. park m, cook ar, lim jt, sun y, dickens bl. a systematic review of covid-19 epidemiology based on current evidence. j clin med. 2020 mar 31;9(4):967. doi:10.3390/jcm9040967 pmid:32244365 ten in mandarin and korean, which also limits the representativeness of this analysis. furthermore, this analysis was limited to peer-reviewed published journal articles indexed in pubmed, which represents only a fraction of the literature published on the covid-19 pandemic. the current pandemic has seen the proliferation of pre-print articles and increased attention on their results. grey literature published by who, national governments and other organizations were also omitted. in times of emergency, pre-prints and grey literature may provide new information in a timely manner; however, this review focused only on estimations of epidemic parameters that have been subject to external peer review. pandemics are inherently uncertain times. the challenges of the ongoing covid-19 pandemic are compounded by sars-cov-2 being a new pathogen, which public health and clinical professionals have had to rapidly assess, understand and respond to. early estimates can provide useful interim guidance for public health decision-making. this is particularly true for transmission that is driven by biological characteristics, such as the incubation period. epidemic characteristics that are influenced by human behaviours and public health interventions are less certain and require interpretation within the context of data collection and analysis of the study. reliance on data from small sample sizes and specific settings is necessary in the context of an outbreak, but it also limits the generalizability of findings to other contexts. uncertainty in epidemic characteristics should not mean that we do not act. although earlier estimates may rely on less-than-ideal sample sizes and sample structures, they are necessary to facilitate decision-making in a timely manner. however, reliance on the first estimates published may limit or bias our understanding of new data. the increasing availability of pre-print articles provides an outlet for urgent distribution of findings during an outbreak of a novel pathogen, provided preliminary findings are interpreted with caution before peer review. this study underscores the ongoing challenge and everpresent need for outbreak investigations and research to be both timely and frequently updated, to provide the best evidence to guide interventions. further research is required to refine estimates of the serial interval and reproduction number, to improve our understanding of this pandemic in different contexts, and to provide wpsar vol 12, no 2, 2021 | doi: 10.5365/wpsar.2020.11.3.011 https://ojs.wpro.who.int/14 allen et alearly reports of epidemiological parameters of the covid-19 pandemic 27. zhao d, yao f, wang l, zheng l, gao y, ye j, et al. a comparative study on the clinical features of covid-19 pneumonia to other pneumonias. clin infect dis. 2020 jul 28;71(15):756–61. doi:10.1093/cid/ciaa247 pmid:32161968 28. pung r, chiew cj, young be, chin s, chen mi-c, clapham he, et al.; singapore 2019 novel coronavirus outbreak research team. investigation of three clusters of covid-19 in singapore: implications for surveillance and response measures. lancet. 2020 mar 28;395(10229):1039–46. doi:10.1016/s0140-6736(20)305286 pmid:32192580 29. leung c. the difference in the incubation period of 2019 novel coronavirus (sars-cov-2) infection between travelers to hubei and nontravelers: the need for a longer quarantine period. infect control hosp epidemiol. 2020 may;41(5):594–6. doi:10.1017/ ice.2020.81 pmid:32183920 30. chang d, mo g, yuan x, tao y, peng x, wang fs, et al. time kinetics of viral clearance and resolution of symptoms in novel coronavirus infection. am j respir crit care med. 2020 may 1;201(9):1150–2. doi:10.1164/rccm.202003-0524le pmid:32200654 31. jin x, lian j-s, hu j-h, gao j, zheng l, zhang y-m, et al. epidemiological, clinical and virological characteristics of 74 cases of coronavirus-infected disease 2019 (covid-19) with gastrointestinal symptoms. gut. 2020 jun;69(6):1002–9. doi:10.1136/ gutjnl-2020-320926 pmid:32213556 32. zhang j, litvinova m, wang w, wang y, deng x, chen x, et al. evolving epidemiology and transmission dynamics of coronavirus disease 2019 outside hubei province, china: a descriptive and modelling study. lancet infect dis. 2020 jul;20(7):793–802. doi:10.1016/s1473-3099(20)30230-9 pmid:32247326 33. le tqm, takemura t, moi ml, nabeshima t, nguyen lkh, hoang vmp, et al. severe acute respiratory syndrome coronavirus 2 shedding by travelers, vietnam, 2020. emerg infect dis. 2020 jul;26(7):1624–6. doi:10.3201/eid2607.200591 pmid:32240079 34. zhu y, chen yq. on a statistical transmission model in analysis of the early phase of covid-19 outbreak. stat biosci. 2020 apr 2:1–17. pmid:32292527 35. han y-n, feng z-w, sun l-n, ren x-x, wang h, xue y-m, et al. a comparative-descriptive analysis of clinical characteristics in 2019-coronavirus-infected children and adults. j med virol. 2020 sep;92(9):1596–602. doi:10.1002/jmv.25835 pmid:32249943 36. shen q, guo w, guo t, li j, he w, ni s, et al. novel coronavirus infection in children outside of wuhan, china. pediatr pulmonol. 2020 jun;55(6):1424–9. doi:10.1002/ppul.24762 37. sanche s, lin yt, xu c, romero-severson e, hengartner n, ke r. high contagiousness and rapid spread of severe acute respiratory syndrome coronavirus 2. emerg infect dis. 2020 jul;26(7):1470– 7. doi:10.3201/eid2607.200282 pmid:32255761 38. ghinai i, woods s, ritger ka, mcpherson td, black sr, sparrow l, et al. community transmission of sars-cov-2 at two family gatherings chicago, illinois, february-march 2020. mmwr morb mortal wkly rep. 2020 apr 17;69(15):446–50. doi:10.15585/ mmwr.mm6915e1 pmid:32298246 39. huang l, zhang x, zhang x, wei z, zhang l, xu j, et al. rapid asymptomatic transmission of covid-19 during the incubation period demonstrating strong infectivity in a cluster of youngsters aged 16-23 years outside wuhan and characteristics of young patients with covid-19: a prospective contact-tracing study. j infect. 2020 jun;80(6):e1–13. doi:10.1016/j.jinf.2020.03.006 pmid:32283156 13. balla m, merugu gp, patel m, koduri nm, gayam v, adapa s, et al. covid-19, modern pandemic: a systematic review from front-line health care providers’ perspective. j clin med res. 2020 apr;12(4):215–29. doi:10.14740/jocmr4142 pmid:32362969 14. alimohamadi y, taghdir m, sepandi m. estimate of the basic reproduction number for covid-19: a systematic review and meta-analysis. j prev med public health. 2020 may;53(3):151–7. doi:10.3961/jpmph.20.076 pmid:32498136 15. chan jf-w, yuan s, kok k-h, to kk-w, chu h, yang j, et al. a familial cluster of pneumonia associated with the 2019 novel coronavirus indicating person-to-person transmission: a study of a family cluster. lancet. 2020 feb 15;395(10223):514–23. doi:10.1016/ s0140-6736(20)30154-9 pmid:31986261 16. li q, guan x, wu p, wang x, zhou l, tong y, et al. early transmission dynamics in wuhan, china, of novel coronavirus-infected pneumonia. n engl j med. 2020 mar 26;382(13):1199–1207. doi:10.1056/nejmoa2001316 pmid:31995857 17. backer ja, klinkenberg d, wallinga j. incubation period of 2019 novel coronavirus (2019-ncov) infections among travellers from wuhan, china, 20-28 january 2020. euro surveill. 2020 feb;25(5). doi:10.2807/1560-7917.es.2020.25.5.2000062 pmid:32046819 18. ki m, task force for 2019-ncov. epidemiologic characteristics of early cases with 2019 novel coronavirus (2019-ncov) disease in republic of korea. epidemiol health. 2020 feb 9;42:e2020007. doi:10.4178/epih.e2020007 pmid:32035431 19. jiang x, rayner s, luo m-h. does sars-cov-2 has a longer incubation period than sars and mers? j med virol. 2020 may;92(5):476–8. doi:10.1002/jmv.25708 pmid:32056235 20. linton nm, kobayashi t, yang y, hayashi k, akhmetzhanov ar, jung s-m, et al. incubation period and other epidemiological characteristics of 2019 novel coronavirus infections with right truncation: a statistical analysis of publicly available case data. j clin med. 2020 feb 17;9(2):e538. doi:10.3390/jcm9020538 pmid:32079150 21. xu x-w, wu x-x, jiang x-g, xu k-j, ying l-j, ma c-l, et al. clinical findings in a group of patients infected with the 2019 novel coronavirus (sars-cov-2) outside of wuhan, china: retrospective case series. bmj. 2020 feb 19;368:m606. doi:10.1136/bmj.m606 pmid:32075786 22. tian s, hu n, lou j, chen k, kang x, xiang z, et al. characteristics of covid-19 infection in beijing. j infect. 2020 apr;80(4):401–6. doi:10.1016/j.jinf.2020.02.018 pmid:32112886 23. jiehao c, jin x, daojiong l, zhi y, lei x, zhenghai q, et al. a case series of children with 2019 novel coronavirus infection: clinical and epidemiological features. clin infect dis. 2020 sep 12;71(6):1547– 51. doi:10.1093/cid/ciaa198 pmid:32112072 24. guan w-j, ni z-y, hu y, liang w-h, ou c-q, he j-x, et al.; china medical treatment expert group for covid-19. clinical characteristics of coronavirus disease 2019 in china. n engl j med. 2020 apr 30;382(18):1708–20. doi:10.1056/nejmoa2002032 pmid:32109013 25. liu j, liao x, qian s, yuan j, wang f, liu y, et al. community transmission of severe acute respiratory syndrome coronavirus 2, shenzhen, china, 2020. emerg infect dis. 2020 jun;26(6):1320–3. doi:10.3201/eid2606.200239 pmid:32125269 26. lauer sa, grantz kh, bi q, jones fk, zheng q, meredith hr, et al. the incubation period of coronavirus disease 2019 (covid-19) from publicly reported confirmed cases: estimation and application. ann intern med. 2020 may 5;172(9):577–82. doi:10.7326/ m20-0504 pmid:32150748 wpsar vol 12, no 2, 2021 | doi: 10.5365/wpsar.2020.11.3.011https://ojs.wpro.who.int/ 15 early reports of epidemiological parameters of the covid-19 pandemicallen et al 55. ganyani t, kremer c, chen d, torneri a, faes c, wallinga j, et al. estimating the generation interval for coronavirus disease (covid-19) based on symptom onset data, march 2020. euro surveill. 2020 apr;25(17):2000257. doi:10.2807/1560-7917. es.2020.25.17.2000257 pmid:32372755 56. wu p, hao x, lau ehy, wong jy, leung ksm, wu jt, et al. realtime tentative assessment of the epidemiological characteristics of novel coronavirus infections in wuhan, china, as at 22 january 2020. euro surveill. 2020 jan;25(3): doi:10.2807/1560-7917. es.2020.25.3.2000044 pmid:31992388 57. riou j, althaus cl. pattern of early human-to-human transmission of wuhan 2019 novel coronavirus (2019-ncov), december 2019 to january 2020. euro surveill. 2020 jan;25(4): doi:10.2807/15607917.es.2020.25.4.2000058 pmid:32019669 58. zhao s, lin q, ran j, musa ss, yang g, wang w, et al. preliminary estimation of the basic reproduction number of novel coronavirus (2019-ncov) in china, from 2019 to 2020: a data-driven analysis in the early phase of the outbreak. int j infect dis. 2020 mar;92:214– 7. doi:10.1016/j.ijid.2020.01.050 pmid:32007643 59. wu jt, leung k, leung gm. nowcasting and forecasting the potential domestic and international spread of the 2019-ncov outbreak originating in wuhan, china: a modelling study. lancet. 2020 feb 29;395(10225):689–97. doi:10.1016/s0140-6736(20)30260-9 pmid:32014114 60. zhao s, musa ss, lin q, ran j, yang g, wang w, et al. estimating the unreported number of novel coronavirus (2019-ncov) cases in china in the first half of january 2020: a data-driven modelling analysis of the early outbreak. j clin med. 2020 feb 1;9(2):e388. doi:10.3390/jcm9020388 pmid:32024089 61. tang b, wang x, li q, bragazzi nl, tang s, xiao y, et al. estimation of the transmission risk of the 2019-ncov and its implication for public health interventions. j clin med. 2020 feb 7;9(2):462. doi:10.3390/jcm9020462 pmid:32046137 62. zhou t, liu q, yang z, liao j, yang k, bai w, et al. preliminary prediction of the basic reproduction number of the wuhan novel coronavirus 2019-ncov. j evid based med. 2020 feb;13(1):3–7. doi:10.1111/jebm.12376 pmid:32048815 63. jung s-m, akhmetzhanov ar, hayashi k, linton nm, yang y, yuan b, et al. real-time estimation of the risk of death from novel coronavirus (covid-19) infection: inference using exported cases. j clin med. 2020 feb 14;9(2):e523. doi:10.3390/jcm9020523 pmid:32075152 64. zhang s, diao m, yu w, pei l, lin z, chen d. estimation of the reproductive number of novel coronavirus (covid-19) and the probable outbreak size on the diamond princess cruise ship: a data-driven analysis. int j infect dis. 2020 apr;93:201–4. doi:10.1016/j. ijid.2020.02.033 pmid:32097725 65. lai a, bergna a, acciarri c, galli m, zehender g. early phylogenetic estimate of the effective reproduction number of sars-cov-2. j med virol. 2020 jun;92(6):675–9. doi:10.1002/jmv.25723 pmid:32096566 66. chen t-m, rui j, wang q-p, zhao z-y, cui j-a, yin l. a mathematical model for simulating the phase-based transmissibility of a novel coronavirus. infect dis poverty. 2020 feb 28;9(1):24. doi:10.1186/s40249-020-00640-3 pmid:32111262 67. rocklöv j, sjödin h, wilder-smith a. covid-19 outbreak on the diamond princess cruise ship: estimating the epidemic potential and effectiveness of public health countermeasures. j travel med. 2020 may 18;27(3):taaa030. doi:10.1093/jtm/taaa030 pmid:32109273 68. mizumoto k, chowell g. transmission potential of the novel coronavirus (covid-19) onboard the diamond princess cruises ship, 2020. infect dis model. 2020 feb 29;5:264–70. doi:10.1016/j. idm.2020.02.003 pmid:32190785 40. zheng f, tang w, li h, huang y-x, xie y-l, zhou z-g. clinical characteristics of 161 cases of corona virus disease 2019 (covid-19) in changsha. eur rev med pharmacol sci. 2020 mar;24(6):3404–10. doi: 10.26355/eurrev_202003_20711 pmid:32271459 41. xia x-y, wu j, liu h-l, xia h, jia b, huang w-x. epidemiological and initial clinical characteristics of patients with family aggregation of covid-19. j clin virol. 2020 jun;127:104360. doi:10.1016/j. jcv.2020.104360 pmid:32305025 42. chen j, zhang z-z, chen y-k, long q-x, tian w-g, deng h-j, et al. the clinical and immunological features of pediatric covid-19 patients in china. genes dis. 2020 dec;7(4):535–41. doi:10.1016/j. gendis.2020.03.008 pmid:32363222 43. song w, li j, zou n, guan w, pan j, xu w. clinical features of pediatric patients with coronavirus disease (covid-19). j clin virol. 2020 jun;127:104377. doi:10.1016/j.jcv.2020.104377 pmid:32361323 44. jiang y, niu w, wang q, zhao h, meng l, zhang c. characteristics of a family cluster of severe acute respiratory syndrome coronavirus 2 in henan, china. j infect. 2020 aug;81(2):e46–8. doi:10.1016/j. jinf.2020.04.028 pmid:32335170 45. nie x, fan l, mu g, tan q, wang m, xie y, et al. epidemiological characteristics and incubation period of 7,015 confirmed cases with coronavirus disease 2019 outside hubei province in china. j infect dis. 2020 jun 16;222(1):26–33. doi:10.1093/infdis/ jiaa211 pmid:32339231 46. yu x, sun x, cui p, pan h, lin s, han r, et al. epidemiological and clinical characteristics of 333 confirmed cases with coronavirus disease 2019 in shanghai, china. transbound emerg dis. 2020 jul;67(4):1697–707. doi:10.1111/tbed.13604 47. bi q, wu y, mei s, ye c, zou x, zhang z, et al. epidemiology and transmission of covid-19 in 391 cases and 1286 of their close contacts in shenzhen, china: a retrospective cohort study. lancet infect dis. 2020 aug;20(8):911–9. doi:10.1016/s14733099(20)30287-5 pmid:32353347 48. nishiura h, linton nm, akhmetzhanov ar. serial interval of novel coronavirus (covid-19) infections. int j infect dis. 2020 apr;93:284–6. doi:10.1016/j.ijid.2020.02.060 pmid:32145466 49. du z, xu x, wu y, wang l, cowling bj, meyers la. serial interval of covid-19 among publicly reported confirmed cases. emerg infect dis. 2020 jun;26(6):1341–3. doi:10.3201/eid2606.200357 pmid:32191173 50. wu jt, leung k, bushman m, kishore n, niehus r, de salazar pm, et al. estimating clinical severity of covid-19 from the transmission dynamics in wuhan, china. nat med. 2020 apr;26(4):506– 10. doi:10.1038/s41591-020-0822-7 pmid:32284616 51. ji t, chen h-l, xu j, wu l-n, li j-j, chen k, et al. lockdown contained the spread of 2019 novel coronavirus disease in huangshi city, china: early epidemiological findings. clin infect dis. 2020 sep 12;71(6):1454–60. doi:10.1093/cid/ciaa390 pmid:32255183 52. wang z, ma w, zheng x, wu g, zhang r. household transmission of sars-cov-2. j infect. 2020 jul;81(1):179–82. doi:10.1016/j. jinf.2020.03.040 pmid:32283139 53. he x, lau ehy, wu p, deng x, wang j, hao x, et al. temporal dynamics in viral shedding and transmissibility of covid-19. nat med. 2020 may;26(5):672–5. doi:10.1038/s41591-020-0869-5 pmid:32296168 54. kwok ko, wong vwy, wei wi, wong sys, tang jw-t. epidemiological characteristics of the first 53 laboratory-confirmed cases of covid-19 epidemic in hong kong, 13 february 2020. euro surveill. 2020 apr;25(16): doi:10.2807/1560-7917. es.2020.25.16.2000155 pmid:32347198 wpsar vol 12, no 2, 2021 | doi: 10.5365/wpsar.2020.11.3.011 https://ojs.wpro.who.int/16 allen et alearly reports of epidemiological parameters of the covid-19 pandemic 84. zhao s, stone l, gao d, musa ss, chong mkc, he d, et al. imitation dynamics in the mitigation of the novel coronavirus disease (covid-19) outbreak in wuhan, china from 2019 to 2020. ann transl med. 2020 apr;8(7):448. doi:10.21037/atm.2020.03.168 pmid:32395492 85. pan a, liu l, wang c, guo h, hao x, wang q, et al. association of public health interventions with the epidemiology of the covid-19 outbreak in wuhan, china. jama. 2020 apr 10; 323(19):19151923. doi:10.1001/jama.2020.6130 86. abbott s, hellewell j, munday j, funk s; cmmid ncov working group. the transmissibility of novel coronavirus in the early stages of the 2019-20 outbreak in wuhan: exploring initial point-source exposure sizes and durations using scenario analysis. wellcome open res. 2020 feb 3;5:17. doi:10.12688/wellcomeopenres.15718.1 pmid:32322691 87. du z, wang l, cauchemez s, xu x, wang x, cowling bj, et al. risk for transportation of 2019 novel coronavirus disease from wuhan to other cities in china. emerg infect dis. 2020 may;26(5):1049– 52. doi:10.3201/eid2605.200146 pmid:32053479 88. torres-roman js, kobiak ic, valcarcel b, diaz-velez c, la vecchia c. the reproductive number r0 of covid-19 in peru: an opportunity for effective changes. travel med infect dis. 2020 sep-oct;37:101689. doi:10.1016/j.tmaid.2020.101689 pmid:32325120 89. tsang tk, wu p, lin y, lau ehy, leung gm, cowling bj. effect of changing case definitions for covid-19 on the epidemic curve and transmission parameters in mainland china: a modelling study. lancet public health. 2020 may;5(5):e289–96. doi:10.1016/ s2468-2667(20)30089-x pmid:32330458 90. muniz-rodriguez k, fung ic-h, ferdosi sr, ofori sk, lee y, tariq a, et al. severe acute respiratory syndrome coronavirus 2 transmission potential, iran, 2020. emerg infect dis. 2020 aug;26(8):1915–7. doi:10.3201/eid2608.200536 pmid:32320641 91. zhuang z, zhao s, lin q, cao p, lou y, yang l, et al. preliminary estimating the reproduction number of the coronavirus disease (covid-19) outbreak in republic of korea and italy by 5 march 2020. int j infect dis. 2020 apr 22;95:308–10. doi:10.1016/j. ijid.2020.04.044 92. gatto m, bertuzzo e, mari l, miccoli s, carraro l, casagrandi r, et al. spread and dynamics of the covid-19 epidemic in italy: effects of emergency containment measures. pnas. 2020 may 12;117(19):10484–91. doi:10.1073/pnas.2004978117 93. han y, liu y, zhou l, chen e, liu p, pan x, et al. epidemiological assessment of imported coronavirus disease 2019 (covid-19) cases in the most affected city outside of hubei province, wenzhou, china. jama netw open. 2020 apr 1;3(4):e206785. doi:10.1001/ jamanetworkopen.2020.6785 pmid:32324236 94. caicedo-ochoa y, rebellón-sánchez de, peñaloza-rallón m, cortés-motta hf, méndez-fandiño yr. effective reproductive number estimation for initial stage of covid-19 pandemic in latin american countries. int j infect dis. 2020 jun;95:316–8. doi:10.1016/j. ijid.2020.04.069 pmid:32360941 95. distante c, piscitelli p, miani a. covid-19 outbreak progression in italian regions: approaching the peak by the end of march in northern italy and first week of april in southern italy. int j environ res public health. 2020 apr 27;17(9):e3025. doi:10.3390/ ijerph17093025 pmid:32349259 96. ndaïrou f, area i, nieto jj, torres dfm. mathematical modeling of covid-19 transmission dynamics with a case study of wuhan. chaos solitons fractals. 2020 jun;135:109846. doi:10.1016/j. chaos.2020.109846 pmid:32341628 69. fang y, nie y, penny m. transmission dynamics of the covid-19 outbreak and effectiveness of government interventions: a data-driven analysis. j med virol. 2020 jun;92(6):645–59. doi:10.1002/jmv.25750 pmid:32141624 70. zhou wk, wang al, xia f, xiao yn, tang sy. effects of media reporting on mitigating spread of covid-19 in the early phase of the outbreak. math biosci eng. 2020 mar 10;17(3):2693–707. doi:10.3934/mbe.2020147 pmid:32233561 71. kucharski aj, russell tw, diamond c, liu y, edmunds j, funk s, et al.; centre for mathematical modelling of infectious diseases covid-19 working group. early dynamics of transmission and control of covid-19: a mathematical modelling study. lancet infect dis. 2020 may;20(5):553–8. doi:10.1016/s1473-3099(20)30144-4 pmid:32171059 72. yang cy, wang j. a mathematical model for the novel coronavirus epidemic in wuhan, china. math biosci eng. 2020 mar 11;17(3):2708–24. doi:10.3934/mbe.2020148 pmid:32233562 73. zhao s, chen h. modeling the epidemic dynamics and control of covid-19 outbreak in china. quant biol. 2020 mar 11;8(1):1–9. doi:10.1007/s40484-020-0199-0 pmid:32219006 74. choi sc, ki m. estimating the reproductive number and the outbreak size of novel coronavirus disease (covid-19) using mathematical model in republic of korea. epidemiol health. 2020 mar 12;42:e2020011. doi:10.4178/epih.e2020011 pmid:32164053 75. kuniya t. prediction of the epidemic peak of coronavirus disease in japan, 2020. j clin med. 2020 mar 13;9(3):e789. doi:10.3390/ jcm9030789 pmid:32183172 76. remuzzi a, remuzzi g. covid-19 and italy: what next? lancet. 2020 apr 11;395(10231):1225–8. doi:10.1016/s01406736(20)30627-9 pmid:32178769 77. li r, pei s, chen b, song y, zhang t, yang w, et al. substantial undocumented infection facilitates the rapid dissemination of novel coronavirus (sars-cov2). science. 2020 mar 16. doi:10.1126/ science.abb3221 pmid:32179701 78. shim e, tariq a, choi w, lee y, chowell g. transmission potential and severity of covid-19 in south korea. int j infect dis. 2020 apr;93:339–44. doi:10.1016/j.ijid.2020.03.031 pmid:32198088 79. yuan j, li m, lv g, lu zk. monitoring transmissibility and mortality of covid-19 in europe. int j infect dis. 2020 jun;95:311–5. doi:10.1016/j.ijid.2020.03.050 pmid:32234343 80. anastassopoulou c, russo l, tsakris a, siettos c. data-based analysis, modelling and forecasting of the covid-19 outbreak. plos one. 2020 mar 31;15(3):e0230405. doi:10.1371/journal. pone.0230405 pmid:32231374 81. ferretti l, wymant c, kendall m, zhao l, nurtay a, abelerdörner l, et al. quantifying sars-cov-2 transmission suggests epidemic control with digital contact tracing. science. 2020 may 8;368(6491):eabb6936. doi:10.1126/science.abb6936 pmid:32234805 82. huang r, liu m, ding y. spatial-temporal distribution of covid-19 in china and its prediction: a data-driven modeling analysis. j infect dev ctries. 2020 mar 31;14(3):246–53. doi:10.3855/ jidc.12585 83. tian h, liu y, li y, wu c-h, chen b, kraemer mug, et al. an investigation of transmission control measures during the first 50 days of the covid-19 epidemic in china. science. 2020 may 8;368(6491):638–42. doi:10.1126/science.abb6105 pmid:32234804 wpsar vol 12, no 2, 2021 | doi: 10.5365/wpsar.2020.11.3.011https://ojs.wpro.who.int/ 17 early reports of epidemiological parameters of the covid-19 pandemicallen et al 105. wei we, li z, chiew cj, yong se, toh mp, lee vj. presymptomatic transmission of sars-cov-2 singapore, january 23-march 16, 2020. mmwr morb mortal wkly rep. 2020 apr 10;69(14):411– 5. doi:10.15585/mmwr.mm6914e1 pmid:32271722 106. tong z-d, tang a, li k-f, li p, wang h-l, yi j-p, et al. potential presymptomatic transmission of sars-cov-2, zhejiang province, china, 2020. emerg infect dis. 2020 may;26(5):1052–4. doi:10.3201/eid2605.200198 pmid:32091386 107. schneider e, bermingham a, pebody r, watson j. sars, mers, and other coronavirus infections. in: heymann d, editor. control of communicable diseases manual. 20th ed. washington, dc: american public health association press; 2015. doi:10.2105/ ccdm.2745.128 108. cowling bj, park m, fang vj, wu p, leung gm, wu jt. preliminary epidemiological assessment of mers-cov outbreak in south korea, may to june 2015. euro surveill. 2015 jun 25;20(25):7–13. doi:10.2807/1560-7917.es2015.20.25.21163 pmid:26132767 109. assiri a, mcgeer a, perl tm, price cs, al rabeeah aa, cummings dat, et al.; ksa mers-cov investigation team. hospital outbreak of middle east respiratory syndrome coronavirus. n engl j med. 2013 aug 1;369(5):407–16. doi:10.1056/nejmoa1306742 pmid:23782161 110. zeng g, xie s-y, li q, ou j-m. infectivity of severe acute respiratory syndrome during its incubation period. biomed environ sci. 2009 dec;22(6):502–10. doi:10.1016/s0895-3988(10)600086 pmid:20337224 111. cauchemez s, epperson s, biggerstaff m, swerdlow d, finelli l, ferguson nm. using routine surveillance data to estimate the epidemic potential of emerging zoonoses: application to the emergence of us swine origin influenza a h3n2v virus. plos med. 2013;10(3):e1001399. doi:10.1371/journal.pmed.1001399 pmid:23472057 112. cori a, ferguson nm, fraser c, cauchemez s. a new framework and software to estimate time-varying reproduction numbers during epidemics. am j epidemiol. 2013 nov 1;178(9):1505–12. doi:10.1093/aje/kwt133 pmid:24043437 97. peirlinck m, linka k, sahli costabal f, kuhl e. outbreak dynamics of covid-19 in china and the united states. biomech model mechanobiol. 2020 dec;19(6):2179–93. doi:10.1007/s10237020-01332-5 pmid:32342242 98. adegboye oa, adekunle ai, gayawan e. early transmission dynamics of novel coronavirus (covid-19) in nigeria. int j environ res public health. 2020 apr 28;17(9):e3054. https://doi. org/10.3390/ijerph17093054 pmid:32353991 99. ivorra b, ferrández mr, vela-pérez m, ramos am. mathematical modeling of the spread of the coronavirus disease 2019 (covid-19) taking into account the undetected infections. the case of china. commun nonlinear sci numer simul. 2020 sep;88:105303. doi:10.1016/j.cnsns.2020.105303 pmid:32355435 100. lipsitch m, cohen t, cooper b, robins jm, ma s, james l, et al. transmission dynamics and control of severe acute respiratory syndrome. science. 2003 jun 20;300(5627):1966–70. doi:10.1126/ science.1086616 101. arons mm, hatfield km, reddy sc, kimball a, james a, jacobs jr, et al.; public health–seattle and king county and cdc covid-19 investigation team. presymptomatic sars-cov-2 infections and transmission in a skilled nursing facility. n engl j med. 2020 may 28;382(22):2081–90. doi:10.1056/nejmoa2008457 pmid:32329971 102. bae j-m. a chinese case of covid-19 did not show infectivity during the incubation period: based on an epidemiological survey. j prev med public health. 2020 mar 2;53(2):67–9. doi:10.3961/ jpmph.20.048 pmid:32114755 103. kimball a, hatfield km, arons m, james a, taylor j, spicer k, et al.; public health – seattle & king county; cdc covid-19 investigation team. asymptomatic and presymptomatic sars-cov-2 infections in residents of a long-term care skilled nursing facility king county, washington, march 2020. mmwr morb mortal wkly rep. 2020 apr 3;69(13):377–81. doi:10.15585/mmwr. mm6913e1 pmid:32240128 104. li p, fu j-b, li k-f, chen y, wang h-l, liu l-j, et al. transmission of covid-19 in the terminal stage of incubation period: a familial cluster. int j infect dis. 2020 mar 16;96:452–3. doi:10.1016/j. ijid.2020.03.027 https://ojs.wpro.who.int/ 1wpsar vol 13, no 4, 2022 | doi: 10.5365/wpsar.2022.13.4.979 brief report t he range of public health emergencies that occurred in australia during 2020 illustrates the complexity of contemporary acute public health issues. in 2020 alone, australia mounted responses to bush-fires, storms, drought, floods and rodent plagues, as well as the coronavirus disease (covid-19) pandemic. such events have highlighted not just the vital role played by the field epidemiology workforce in rapidly and effectively managing a wide range of public health emergencies but also the need to continually train and invest in this workforce to ensure high levels of public health emergency preparedness.1–5 health workforce strengthening is essential to achieving the international health regulations (ihr 2005) core capacities.6 the asia pacific strategy for emerging diseases and public health emergencies (apsed iii) also makes specific reference to the need for a skilled and experienced local public health workforce for preventing the escalation of public health emergencies.7 the australian field epidemiology training programme (fetp), commonly known as the master of philosophy in applied epidemiology (mae), is one of several public health training programmes in australia. established in 1991 to address a recognized gap in the public health workforce, the programme is australia’s accredited fetp.8,9 utilizing the approach of “learning through doing”, students spend most of the 22-monthlong programme working within a field placement. this approach ensures alumni are appropriately trained to contribute to the detection, investigation, response and control of acute public health events.8 as of june 2021, there were 58 students and 255 alumni in the network. australian fetp alumni work in senior roles in health departments at local, state, national and international levels, in aboriginal and torres strait islander health services and organizations, in united nations agencies, as well as in research institutions and academia. alumni and students have been consistently involved in national and international epidemic responses, including severe acute respiratory syndrome (sars) (2002–2003), h1n1 influenza (2009), middle east respiratory syndrome coronavirus (mers-cov) (2012–) and ebola virus disease in west africa (2014–2016). the experiences of alumni and students have been used to modify the programme to make it more relevant, adaptive and “pandemic ready”. the aim of this study was to describe the level and scope of australian fetp alumni and student contributions to the covid-19 response during the first 10 months of the pandemic so that these experiences could inform programme learning priorities going forward. methods in 2020, the training programs in epidemiology and public health interventions network (tephinet) developed a survey to document the contribution of fetp trainees and alumni to covid-19 preparedness and response internationally.10 we adapted this instrument to conduct a cross-sectional survey of australian fetp network members (survey available upon request to the corresponding author). our survey collected participants’ demographic data and information about their employment and role in the covid-19 response. invitations to participate, with a link to the survey, were emailed to alumni and students in july 2020. participants were a national centre for epidemiology and population health, college of health and medicine, australian national university, canberra, australian capital territory, australia. b the kirby institute, university of new south wales, sydney, new south wales, australia. published: 27 december 2022 doi: 10.5365/wpsar.2022.13.4.979 contribution of the australian field epidemiology training workforce to the covid-19 response, 2020 amy elizabeth parry,a charlee law,a davoud pourmarzi,a florian vogt,a,b emma fielda and samantha colquhouna correspondence to amy elizabeth parry (email: amy.parry@anu.edu.au) wpsar vol 13, no 4, 2022 | doi: 10.5365/wpsar.2022.13.4.979 https://ojs.wpro.who.int/2 parry et alaustralian fetp response to covid-19 commonly reported activities in the “reporting of data” category included developing internal situation reports (62%, 41/66), preparing articles for publication in peer-reviewed journals (26/66, 39%) and sharing information on dashboards (27%, 18/66). within the “incident command” category, the most frequently reported activity was involvement in emergency operations centres (33%, 22/66), followed by involvement in incident command systems (24%, 16/66). six (9%) respondents were engaged in incident command activities within aboriginal and torres strait islander health services and organizations (table 1). sixty-eight per cent (45/66) of participants reported involvement in “operational research” and 56% (37/66) participated in one or more activities related to “risk communication and community engagement”. over a quarter (29%, 19/66) were involved in the preparation of communication for health-care providers; an equal number (29%, 19/66) interacted with or provided information to media (table 1). all seven (11%) respondents working in international covid-19 response reported participating in activities related to the development of risk communication briefings and messages. around a third of participants reported involvement in “infection prevention and control” (36%, 24/66), “operational support” (32%, 21/66) and “laboratory” (30%, 20/66) activities. fewer respondents reported being involved in activities relating to “point of entry” (27%, 18/66) and “case management” (21%, 14/66) (table 1). discussion our survey revealed that australian fetp alumni and students were involved in a wide range of pandemic response activities during the early months of the covid-19 pandemic, suggesting that the programme provides a relevant and important contribution to the health response workforce in australia and internationally. alumni and students have been providing support during the covid-19 pandemic in a variety of settings, including the public sector, academia and nongovernmental agencies, with many seconded into surge capacity roles. also recruited using convenience and snowball sampling methods, with recipients asked to share the invitation with other australian fetp alumni. roles were categorized into 10 main areas; each main area was assigned a list of associated activities. multiple answers within each category were allowed. open-ended questions were included to obtain additional details about participants’ roles and responsibilities. data were stratified and descriptively analysed by category using stata 15 (statacorp llc, college station, tx, united states of america). results we received 66 responses, 57 from alumni (86%) and nine (14%) from current students. the majority (89%, 59/66) were involved in covid-19 response activities in australia; within this group, 61% (36/59) reported working for state or territory government departments, 10% (6/59) for a federal government department and 3% (2/59) for a local government department. other workplaces included nongovernmental agencies (5%, 3/66), universities (21%, 14/66) and aboriginal and torres strait islander health services and organizations (3%, 2/66), with some respondents reporting multiple workplaces. seven respondents reported working internationally (11%, 7/66). information on participant involvement in 43 covid-19-related response activities is summarized in table 1. of the 66 respondents, 65 (98%) were involved in at least one listed activity and 36 (55%) in more than five activities. over two fifths of respondents reported being involved in “surveillance” (82%, 54/66); 80% (53/66) were engaged in “reporting of data” and 71% (47/66) in activities related to “‘incident command”. within the “surveillance” category, the most frequently reported activities included active disease surveillance (50%, 33/66), case-based reporting (44%, 29/66) and contact tracing (39%, 26/66) (table 1). other activities mentioned by participants included establishing customized covid-19 surveillance systems, developing dashboards, responding to outbreaks on cruise ships and providing expert advice within a variety of settings. wpsar vol 13, no 4, 2022 | doi: 10.5365/wpsar.2022.13.4.979https://ojs.wpro.who.int/ 3 australian fetp response to covid-19parry et al table 1. australian fetp survey respondents’ involvement in covid-19 response activities, july–december 2020 (n = 66) category associated activities n (% of total) surveillance not involved in surveillance activities 12 (18%) active disease surveillance 33 (50%) case-based reporting 29 (44%) contact tracing 26 (39%) dissemination of case definitions 16 (24%) other 33 (50%) reporting of data not involved in reporting of data 13 (20%) development of internal situation reports 41 (62%) writing short reports or papers for publication in peer-reviewed journals 26 (39%) sharing information on dashboards 18 (27%) other 6 (9%) incident command not involved in incident command activities 19 (29%) emergency operations centre 22 (33%) incident command system 16 (24%) emergency management 9 (14%) aboriginal and torres strait islander health services and organizations 6 (9%) other 12 (18%) operational research not involved in operational research 21 (32%) surveillance research 19 (29%) state, province, country-level coordination, regional or national planning and monitoring research 8 (12%) risk assessment research 6 (9%) community engagement research 2 (3%) other 20 (30%) risk communication & community engagement not involved in risk communication and community engagement activities 29 (44%) development of communication for health-care providers 19 (29%) media briefs and/or interviews 19 (29%) construction of information sheets for the public 15 (23%) construction of material for open access web pages for communication to the public 14 (22%) communication for aboriginal and torres strait islander health workers or communities 11 (17%) on call for community queries 13 (20%) hotline 5 (8%) other 3 (5%) infection prevention and control (ipc) not involved in ipc activities 42 (64%) reporting and investigating cases of health-care-associated infections 11 (17%) training staff in ipc 6 (9%) ipc risk assessment in facilities 6 (9%) development of guidelines for ipc in facilities 5 (8%) implementation of triage and control measures 2 (3%) other ipc activities 5 (8%) wpsar vol 13, no 4, 2022 | doi: 10.5365/wpsar.2022.13.4.979 https://ojs.wpro.who.int/4 parry et alaustralian fetp response to covid-19 respondents were allowed to give multiple answers within each main topic area. percentages do not therefore sum to 100%. maining unknown. therefore, the results presented are not generalizable to the australian fetp population, though they do provide insight into some of the roles alumni and students played in the early phases of the response. the australian fetp has trained public health professionals who have contributed to different aspects of the covid-19 response. the programme needs to continually adapt to ensure the training it provides remains relevant and addresses the breadth of skills required of field epidemiologists. it is important that support for the programme is maintained so that it can continue to play its critical role in building australia’s public health capacity. the ability to redeploy the skilled field epidemiology workforce has been essential to the covid-19 response at state, national and international levels.2 public health training programmes, such as the australian fetp, need to remain responsive to workforce needs and continue to align with national, regional and international ihr workforce priorities.4 that the programme is practical has been advantageous to the overarching australian response by building a skilled and adaptive epidemiological workforce that is able to rapidly respond to acute public health emergencies. due to the sampling method used, it was not possible to accurately estimate the number of alumni the survey reached, with reasons for non-response recategory associated activities n (% of total) operational support not involved in operational support or logistics activities 45 (68%) preparation of staff surge capacity and deployment mechanisms 15 (23%) review of supply chain control and management system for medical and other essential supplies 2 (3%) other 8 (12%) laboratory not involved in laboratory activities 46 (70%) standard operating procedures adopted for specimen collection and transportation for diagnostics 3 (5%) access to designated covid-19 reference laboratories 3 (5%) development of surge plans to manage increased demand for testing 3 (5%) conducting whole genome sequencing 2 (3%) vaccine development for covid-19 0 (0%) development of rapid tests 0 (0%) development or trial of point-of-care tests 0 (0%) clinical trials for medications or vaccines 0 (0%) other 11 (17%) point of entry not involved in point-of-entry activities 48 (73%) preparation of isolation facilities or quarantine measures 4 (6%) communication of information about covid-19 to travellers 2 (3%) establishing standard operating procedures equipping staff to manage ill passengers 2 (3%) other 12 (18%) case management not involved in case management activities 52 (79%) guidance made available for self-care of patients with mild symptoms 4 (6%) health-care facilities prepared for high volume of cases 3 (5%) dedicated teams to transport and treat suspected and confirmed cases 3 (5%) other 6 (9%) wpsar vol 13, no 4, 2022 | doi: 10.5365/wpsar.2022.13.4.979https://ojs.wpro.who.int/ 5 australian fetp response to covid-19parry et al references 1. working for health and growth: investing in the health workforce. geneva: world health organization; 2016. available from: https:// apps.who.int/iris/handle/10665/250047, accessed 11 september 2020. 2. macintyre cr, binkin n. in the room where it happens: the consequences of the lack of public health expertise during the covid-19 pandemic. global biosecurity. 2021;3(1). doi:10.31646/gbio.102 3. o’carroll pw, kirk md, reddy c, morgan ow, baggett hc. the global field epidemiology roadmap: enhancing global health security by accelerating the development of field epidemiology capacity worldwide. health security. 2021;19(3):349–51. doi:10.1089/ hs.2021.0018 pmid:33944584 4. griffith mm, parry ae, housen t, stewart t, kirk md. covid-19 and investment in applied epidemiology. bull world health organ. 2022;100(7):415–415a. doi:10.2471/blt.22.288687 pmid:35813518 5. parry ae, colquhoun sm, field e, kirk m, durrheim d, housen t. how can we better support the public health emergency response workforce during crises? public health emergency response workforce support. western pac surveill response j. 2021;12(4):1–3. doi:10.5365/wpsar.2021.12.4.886 pmid:35572737 6. international health regulations (2005), 3rd ed. geneva: world health organization; 2016. available from: https://apps.who.int/ iris/handle/10665/246107, accessed 16 april 2018. 7. asia pacific strategy for emerging diseases and public health emergencies (apsed iii) : advancing implementation of the international health regulations (2005) : working together towards health security. manila: who regional office for the western pacific; 2017. available from: https://apps.who.int/iris/handle/10665/259094, accessed 21 october 2020. 8. davis s, patel ms, fearnley e, viney k, kirk md. the australian master of applied epidemiology program: looking back, moving forward. commun dis intell q rep. 2016;40(3):e326–33. pmid:28278405 9. patel ms, phillips cb. strengthening field-based training in low and middle-income countries to build public health capacity: lessons from australia’s master of applied epidemiology program. aust new zealand health policy. 2009;6:5. doi:10.1186/1743-8462-6-5 pmid:19358710 10. hu ae, fontaine r, turcios-ruiz r, abedi aa, williams s, hilmers a, et al. field epidemiology training programs contribute to covid-19 preparedness and response globally. bmc public health. 2022;22(1):63. doi:10.1186/s12889-021-12422-z pmid:35012482 acknowledgements the authors thank the participants of the survey for generously sharing their knowledge and experience in the midst of the covid-19 response. the authors also thank dr tambri housen for assisting in the design of the survey. the survey was based on a tool developed by tephinet, which was adapted with permission for this project. conflicts of interest ap and ef are associate editors of the western pacific surveillance and response journal. they were not involved in the editorial decision to publish this manuscript. ethics approval the protocol for this study was approved by the australian national university human research ethics committee (approval no. 2020/201). funding this research received no specific grant from any funding agency in the public, commercial or not-for-profit sectors. ap received commonwealth and anu science merit scholarships, along with funding from the australian national health medical research council (nhmrc) integrated systems for epidemic response (app1107393). sc, ef and fv received funding through the asean australia health security fellowship program, funded by dfat grant 74680. the funders did not have any role in the study design, data collection and analysis, decision to publish or preparation of the manuscript. https://ojs.wpro.who.int/ 1wpsar vol 12, no 4, 2021 | doi: 10.5365/wpsar.2021.12.4.863 original research h ospital-acquired acinetobacter baumannii infections are some of the most challenging to treat due to the bacterium’s ability to acquire resistance to different groups of antimicrobials and to survive for long periods on dry surfaces, making eradication in health care facilities difficult once it has become endemic.1 a previous surveillance study in the asia–pacific area showed that acinetobacter spp. was the organism most frequently isolated in ventilator-associated pneumonia,2 while in recent years the philippines antimicrobial resistance surveillance program (arsp) has consistently reported a. baumannii as the second and third most commonly isolated organism from, respectively, cerebrospinal fluid and respiratory specimens.3 during the past two decades, a. baumannii has become increasingly resistant to carbapenems worldwide, with resistance rates of >40% reported across several countries in the asia–pacific area, which is the highest prevalence of carbapenem resistance among important nosocomial gram-negative pathogens.4,5 this pattern is also observed in the philippines, where the annual resistance rates for several antibiotics, including carbapenems, a antimicrobial resistance surveillance reference laboratory, research institute for tropical medicine, department of health, muntinlupa, philippines. b centre for genomic pathogen surveillance, wellcome genome campus, hinxton, england. c university of st andrews school of medicine, st andrews, scotland. d brigham and women’s hospital, boston, ma, usa. e big data institute, university of oxford, oxford, england. † these authors contributed equally to this work. * these authors contributed equally to this work. published: 27 october 2021 doi: 10.5365/wpsar.2021.12.4.863 objective: acinetobacter baumannii is an opportunistic nosocomial pathogen that has increasingly become resistant to carbapenems worldwide. in the philippines, rates of carbapenem resistance and multidrug resistance are above 50%. we undertook a genomic study of carbapenem-resistant a. baumannii in the philippines to characterize the population diversity and antimicrobial resistance mechanisms. methods: we sequenced the whole genomes of 117 a. baumannii isolates recovered by 16 hospitals in the philippines between 2013 and 2014. from the genome sequences, we determined the multilocus sequence type, presence of acquired determinants of antimicrobial resistance and relatedness between isolates. we also compared the phenotypic and genotypic resistance results. results: carbapenem resistance was mainly explained by acquisition of the class-d β-lactamase gene blaoxa-23. the concordance between phenotypic and genotypic resistance to imipenem was 98.15%, and it was 94.97% overall for the seven antibiotics analysed. twenty-two different sequence types were identified, including 7 novel types. the population was dominated by the high-risk international clone 2 (i.e. clonal complex 92), in particular by st195 and st208 and their single locus variants. using whole-genome sequencing, we identified local clusters representing potentially undetected nosocomial outbreaks, as well as multi-hospital clusters that indicated interhospital dissemination. comparison with global genomes suggested that the establishment of carbapenem-resistant international clone 2 in the philippines is likely the result of clonal expansion and geographical dissemination, and at least partly explained by inadequate hospital infection control and prevention. discussion: this is the first extensive genomic study of carbapenem-resistant a. baumannii in the philippines, and it underscores the importance of hospital infection control and prevention measures to contain high-risk clones. genomic surveillance of acinetobacter baumannii in the philippines, 2013–2014 jeremiah chilam,a,† silvia argimón,b,† marilyn t. limas,a melissa l. masim,a june m. gayeta,a marietta l. lagrada,a agnettah m. olorosa,a victoria cohen,b lara t. hernandez,a benjamin jeffrey,b khalil abudahab,b charmian m. hufano,a sonia b. sia,a matthew t.g. holden,c john stelling,d david m. aanensene,* and celia c. carlosa,* on behalf of the philippines antimicrobial resistance surveillance program correspondence to david m. aanensen and celia carlos (email: david.aanensen@bdi.ox.ac.uk and ccarlosphl@gmail.com) wpsar vol 12, no 4, 2021 | doi: 10.5365/wpsar.2021.12.4.863 https://ojs.wpro.who.int/2 argimon et ala. baumannii surveillance in the philippines (ii) complete antimicrobial susceptibility data were available (i.e. a resistance profile); (iii) the overall prevalence of the resistance profile was in the arsp database (including both referred and non-referred isolates); (iv) geographical representation of the different sentinel sites was present; (v) invasive isolates (i.e. from blood or cerebrospinal, joint, pleural or pericardial fluids) were selected when both invasive and non-invasive isolates were available for a combination of resistance profile, sentinel site and year of collection (table 1). we utilized a proxy definition for “infection origin” whereby patients’ isolates collected on either of the first 2 days of hospitalization were categorized as from communityacquired infections, while isolates collected on hospital day 3 or later were categorized as from hospital-acquired infections. antimicrobial susceptibility testing all a. baumannii isolates included in this study were tested for antimicrobial susceptibility to nine antibiotics representing six different classes: ceftazidime (caz), ceftriaxone (cro), imipenem (ipm), ampicillinsulbactam (sam), piperacillin-tazobactam (tzp), gentamicin (gen), amikacin (amk), ciprofloxacin (cip) and sulfamethoxazole-trimethoprim (sxt) (table 1). antimicrobial susceptibility was determined at the reference laboratory using one or a combination of the following methods: kirby–bauer disk diffusion; a gradient method, such as the e-test (biomérieux; marcyl’étoile, france); or the vitek 2 compact automated system (biomérieux; marcy-l’étoile, france). the zone of inhibition and minimum inhibitory concentration obtained were interpreted according to the twentysixth edition of the clinical and laboratory standards institute guidelines10 to determine the resistance profile of the isolates as a list of antimicrobials to which the organism was not susceptible. mdr phenotypes were defined as nonsusceptibility to ≥1 agent in ≥3 antimicrobial categories, and extensively drug-resistant (xdr) phenotypes were defined as nonsusceptibility to ≥1 agent in all but ≥2 classes. dna extraction and whole-genome sequencing dna was extracted from a single colony of each of the 117 a. baumannii isolates using the qiaamp 96 dna qiacube ht kit and the qiacube ht system (qiagen; hilden, germany). dna extracts were multiplexed and sequenced on the illumina hiseq platform (illumina; have been increasing, in 2017 reaching 56% for meropenem and 57% for imipenem (fig. 1a–c). in addition, the arsp has reported rates of multidrug resistance of 63% for all isolates and 47% for blood isolates, with combined resistance to aminoglycosides, fluoroquinolones, carbapenems and ampicillin-sulbactam.3 importantly, bacteraemia due to multidrug-resistant (mdr) a. baumannii has been shown to result in additional hospitalization and costs compared with bacteraemia due to non-mdr a. baumannii.6 molecular typing methods have shown that clinical isolates of a. baumannii with an mdr phenotype belong mostly to two globally disseminated lineages: global clone (gc) 1 and gc2, also known as international clones (ics) 1 and 2. clonal complex 92 (cc92), corresponding to gc2, was the most prevalent in a previous study in nine asian countries that included two isolates from the philippines.7 the arsp has been conducting surveillance of drug-resistant a. baumannii using phenotypic detection methods for bacterial identification and antimicrobial susceptibility testing. whole-genome sequencing (wgs) can provide information on antimicrobial resistance (amr) and genotyping with a single assay and with additional resolution to aid outbreak investigations.8 understanding the molecular epidemiology and amr mechanisms of a. baumannii by monitoring the presence of international clones and the emergence of novel lineages in the philippines can aid in the control of amr. this report provides baseline data on the molecular epidemiology of a. baumannii in the philippines, with a focus on the predominant circulating lineages and amr mechanisms. methods bacterial isolates a total of 5254 a. baumannii isolates were collected and tested for antimicrobial susceptibility by the arsp’s sentinel sites from january 2013 to december 2014. isolates resistant to carbapenems were subsequently referred to the antimicrobial resistance surveillance reference laboratory for confirmation. out of the 445 carbapenem-resistant a. baumannii isolates referred (155 in 2013 and 290 in 2014), 117 from 16 sentinel sites were selected for wgs according to the following criteria (previously described in detail):9 (i) isolate was referred to the reference laboratory during 2013–2014; wpsar vol 12, no 4, 2021 | doi: 10.5365/wpsar.2021.12.4.863https://ojs.wpro.who.int/ 3 a. baumannii surveillance in the philippinesargimon et al fig. 1. annual resistance rates of acinetobacter baumannii to different antibiotics, 2000–2017 a. ipm: imipenem; mem: meropenem; caz: ceftazidime; cro: ceftriaxone. b. sam: ampicillin-sulbactam; tzp: piperacillin-tazobactam; sxt: sulfamethoxazole-trimethoprim. c. amk: amikacin; gen: gentamicin; cip: ciprofloxacin. reads to the reference genome a. baumannii strain atcc 17978 (genbank accession cp000521), as previously described.9 annotated assemblies were produced from short-read illumina data as previously described.11 we derived in silico the multilocus sequence type of the isolates from wgs. the sequence types were determined from assemblies using pathogenwatch (https://pathogen.watch/) or from sequence reads using ariba12 and the a. baumannii database hosted san diego, ca, usa) with 100–base pair paired-end reads. raw sequence data were deposited in the european nucleotide archive under the study accession prjeb17615. run accessions are provided through the links to microreact projects in the figure legends. bioinformatics analysis genome quality was assessed based on metrics produced for assemblies, annotation files and the alignment of the wpsar vol 12, no 4, 2021 | doi: 10.5365/wpsar.2021.12.4.863 https://ojs.wpro.who.int/4 argimon et ala. baumannii surveillance in the philippines a bgh: baguio general hospital and medical center; cmc: cotabato regional hospital and medical center; cvm: cagayan valley medical center; dmc: southern philippines medical center; feu: far eastern university hospital; gmh: governor celestino gallares memorial hospital; jlm: jose b. lingad memorial regional hospital; mar: mariano marcos memorial hospital and medical center; mmh: corazon locsin montelibano memorial regional hospital; nki: national kidney and transplant institute; nmc: northern mindanao medical center; rmc: rizal medical center; slh: san lazaro hospital; stu: university of sto. tomas hospital; vsm: vicente sotto memorial medical center; zmc: zamboanga city medical center. b amk: amikacin; caz: ceftazidime; cip: ciprofloxacin; cro: ceftriaxone; gen: gentamicin; ipm: imipenem; sam: ampicillin-sulbactam; sxt: trimethoprim-sulfamethoxazole; tzp: piperacillin-tazobactam. table 1. total number of a. baumannii isolates analysed by the antimicrobial resistance surveillance program (arsp) and referred to the antimicrobial resistance surveillance reference laboratory (arsrl) during 2013 and 2014, isolates submitted for whole-genome sequencing, and high-quality a. baumannii genomes obtained, discriminated by sentinel site and amr profile. number of isolates 2013 2014 total a. baumannii total arsp 2327 2927 5254 a. baumannii referred to arsrl 155 290 445 a. baumannii submitted for wgs 59 58 117 a. baumannii high-quality genomes 58 50 108 by sentinel sitea bgh 4 6 10 cmc 0 1 1 cvm 1 0 1 dmc 6 2 8 feu 0 1 1 gmh 5 1 6 jlm 0 2 2 mar 11 3 14 mmh 2 4 6 nki 1 1 2 nmc 1 1 2 rmc 1 0 1 slh 0 2 2 stu 3 3 6 vsm 13 19 32 zmc 10 4 14 by amr profileb caz cro ipm sam tzp gen amk cip sxt 48 36 84 caz cro ipm sam tzp gen amk cip 0 6 6 cro ipm sam tzp amk 3 1 4 caz cro ipm sam tzp gen cip 0 3 3 susceptible 1 1 2 caz cro sam tzp gen cip sxt 1 0 1 ipm 0 1 1 caz cro ipm sam tzp amk cip sxt 1 0 1 cro ipm tzp amk 1 0 1 caz cro sam tzp gen amk 1 0 1 ipm tzp 0 1 1 caz cro ipm sam tzp gen cip sxt 1 0 1 caz cro ipm sam tzp 1 0 1 caz cro ipm tzp 0 1 1 wpsar vol 12, no 4, 2021 | doi: 10.5365/wpsar.2021.12.4.863https://ojs.wpro.who.int/ 5 a. baumannii surveillance in the philippinesargimon et al databases, a curated database of acquired resistance genes22 and the comprehensive antibiotic resistance database (card).23 point mutations were identified on gyrase and topoisomerase genes with card and ariba, and corroborated with a literature search. the presence of the insertion sequences isaba1 (genbank accession ay758396) and isaba125 (genbank accession ay751533) upstream of the ampc gene was examined with ismapper v. 2.0.1 (24) using the reference genome of a. baumannii a1 (genbank accession cp010781) and default parameters. genomic predictions of resistance were derived from the presence of known amr genes and mutations identified in the genome sequences. the genomic predictions of amr (the test) were compared with the phenotypic results (the reference), and the concordance between the two methods was computed for each of 7 antibiotics (756 total comparisons). for comparison purposes, isolates with either a resistant or an intermediate phenotype were considered nonsusceptible. an isolate with the same outcome for both the test and the reference (i.e. both susceptible or both nonsusceptible) was counted as a concordant isolate. the concordance was the number of concordant isolates over the total number of isolates assessed (expressed as a percentage). all project data, including inferred phylogenies, amr predictions and metadata are available through the web application microreact (http://microreact.org). results demographic and clinical characteristics of the isolates out of the 117 a. baumannii genomes sequenced, 7 were excluded based on their quality, and 2 were identified in silico as acinetobacter pittii (table 1). the demographic and clinical characteristics of the remaining 108 a. baumannii isolates are summarized in table 2. the age of the patients ranged from <1 year to 92 years old, with 31.48% of the isolates (n = 34) from patients aged ≥65 years. altogether 62.03% of the isolates (n = 67) were from males. the majority of the isolates were from inpatients (99.07%; n = 107) and were classified as being from a hospital-acquired infection (76.85%; n = 83). respiratory samples (tracheal aspirates and sputum) accounted for 55.56% of the specimens (n = 60). at pubmlst.org.13 the isolates were assigned to international clones based on their sequence types, as previously described.14–17 evolutionary relationships between isolates were inferred from single-nucleotide polymorphisms (snps) by mapping the paired-end reads to the reference genomes of a. baumannii strain a1 (accession cp010781) or ac29 (st195, cc92, accession cp007535), as described in detail previously.9 mobile genetic elements were masked in the alignment of pseudogenomes with a script available at https://github.com/sanger-pathogens/ remove_blocks_from_aln. alignments of snp positions were inferred with snp-sites v. 2.4.1 (https://github. com/sanger-pathogens/snp-sites).18 for the phylogenies of cc92 genomes, recombination regions detected with gubbins19 in the alignment of pseudogenomes were also removed. maximum likelihood phylogenetic trees were generated with raxml v. 8.28,20 based on the generalised time reversible model with the gamma method of correction for among-site rate variation and 100 bootstrap replications. pairwise snp differences between primary isolates belonging to the same or different hospitals were calculated from alignments of snp positions with a script available at https://github. com/simonrharris/pairwise_difference_count. to contextualize the philippine genomes, global a. baumannii genomes with geolocation data and an isolation date mainly between 2007 and 2017, for which raw illumina paired-end sequence data were available at the european nucleotide archive, were downloaded, assembled and underwent quality control as described above. evolutionary relationships between global genomes and those from this study were inferred from an alignment of snp positions obtained after mapping the reads to the complete genome of strain a1 and masking regions with mobile genetic elements, as described above. the tree of 977 genomes was obtained using an approximately maximum–likelihood phylogenetic method with fasttree.21 the tree of 573 global cc92 genomes was inferred with raxml from an alignment of snp sites obtained after mapping the genomes to the complete genome of strain ac29 and removing mobile genetic elements and recombination regions, as described above. known amr determinants were identified from raw sequence reads using ariba12 and two different amr wpsar vol 12, no 4, 2021 | doi: 10.5365/wpsar.2021.12.4.863 https://ojs.wpro.who.int/6 argimon et ala. baumannii surveillance in the philippines concordance between phenotypic and genotypic antimicrobial resistance the genotypic predictions of amr were highly concordant with the phenotypic results (overall concordance, 94.97%; table 3). the concordance for imipenem was 98.15%, and of the 104 resistant isolates, 97 isolates from 14 hospitals (93.26%) carried the class d β-lactamase gene blaoxa-23 alone or in combination with blaoxa-235 (n = 1). the remaining isolates carried blandm-6 (n = 3), blandm-1 (n = 2) or blaoxa-72 (n = 2). one isolate had no known acquired carbapenemase. of the 104 isolates resistant to imipenem, 89 (85.58%) were classified as xdr and 13 (12.50%) as mdr; also noted were the presence of the arma gene encoding a 16s ribosomal rna methyltransferase, conferring broad-spectrum resistance to aminoglycosides in 54 isolates, and the co-occurrence of mutations in gyra and parc, conferring resistance to fluoroquinolones in 95 isolates (table 3). the mobilized colistin resistance gene (mcr) was not detected. the isolates that were nonsusceptible to the third-generation cephalosporins ceftazidime (n = 99) or ceftriaxone (n = 104), or both, carried either the insertion sequence isaba1 upstream of the chromosomal blaampc gene (n = 67), two or three copies of the blaampc gene (n = 22), the extended-spectrum β-lactamase genes blaper-1 (n = 4) and blactx-m-15 (n = 1) or the carbapenemase gene blandm (n = 5). most of the false negative calls for ceftazidime (n = 3) and ceftriaxone (n = 8) (table 3), for which no resistance mechanism was detected, coincided with intermediate susceptibility (n = 2 and n = 5, respectively). genotypic findings in silico genotyping multilocus sequence type was predicted in silico from the wgs data of the 108 a. baumannii isolates. a total of 22 different sequence types were identified from this data set as per the oxford scheme,19 7 of which were novel and are now identified as st2197, 2199, 2220, 2317, 2318, 2319 and 2320. the population was dominated by cc92 (n = 61), represented mainly by st195 (n = 29) and st208 (n = 23). cc92 was found at 13 of the 16 sentinel sites, with st195 and st208 spread geographically across 8 and 7 sentinel sites, respectively. in contrast, st369 (n = 5) was found in only one site. the arma gene was found only in isolates belonging to cc92 (n = 54) and from 11 hospitals. seven of the eight hospitals represented by six or more sequenced isolates showed clonal diversity, with at least two different circulating sequence types (table 4), albeit with similar or identical resistance profiles. in contrast, all isolates collected by the baguio general hospital and medical center (bgh) belonged to sequence type 208. population structure of a. baumannii in the philippines the phylogenetic tree of 108 a. baumannii genomes showed that the population was composed of welldefined clades that matched the distribution of the sequence types. the two main clonal groups were ic1 and ic2 (i.e. cc92; fig. 2a), with a minor representation of ic8 and ic7. isolates belonging to international clones were mostly xdr and are known to be responsible for disseminating amr globally. the carbapenemase gene blaoxa-23 was found consistently in ic1 and ic2 genomes, and more sporadically in ic8 and nonclonal genomes. in contrast, the carbapenemase gene blandm-6 was found exclusively in three ic8 genomes from corazon locsin montelibano memorial regional hospital (mmh), while blandm-1 and blaoxa-72 were found only sporadically. notably, isolates carrying isaba1 inserted in the promoter of blaampc belonged to st449 (ic1) or to cc92 (ic2), while isolates carrying two or three copies of the blaampc gene all belonged to a novel sequence type (now st2199) found in the vicente sotto memorial medical center (vsm) in the visayas region and the zamboanga city medical center in the mindanao region (fig. 2a). the phylogenetic tree of 61 genomes from the prevalent xdr cc92 clone showed that most isolates were grouped into two clades represented by st208 and single locus variant st425 (bootstrap support, 96%) and by st195 and single locus variant st369 (bootstrap support, 100%) (fig. 2b). both st208–st425 and st195–st369 were found in hospitals from all three island groups (luzon in the north, visayas in the centre and mindanao in the south), but their geographical distribution showed little overlap. the phylogeographical signal suggested there were both local outbreaks and interhospital dissemination (fig. 2b). we investigated this further by counting the number of pairwise, nonrecombinant snp differences between primary isolates from the same or different hospitals. first, we wpsar vol 12, no 4, 2021 | doi: 10.5365/wpsar.2021.12.4.863https://ojs.wpro.who.int/ 7 a. baumannii surveillance in the philippinesargimon et al table 2. demographic and clinical characteristics of 108 sequenced and confirmed a. baumannii isolates collected from 16 arsp sites characteristic no. isolates sex male 67 female 41 age (in years) <1 6 1–4 11 5–14 3 15–24 6 25–34 7 35–44 9 45–54 12 55–64 20 65–80 26 ≥81 8 patient type in-patient 107 out-patient 1 specimen origin community-acquired 25 hospital-acquired 83 submitted as* carbapenem-resistant 104 non carbapenem-resistant 4 specimen type aspirate 1 blood** 21 bone 1 catheter 1 catheter, central 1 cerebrospinal fluid** 13 sputum 10 tracheal aspirate 50 ulcer 1 urine 4 wound 5 * specimen origin is computed based on admission date of the patient ** specimen types considered as invasive isolates. identified three intrahospital clusters (bootstrap support, 100%) of closely related isolates from bgh (st208, 2–35 pairwise snps; n = 9), southern philippines medical center (dmc, st208–st425, 1–6 pairwise snps; n = 8) and mariano marcos memorial hospital and medical center (mar, st195, 0–3 pairwise snps; n = 6). the isolates within each of the three clusters carried identical or almost identical repertoires of resistance determinants, further supporting their clonal relationship. the isolation dates spanning more than 12 months suggested that these clonal lineages are possibly endemic to the hospitals, although regular introduction by colonized patients cannot be ruled out. next, we identified two clusters of closely related isolates from two or more hospitals. one cluster contained nine st195 genomes from two hospitals in the visayas region (mmh and vsm), with a median of only 5 pairwise snp differences (range, 1–17) between isolates from different hospitals. the second one contained 18 st195–st369 genomes from six hospitals across three different regions, with a median of 25 pairwise snp differences (range, 1–53). the clonal relationship between isolates from different hospitals within these two clusters is also supported by a similar complement of resistance determinants. a. baumannii from the philippines in the global context to place the retrospective collection of a. baumannii isolates from the philippines in the context of the global population of this pathogen, we compared our genomes to 931 genomes publicly available from sequence data archives that have linked geographical and temporal information. the isolates were collected between 1982 and 2016, with 94.7% of the isolates collected from 2007 onwards. the public genomes belonged to 16 countries and were assigned to 154 sequence types. the population represented by the global genomes was substantially skewed towards genomes from the united states (40.5%) and belonging to cc92 (58.6%). the philippine genomes were found in multiple branches of the tree, as expected by the diversity of sequence types, but wpsar vol 12, no 4, 2021 | doi: 10.5365/wpsar.2021.12.4.863 https://ojs.wpro.who.int/8 argimon et ala. baumannii surveillance in the philippines antibiotic class antibiotic isolates tested resistant isolates false positive false negative % concordance resistance genes/snps 3rd gen cephalosporin ceftazidime 108 99 0 3 97.22 isaba1-blaampc, 2+ copies of blaampc, blactx-m-15, blaper-1, blandm-1/6 3rd gen cephalosporin ceftriaxone 108 104 0 8 92.59 carbapenem imipenem 108 104 1 1 98.15 blaoxa-23, blandm-1/6, blaoxa-235, blaoxa-72 aminoglycoside gentamicin 108 96 0 10 90.74 aac(3')-ia, aac(3')-ii, ant(2’’)-ia, arma aminoglycoside amikacin 108 97 6 0 94.44 aac(6')-ib, aph(3)-vi, arma fluoroquinolone ciprofloxacin 108 96 0 1 99.07 gyra_s81l, parc_s84l, qnra1 folate pathway antagonist trimethoprim sulfamethoxazole 108 87 1 7 92.59 sul1, sul2, dfra14, dfra18 table 3. comparison between antimicrobial susceptibility testing results and genotypic resistance for 108 a. baumannii isolates. they mostly formed discreet clusters within each branch without genomes from other countries interspersed (fig. 3a). this suggests that the establishment of each clone in the philippines is the result of one or only a few founding events. to investigate in more detail the relationship to global genomes within cc92, a tree of 573 genomes was inferred from the alignment of nonrecombinant snps (fig. 3b). the st195–st369 genomes from the philippines clustered with genomes from china, malaysia, singapore, the united states and viet nam, while the st208–st425 genomes were related to genomes from china, puerto rico and the united states. however, the strong phylogeographical signal displayed by both the st195–st369 and the st208–st425 subtrees suggested a single founder event in the philippines for each clone, followed by their expansion. discussion this study reports on the combined genomic and laboratory-based surveillance of a. baumannii in the philippines during 2013–2014. the prevalence of carbapenem-resistant a. baumannii during this period was above 40%, and we therefore focused on characterizing these organisms. in a. baumannii, only low-level carbapenem resistance is mediated by the chromosomal oxa-51-like carbapenemase. the class d oxa-23 carbapenemase was the most prevalent acquired carbapenem resistance mechanism identified in this study, in line with global trends.25 we also detected representatives from the oxa-235-like (blaoxa-235) and the oxa-40-like (blaoxa-72) groups, albeit in low frequency. no oxa-58-like carbapenemases were detected, as previously reported from other asia–pacific nations.26 importantly, we also detected the presence of the class b metallo-β-lactamases ndm-1 and ndm-6, which, unlike oxa-23, confer resistance to extended-spectrum cephalosporins as well as carbapenems. a. baumannii harbouring ndm-1 has been sporadically reported previously from other countries,27–29 but ndm-6-carrying a. baumannii has only recently been reported from spain.30 resistance to extended-spectrum cephalosporins was mainly explained by the insertion of isaba1 in the promoter of the intrinsic gene blaampc, which has been shown to lead to increased expression of the encoded cephalosporinase.31 identification of this mechanism represents an additional in silico query of the genomes, which is burdensome in the context of a public health reference laboratory, but omitting it would lead to high major error rates for genomic predictions of resistance to extended-spectrum cephalosporins. both ic1 and ic2, which are responsible for the spread of mdr and xdr phenotypes worldwide,25,32 were found in the philippines. however, ic2 was the predominant clonal type of a. baumannii in our study population, with st195 and st208 and their respective single locus variants found throughout the country. the global phylogenetic tree showed that these two lineages diverged before their establishment in the philippines. the genetic relatedness of isolates from different hospitals and their similar complements of resistance determinants wpsar vol 12, no 4, 2021 | doi: 10.5365/wpsar.2021.12.4.863https://ojs.wpro.who.int/ 9 a. baumannii surveillance in the philippinesargimon et al table 4. the summary of distribution, sequence types (st), resistance profiles and antimicrobial resistance genes and mutations of the 108 isolates collected from 16 antimicrobial resistance surveillance program sentinel sites. sitea no. of isolates no. of sts st (n) resistance profilesb (n) acquired resistance mechanisms (n) bgh 10 1 208 (10) caz cro ipm sam tzp gen amk cip sxt (9) isaba1-blaampc, blaoxa-23, aac(6’)-ib, aph(3’)-vi, arma, gyra_s81l, parc_s84l, sul1, sul2 (6) isaba1-blaampc, blaoxa-23, aac(6’)-ib, aph(3’)-vi, arma, gyra_s81l, parc_s84l, sul1 (2) isaba1-blaampc, blaoxa-23, aac(6’)-ib, arma, gyra_ s81l, parc_s84l, sul1, sul2 (1) caz cro ipm sam tzp amk cip sxt (1) isaba1-blaampc, blaoxa-23, aph(3’)-vi, gyra_s81l, parc_s84l, sul2 (1) cmc 1 1 2319 (1) caz cro ipm tzp (1) blaoxa-72 (1) cvm 1 1 957 (1) caz cro sam tzp gen amk (1) blaper-1, aac(3)-ii, aph(3’)-vi, sul1 (1) dmc 8 2 208 (7) caz cro ipm sam tzp gen amk cip sxt (7) isaba1-blaampc, blaoxa-23, aac(6’)-ib, arma, gyra_ s81l, parc_s84l, sul1 (7) 425 (1) caz cro ipm sam tzp gen amk cip sxt (1) isaba1-blaampc, blaoxa-23, aac(6’)-ib, arma, gyra_ s81l, parc_s84l, sul1 (1) feu 1 1 208 caz cro ipm sam tzp gen cip (1) isaba1-blaampc, blaoxa-23, gyra_s81l, parc_s84l (1) gmh 6 6 2174 (1) cro ipm sam tzp amk (1) blaoxa-23, aph(3’)-vi (1) 2197 (1) cro ipm sam tzp amk blaoxa-23, aph(3’)-vi (1) 2318 (1) cro ipm sam tzp amk blaoxa-23, aph(3’)-vi (1) 2320 (1) cro ipm sam tzp amk blaoxa-23, aph(3’)-vi (1) 2317 (1) cro ipm tzp amk blaoxa-23, aph(3’)-vi (1) nd (1) caz cro ipm sam tzp blandm-1, aph(3’)-vi (1) jlm 2 2 195 (1) caz cro ipm sam tzp gen amk cip (1) isaba1-blaampc, blaoxa-23, arma, gyra_s81l, parc_s84l (1) 208 (1) caz cro ipm sam tzp gen amk cip sxt (1) isaba1-blaampc, blaoxa-23, aac(6’)-ib, arma, gyra_ s81l, parc_s84l, sul1 (1) mar 14 5 195 (6) caz cro ipm sam tzp gen amk cip sxt (6) isaba1-blaampc, blaoxa-23, arma, gyra_s81l, parc_s84l, sul2 (5) isaba1-blaampc, blaoxa-23, arma, gyra_s81l, parc_s84l (1) 449 (5) caz cro ipm sam tzp gen amk cip sxt (5) isaba1-blaampc, blaoxa-23, ant(2’’)-ia, aph(3’)-vi, gyra_s81l, sul1 (5) 447 (1) caz cro ipm sam tzp gen amk cip sxt (1) blandm-1, aph(3’)-vi, gyra_s81l, parc_s84l, sul2 (1) 391* (1) caz cro ipm sam tzp gen amk cip sxt (1) blactx-m-15, blaper-1, blaoxa-23, aac(3)-ii, aac(6’)-ib, aph(3’)-vi, gyra_s81l, parc_s84l, qnra1, sul1, sul2, dfra14 (1) 2197 (1) susceptible blaoxa-23, aph(3’)-vi (1) mmh 6 2 195 (3) caz cro ipm sam tzp gen amk cip sxt (3) isaba1-blaampc, blaoxa-23, arma, gyra_s81l, parc_s84l (3) 642 (3) caz cro ipm sam tzp gen amk cip (2) blandm-6, aph(3’)-vi, gyra_s81l, parc_s84l (2) caz cro ipm sam tzp gen cip blandm-6, aph(3’)-vi, gyra_s81l, parc_s84l nki 2 2 195 (1) caz cro ipm sam tzp gen amk cip sxt (1) isaba1-blaampc, blaoxa-23, arma, gyra_s81l, parc_s84l, sul2 (1) 208 (1) caz cro ipm sam tzp gen amk cip sxt (1) isaba1-blaampc, blaoxa-23, aph(3’)-vi, arma, gyra_ s81l, parc_s84l, sul2 (1) wpsar vol 12, no 4, 2021 | doi: 10.5365/wpsar.2021.12.4.863 https://ojs.wpro.who.int/10 argimon et ala. baumannii surveillance in the philippines sitea no. of isolates no. of sts st (n) resistance profilesb (n) acquired resistance mechanisms (n) nmc 2 1 208 caz cro ipm sam tzp gen amk cip sxt (1) isaba1-blaampc, blaoxa-23, aph(3’)-vi, gyra_s81l, parc_s84l, sul2 (1) caz cro sam tzp gen cip sxt (1) isaba1-blaampc, aac(3)-ia, gyra_s81l, parc_ s84l, sul1, sul2 (1) rmc 1 1 1128 caz cro ipm sam tzp gen amk cip sxt (1) isaba1-blaampc, blaoxa-23, aph(3’)-vi, arma, gyra_ s81l, parc_s84l, sul1, sul2 (1) slh 2 2 195 (1) caz cro ipm sam tzp gen amk cip sxt (1) isaba1-blaampc, blaoxa-23, arma, gyra_s81l, parc_s84l, sul2 (1) 642 (1) caz cro ipm sam tzp gen amk cip sxt (1) blaoxa-23, blaoxa-235, aac(6’)-ib, aph(3’)-vi, gyra_ s81l, parc_s84l, sul1, sul2, dfra18 (1) stu 6 3 195 (3) caz cro ipm sam tzp gen amk cip sxt (3) isaba1-blaampc, blaoxa-23, arma, gyra_s81l, parc_s84l, sul2 (2) isaba1-blaampc, blaoxa-23, arma, gyra_s81l, parc_s84l, sul1, sul2 (1) 1289 (2) caz cro ipm sam tzp gen amk cip sxt (2) isaba1-blaampc, blaper-1, blaoxa-23, aac(3)-ia, aac(6’)-ib, aph(3’)-vi, gyra_s81l, parc_s84l, sul1, sul2, dfra18 (1) isaba1-blaampc, blaper-1, blaoxa-23, aac(3)-ia, aac(6’)-ib, gyra_s81l, parc_s84l, sul1, sul2, dfra18 (1) 449 (1) caz cro ipm sam tzp gen amk cip sxt (1) isaba1-blaampc, blaoxa-23, ant(2’’)-ia, aph(3’)-vi, gyra_s81l, sul1 (1) vsm 32 6 2199 (20) caz cro ipm sam tzp gen amk cip sxt (19) 2 copies of blaampc, blaoxa-23, aac(3)-ia, aph(3’)vi, gyra_s81l, parc_s84l, sul1 (15) 2 copies of blaampc, blaoxa-23, aac(3)-ia, aph(3’)vi, gyra_s81l, parc_s84l, sul1 (2) 2 copies of blaampc, aac(3)-ia, aph(3’)-vi, gyra_ s81l, parc_s84l, sul1 (1) 2 copies of blaampc, blaoxa-23, aph(3’)-vi, gyra_ s81l, parc_s84l, sul1 (1) caz cro ipm sam tzp gen cip sxt (1) 2 copies of blaampc, blaoxa-23, aac(3)-ia, aph(3’)vi, gyra_s81l, parc_s84l, sul1 (1) 195 (7) caz cro ipm sam tzp gen amk cip sxt (4) isaba1-blaampc, blaoxa-23, arma, gyra_s81l, parc_s84l (2) isaba1-blaampc, blaoxa-23, aac(3)-ia, arma, gyra_ s81l, parc_s84l, sul1 (1) isaba1-blaampc, blaoxa-23, arma, gyra_s81l, parc_s84l, sul2 (1) caz cro ipm sam tzp gen amk cip (2) isaba1-blaampc, blaoxa-23, arma, gyra_s81l, parc_s84l (2) caz cro ipm sam tzp gen cip (1) isaba1-blaampc, blaoxa-23, arma, gyra_s81l, parc_s84l (1) 310 (2) caz cro ipm sam tzp gen amk cip sxt (1) blaoxa-23, aph(3’)-vi (1) ipm tzp (1) blaoxa-23, aph(3’)-vi (1) 208 (1) caz cro ipm sam tzp gen amk cip sxt (1) isaba1-blaampc, blaoxa-23, aph(3’)-vi, gyra_s81l, parc_s84l, sul2 (1) 229 (1) ipm (1) blaoxa-72 (1) 1418 (1) caz cro ipm sam tzp gen amk cip (1) 2 copies of blaampc, blaoxa-23, ant(2’’)-ia, aph(3’)vi, gyra_s81l, parc_s84l (1) wpsar vol 12, no 4, 2021 | doi: 10.5365/wpsar.2021.12.4.863https://ojs.wpro.who.int/ 11 a. baumannii surveillance in the philippinesargimon et al sitea no. of isolates no. of sts st (n) resistance profilesb (n) acquired resistance mechanisms (n) zmc 14 3 195 (7) caz cro ipm sam tzp gen amk cip sxt (7) isaba1-blaampc, blaoxa-23, arma, gyra_s81l, parc_s84l, sul2 (7) 369 (5) caz cro ipm sam tzp gen amk cip sxt (5) isaba1-blaampc, blaoxa-23, arma, gyra_s81l, parc_s84l, sul2 (5) 2199 (1) caz cro ipm sam tzp gen amk cip sxt 2 copies of blaampc, blaoxa-23, aac(3)-ia, aph(3’)vi, gyra_s81l, parc_s84l, sul1 2220 (1) susceptible none detected a bgh: baguio general hospital and medical center; cmc: cotabato regional hospital and medical center; cvm: cagayan valley medical center; dmc: southern philippines medical center; feu: far eastern university hospital; gmh: governor celestino gallares memorial hospital; jlm: jose b. lingad memorial regional hospital; mar: mariano marcos memorial hospital and medical center; mmh: corazon locsin montelibano memorial regional hospital; nki: national kidney and transplant institute; nmc: northern mindanao medical center; rmc: rizal medical center; slh: san lazaro hospital; stu: university of sto. tomas hospital; vsm: vicente sotto memorial medical center; zmc: zamboanga city medical center. b amk: amikacin; caz: ceftazidime; cip: ciprofloxacin; cro: ceftriaxone; gen: gentamicin; ipm: imipenem; sam: ampicillin-sulbactam; sxt: trimethoprim-sulfamethoxazole; tzp: piperacillin-tazobactam. support the notion that their subsequent success was the result of clonal expansion and in-country geographical dissemination, rather than multiple introductions. this highlights the need for concerted infection prevention and control measures to contain the spread of high-risk clones. however, the limited number and disparate sampling of genomes from other countries in the region and the selective referral of carbapenem-resistant isolates to the reference laboratory by the sentinel sites limited our ability to capture the dynamics of these clones. we also identified three st195 and st208 intrahospital clusters spanning more than 12 months each. resistance to antimicrobial drugs and to desiccation contribute to the survival of a. baumannii in the hospital environment,1 and cross-contamination of hospital surfaces with mdr strains has been documented, particularly in the areas surrounding colonized or infected patients.33,34 the arsp does not currently include environmental samples, and thus it was not possible to connect the persistence of the intrahospital clusters to environmental contamination, which is a limitation of our study. outbreaks of a. baumannii with blaoxa-23, including of st195 and st208, have been reported from several countries,35–37 and our study identified potential hospital outbreaks retrospectively. the resolution afforded by wgs was in stark contrast to the uniform resistance profiles of the isolates in our study, thus making cluster detection based on wgs rather than resistance profiles, of particular utility for carbapenem-resistant a. baumannii. the assignment of isolates to an outbreak based on their genetic distance is key for effective patient containment and infection control during an ongoing investigation. out of the three intrahospital ic2 clusters detected, the st208 cluster from bgh displayed more genetic diversity than the other two, based on the number of pairwise snp differences, opening the possibility that more than one closely related strain was circulating in the hospital. however, the absence of data on patient movement precluded the epidemiological investigation that would have aided in delineating the outbreaks, another limitation of our study. in addition, while the pairwise snp differences are similar to those reported in other studies,36,38–40 snp thresholds are difficult to assess by comparison due to methodological differences, such as the use of coreversus whole-genome snps, the choice of reference genome for reference-based mapping of short reads, and the inclusion or exclusion of snps associated with recombination regions. in conclusion, our retrospective genomic epidemiology study of carbapenem-resistant a. baumannii in the philippines revealed that ic2 with oxa-23 is the main source of the increasing carbapenem resistance in the philippines and that breaches in infection control and prevention likely contributed to its dissemination. wgs proved a useful tool for improving surveillance of a. baumannii. funding this work was supported by a newton fund award from the medical research council (uk) mr/n019296/1 and the philippine council for health research and development. this work was also partially supported by research grant u01ca207167 from the u.s. national institutes of health. the contents are solely the responsibility of the authors and do not necessarily represent the official views of the funders. the funders had no role in study design, data collection and analysis, or decision to pubwpsar vol 12, no 4, 2021 | doi: 10.5365/wpsar.2021.12.4.863 https://ojs.wpro.who.int/12 argimon et ala. baumannii surveillance in the philippines figure 2. genomic surveillance of a. baumannii from the philippines 2013–2014. a) phylogenetic tree of 108 isolates inferred from an alignment of 168,916 snp sites obtained after mapping the genomes to the complete genome of strain a1 and masking mges from the alignment. the tree leaves are coloured by sentinel site and indicated on the map (left panels, top: philippines, bottom: detail of the national capital region). the tree is annotated with the isolates assignment to international clones and sequence type, the susceptibility testing results and the presence of acquired carbapenemase genes (st). the full data are available at https://microreact.org/project/arsp_aba_2013-2014. b) phylogenetic tree of 61 cc92 genomes, inferred from an alignment of 618 snp sites after mapping the genomes to reference ac29 and removing mges and recombination regions. the tree leaves are coloured by sentinel site, as indicated on the map from fig. 2a. the tree blocks represent the distribution of sequence types (sts) and of acquired a) phylogenetic tree of 108 isolates inferred from an alignment of 168 916 single nucleotide polymorphism (snp) sites obtained after mapping the genomes to the complete genome of strain a1 and masking mobile genetic elements from the alignment. the tree leaves are coloured by sentinel site and indicated on the map (top: philippines; bottom: detail of the national capital region). the tree is annotated with the isolates assigned to international clones and sequence types, the results of susceptibility testing and the presence of acquired carbapenemase genes. amk: amikacin; amr: antimicrobial resistance; caz: ceftazidime; cip: ciprofloxacin; cro: ceftriaxone; gen: gentamicin; ic: international clone; ipm: imipenem; sam: ampicillin-sulbactam; st: sequence type; sxt: sulfamethoxazole-trimethoprim; tzp: piperacillin-tazobactam. the full data are available at https://microreact.org/project/arsp_aba_2013-2014. b) phylogenetic tree of 61 clonal complex 92 (cc92) genomes, inferred from an alignment of 618 snp sites after mapping the genomes to reference ac29 and removing mobile genetic elements and recombination regions. the tree leaves are coloured by sentinel site, as indicated on the map in panel (a). the tree blocks represent the distribution of sts and of acquired resistance genes and mutations. three hospital clusters are annotated on the tree with the hospital code (bgh: baguio general hospital and medical center; dmc: southern philippines medical center; mar: mariano marcos memorial hospital and medical center), and their isolation dates are indicated on the timeline. two multihospital clusters are annotated with an asterisk. the full data are available at https://microreact.org/project/arsp_aba_cc92_2013-2014. the scale bars represent the number of snps per variable site. in t. c lo ne s t c a z c r o ip m s a m t z p g e n a m k c ip s x t bl ao x a -2 3 bl ao x a -7 2 bl ao x a -2 3 5 bl an d m bl ap e r -1 bl ac t x -m -1 5 bl aa m p c fig. 2. genomic surveillance of a. baumannii from the philippines, 2013–2014 bl a o x a -2 3 bl a p e r -1 bl a t e m -1 wpsar vol 12, no 4, 2021 | doi: 10.5365/wpsar.2021.12.4.863https://ojs.wpro.who.int/ 13 a. baumannii surveillance in the philippinesargimon et al fig. 3. a. baumannii from the philippines in global context a) phylogenetic tree of 977 isolates from the philippines (blue nodes) and from 15 other countries inferred from 305 031 snp positions. the major sts and ccs are labelled in black if represented by genomes of this study, or in grey if they are not. the data are available at https://microreact.org/project/arsp_aba_global. b) phylogenetic tree of 573 cc92 isolates inferred from an alignment of 5890 snp positions. the tree leaves are coloured by country as indicated on the map. the tree is annotated with the distribution of acquired carbapenemase genes (red: present, grey: absent). the data are available at https://microreact.org/project/arsp_cc92_ global. the scale bars represent the number of snps per variable site. viet nam blaoxa-23, blaoxa-72, blandm-1, blakpc-2 st (oxford) blaoxa-23 blaoxa-72 blandm-1 blakpc-2 wpsar vol 12, no 4, 2021 | doi: 10.5365/wpsar.2021.12.4.863 https://ojs.wpro.who.int/14 argimon et ala. baumannii surveillance in the philippines 10. m100s: performance standards for antimicrobial susceptibility testing, twenty-sixth edition. wayne (pa): clinical laboratory standards institute; 2016. 11. page aj, de silva n, hunt m, quail ma, parkhill j, harris sr, et al. robust high-throughput prokaryote de novo assembly and improvement pipeline for illumina data. microb genom. 2016;2(8):e000083. doi:10.1099/mgen.0.000083 12. hunt m, mather ae, sanchez-buso l, page aj, parkhill j, keane ja, et al. ariba: rapid antimicrobial resistance genotyping directly from sequencing reads. microb genom. 2017;3(10):e000131. doi:10.1099/mgen.0.000131 13. jolley ka, bray je, maiden mcj. open-access bacterial population genomics: bigsdb software, the pubmlst.org website and their applications. wellcome open res. 2018;3:124. doi:10.12688/ wellcomeopenres.14826.1 14. diancourt l, passet v, nemec a, dijkshoorn l, brisse s. the population structure of acinetobacter baumannii: expanding multiresistant clones from an ancestral susceptible genetic pool. plos one. 2010;5(4):e10034. doi:10.1371/journal. pone.0010034 15. gaiarsa s, batisti biffignandi g, esposito ep, castelli m, jolley ka, brisse s, et al. comparative analysis of the two acinetobacter baumannii multilocus sequence typing (mlst) schemes. front microbiol. 2019;10:930. doi:10.3389/fmicb.2019.00930 16. higgins pg, prior k, harmsen d, seifert h. development and evaluation of a core genome multilocus typing scheme for wholegenome sequence-based typing of acinetobacter baumannii. plos one. 2017;12(6):e0179228. doi:10.1371/journal. pone.0179228 17. tomaschek f, higgins pg, stefanik d, wisplinghoff h, seifert h. head-to-head comparison of two multi-locus sequence typing (mlst) schemes for characterization of acinetobacter baumannii outbreak and sporadic isolates. plos one. 2016;11(4):e0153014. doi:10.1371/journal.pone.0153014 18. page aj, taylor b, delaney aj, soares j, seemann t, keane ja, et al. snp-sites: rapid efficient extraction of snps from multi-fasta alignments. microb genom. 2016;2(4):e000056. doi:10.1099/ mgen.0.000056 19. croucher nj, page aj, connor tr, delaney aj, keane ja, bentley sd, et al. rapid phylogenetic analysis of large samples of recombinant bacterial whole genome sequences using gubbins. nucleic acids res. 2015;43(3):e15. doi:10.1093/nar/gku1196 20. stamatakis a. raxml version 8: a tool for phylogenetic analysis and post-analysis of large phylogenies. bioinformatics. 2014;30(9):1312–3. doi:10.1093/bioinformatics/btu033 21. price mn, dehal ps, arkin ap. fasttree 2 – approximately maximum-likelihood trees for large alignments. plos one. 2010;5(3):e9490. doi:10.1371/journal.pone.0009490 22. david s, reuter s, harris sr, glasner c, feltwell t, argimon s, et al. epidemic of carbapenem-resistant klebsiella pneumoniae in europe is driven by nosocomial spread. nat microbiol. 2019;4(11):1919–29. doi:10.1038/s41564-019-0492-8 23. mcarthur ag, waglechner n, nizam f, yan a, azad ma, baylay aj, et al. the comprehensive antibiotic resistance database. antimicrob agents chemother. 2013;57(7):3348–57. doi:10.1128/ aac.00419-13 24. hawkey j, hamidian m, wick rr, edwards dj, billman-jacobe h, hall rm, et al. ismapper: identifying transposase insertion sites in bacterial genomes from short read sequence data. bmc genomics. 2015;16:667. doi:10.1186/s12864-015-1860-2 25. zarrilli r, pournaras s, giannouli m, tsakris a. global evolution of multidrug-resistant acinetobacter baumannii clonal lineages. int j antimicrob agents. 2013;41(1):11–9. doi:10.1016/j.ijantimicag.2012.09.008 lish, or preparation of the manuscript. s.a. and d.m.a. were additionally supported by the national institute for health research (uk) global health research unit on genomic surveillance of amr (16_136_111) and by the centre for genomic pathogen surveillance. conflicts of interest the authors have no conflicting affiliations or financial or non-financial interests in the subject matter discussed in this manuscript. ethics statement ethical approval is not applicable. this study uses archived bacterial samples processed by arsp. no identifiable data were used in this study. references 1. peleg ay, seifert h, paterson dl. acinetobacter baumannii: emergence of a successful pathogen. clin microbiol rev. 2008;21(3):538–82. doi:10.1128/cmr.00058-07 2. chung dr, song jh, kim sh, thamlikitkul v, huang sg, wang h, et al. high prevalence of multidrug-resistant nonfermenters in hospital-acquired pneumonia in asia. am j respir crit care med. 2011;184(12):1409–17. doi:10.1164/rccm.2011020349oc 3. antimicrobial resistance surveillance program 2018 annual report. muntinlupa, philippines: antimicrobial resistance surveillance reference laboratory, research institute for tropical medicine, department of health; 2019. available from: https://arsp.com.ph/download/1041/, accessed 19 february 2021. 4. hsu ly, apisarnthanarak a, khan e, suwantarat n, ghafur a, tambyah pa. carbapenem-resistant acinetobacter baumannii and enterobacteriaceae in south and southeast asia. clin microbiol rev. 2017;30(1):1–22. doi:10.1128/cmr.masthead.30-1 5. kiratisin p, chongthaleong a, tan ty, lagamayo e, roberts s, garcia j, et al. comparative in vitro activity of carbapenems against major gram-negative pathogens: results of asia-pacific surveillance from the compact ii study. int j antimicrob agents. 2012;39(4):311– 6. doi:10.1016/j.ijantimicag.2012.01.002 6. lee ny, lee hc, ko ny, chang cm, shih hi, wu cj, et al. clinical and economic impact of multidrug resistance in nosocomial acinetobacter baumannii bacteremia. infect control hosp epidemiol. 2007;28(6):713–9. doi:10.1086/517954 7. kim dh, choi jy, kim hw, kim sh, chung dr, peck kr, et al. spread of carbapenem-resistant acinetobacter baumannii global clone 2 in asia and abar-type resistance islands. antimicrob agents chemother. 2013;57(11):5239–46. doi:10.1128/aac.00633-13 8. ellington mj, ekelund o, aarestrup fm, canton r, doumith m, giske c, et al. the role of whole genome sequencing in antimicrobial susceptibility testing of bacteria: report from the eucast subcommittee. clin microbiol infect. 2017;23(1):2–22. doi:10.1016/j. cmi.2016.11.012 9. argimón s, masim mal, gayeta jm, lagrada ml, macaranas pkv, cohen v, et al. integrating whole-genome sequencing within the national antimicrobial resistance surveillance program in the philippines. nat commun. 2020;11(1):2719. doi:10.1038/s41467-02016322-5 wpsar vol 12, no 4, 2021 | doi: 10.5365/wpsar.2021.12.4.863https://ojs.wpro.who.int/ 15 a. baumannii surveillance in the philippinesargimon et al 33. levin as, gobara s, mendes cm, cursino mr, sinto s. environmental contamination by multidrug-resistant acinetobacter baumannii in an intensive care unit. infect control hosp epidemiol. 2001;22(11):717–20. doi:10.1086/501852 34. thom ka, johnson jk, lee ms, harris ad. environmental contamination because of multidrug-resistant acinetobacter baumannii surrounding colonized or infected patients. am j infect control. 2011;39(9):711–5. doi:10.1016/j.ajic.2010.09.005 35. lopes bs, al-agamy mh, ismail ma, shibl am, al-qahtani aa, al-ahdal mn, et al. the transferability of blaoxa-23 gene in multidrugresistant acinetobacter baumannii isolates from saudi arabia and egypt. int j med microbiol. 2015;305(6):581–8. doi:10.1016/j. ijmm.2015.07.007 36. makke g, bitar i, salloum t, panossian b, alousi s, arabaghian h, et al. whole-genome-sequence-based characterization of extensively drug-resistant acinetobacter baumannii hospital outbreak. msphere. 2020;5(1):e00934-19. doi:10.1128/ msphere.00934-19 37. qu j, du y, yu r, lu x. the first outbreak caused by acinetobacter baumannii st208 and st195 in china. biomed res int. 2016;2016:9254907. doi:10.1155/2016/9254907 38. feng y, ruan z, shu j, chen cl, chiu ch. a glimpse into evolution and dissemination of multidrug-resistant acinetobacter baumannii isolates in east asia: a comparative genomics study. sci rep. 2016;6:24342. doi:10.1038/srep24342 39. fitzpatrick ma, ozer ea, hauser ar. utility of whole-genome sequencing in characterizing acinetobacter epidemiology and analyzing hospital outbreaks. j clin microbiol. 2016;54(3):593–612. doi:10.1128/jcm.01818-15 40. gramatniece a, silamikelis i, zahare i, urtans v, zahare i, dimina e, et al. control of acinetobacter baumannii outbreak in the neonatal intensive care unit in latvia: whole-genome sequencing powered investigation and closure of the ward. antimicrob resist infect control. 2019;8:84. doi:10.1186/s13756-019-0537-z 26. mendes re, bell jm, turnidge jd, castanheira m, jones rn. emergence and widespread dissemination of oxa-23, -24/40 and -58 carbapenemases among acinetobacter spp. in asia-pacific nations: report from the sentry surveillance program. j antimicrob chemother. 2009;63(1):55–9. doi:10.1093/jac/dkn434 27. garcía-betancur jc, appel tm, esparza g, gales ac, levy-hara g, cornistein w, et al. update on the epidemiology of carbapenemases in latin america and the caribbean. expert rev anti infect ther. 2021;19(2):197–213. doi:10.1080/14787210.2020 .1813023 28. tran dn, tran hh, matsui m, suzuki m, suzuki s, shibayama k, et al. emergence of new delhi metallo-beta-lactamase 1 and other carbapenemase-producing acinetobacter calcoaceticus-baumannii complex among patients in hospitals in ha noi, viet nam. eur j clin microbiol infect dis. 2017;36(2):219–25. doi:10.1007/s10096016-2784-8 29. wang j, ning y, li s, wang y, liang j, jin c, et al. multidrugresistant acinetobacter baumannii strains with ndm-1: molecular characterization and in vitro efficacy of meropenem-based combinations. exp ther med. 2019;18(4):2924–32. doi:10.3892/ etm.2019.7927 30. xanthopoulou k, urrutikoetxea-gutierrez m, vidal-garcia m, diaz de tuesta del arco jl, sanchez-urtaza s, wille j, et al. first report of new delhi metallo-beta-lactamase-6 (ndm6) in a clinical acinetobacter baumannii isolate from northern spain. front microbiol. 2020;11:589253. doi:10.3389/ fmicb.2020.589253 31. heritier c, poirel l, nordmann p. cephalosporinase over-expression resulting from insertion of isaba1 in acinetobacter baumannii. clin microbiol infect. 2006;12(2):123–30. doi:10.1111/j.14690691.2005.01320.x 32. higgins pg, dammhayn c, hackel m, seifert h. global spread of carbapenem-resistant acinetobacter baumannii. j antimicrob chemother. 2010;65(2):233–8. doi:10.1093/jac/dkp428 https://ojs.wpro.who.int/ 1wpsar vol 12, no 4, 2021 | doi: 10.5365/wpsar.2021.12.4.834 original research s treptococcus pneumoniae poses a serious public health concern because it causes a wide range of diseases including otitis media, septicaemia, meningitis and pneumonia. the world health organization (who) reports that pneumonia accounted for 15% of mortalities among children aged ≤5 years globally in 2017.1 s. pneumoniae was identified as one of the leading causes of pneumonia in the 2016 global burden of disease report.2 invasive pneumococcal disease (ipd), defined as infection of normally sterile sites of the body with s. pneumoniae, most frequently affects children aged <2 years, adults aged ≥65 years and immunocompromised patients.3,4 in the philippines, a study in regions vi, vii and viii determined that there were 89 221 children aged <5 years with pneumonia who were seen and 85 923 who were given medication from january to december 2012.5 at present, more than 94 different pneumococcal serotypes have been classified based on the unique polysaccharide characteristics and composition expressed in the capsule.6 serotype 19a was the most commonly identified serotype in the regions of east africa, asia pacific, united states of america (usa), europe and north america in 2007–2015.7 serotypes 6b, 14 and 19f were the predominant causes of ipd among children in the africa–eastern mediterranean region, whereas serotypes 1 and 14 were prevalent in europe and latin america. the threat of emerging antimicrobial resistance (amr) among s. pneumoniae serotypes worldwide was recognized as early as the 1980s. antimicrobial susceptibility profiling of s. pneumoniae has played a significant role in the treatment of patients and in a research institute for tropical medicine, department of health, manila, philippines. published: 29 november 2021 doi: 10.5365/wpsar.2021.12.4.834 serotype distribution and antimicrobial resistance of streptococcus pneumoniae in the philippines, 2012–2018 sonia b. sia,a marietta l. lagrada,a june m. gayeta,a melissa ana l. masim,a jaywardeen p. abad,a mariane a. magbanuaa and ferissa b. ablolaa correspondence to sonia b. sia (email: sonia.sia@ritm.gov.ph) objective: data are scarce on the prevailing streptococcus pneumoniae serotypes in the philippines, including the relative antimicrobial resistance (amr) of these bacteria. this study is designed to fill that gap by describing the serotype distribution and amr of s. pneumoniae in the philippines from 2012 to 2018. methods: s. pneumoniae isolates from clinical specimens were collected through the philippine department of health antimicrobial resistance surveillance program from 1 january 2012 to 31 december 2018. identification and antimicrobial susceptibility testing (ast) were performed using conventional and automated methods (vitek2 compact automated machine). ast for penicillin, erythromycin, co-trimoxazole, ceftriaxone and levofloxacin was done following the clinical and laboratory standard institute recommendations. serotyping was done through slide agglutination following the denka seiken slide agglutination method. results: from a total of 307 isolates of s. pneumoniae, 32 serotypes were identified; the most frequently occurring were serotypes 1, 3, 5, 4, 18, 19a, 6b, 15 and 14. many (n=113, 36.53%) of the isolates were from those aged ≤5 years. pneumococcal conjugate vaccine (pcv) coverage was as follows: pcv7 (32.69%), pcv10 (54.16%) and pcv13 (69.23%). the overall amr of invasive s. pneumoniae isolates was low. penicillin-resistant serotypes were 14, 19, 24, 4, 5, 1, 15, 6 and 32. discussion: with the inclusion of pcv13 in the national immunization program, continued monitoring of the prevailing serotypes of s. pneumoniae isolates in the philippines is needed to guide disease and amr control measures. wpsar vol 12, no 4, 2021 | doi: 10.5365/wpsar.2021.12.4.834 https://ojs.wpro.who.int/2 sia et alstreptococcus pneumoniae in the philippines, 2012-2018 sent to the implementing laboratory of the doh-arsp for confirmation of identification and antimicrobial susceptibility testing (ast) and for serotyping. confirmation of identification and ast of isolates were performed using the vitek2 compact automated machine (biomérieux). ast for penicillin, erythromycin, co-trimoxazole, ceftriaxone and levofloxacin was done following the method described by the clinical and laboratory standard institute (clsi).9 results were managed and analysed using whonet 5.6, a windows-based database software that facilitates analysis of ast. in computing percentage resistance, only the first isolate per patient per calendar year was included. serotyping s. pneumoniae isolates were serotyped through slide agglutination following the denka seiken slide agglutination method as described by denka seiken co., ltd.10 because of local unavailability of factor sera, typing within serogroups that contained multiple serotypes was not done. results ipd serotype distribution a total of 307 isolates of s. pneumoniae were collected from patients with ipd in the 7-year study period. the age range was 0–93 years. most of the isolates were from blood (n=286, 93.15%) and cerebrospinal fluid (n=21, 6.84%). about a third (n=113, 36.80%) of the isolates were from the ≤5 years age group followed by the age groups 18–64 years (n=111, 36.15%), ≥65 years (n=55, 17.91%) and 6–17 years (n=28, 9.12%). thirty-two serotypes were identified, with the most frequently occurring being serotypes 1, 6, 3, 5, 4, 18, 23, 12, 15 and 2 (table 1). these 10 serotypes made up 71% of the total isolates. due to local unavailability of typing sera, no typing was done for serogroups 6, 18, 19 and 23. the overall pcv coverages of the serogroups identified in this study were as follows: pcv7 (39.73%), pcv10 (59.60%) and pcv13 (68.07%). there were 37 isolates (12%) with serotypes not included in pcvs and ppvs (non-vaccine types) (table 1). mapping amr for large-scale epidemiology studies. specific s. pneumoniae serotypes have been associated with resistance to specific antimicrobial agents; for example, serotypes 19f, 14, 23f, 9v and 6b have been found to be resistant to penicillin and macrolides.3 data are lacking on the prevailing pneumococcal serotypes in the philippines, including their resistance to specific antimicrobials. this study therefore describes the distribution and amr of s. pneumoniae serotypes in the philippines from 2012 to 2018. methods bacterial isolates s. pneumoniae isolates from invasive clinical specimens were collected through the philippine department of health antimicrobial resistance surveillance program (doh-arsp) from 1 january 2012 to 31 december 2018. the doh-arsp is a laboratory-based amr surveillance programme with 24 sentinel sites representing 16 of the 17 geopolitical regions in the country. there are two private hospitals among the eight sentinel sites in the national capital region, but all other sentinel sites are regional government hospitals that cater to their respective geopolitical regions. all are tertiary hospitals with bed capacity ranging from 50 to 1500, with many being in the 300–500 range. case finding for doh-arsp is based on priority specimens sent routinely to sentinel site laboratories for clinical purposes. thus, sampling in the present study is largely based on diagnostic practices of the sentinel site clinicians. all s. pneumoniae isolates grown from invasive clinical specimens were included in the present study. cumulative overall analyses were done for all isolates, with a focus on the most vulnerable age groups, that is, those aged ≤5 years and those aged ≥65 years. bacterial identification and antimicrobial susceptibility testing s. pneumoniae isolates were cultured by the sentinel sites from invasive clinical samples based on the who manual for the laboratory identification and antimicrobial susceptibility testing of bacterial pathogens of public health importance in the developing world.8 isolates were then wpsar vol 12, no 4, 2021 | doi: 10.5365/wpsar.2021.12.4.834https://ojs.wpro.who.int/ 3 streptococcus pneumoniae in the philippines, 2012-2018sia et al table 1. frequency of streptococcus pneumoniae serotypes in the philippines, 2012–2018 (n=307) serotype 2012 n=7 2013 n=20 2014 n=33 2015 n=51 2016 n=63 2017 n=59 2018 n=74 total % 4 1 1 4 5 3 3 6 23 7.49 6 1 5 8 7 3 3 27 8.79 9 1 4 3 8 2.61 14 2 2 1 5 3 13 4.23 18 1 2 5 1 8 4 21 6.84 19 1 4 0 4 9 2.93 23 1 2 2 2 4 6 4 21 6.84 1 5 5 7 9 6 6 38 12.37 5 2 2 8 2 3 1 5 23 7.49 7 1 3 1 1 6 1.95 3 1 1 3 4 9 8 26 8.46 2 1 2 1 2 4 1 1 12 3.90 10 1 1 3 5 1.63 11 2 1 3 0.98 12 2 1 1 1 5 1.63 15 1 2 6 2 2 13 4.23 20 1 1 1 1 3 7 2.28 22 3 1 1 5 1.63 33 1 1 2 4 1.3 16 2 5 7 2.28 21 1 1 0.33 24 2 2 4 1.3 25 1 1 1 3 0.98 28 1 1 2 0.65 29 2 2 2 6 1.95 31 1 1 2 0.65 32 1 1 0.33 34 1 1 3 5 1.63 35 2 2 0.65 39 1 1 0.33 40 1 2 2 0.65 46 2 1 0.33 total 307 legend: pcv7 serotypes: 4, 6b, 9v, 14, 18c, 19f, 23f pcv10 serotypes: pcv7 + 1, 5, 7f pcv13 serotypes: pcv10 + 3, 6a, 19a ppsv23 serotypes: 1, 2, 3, 4, 5, 6b, 7f, 8, 9n, 9v, 10a, 11a, 12f, 14, 15b, 17f, 18c, 19a, 19f, 20, 22f, 23f, 33f wpsar vol 12, no 4, 2021 | doi: 10.5365/wpsar.2021.12.4.834 https://ojs.wpro.who.int/4 sia et alstreptococcus pneumoniae in the philippines, 2012-2018 of the 21 isolates resistant to co-trimoxazole, most (n=13, 62%) were from patients aged ≤5 years and were of serotypes 6, 14, 19, 23 and 5. pcv coverage of such isolates in this age group was 100%. there were few erythromycin-resistant isolates in this study, with most (4/7, 57%) coming from the adult population (18–64 years) and only two isolates from children aged ≤5 years. the erythromycin-resistant isolates were of serotypes 6, 1, 23 and 24, with the non-vaccine serotype 24 being the most common type (3/7, 43%). one serotype 24 isolate from a male child aged 6 months was reported in 2015 to be resistant to ceftriaxone. this non-vaccine type isolate was noted to also be resistant to erythromycin and penicillin. there was no report of any similarly resistant phenotype in the succeeding years. among the 10 serotype 14 isolates from patients aged ≤5 years, eight (80%) were penicillin-resistant. further, of the nine serotype 19 isolates, six (67%) were penicillin-resistant, with four of these isolated from patients aged ≤5 years. discussion ipd serotype distribution pneumococcal serotypes vary in prevalence, age group infected, geographical distribution and amr pattern. local ipd serotypes identified in this study (serotypes 1, 3, 4, 6, 14, 18 and 23) resemble the dominant ipd serotypes worldwide, including 1, 3, 4, 14, 6a, 6b, 7f, 8, 18c, 19f, 9v and 23f.11 serotype 1 was present yearly in all age groups and accounted for the greatest number of isolates across each age group. serotypes 4 and 5 were also observed in all age groups and were present in each year of the study period. of the 32 serotypes identified in this study, seven have not been reported previously in local studies: serotypes 10 and 11, which are covered by ppv, and five non-vaccine types, 21, 32, 35, 40 and 46. the ipd serotype distribution in this study relies on the diagnostic practices of sentinel site clinicians. this study does not provide data on the proportion of ipd cases that had isolates for testing; however, it does provide information on the serotype distribution and amr of s. pneumoniae in the philippines. among patients aged ≤5 years, the most common serotypes were 6 (n=16, 14.15%), 18 (n=12, 10.61%) and 14 (n=10, 8.85%), all covered by pcvs. the overall pcv coverages of serotypes from this age group were 54.86% for pcv7, 66.37% for pcv10 and 70.79% for pcv13. a total of 11% of the isolates among this age group were non-vaccine serotypes. among isolates from older adults, those aged ≥65 years, the most frequent were serotypes 3 (n=10, 18.18%), 4 (n=5, 9.09%) and 1 (n=5, 9.09%), which are all covered by pcv. serotype 3 (present in pcv13 but not in pcv7 and pcv10) was consistently seen in this age group from 2014 to 2018. the overall vaccine coverages in this age group were pcv7 (29.09%), pcv10 (50.90%), pcv13 (69.09%) and ppv23 (89.09%). only 7% (4/55) were non-vaccine serotypes. there were only 28 isolates from patients aged 6–17 years, with the most common being serotypes 1 (n=5, 17.85%) and 18 (n=4, 14.28%), both covered by the conjugate vaccines. among the isolates from patients aged 18–64 years, the most common were serotypes 1 (n=21, 18.91%), 4 (n=12, 10.81%) and 23 (11, 9.90%), all of which were covered by pcvs. only 15% (11/111) were non-vaccine serotypes. the overall cumulative resistance rate to antibiotics of interest among the invasive s. pneumoniae isolates in this study was low. resistance to penicillin (meningitis breakpoint) was highest at 14.57%, followed by cotrimoxazole (9.06%), erythromycin (2.7%) and ceftriaxone (0.31%). no resistance to levofloxacin was seen in this study. the only distinct trend in yearly amr rates was seen for penicillin, with a 2-year successive increase in 2017 and 2018. however, given the relatively low number of isolates, these increases were not statistically significant (fig. 1). antimicrobial resistance there were 34 penicillin-resistant isolates in the study, of which 56% (19/34) were from patients aged ≤5 years and were of serotypes 14 (n=8, 42%), 19 (n=4, 21%), 6 (n=2, 10%), 1, 4, 15, 33 and 24 (n=1 each, 5% each). pcv coverage of penicillin-resistant isolates from this age group was 84%, with three non-pcv serotypes: serotypes 15, 33 and 24. serotypes of penicillin-resistant isolates from other age groups are shown in table 2. wpsar vol 12, no 4, 2021 | doi: 10.5365/wpsar.2021.12.4.834https://ojs.wpro.who.int/ 5 streptococcus pneumoniae in the philippines, 2012-2018sia et al results of the present study where serotypes 1 (n=38, 12.37%) and 6 (n=27, 8.79%) predominated. the difference in the prevailing serotypes across the region could be influenced by the presence of antibiotic-resistant strains, immunogenicity of each conjugate in different populations and a mismatch between serotype variants present in a country and the available strains used in vaccine preparation.12 following the introduction of pcv13 in asian countries in 2009, the pattern of vaccine serotype coverage and predominant ipd serotypes detected has changed. pcv7 serotype coverage reduction was noted to be 30–34% in the republic of korea, hong kong sar (china) and taiwan (china).12 in the pcv13 period, the most prevailing serotype was 19a in japan, 3 in taiwan (china) and 15 in china. this is in contrast with the fig. 1. yearly antimicrobial resistance rate of penicillin, erythromycin, ceftriaxone, levofloxacin and trimethoprimsulfamethoxazole in the philippines, 2012–2018 28.6 15 15.2 15.7 4.8 8.5 13.7 0 10 20 30 40 penicillin 2012 (n=7) r es is ta nc e ra te s (% ) 2013 (n=20) 2014 (n=33) 2015 (n=51) 2016 (n=63) 2017 (n=59) 2018 (n=74) 0 5 0 0 9.5 1.7 2.7 0 5 10 15 0 0 0 0 2.2 0 0 0 5 10 ceftriaxone erythromycin 0 0 0 0 0 0 0 0 10 levofloxacin 0 10 15.2 9.8 12.7 3.4 12.3 0 5 10 15 20 trimethoprimsulfamethoxazole wpsar vol 12, no 4, 2021 | doi: 10.5365/wpsar.2021.12.4.834 https://ojs.wpro.who.int/6 sia et alstreptococcus pneumoniae in the philippines, 2012-2018 ceftriaxone among 10 hospitals in china were 8.2% and 18.1% among non-meningeal and meningeal isolates, respectively.18 a medical research institute in malaysia reported that 35.9% of the total pneumococcal isolates (663/1847) from a paediatric population was resistant to co-trimoxazole.19 the most common multidrug resistance pattern observed in this study was a penicillin-erythromycin-cotrimoxazole combination (n=3). this combination was also found in 6/125 resistance patterns in a multicentre retrospective study in china.20 serotypes and amr specific pneumococcal serotypes are known to be associated with certain antibacterial resistance.20 worldwide, penicillin resistance was observed among serotypes 6a, 6b, 9v, 14, 19a, 19f, 23a and 35b, with the most resistant serotypes being 19a (28.1%), 19f (19.0%) and 35 (16.7%).22,23 three of these serotypes were identified among the penicillin-resistant isolates in the present study – 6, 14 and 19a – all of which are covered by pcv13. with four of the six isolates from patients aged ≤5 years, vaccination with pcv13 could prevent penicillin resistance among pneumococci in this age group. interestingly, all four of the serotype 24 isolates – a nonvaccine type – from the ≤5 year and the 16–84 year age groups in this study were penicillin-resistant. monitoring this serotype is recommended to guide control measures against the spread of penicillin-resistant pneumococci. erythromycin resistance has been observed among serotypes 6a, 6b, 9v, 14, 15a, 19a and 19f,21 and for serotypes 6 (21.8%) and 14 (41.9%) among children aged ≤5 years.20 results from this study differ, with serotypes 1 (2.6%), 6 (7.4%), 23 (14%) and 24 (100%) being erythromycin-resistant isolates. co-trimoxazolethe overall pcv13 coverage of 68.07% in the present study is lower than was found in a previous local 8-year study (2004–2011), where it was 73.8%.13 this may be due to the larger number of isolates in the present study. the overall pcv13 coverage among isolates from patients aged ≤5 years in the present study was 70.79% – lower than the reported 80.4% in hong kong sar (china) and 93.1% in taiwan (china).12 pcv13 was included in the country’s national immunization program for children aged ≤5 years in 2015, with low vaccination coverage ranging from 30% to 60% in 2015–2019.1 however, there was no noted decrease in pcv13 coverage among the isolates from this age group in 2015, with pcv13 coverage ranging from 68% in 2016 to 79% in 2018. continuous surveillance of s. pneumoniae serotypes can track changes to prevailing serotypes, especially if vaccination coverage improves. among the isolates from those aged ≥65 years, serotypes included in pcv13 (3, 1, 4, 18, 6) were the most common. these findings support the 2018 local immunization recommendation of administering pcv13 to this age group.15 antimicrobial resistance the cumulative resistance rates of pneumococci in the present study were low, ranging from 0% for levofloxacin to 14.57% for penicillin. this is lower than reported elsewhere in asia, including values for penicillin resistance among pneumococci causing ipd in 17 chinese cities of 51.6% (455/881) and erythromycin resistance of 95.2% (839/881) during 2011–2016.16 a study from the asian network for surveillance of resistant pathogens reported pneumococci resistance rates of 1.7%, 0.4%, 1.5% and 13.4% for levofloxacin, moxifloxacin, gatifloxacin and ciprofloxacin, respectively.17 the resistance rates to table 2. distribution of penicillin-resistant isolates by age and serotype age group number of isolates serotypes ≤5 19 (55.9%) 4, 6, 14, 19, 1, 15, 33, 24 6–17 2 (5.9%) 14, 5 18–64 10 (29.4%) 4, 19, 1, 5, 15, 24 ≥65 3 (8.8%) 19, 5, 32 total 34 wpsar vol 12, no 4, 2021 | doi: 10.5365/wpsar.2021.12.4.834https://ojs.wpro.who.int/ 7 streptococcus pneumoniae in the philippines, 2012-2018sia et al ethics statement this study was submitted to and approved by the institutional review board of the research institute for tropical medicine (2019–35). funding none references 1. pneumonia. geneva: world health organization; 2019. available from: https://www.who.int/en/news-room/fact-sheets/detail/pneumonia, accessed 30 august 2021. 2. gbd 2016 lower respiratory infections collaborators. estimates of the global, regional, and national morbidity, mortality, and aetiologies of lower respiratory infections in 195 countries, 1990–2016: a systematic analysis for the global burden of disease study. lancet infect dis. 2018 nov;18(11):1191–210. doi:10.1016/s1473– 3099(18)30310–4 pmid:30243584 3. lynch jp, zhanel gg. streptococcus pneumoniae: epidemiology and risk factors, evolution of antimicrobial resistance, and impact of vaccines. curr opin pulm med. 2010;16(3):217–25. doi:10.1097/ mcp.0b013e3283385653 pmid:20375783 4. invasive pneumococcal disease – annual epidemiological report for 2016. stockholm: european centre for disease prevention and control; 2016. available from: https://www.ecdc.europa.eu/en/ publications-data/invasive-pneumococcal-disease-annual-epidemiological-report-2016, accessed 30 august 2021. 5. wardlaw tm, johansson ew, hodge m, world health organization & united nations children’s fund (unicef). pneumonia: the forgotten killer of children. geneva: world health organization; 2014. available from: https://apps.who.int/iris/handle/10665/43640, accessed 30 august 2021. 6. varon e, cohen r, béchet s, doit c, levy c. invasive disease potential of pneumococci before and after the 13-valent pneumococcal conjugate vaccine implementation in children. vaccine. 2015;33(46):6178–85. doi:10.1016/j.vaccine.2015.10.015 pmid:26476365 7. cui ya, patel h, o’neil wm, li s, saddier p. pneumococcal serotype distribution: a snapshot of recent data in pediatric and adult populations around the world. hum vaccin immunother. 2017;13(6):1–13. doi:10.1080/21645515.2016.1277300 pmid:28125317 8. manual for the laboratory identification and antimicrobial susceptibility testing of bacterial pathogens of public health importance in the developing world: haemophilus influenzae, neisseria meningitidis, streptococcus pneumoniae, neisseria gonorrhoea, salmonella serotype typhi, shigella, and vibrio cholerae. geneva: world health organization; 2003. available from: https://apps.who.int/ iris/handle/10665/68554, accessed 13 september 2021. 9. performance standards for antimicrobial susceptibility testing. 28th ed. wayne, pa: clinical and laboratory standards institute; 2018. available from: http://iacld.ir/dl/public/clsi-2018-m100-s28.pdf, accessed 30 august 2021. 10. bacterial typing antisera handbook. 4th ed. tokyo: denka seiken co., ltd.; 2006. available from: https://www.trios.cz/wp-content/ uploads/sites/149/2016/08/bacterial-typing-antisera-handbook. pdf, accessed 30 august 2021. resistant isolates in the present study were from serotypes 6 (45%) and 19 (19.35%), similar to results reported for co-trimoxazole-resistant serotypes (serotype 6b) from malaysia.23 although particular serogroups have been associated with resistance to specific antibiotics recently, it is possible that serotype profiles of resistant pneumococci will change through the years because the genes encoding the capsular serotype can be exchanged and acquired.24 this, as well as the potential for serotype replacement and switching serotypes within the conjugate vaccines, suggests that monitoring pneumococci serotypes is required in the philippines. whole genome sequencing could also be considered for monitoring pneumococci serotypes, given that amr among pneumococci is usually clonal in origin. conclusion the s. pneumoniae serotypes in the present study are largely similar to those prevailing worldwide. the most common serotypes and serogroups observed in this study were serotypes 1, 6, 3, 5, 4, 18, 23, 15, 14 and 2. pcv coverage among patients aged ≤5 years across the 7-year study has not decreased, even after the inclusion of pcv13 in the national immunization program. the amr rates of s. pneumoniae to penicillin, erythromycin, ceftriaxone, co-trimoxazole and levofloxacin remained low. the specific antibiotic-resistant serotypes observed in this study were similar to those in other asian countries. all serotype 24 isolates, a non-vaccine type, were found to be resistant to penicillin and erythromycin. with the inclusion of pcv13 in the national immunization program, continued monitoring of the prevailing serotypes of s. pneumoniae isolates in the philippines is needed to guide disease and amr control measures. acknowledgements the authors would like to thank all the participants of the philippine antimicrobial resistance surveillance program and the staff of the philippine antimicrobial resistance surveillance reference laboratory. conflict of interest all authors declared no conflict of interest in the conduct of this study. wpsar vol 12, no 4, 2021 | doi: 10.5365/wpsar.2021.12.4.834 https://ojs.wpro.who.int/8 sia et alstreptococcus pneumoniae in the philippines, 2012-2018 18. wang cy, chen yh, fang c, zhou mm, xu hm, jing cm, et al. antibiotic resistance profiles and multidrug resistance patterns of streptococcus pneumoniae in paediatrics: a multicenter retrospective study in mainland china. medicine (baltimore). 2019;98(24):e15942. doi:10.1097/md.0000000000015942 pmid:31192930 19. arushothy r, ahmad n, amran f, hashim r, samsudin n, azih crc, et al. pneumococcal serotype distribution and antibiotic susceptibility in malaysia: a four-year study (2014–2017) on invasive paediatric isolates. int j infect dis. 2019;80:129–33. doi:10.1016/j. ijid.2018.12.009 pmid:30572022 20. najafi mosleh m, gharibi m, alikhani my, saidijam m, kalantarian g. antimicrobial susceptibilities and distribution of resistance genes for β-lactams in streptococcus pneumoniae isolated in hamadan. jundishapur j microbiol. 2014;7(10):e12714. doi:10.5812/ jjm.12714 pmid:25632328 21. hackel m, lascols a, bouchillon s, hilton b, morgenstern d, purdy j. serotype prevalence and antibiotic resistance in streptococcus pneumoniae clinical isolates among global populations. vaccine. 2013;31(42):4881–7. doi:10.1016/j.vaccine.2013.07.054 pmid:23928466 22. kim sh, bae ik, park d, lee k, kim ny, am song s, et al. serotype distribution and antimicrobial resistance of streptococcus pneumoniae isolates causing invasive and noninvasive pneumococcal diseases in korea from 2008 to 2014. biomed res int. 2016;2016:6950482. doi:10.1155/2016/6950482 pmid:27314035 23. feikin dr, kagucia ew, loo jd, link-gelles r, puhan ma, cherian t, et al. serotype-specific changes in invasive pneumococcal disease after pneumococcal conjugate vaccine introduction: a pooled analysis of multiple surveillance sites. plos med. 2013;10(9):e1001517. doi:10.1371/journal.pmed.1001517 pmid:24086113 24. schrag sj, beall b, dowell s. resistant pneumococcal infections: the burden of disease and challenges in monitoring and controlling antimicrobial resistance. geneva: world health organization; 2001. available from: http://www.who.int/drugresistance/technicalguidance/en/resistantinfection.pdf, accessed 13 september 2021. 11. capeding mrz, sombrero lt, esparar ga, mondoy mu, taclibon ag. pneumococcal serotypes among filipino children admitted in a tertiary care center for infectious diseases from 2000 to 2005. pediatr infect dis soc philipp j. 2009;10(1):2–4. 12. tai ss. streptococcus pneumoniae serotype distribution and pneumococcal conjugate vaccine serotype coverage among pediatric patients in east and southeast asia, 2000–2014: a pooled data analysis. vaccines (basel). 2016;4(1):4. doi:10.3390/vaccines4010004 pmid:26907356 13. sia s, carlos c, hufano c, lagrada m, ealdama j, sepulveda mt, masim m. serotype distribution and antimicrobial resistance of streptococcus pneumoniae in the philippines, 2004– 2011. philippine j pathol. 2017;2(1):23–9. doi:10.21141/ pjp.2017.005 14. health technology assessment unit, health regulation team. reassessment of 10versus 13-valent pneumococcal conjugate vaccines (pcv) in the philippines evidence summary. philippines: department of health; 2020. available from: https://doh.gov.ph/ sites/default/files/health_advisory/htac%20recommendandation-pcv-reassessment.pdf, accessed 27 december 2020. 15. philippine society for microbiology and infectious diseases. philippine clinical practice guidelines for adult immunization. makati city, philippines: zurbano publishing and printing corp. 2018. available from: https://drive.google.com/file/d/1qqzd8sl 8u8znawubzrvbt3xqlhhrfafw/view, accessed 14 december 2020. 16. zhao c, li z, zhang f, zhang x, ji p, zeng j, et al. serotype distribution and antibiotic resistance of streptococcus pneumoniae isolates from 17 chinese cities from 2011 to 2016. bmc infect dis. 2017;17(1):804. doi:10.1186/s12879–017–2880–0 pmid:29284419 17. kim sh, song jh, chung dr, thamlikitkul v, yang y, wang h, et al. changing trends in antimicrobial resistance and serotypes of streptococcus pneumoniae isolates in asian countries: an asian network for surveillance of resistant pathogens (ansorp) study. antimicrob agents chemother. 2012;56(3):1418–26. doi:10.1128/aac.05658–11 pmid:22232285 https://ojs.wpro.who.int/ 1wpsar vol 12, no 4, 2021 | doi: 10.5365/wpsar.2021.12.4.886 perspective t he public health emergency response workforce has experienced unrelenting pressure during the past decade. countries in the western pacific region have responded to significant outbreaks of avian influenza, zika virus disease, middle east respiratory syndrome, vaccine-derived poliovirus, measles and the coronavirus disease 2019 (covid-19) pandemic, as well as natural disasters; they also supported the response to ebola virus disease in west africa during 2014–2016.1 for public health responses to be effective, we must continue to identify optimal mechanisms to support people working in challenging public health responses. health systems strengthening, in particular for workforce support, is fundamental to achieving the core capacity required under the international health regulations (2005).2 the asia pacific strategy for emerging diseases and public health emergencies (apsed iii) recognizes that a skilled, experienced local public health workforce must be developed and maintained to prevent the escalation and spread of emergencies.3 the ihr joint external evaluations show that work remains to be done to strengthen public health workforces so that they can manage health security events.4 the covid-19 pandemic has clearly demonstrated that large public health events require responders with skills and expertise to address the crisis appropriately. in may 2021, the world health assembly recommended investment in the health workforce for better management of the covid-19 pandemic.5 in the western pacific region, field epidemiology training programmes (fetps) are a key activity for strengthening health security by developing vital technical expertise in the existing workforce.3,6 the programmes are based on the principle of “learning through doing” with guidance from experienced epidemiologists.6 such support, however, often stops at graduation. a guiding principle of apsed iii is “continuous learning and improvement”.3 thus, preparedness before a crisis is an integral component, but professional support to the health workforce during crises would be feasible for consolidating what has been learnt. in 2019, we interviewed public health emergency response experts on topics that included workforce support. the experts discussed the challenge of inexperience and noted that an emergency response surge workforce was frequently based on availability rather than appropriate skills and experience.7 less experienced epidemiologists were often readily available for rapid deployment, but emergency response was considered not to be an ideal training setting. the experts stated that less experienced responders could be considered suitable if they were guided.7 to support the technical and leadership needs of the surge workforce during the covid-19 pandemic in australia, the public health association of australia and the australasian epidemiological association rapidly established a pilot mentorship programme for surge responders, in which mentors provided both professional and personal support to mentees remotely.8,9 subsequent evaluation showed that the programme effectively supported a workforce with limited prior public health experience to work in a stressful environment during a national crisis. the mentors were found to improve the confidence of the mentees in conducting their work by sharing their professional skills in areas such as leadership and decision-making. importantly, the mentors supported the well-being of the mentees by acting as a confidential a australian national university, australian capital territory, australia. b university of newcastle, new south wales, australia. published: 23 november 2021 doi: 10.5365/wpsar.2021.12.4.886 how can we better support the public health emergency response workforce during crises? amy elizabeth parry,a samantha m colquhoun,a emma field,a martyn d kirk,a david n durrheimb and tambri housenb correspondence to amy elizabeth parry (email: amy.parry@anu.edu.au) wpsar vol 12, no 4, 2021 | doi: 10.5365/wpsar.2021.12.4.886 https://ojs.wpro.who.int/2 parry et alpublic health emergency response workforce support gramme and evaluate comprehensively what works and how. the recommended steps in establishing a pilot programme are illustrated in fig. 1. such a support programme could be used in public health emergency response both locally and globally. it could increase the effectiveness of the workforce, add to professional knowledge, provide less experienced responders with skills and reduce stress and burn-out.8 the proposed pilot programme would also benefit long-term national and regional preparedness, providing individuals and countries with peer-supported learning and experience. the first objective of the who global strategy on human resources for health is to optimize the quality of performance and the impact of the workforce.10 this should be based on emerging evidence on strengthening and continuing to support the health workforce during crises. to ensure that the region becomes “the healthiest and safest”,11 high-quality, longer-term programmes will be necessary, such as fetps to ensure sustained sounding board and guiding them in navigating political and otherwise complex environments.8,9 the australian mentorship programme supported front-line pandemic surge response workers at a time of great need. the main recommendation of the evaluation was to design a purpose-built programme for supporting emergency response workers.8,9 difficulties associated with such support include the fact that people are involved in a response for only short periods and are often new to the context or organization in which they are working. provision of support during emergencies can also be limited by lack of time and cross-cultural challenges. a similar programme in the western pacific region, based on the experience of the australian programme,8,9 could provide support for the covid-19 response and also an opportunity to learn and prepare for future public health emergencies. stakeholders such as partners in the global outbreak alert and response network should be consulted to design an all-purpose emergency response support model and materials and to pilot-test the profig. 1. recommended steps for establishing an emergency response workforce support model evaluate and adapt stakeholder consultation develop emergency response guidance to re�ne programme expectations identify mentors with experience in emergency response identify mentees willing to participate in pilot study implement regional pilot mentorship programme emergency response workforce support model source: based on evaluation findings, australian national university8 wpsar vol 12, no 4, 2021 | doi: 10.5365/wpsar.2021.12.4.886https://ojs.wpro.who.int/ 3 public health emergency response workforce supportparry et al 3. asia pacific strategy for emerging diseases and public health emergencies (apsed iii): advancing implementation of the international health regulations (2005): working together towards health security. manila: who regional office for the western pacific; 2017. available from: http://iris.wpro.who.int/handle/10665.1/13654, accessed 21 october 2020. 4. joint external evaluation. in: strategic partnership for health security and emergency preparedness (sph) portal [website]. geneva: world health organization; 2021. available from: https://extranet. who.int/sph/jee?region=205, accessed 21 june 2021. 5. update from the seventy-fourth world health assembly – 28 may 2021. geneva: world health organization; 2021. available from: https://www.who.int/news/item/28-05-2021-update-from-theseventy-fourth-world-health-assembly-28-may-2021, accessed 21 june 2021. 6. o’carroll pw, kirk md, reddy c, morgan ow, baggett hc. the global field epidemiology roadmap: enhancing global health security by accelerating the development of field epidemiology capacity worldwide. health secur. 2021;19(3):349–51. doi:10.1089/ hs.2021.0018 pmid:33944584 7. parry ae, kirk md, durrheim dn, olowokure b, colquhoun s, housen t. emergency response and the need for collective competence in epidemiological teams. bull world health organ. 2021;99(5):351–8. doi:10.2471/blt.20.276998 pmid:33958823 8. independent evaluation of the covid-19 emergency response workforce mentorship program. canberra: australian national university; 2021. available from: https://www.phaa.net.au/documents/item/5257, accessed 9 september 2021. 9. parry ae, colquhoun s, brownbill a, lynch bm, housen t. navigating uncertainty: evaluation of a covid-19 surge workforce support program, australia 2020-2021. global biosecurity. 2021;3(1). 10. global strategy on human resources for health: workforce 2030. geneva: world health organization; 2020. available from: https://www.who.int/publications-detail-redirect/9789241511131, accessed 21 june 2021. 11. for the future: towards the healthiest and safest region: a vision for who work with member states and partners in the western pacific. manila: who regional office for the western pacific; 2020. available from: https://iris.wpro.who.int/bitstream/ handle/10665.1/14476/wpr-2020-rdo-001-eng.pdf, accessed 20 june 2021. workforce development. in crises, however, a mentoringlike programme might foster consistent support for and empowerment of the workforce. conflicts of interest ap and ef are associate editors of western pacific surveillance and response journal. they were not involved in the editorial decision to publish this manuscript. funding this research received no specific grant from any funding agency in the public, commercial or not-for-profit sectors. ap received commonwealth and anu science merit scholarships and funding from the australian national health medical research council (nhmrc) integrated systems for epidemic response (app1107393). ap, sc and ef received funding through an asean australia health security fellowship, funded by dfat grant 74680. mk is supported by an nhmrc fellowship (app1145997) and received funding from the nhmrc for integrated systems for epidemic response. the funders had no role in the study design, data collection or analysis, the decision to publish or preparation of the manuscript. references 1. fearnley e, li a. international health regulations (2005): public health event communications in the western pacific region. western pac surveill response j. 2013;4(3):26–7. doi:10.5365/ wpsar.2013.4.3.003 pmid:24319610 2. international health regulations (2005), third edition. geneva: world health organization; 2016. available from: http:// www.who.int/ihr/publications/9789241580496/en/, accessed 9 september 2021. https://ojs.wpro.who.int/ 1wpsar vol 13, no 4, 2022 | doi: 10.5365/wpsar.2022.13.4.964 original research c oronavirus disease 2019 (covid-19) was first reported as clusters of unexplained pneumonia in late december 2019 in wuhan, china, and was found to be caused by severe acute respiratory syndrome coronavirus 2 (sars-cov-2). the world health organization (who) declared covid-19 a public health emergency of international concern on 30 january 2020.1 fiji’s first covid-19 case was imported on 15 march 2020 and resulted in a small local outbreak of 18 cases. over the next year, 50 additional imported cases were reported without any community transmission. by 14 november 2020, 70 cases of confirmed covid-19 had been reported, including two deaths.2 there were no other cases until 15 april 2021, 364 days after the last reported, locally acquired case, when travellers tested positive for covid-19 in government quarantine in a hotel. a subsequent locally acquired case of covid-19 occurred when a hotel worker at the quarantine facility inadvertently had close contact with the infected travellers, and this marked the start of the second wave of the covid-19 outbreak in fiji. the sequencing of the local case’s specimen confirmed a sars-cov-2 pango lineage b.1.617.2 variant – that is, the delta variant – which at that time was classified as a variant of concern by who.1 during the same period in who’s western pacific region, 10 of the 21 pacific island countries and territories reported cases of covid-19: some had only imported cases contained in quarantine facilities (i.e. the republic of the marshall islands, samoa, the solomon islands and vanuatu) and others had large-scale outbreaks (i.e. french polynesia, guam, new caledonia, the commonwealth of a ministry of health and medical services, suva, fiji. b ministry of lands and mineral resources, suva, fiji. c world health organization representative office for the south pacific, suva, fiji. published: 23 november 2022 doi: 10.5365/wpsar.2022.13.4.964 objective: there is limited published information about deaths due to coronavirus disease 2019 (covid-19) in fiji, the world health organization’s western pacific region and lowand middle-income countries. this report descriptively analyses deaths directly associated with covid-19 in fiji by age group, sex, ethnicity, geographical location, vaccination status and place of death for the first 7 months of the 2021 community outbreak. methods: a retrospective analysis was conducted of deaths directly associated with covid-19 that occurred from 15 april to 14 november 2021 in fiji. death rates per 100 000 population were calculated by utilizing divisional population estimates obtained from medical zone nurses in 2021. results: a total of 1298 deaths relating to covid-19 were reported, with 696 directly associated with covid-19 and therefore included in the analysis. of these, 71.1% (495) were reported from the central division, 54.6% (380) occurred among males, 75.6% (526) occurred among people of indigenous (itaukei) ethnicity and 79.5% (553) occurred among people who were unvaccinated. four deaths were classified as maternal deaths. the highest percentage of deaths occurred in those aged ≥70 years (44.3%, 308), and the majority of deaths (56.6%, 394) occurred at home. discussion: at-risk populations for covid-19 mortality in fiji include males, itaukei peoples, and older (≥70 years) and unvaccinated individuals. a high proportion of deaths occurred either at home or during the first 2 days of hospital admission, potentially indicating both a reluctance to seek medical care and a health-care system that was stressed during the peak of the outbreak. descriptive analysis of deaths associated with covid-19 in fiji, 15 april to 14 november 2021 nashika sharma,a dashika balak,a shaneel prakashb and julia maguirec correspondence to nashika sharma (email: nashika92@gmail.com) wpsar vol 13, no 4, 2022 | doi: 10.5365/wpsar.2022.13.4.964 https://ojs.wpro.who.int/2 sharma et alcovid-19 deaths in fiji testing for covid-19 was implemented for all deaths occurring during the study period. a descriptive analysis was conducted for deaths directly associated with covid-19. death rates per 100 000 population were calculated by age group, sex, ethnicity and geographical location using division population estimates obtained from medical zone nurses in 2021. note that the administrative boundaries (e.g. provincial boundaries) differ slightly from the medical division boundaries, hence medical zone demographic data were used. results a total of 1298 deaths relating to covid-19 were reported during the study period. of these, 696 were categorized as being due to covid-19 and were included in the analysis. for the first 4 months of the outbreak, deaths directly associated with covid-19 primarily occurred in the central division; they later spread to the western division and then to the eastern division (fig. 1). most deaths (71.1%, 495/696) were reported from the central division, and 54.6% (380/696) occurred among males, 75.6% (526/696) occurred among people of itaukei ethnicity and 79.5% (553/696) occurred among unvaccinated people (table 1). although deaths were reported across all age groups, the median age of deaths due to covid-19 was 67 years, and the highest percentage of deaths occurred in those aged ≥70 years (44.3%, 308/696). the death rate per age group–specific population increased with age (table 1). four deaths were classified as maternal deaths, all of which occurred during the postpartum period at divisional hospitals between 4 and 6 days from the date of admission (data not shown). three maternal deaths occurred in the central division, while one death occurred in the western division. the mean age of those categorized as a maternal death was 36.5 years (median, 35 years), and all women in this group were reported to be unvaccinated. the majority of deaths directly associated with covid-19 occurred at home (56.6%, 394/696), and of these 53.8% (212/394) were among males, 86.3% (340/394) were among itaukei people and 50% the northern mariana islands, and wallis and futuna). the remaining 11 pacific island countries and territories remained covid-free by closing their international borders and accepting only citizens and emergency support workers into their country or territory.1 there is limited published information regarding deaths due to covid-19 in fiji, the western pacific region and lowand middle-income countries.3–5 this report provides a descriptive analysis of the first 7 months of the 2021 outbreak for deaths directly associated with covid-19 in fiji by age group, sex, ethnicity, geographical location, vaccination status and place of death. methods we conducted a retrospective study of deaths directly associated with covid-19 that occurred during the second wave of community transmission in fiji between 15 april and 14 november 2021. sars-cov-2 infection was identified using reverse transcription polymerase chain reaction (rt-pcr) testing. during this period, all rt-pcr samples were sent to the fiji centre for communicable disease control, also known as mataika house, which is fiji’s national public health laboratory for analysis and reporting. deaths were classified as either directly associated with covid-19 (i.e. due to covid-19) or indirectly associated with covid-19 (i.e. people with covid-19 infection at the time of death).6 classification was determined by the attending physician at the medical facility or by a mortality review panel, with covid-19 categorized as a primary or secondary cause of death based on the case definition used by the fiji ministry of health and medical services,7 clinical records, medical history from relatives and results of covid-19 investigations. for each death directly associated with covid-19, the ministry of health and medical services obtained the following information: age, sex, ethnicity, residential address, place of death, covid-19 test type, date the specimen was collected for laboratory testing, date the specimen was tested, date of death, hospitalization status, date of hospital admission, covid-19 vaccination status and dates of vaccination doses. in the analyses, deaths were classified as occurring at home or at a health facility (i.e. a health centre or hospital). postmortem wpsar vol 13, no 4, 2022 | doi: 10.5365/wpsar.2022.13.4.964https://ojs.wpro.who.int/ 3 covid-19 deaths in fiji sharma et al 95/200) and 0.5% (1/200) occurring at a health centre. in the eastern division, one death occurred at home; no deaths were reported in the northern division during the study period. discussion our study describes deaths directly associated with covid-19 occurring in fiji during its second wave of community transmission in 2021. most of these deaths occurred among males, people aged ≥70 years and those living in the central division (the most populous division in fiji). geographically, the deaths directly associated with covid-19 followed a similar pattern to that of the cases, occurring first in the central division, then the western division and later in the eastern division.8 the delayed spread of cases through the country can be attributed to the restriction of movement across the major divisional borders and from areas with localized outbreaks. with cases initially concentrated in the central division, the remaining divisions had the opportunity to prepare their health systems for an influx of cases and also rapidly increase vaccination coverage to prevent widespread disease transmission. (197/394) were among people aged ≥70 years. of the 43.4% (302/696) of deaths that occurred in a hospital or health-care setting, 56.3% (170/302) were among males, 61.6% (186/302) were among itaukei people and 36.8% (111/302) were among people aged ≥70 years (table 2). of the deaths that occurred in the hospital or health-care setting, 44.0% (133/302) occurred within 1 day of admission, 9.3% (28/302) occurred 2 days after admission and 46.7% (141/302) occurred ≥3 days after admission. early in the outbreak when there were fewer cases, less than half of deaths occurred at home; however, during the peak of the outbreak (15 july–12 august) more than 60% of deaths occured at home rather than in a health facility (fig. 2). from september onwards, this proportion decreased as the number of cases and deaths decreased. the place of deaths directly associated with covid-19 (i.e. at home or at a health centre or hospital) varied by division. in the central division, most deaths occurred at home (60.2%, 298/495), with the remaining occurring in hospitals (35.2%, 174/495) and at health centres (4.6%, 23/495). conversely, in the western division, most deaths occurred in hospitals (52.0%, 104/200), with slightly fewer occurring at home (47.5%, fig. 1. deaths directly associated with covid-19 by geographical division, fiji, 15 april to 14 november 2021 (n = 696) 0 2 4 6 8 10 12 14 16 18 20 15 a pr 2 02 1 22 a pr 2 02 1 29 a pr 2 02 1 6 m ay 2 02 1 13 m ay 2 02 1 20 m ay 2 02 1 27 m ay 2 02 1 3 ju n 20 21 10 ju n 20 21 17 ju n 20 21 24 ju n 20 21 1 ju l 2 02 1 8 ju l 2 02 1 15 ju l 2 02 1 22 ju l 2 02 1 29 ju l 2 02 1 5 au g 20 21 12 a ug 2 02 1 19 a ug 2 02 1 26 a ug 2 02 1 2 se p 20 21 9 se p 20 21 16 s ep 2 02 1 23 s ep 2 02 1 30 s ep 2 02 1 7 o ct 2 02 1 14 o ct 2 02 1 21 o ct 2 02 1 28 o ct 2 02 1 4 n ov 2 02 1 11 n ov 2 02 1 n um be r o f d ea th s du e to c o vi d -1 9 date of death central division western division eastern division wpsar vol 13, no 4, 2022 | doi: 10.5365/wpsar.2022.13.4.964 https://ojs.wpro.who.int/4 sharma et alcovid-19 deaths in fiji table 1. characteristics of 696 people whose death was directly associated with covid-19, fiji, 15 april to 14 november 2021 table 2. characteristics of 696 people whose death was directly associated with covid-19 by place of death, fiji, 15 april to 14 november 2021 a higher rate of respiratory intubation and a longer length of hospital stay.9 although there is limited information about the relationship between sex and covid-19, the literature has highlighted the importance of understanding the role of comorbidities, immune system responses and sex hormones as drivers of covid-19 mortality.9,10 during our study period, deaths directly associated with covid-19 were reported in all age groups. however, the number and rate of covid-19 deaths were highest in those aged ≥70 years, highlighting that covid-19 mortality increases with age.11–13 a paper by jergović et al. emphasized that the loss of immune function and reduced protection from infectious agents that occur with age are factors associated with increased disease severity and mortality from covid-19.12 the deaths directly associated with covid-19 in our study population occurred predominantly among unvaccinated people, who accounted for 79.5% of deaths, whereas 18.7% of those who died had received one dose of vaccine and 1.9% had received two doses. this is similar to other studies, highlighting that mortality from in this study, more than half of the deaths directly associated with covid-19 were among males, which is consistent with other studies, demonstrating that male sex is associated with higher mortality.9,10 a paper by nguyen et al. additionally reported that male sex is not only associated with a higher rate of mortality but also with characteristic deaths directly associated with covid-19 (n = 696) no. (%) rate/100 000 population sex male 380 (54.6) 42.9 female 316 (45.4) 35.7 age (years) median (iqr) 67.0 (21.0) na mean (sd) 65.6 (15.9) na age group <20 9 (1.3) 2.7 20–29 9 (1.3) 6.3 30–39 22 (3.2) 16.4 40–49 58 (8.3) 56.3 50–59 120 (17.2) 132.4 60–69 170 (24.4) 327.3 ≥70 308 (44.3) 1079.2 ethnicity itaukei 526 (75.6) na fijian of indian descent 139 (20.0) na other 31 (4.5) na place of death hospital or health-care setting 302 (43.4) na home 394 (56.6) na vaccination status unvaccinated 553 (79.5) na one dose 130 (18.7) na two doses 13 (1.9) na geographical division central 495 (71.1) 123.4 western 200 (28.7) 56.3 eastern 1 (0.1) 2.6 northern 0 (0.0) 0 iqr: interquartile range; na: not applicable; sd: standard deviation. characteristic no. (%) of deaths at home (n = 394) in hospital or health-care setting (n = 302) sex male 212 (53.8) 170 (56.3) female 182 (46.2) 132 (43.7) age group (years) <20 3 (0.8) 6 (2.0) 20–29 3 (0.8) 6 (2.0) 30–39 10 (2.5) 12 (4.0) 40–49 22 (5.6) 36 (11.9) 50–59 61 (15.4) 59 (19.5) 60–69 98 (24.9) 72 (23.8) ≥70 197 (50.0) 111 (36.8) ethnicity itaukei 340 (86.3) 186 (61.6) fijian of indian descent 39 (9.9) 100 (33.1) other 15 (3.8) 16 (5.3) wpsar vol 13, no 4, 2022 | doi: 10.5365/wpsar.2022.13.4.964https://ojs.wpro.who.int/ 5 covid-19 deaths in fiji sharma et al fig. 2. deaths directly associated with covid-19 by place and date of death, fiji, 15 april to 14 november 2021 (n = 696) outcomes.18–22 three separate studies conducted in the united states of america and scotland found that severe complications known to be associated with covid-19 in pregnancy (such as admission to a critical care unit, perinatal mortality and developing severe or critical covid-19 infection) were more common in pregnant women who were unvaccinated at the time they were diagnosed with covid-19 than in vaccinated pregnant women.23–25 therefore, this highlights the importance of vaccinating pregnant women to reduce the severe maternal and neonatal health outcomes associated with covid-19. we found that although all ethnicities in fiji were at risk of contracting and dying from covid-19, indigenous populations (i.e. itaukei) had a disproportionately higher rate of death from the disease. a review of the literature shows that globally indigenous populations seem to have higher rates of infection, more severe disease, higher rates of hospitalization, and poorer health and health outcomes from covid-19.26–28 although there is limited knowledge about the relationship between ethnicity and covid-19 morbidity and mortality, research suggests that pre-existing social, economic, political and cultural covid-19 is higher in the unvaccinated population than the vaccinated population.14–17 covid-19 vaccinations have successfully reduced the incidence and severity of, and hospitalization and deaths from, covid-19.14–17 although many countries are utilizing different vaccines and booster regimens, it is evident that covid-19 vaccinations have the potential to reduce morbidity and mortality.15–17 the fiji national covid-19 vaccination programme commenced on 6 april 2021, with 61 667 individuals aged >18 (approximately 10% of the eligible population) receiving their first dose of vaccine by the end of april 2021; by 14 november 2021, 599 423 (97% of the eligible population) had received their first dose and 553 943 (89.6%) had received their second dose. during the study period, four maternal deaths were reported. we have limited antenatal, intrapartum and postpartum information about these maternal deaths, so it is difficult to draw meaningful associations with other studies conducted around the world; however, a review of the literature highlights that pregnant women are at higher risk of severe covid-19 infection; of needing caesarean delivery, intensive care admission and invasive ventilation; and of having adverse maternal and neonatal 0 10 20 30 40 50 60 70 80 90 100 0 2 4 6 8 10 12 14 16 18 20 15 a pr 2 02 1 22 a pr 2 02 1 29 a pr 2 02 1 6 m ay 2 02 1 13 m ay 2 02 1 20 m ay 2 02 1 27 m ay 2 02 1 3 ju n 20 21 10 ju n 20 21 17 ju n 20 21 24 ju n 20 21 1 ju l 2 02 1 8 ju l 2 02 1 15 ju l 2 02 1 22 ju l 2 02 1 29 ju l 2 02 1 5 au g 20 21 12 a ug 2 02 1 19 a ug 2 02 1 26 a ug 2 02 1 2 se p 20 21 9 se p 20 21 16 s ep 2 02 1 23 s ep 2 02 1 30 s ep 2 02 1 7 o ct 2 02 1 14 o ct 2 02 1 21 o ct 2 02 1 28 o ct 2 02 1 4 n ov 2 02 1 11 n ov 2 02 1 18 n ov 2 02 1 % d ea th s a t h om e (7 -d ay m ov in g av er ag e) n um be r o f d ea th s date of death death at home death at health facility within 1 day of admission or test death at health facility ≥2 days after admission or test % deaths at home (7-day moving average) wpsar vol 13, no 4, 2022 | doi: 10.5365/wpsar.2022.13.4.964 https://ojs.wpro.who.int/6 sharma et alcovid-19 deaths in fiji there were some limitations to this study. the classification of deaths depended on the assessment of the attending physician and, therefore, there was potential for misclassification. if the death occurred outside a health-care facility (e.g. at home), there may have been a delay in receiving the death certificate; therefore, there is potential for delayed reporting or underreporting of deaths during our study period. we were also unable to calculate mortality rates by ethnicity due to a lack of recent population data. in this study, deaths directly associated with covid-19 were reported by geographical divisions; however, it would be valuable to analyse deaths by urban, periurban and rural settings because some communities have poorer access to health-care services, water, hygiene and sanitation and, as a result, are reported to have poorer health and health outcomes. it would also be interesting to assess the common signs and symptoms, and severity of covid-19 disease, as well as underlying comorbidities, especially since about 80% of all deaths that occur in fiji are due to noncommunicable diseases.32 however, this information is not reported in the medical cause of death certificates, and a detailed review of inpatient data and clinical notes would be required. occasionally, the clinical severity of disease was classified on the death certificate, but the investigative team was unsure how physicians classified the severity and whether all physicians in fiji utilized standard definitions. therefore, this information was not analysed. understanding the common comorbidities among those who died from covid-19 would help to highlight populations that are at risk for severe outcomes in fiji, and understanding the severity of disease would provide a way to assess the required levels of health-care preparedness, health-care delivery and future clinical and public health forecasting in a developing country like fiji. information on the common signs and symptoms of covid-19 experienced within our population can be utilized to increase knowledge and awareness among our frontline and allied health-care workers and can also be used to develop risk communication material to increase knowledge of and awareness about covid-19 among our population. in addition, understanding the patterns of disease among other at-risk populations would be useful, such as individuals with underlying mental health disorders or illnesses, those who are immunocompromised, those who have a disability, and residents of aged-care facilities, as well as low-income or unemployed individuals, unhoused determinants of health are important factors in the health and health outcomes of indigenous populations.26 therefore, it is important to collect timely, relevant, highquality and disaggregated data to better understand the needs of vulnerable and at-risk populations and to ensure that covid-19 response and mitigation measures are delivered in a way that ensures health equity and health equality.29 we found that the majority of deaths directly associated with covid-19 occurred at home (56.6%). while the reason for this is not clear, it is important to understand a population’s health-seeking behaviours and the factors that drive these behaviours. two studies conducted in pakistan and viet nam examined health-seeking behaviours and factors that altered these during the covid-19 pandemic.30,31 they found that individuals increased self-medication with unprescribed drugs, decreased their hospital visits and had an increased preference for visiting private general practitioners, traditional healers and unregistered clinics rather than visiting government facilities. the main factors that limited or altered health-seeking behaviours, or both, during the pandemic included fears of being stigmatized, of whole families being transferred to quarantine facilities and of disclosing past activities to contact tracing teams, and these fears were enhanced by misinformation, panic and uncertainties that spread over social media platforms.30,31 the two countries in these studies are developing countries, and these findings may be applicable to the context in fiji. it is also important to consider the immense and unprecedented stress placed on the health-care system in fiji during the peak of the outbreak, and its impact on the system’s ability to provide adequate and timely services to people with covid-19. indeed, we found that a high proportion of deaths occurred at home or soon after hospital admission, but this may be due to multiple factors, such as a limited ability to identify people with deteriorating health, limited availability of transportation to hospital and limited bed capacity to treat patients within the hospital, rather than a lack of health-seeking behaviour. as the outbreak progressed, strategies were implemented to increase the ability of the health system to identify those most at risk of severe disease and place them into an appropriate care pathway. more research on health-seeking behaviours and the factors that drive these behaviours within the context of pacific island countries and territories is pivotal for informing future pandemic response and mitigation measures.30,31 wpsar vol 13, no 4, 2022 | doi: 10.5365/wpsar.2022.13.4.964https://ojs.wpro.who.int/ 7 covid-19 deaths in fiji sharma et al 2. covid-19 updates. suva: fiji ministry of health and medical services; 2022. available from: https://www.health.gov.fj/covid-19-updates/, accessed 19 april 2022. 3. wang d, gee gc, bahiru e, yang eh, hsu jj. asian-americans and pacific islanders in covid-19: emerging disparities amid discrimination. j gen intern med. 2020;35(12):3685–8. doi:10.1007/ s11606-020-06264-5 pmid:33009656 4. mcelfish pa, purvis r, willis de, riklon s. covid-19 disparities among marshallese pacific islanders. prev chronic dis. 2021;18:e02. doi:10.5888/pcd18.200407 pmid:33411668 5. cha l, le t, ve’e t, ah soon nt, tseng w. pacific islanders in the era of covid-19: an overlooked community in need. j racial ethn health disparities. 2022;9(4):1347–56. doi:10.1007/s40615021-01075-8 pmid:34169488 6. international guidelines for certification and classification (coding) of covid-19 as cause of death. geneva: world health organization; 2020. available from: https://www.who.int/publications/m/ item/international-guidelines-for-certification-and-classification%28coding%29-of-covid-19-as-cause-of-death, accessed 19 july 2022. 7. criteria for testing for covid-19 for fiji. suva: fiji ministry of health and medical services; 2020. available from: https:// www.health.gov.fj/wp-content/uploads/2020/06/criteria-fortesting-for-covid-19-for-fiji_upload.pdf, accessed 19 july 2022. 8. statement by the permanent secretary for health & medical services, dr james fong – 05.01.22. suva: fijian government; 2022. available from: https://www.fiji.gov.fj/media-centre/speeches/english/statement-by-the-permanent-secretary-forhea-(116), accessed 1 august 2022. 9. nguyen nt, chinn j, de ferrante m, kirby ka, hohmann sf, amin a. male gender is a predictor of higher mortality in hospitalized adults with covid-19. plos one. 2021;16(7):e0254066. doi:10.1371/journal.pone.0254066 pmid:34242273 10. mukherjee s, pahan k. is covid-19 gender-sensitive? j neuroimmune pharmacol. 2021;16(1):38–47. doi:10.1007/s11481-02009974-z pmid:33405098 11. xu k, wei y, giunta s, zhou m, xia s. do inflammaging and coagulaging play a role as conditions contributing to the co-occurrence of the severe hyper-inflammatory state and deadly coagulopathy during covid-19 in older people? exp gerontol. 2021;151:111423. doi:10.1016/j.exger.2021.111423 pmid:34048906 12. jergović m, coplen cp, uhrlaub jl, nikolich-žugich j. immune response to covid-19 in older adults. j heart lung transplant. 2021;40(10):1082–9. doi:10.1016/j.healun.2021.04.017 pmid:34140221 13. cunha ll, perazzio sf, azzi j, cravedi p, riella lv. remodeling of the immune response with aging: immunosenescence and its potential impact on covid-19 immune response. front immunol. 2020;11:1748. doi:10.3389/fimmu.2020.01748 pmid:32849623 14. dyer o. covid-19: unvaccinated face 11 times risk of death from delta variant, cdc data show. bmj. 2021;374:n2282. doi:10.1136/ bmj.n2282 pmid:34531181 15. mohammed i, nauman a, paul p, ganesan s, chen k-h, jalil sms, et al. the efficacy and effectiveness of the covid-19 vaccines in reducing infection, severity, hospitalization, and mortality: a systematic review. hum vaccin immunother. 2022;18(1):2027160. do i:10.1080/21645515.2022.2027160 pmid:35113777 16. moghadas sm, vilches tn, zhang k, wells cr, shoukat a, singer bh, et al. the impact of vaccination on coronavirus disease 2019 (covid-19) outbreaks in the united states. clin infect dis. 2021;73:2257–64. doi:10.1093/cid/ciab079 pmid:33515252 individuals, and members of the lesbian, gay, bisexual, transgender and queer communities; however, this information was not available. having these data would allow health promotion activities to be targeted to reduce morbidity and mortality in these groups. this retrospective analysis of deaths directly associated with covid-19 that occurred in fiji during the second wave of the pandemic (15 april to 14 november 2021) found that at-risk groups included male, indigenous (itaukei), older (≥70 years) and unvaccinated individuals. therefore, we conclude that individuals belonging to these risk groups in fiji should adhere to the recommended covid-19 precautions and preventive measures to avoid becoming infected with sars-cov-2, and we recommend that future public health prevention strategies, health promotion activities, risk communication materials and public health policies for covid-19 in fiji are tailored to these at-risk populations. strategies should include providing education about the signs and symptoms of severe and progressing covid-19, and increasing the capacity of health systems to identify and respond to a rapid influx of deteriorating patients. acknowledgements we thank dr eric rafai, the head of research at the fiji ministry of health and medical services, for providing the team with guidance and direction throughout the research process. conflicts of interest the authors have no conflicts of interest to declare. ethics statement this study was approved by the human health research ethics review committee of the ministry of health and medical services, fiji (fnhrerc: 59/2021). funding this study was self-funded. references 1. who timeline – covid-19. geneva: world health organization; 2020. available from: https://www.who.int/news/ item/27-04-2020-who-timeline---covid-19, accessed 21 november 2021. wpsar vol 13, no 4, 2022 | doi: 10.5365/wpsar.2022.13.4.964 https://ojs.wpro.who.int/8 sharma et alcovid-19 deaths in fiji 25. morgan ja, biggio jr jr, martin jk, mussarat n, chawla hk, puri p, et al. maternal outcomes after severe acute respiratory syndrome coronavirus 2 (sars-cov-2) infection in vaccinated compared to unvaccinated pregnant patients. obstet gynecol 2021;139:107–9. doi:10.1097/aog.0000000000004621 pmid:34644272 26. power t, wilson d, best o, brockie t, bourque bearskin l, millender e, et al. covid-19 and indigenous peoples: an imperative for action. j clin nurs. 2020;29(15–16):2737–41. doi:10.1111/ jocn.15320 pmid:32412150 27. santos vs, souza araújo aa, de oliveira jr, quintans-júnior lj, martins-filho pr. covid-19 mortality among indigenous people in brazil: a nationwide register-based study. j public health. 2021;43(2):e250–1. doi:10.1093/pubmed/fdaa176 pmid:33044545 28. serván-mori e, seiglie ja, gómez-dantés o, wirtz vj. hospitalisation and mortality from covid-19 in mexican indigenous people: a cross-sectional observational study. j epidemiol community health. 2022;76(1):16–23. doi:10.1136/jech-2020-216129 pmid:34266980 29. carroll sr, akee r, chung p, cormack d, kukutai t, lovett r, et al. indigenous peoples’ data during covid-19: from external to internal. front sociol. 2021;6:617895. doi:10.3389/fsoc.2021.617895 pmid:33869569 30. arshad ar, ijaz f, siddiqui ms, khalid s, fatima a, aftab rk. covid-19 pandemic and antimicrobial resistance in developing countries. discoveries (craiova). 2021;9(2):e127. doi:10.15190/d.2021.6 pmid:34754900 31. tran bx, vu gt, le ht, pham hq, phan ht, latkin ca, et al. understanding health seeking behaviors to inform covid-19 surveillance and detection in resource-scarce settings. j glob health. 2020;10(2):0203106. doi:10.7189/jogh.10.0203106 pmid:33403109 32. ncd: ncds in fiji. suva: fiji ministry of health and medical services; 2022. available from: https://www.health.gov.fj/ncds/ncdsin-fiji/#:~:text=ncds%20in%20fiji&text=in%20recent%20 decades%2c%20ncd’s%20have,and%20those%20numbers%20 are%20growing, accessed 29 july 2022. 17. scobie hm, johnson ag, suthar ab, severson r, alden nb, balter s, et al. monitoring incidence of covid-19 cases, hospitalizations, and deaths, by vaccination status – 13 u.s. jurisdictions, april 4–july 17, 2021. mmwr morb mortal wkly rep. 2021;70(37):1284–90. doi:10.15585/mmwr.mm7037e1 pmid:34529637 18. villar j, ariff s, gunier rb, thiruvengadam r, rauch s, kholin a, et al. maternal and neonatal morbidity and mortality among pregnant women with and without covid-19 infection: the intercovid multinational cohort study. jama pediatr. 2021;175(8):817–26. doi:10.1001/jamapediatrics.2021.1050 pmid:33885740 19. dashraath p, wong jlj, lim mxk, lim lm, li s, biswas a, et al. coronavirus disease 2019 (covid-19) pandemic and pregnancy. am j obstet gynecol. 2020;222(6):521–31. doi:10.1016/j. ajog.2020.03.021 pmid:32217113 20. metz td, clifton rg, hughes bl, sandoval gj, grobman wa, saade gr, et al. association of sars-cov-2 infection with serious maternal morbidity and mortality from obstetric complications. jama. 2022;327(8):748–59. doi:10.1001/jama.2022.1190 pmid:35129581 21. celewicz a, celewicz m, michalczyk m, woźniakowska-gondek p, krejczy k, misiek m, et al. pregnancy as a risk factor of severe covid-19. j clin med. 2021;10(22):5458. doi:10.3390/jcm10225458 pmid:34830740 22. di mascio d, khalil a, saccone g, rizzo g, buca d, liberati m, et al. outcome of coronavirus spectrum infections (sars, mers, covid-19) during pregnancy: a systematic review and meta-analysis. am j obstet gynecol mfm. 2020;2(2):100107. doi:10.1016/j. ajogmf.2020.100107 pmid:32292902 23. stock sj, carruthers j, calvert c, denny c, donaghy j, goulding a, et al. sars-cov-2 infection and covid-19 vaccination rates in pregnant women in scotland. nat med. 2022;28:504–12. doi:10.1038/s41591-021-01666-2 pmid:35027756 24. mahase e. covid-19: severe complications during pregnancy are more common in unvaccinated women, study finds. bmj. 2022;376:o117. doi:10.1136/bmj.o117 pmid:35039319 https://ojs.wpro.who.int/ 1wpsar vol 13, no 2, 2022 | doi: 10.5365/wpsar.2022.13.2.930 covid-19: perspective a s an early warning strategy for coronavirus disease 2019 (covid-19), environmental detection of severe acute respiratory syndrome coronavirus 2 (sars-cov-2) in wastewater was integrated into pandemic responses in australia, germany, new zealand, the united kingdom of great britain and northern ireland, and the united states of america.1–3 research on methodologies for wastewater surveillance (wws) for sars-cov-2 has been undertaken in ecuador, france, india, israel, italy, japan, the netherlands, spain and turkey, to name a few.1 wws of sars-cov-2 has been demonstrated as an early warning system for outbreaks of covid-193 and could be a useful tool for communities across the philippines. antimicrobial resistance (amr) is a pervasive global health concern, complicating treatment of infectious diseases and routine medical procedures. the philippines has experienced increasing numbers of infections resistant to specific antibiotic combinations, for example, carbapenem resistance in a. baumannii has increased from below 30% in 2009 to 56% in 2017.4 globally, reservoirs of antimicrobial-resistant genes (args) have been found in wastewater. this is of interest to health-system managers as args found in wastewater treatment plants have been shown to follow patterns of resistance in clinical isolates.5 new molecular diagnostic laboratories established for the detection of sars-cov-2 in the philippines could be utilized for other emerging infectious diseases and, thus, contribute to improved resilience during future epidemics. this article discusses how the strengthened monitoring and surveillance capacity developed for sars-cov-2 in the philippines provides opportunities for environmental surveillance of emerging infectious diseases and amr. environmental surveillance, specifically wws, could be used as an adjunct to clinical and laboratory diagnosis of individuals for the detection of local outbreaks. similar to clinical testing, wws utilizes reverse transcription-quantitative polymerase chain reaction (rt-qpcr).1,2 community outbreaks of covid-19 could, therefore, be detected using wws regardless of the local government’s capacity for clinical testing. as sars-cov-2 can be shed through stool, wws can detect possible outbreaks from symptomatic and asymptomatic members of the population even before community cases or hospital admissions are reported. targeted testing of communities guided by wws reduces the need to test larger populations, thus reducing the cost to governments.2 it is possible for wws to detect and analyse chemical or biological compounds to understand the health status of communities.1,2 public health and research teams have previously used environmental surveillance for antimicrobial-resistant organisms, args5 and the global polio eradication initiative.6 detection and quantification a alliance for improving health outcomes, inc., quezon city, philippines. b department of biochemistry and molecular biology, college of medicine, university of the philippines, manila, philippines. c department of chemical engineering, gokongwei college of engineering, de la salle university, manila, philippines. d department of biology, college of arts and science, university of the philippines, manila, philippines. e waste and chemicals management unit, center for engineering and sustainable development research, de la salle university, manila, philippines. f department of civil engineering, gokongwei college of engineering, de la salle university, manila, philippines. published: 23 june 2022 doi: 10.5365/wpsar.2022.13.2.930 strengthening health systems resilience using environmental surveillance for covid-19 and antimicrobial resistance in the philippines miguel antonio salazar,a leslie michelle m. dalmacio,b aileen h. orbecido,c ruth c. abanador,d michael angelo promentilla,e arnel b. beltran,c renan ma. t. tanhuecof and marilen parungao balolongd correspondence to miguel antonio salazar (email: mikesalazar@gmail.com) wpsar vol 13, no 2, 2022 | doi: 10.5365/wpsar.2022.13.2.930 https://ojs.wpro.who.int/2 salazar et alenvironmental surveillance for emerging infectious diseases in the philippines study the cost-effectiveness of multidisciplinary wws in the response to emerging infectious diseases. bringing filipino institutions and multidisciplinary professionals together with experience in environmental and clinical surveillance could be a starting point for a national one health integrated surveillance system where clinical and environmental samples from human health systems, animal health systems, food systems and the environment can be analysed and correlated. this system could inform hygiene, sanitation and infection prevention strategies to reduce the risk of spreading amr and infectious disease outbreaks of pandemic potential. a one health integrated surveillance system could increase its reach by building on the growing capacity of filipino medical technologists in the use of rt-qpcr as they handle more samples due to the surge of covid-19 cases. capacity building could also be supplemented by online training from experienced global researchers through today’s communication technology. the philippine interagency committee on antimicrobial resistance (icamr), established in 2014 and comprising the doh, department of agriculture, department of science and technology, department of interior and local government, and department of trade and industry, could oversee the one health integrated surveillance system, as the committee is already strengthening surveillance and laboratory capacity for amr.10 as epidemics continue to affect the philippines, improved preparedness, response and resilience to emerging infectious diseases including amr could be supplemented by a one health integrated surveillance system. to implement such a system, the country would need to develop capacity in environmental surveillance, including wws, making use of existing infrastructure and expertise while exploring possibilities for collaboration with global experts and international partners. national agencies and committees, such as the doh, ritm and icamr, would have to take on responsibility for overseeing and leading this initiative. a multidisciplinary approach and the identification of relevant philippine institutional partners would be needed to sustain this initiative and prepare for emerging infectious diseases and chronic health-system challenges. of sars-cov-2 and args in wastewater provides a risk assessment opportunity for the identification of communities at risk of covid-19 outbreaks and amr patterns from hotspots such as medical facilities. this practice could provide early warning to health authorities and increase case-finding efforts for covid-19 in targeted communities. it could also improve infection prevention and control in amr-affected medical facilities (fig. 1). the philippines has recently increased its molecular laboratory testing capacity for sars-cov-2. the number of public and private sector laboratories with the ability to detect sars-cov-2 using polymerase chain reaction (pcr) increased from one in the first quarter of 2020 to 247 by the end of april 2022.7 prior to the pandemic, capacity in molecular diagnosis for infectious disease was tasked to the research institute for tropical medicine (ritm), which hosts the antimicrobial resistance surveillance program with 24 sentinel sites. ritm has also been developing capacity in whole-genome sequencing of amr.4 compared to human clinical surveillance in the philippines, amr surveillance for animal and environmental health is still under development. there have been few studies carried out on the detection of amr residues in agriculture and food animal production settings.8 ritm has been strengthening its environmental surveillance capacity through its polio wws, while select academic institutions in the country are focusing on amr detection in wastewater and agriculture.4,8,9 currently there is no national initiative for sars-cov-2 wws; however, there are research initiatives underway on the topic. environmental surveillance must involve multisectoral support from biology, chemistry, clinical medicine, chemical engineering, civil engineering, epidemiology, microbiology, public health and waste management. such a multidisciplinary support team would ensure a thorough understanding of wastewater infrastructure and microbiological detection methods and its integration into pandemic response and health systems. as the philippine agency assigned to health protection, the department of health (doh), with ritm, can develop, implement and wpsar vol 13, no 2, 2022 | doi: 10.5365/wpsar.2022.13.2.930https://ojs.wpro.who.int/ 3 environmental surveillance for emerging infectious diseases in the philippinessalazar et al wastewater samples detection and quantification of sars-cov-2 and args prevalence and persistence of sars-cov-2 and args identifying high risk facilities (hospitals, clinics) or communities cross-referencing with antimicrobial resistance in clinical setting identifying areas with possible sars-cov-2 infections identifying cases through medical case finding sars-cov-2 and arg shedding implications for covid-19 wastewater network implications for antimicrobial resistance risk assssment and monitoring improved public health response fig. 1. implications of environmental surveillance using wastewater for covid-19 and antimicrobial resistance arg: antimicrobial-resistant gene. funding this work was in partnership with care philippines – rilhub, through the covrass project. the covrass project is an ongoing wastewater surveillance pilot study for covid-19 and antimicrobial resistance in the city of manila, philippines, in 2021. references 1. westhaus s, weber fa, schiwy s, linnemann v, brinkmann m, widera m, et al. detection of sars-cov-2 in raw and treated wastewater in germany – suitability for covid-19 surveillance and potential transmission risks. sci total environ. 2021;751:141750. doi:10.1016/j.scitotenv.2020.141750 pmid:32861187 2. hillary ls, farkas k, maher kh, lucaci a, thorpe j, distaso ma, et al. monitoring sars-cov-2 in municipal wastewater to evaluate the success of lockdown measures for controlling covid-19 in the uk. water res. 2021;200:117214. doi:10.1016/j.watres.2021.117214 pmid:34058486 acknowledgements the authors would like to acknowledge the institutional support of the alliance for improving health outcomes, the university of the philippines manila, and de la salle university manila. conflicts of interest the authors have no conflicts of interest to declare. ethics statement no ethics permission or approval was required for the writing of this paper, as it contains no confidential information, experimental data, surveys, interviews, or related clinical or patient samples that may require such permission. wpsar vol 13, no 2, 2022 | doi: 10.5365/wpsar.2022.13.2.930 https://ojs.wpro.who.int/4 salazar et alenvironmental surveillance for emerging infectious diseases in the philippines 7. licensed covid-19 testing laboratory in the philippines: 2022-a – licensed covid testing lab. [online database]. manila: department of health; 2022. available from: https://doh.gov.ph/licensed-covid19-testing-laboratories, accessed 1 may 2022. 8. vital pg, zara es, paraoan cem, dimasupil maz, abello jjm, santos itg, et al. antibiotic resistance and extended-spectrum beta-lactamase production of escherichia coli isolated from irrigation waters in selected urban farms in metro manila, philippines. water. 2018;10(5):548. doi:10.3390/w10050548 9. doh-ritm national polio lab and japan niid confirm 26 environmental samples positive for polio. manila: department of health; 2019. available from: https://doh.gov.ph/doh-press-release/dohritm-nat%27l-polio-lab-and-japan-niid-confirm-26-environmentalsamples-positive-for-polio, accessed 11 december 2021. 10. inter-agency committee on antimicrobial resistance (icamr). the philippine action plan to combat antimicrobial resistance 2019– 2023. manila: department of health; 2019. available from: https:// pharma.doh.gov.ph/the-philippine-action-plan-to-combat-antimicrobial-resistance-2019-2023/, accessed 13 december 2021. 3. status of environmental surveillance for sars-cov-2 virus. geneva: world health organization; 2020. available from: https:// www.who.int/publications/i/item/who-2019-ncov-sci-brief-environmentalsampling-2020-1, accessed 13 december 2021. 4. argimón s, masim mal, gayeta jm, lagrada ml, macaranas pkv, cohen v, et al. integrating whole-genome sequencing within the national antimicrobial resistance surveillance program in the philippines. nat commun. 2020;11(1):2719. doi:10.1038/ s41467-020-16322-5 pmid:32483195 5. pärnänen kmm, narciso-da-rocha c, kneis d, berendonk tu, cacace d, do tt, et al. antibiotic resistance in european wastewater treatment plants mirrors the pattern of clinical antibiotic resistance prevalence. sci adv. 2019;5(3):eaau9124. doi:10.1126/sciadv.aau9124 pmid:30944853 6. tuma jn, wilkinson al, diop om, jorba j, gardner t, snider cj, et al. surveillance to track progress toward polio eradication – worldwide, 2019–2020. mmwr morb mortal wkly rep. 2021;70(18):667–73. doi:10.15585/mmwr.mm7018a2 pmid:33956779 https://ojs.wpro.who.int/ 1wpsar vol 13, no 2, 2022 | doi: 10.5365/wpsar.2022.13.2.915 brief report i n australia, as in other developed nations, the coronavirus disease 2019 (covid-19) pandemic has disproportionately affected culturally and linguistically diverse (cald) communities. in many countries, immigrant communities have experienced higher rates of covid-19 infection, hospitalization, severity of disease and death.1–3 we know that, in australia, the risk of transmission and serious illness from covid-19 is not equal across the population – one vulnerable population disproportionately impacted by covid-19 is people from cald backgrounds.4 the discrepancies in outcomes between cald and non-cald populations evident through the covid-19 pandemic were also seen during the 2009 h1n1 pandemic.5,6 it has long been argued that the principles of social justice and corrective justice must be applied in pandemic planning, to enable risk reduction in populations where the need is greatest.7 families and communities are the ultimate recipients of the effects of pandemic plans, and thus need to be involved in their development. any pandemic health policy or plan must address the public’s real concerns and needs, especially among groups who are at higher risk, because this will lead to a reduction in risk for the whole population.8,9 not engaging with vulnerable communities when developing health policies or plans is not only unfair but also endangers the health of the broader population.9 this article presents a rapid assessment of covid-19 pandemic plans applicable to the region of the public health unit (phu) conducting the study. it explores whether the needs, expectations and challenges of cald communities are represented in these plans. the terms “immigrant” and “cald communities” are used interchangeably here. the study did not include a review of all relevant literature or research papers; a multicultural health service, hunter new england health, wallsend, new south wales, australia. b the university of newcastle, callaghan, new south wales, australia. c college of medicine and dentistry, james cook university, townsville, queensland, australia. published: 2 may 2022 doi: 10.5365/wpsar.2022.13.2.915 objective: this paper presents a rapid assessment of coronavirus disease 2019 (covid-19) pandemic plans and explores the representation of culturally and linguistically diverse (cald) communities in such plans. four levels of pandemic plans were reviewed: regional, state, national and international. methods: discussions with representatives from four cald communities informed the development of search and selection criteria for the covid-19 plans, which were gathered and assessed using a cald lens. six covid-19 pandemic plans that met the inclusion criteria were critically assessed. results: the reviewed plans did not report any cald community voices, views or consultations with community groups in the development phase, nor did they acknowledge the diversity of cald populations. a few plans noted the vulnerability of cald communities, but none discussed the challenges cald communities face in accessing health information or health services during the pandemic, or other structural barriers (social determinants of health). discussion: our analysis revealed major gaps in all pandemic plans in terms of engaging with immigrant or cald communities. policies and plans that address and consider the complex needs and challenges of cald communities are essential. collaboration between public health services, multicultural services and policy-makers is vital for the inclusion of this higher-risk population. culturally and linguistically diverse voices and views in covid-19 pandemic plans and policies nafiseh ghafournia,a,b peter d massey,c sunita j rebecca healeya,b and bhavi ravindranb correspondence to nafiseh ghafournia (email: nafiseh.ghafournia@health.nsw.gov.au or nafi.ghafournia@newcastle.edu.au) wpsar vol 13, no 2, 2022 | doi: 10.5365/wpsar.2022.13.2.915 https://ojs.wpro.who.int/2 ghafournia et alcald voices ties and addressing real health needs and challenges. none of the reviewed plans reported any voices, views or consultations with cald community groups in the development phase. there was some mention of the significance of community engagement in the process of policy-making, but there were no details on which communities or how to engage with them. the assessed plans included no acknowledgement of the diversity of cald populations. when immigrant or cald communities were named, they were presented incorrectly as generalized and homogeneous communities. the vulnerability of immigrant and refugee or cald communities was noted in three plans (the two who plans and the covid-19 pandemic plan for the victorian health sector). however, none of the documents discussed cald community challenges in accessing health information or health services during the pandemic or other structural barriers such as social determinants of health. also, the documents did not mention factors such as unemployment, crowded housing, visa status, low health literacy, racism and cultural beliefs. a few references were made to challenges in communication between health organizations and immigrant communities, but the plans tended to fall short of addressing solutions for overcoming barriers to reduce risk. only two plans (the nsw health influenza pandemic plan and the covid-19 pandemic plan for the victorian health sector) talked about the necessity of providing translated information. discussion in general, australian policies and plans do not engage with cald communities, and there is little data regarding the needs of these communities and the challenges they face in accessing health-care systems. this may be an indication of structural racism in the system.10 policies and plans that address and consider the complex needs of and challenges faced by cald communities are essential,8,9 and their development must include the knowledge and expertise of diverse groups from cald communities and multicultural service providers. we call for health plans and policies to be redeveloped to be inclusive, culturally responsive and based on consultation with cald communities. there must be a clear process of engagement, respectful and meaningful rather, the focus was on pandemic plans and policies at multiple settings and levels (from regional to international). methods pandemic plans at regional, state, national and international levels were selected, accessed and then critically assessed through a “cald lens”. the selection criteria included plans that were: • available online at the time of assessment; • updated or published within the past 5 years; and • applicable to the region or state of the phu undertaking the review, to a neighbouring state or to international plans published by the world health organization (who). as part of using a cald lens, discussions with representatives from four cald communities informed the development of the search and selection criteria. these key informants were emailed a series of questions. four consumer representatives of local multicultural health services then discussed the emailed questions with the informants to finalize the assessment questions. the final questions were as follows: 1. does the plan describe a governance structure that includes cald community representatives? 2. does the plan describe any consultation with cald communities before or during the development of the plan? 3. does the plan outline how it reflects and embraces the diversity of cald communities? 4. does the plan reference the challenges cald communities encounter in accessing health systems? 5. does the plan describe how cald communities would be involved in the oversight, implementation or review of the plan when it is operationalized? results six plans met the inclusion criteria and were critically reviewed (table 1). all were found to have major gaps in terms of engaging with immigrant or cald communiwpsar vol 13, no 2, 2022 | doi: 10.5365/wpsar.2022.13.2.915https://ojs.wpro.who.int/ 3 cald voices ghafournia et al table 1. pandemic plans reviewed by setting 2. khunti k, singh ak, pareek m, hanif w. is ethnicity linked to incidence or outcomes of covid-19? bmj. 2020;369:m1548. doi:10.1136/bmj.m1548 pmid:32312785 3. clark a, jit m, warren-gash c, guthrie b, wang hhx, mercer sw, et al. global, regional, and national estimates of the population at increased risk of severe covid-19 due to underlying health conditions in 2020: a modelling study. lancet glob health. 2020;8(8):e1003–17. doi:10.1016/s2214-109x(20)30264-3 pmid:32553130 4. smith ja, judd j. covid-19: vulnerability and the power of privilege in a pandemic. health promot j austr. 2020;31(2):158–60. doi:10.1002/hpja.333 pmid:32197274 5. zhao h, harris rj, ellis j, pebody rg. ethnicity, deprivation and mortality due to 2009 pandemic influenza a(h1n1) in england during the 2009/2010 pandemic and the first post-pandemic season. epidemiol infect. 2015;143(16):3375–83. doi:10.1017/ s0950268815000576 pmid:25850904 6. tricco ac, lillie e, soobiah c, perrier l, straus se. impact of h1n1 on socially disadvantaged populations: summary of a systematic review. influenza other respir viruses. 2013;7(suppl 2):54–8. doi:10.1111/irv.12082 pmid:24034485 7. kayman h, ablorh-odjidja a. revisiting public health preparedness: incorporating social justice principles into pandemic preparedness planning for influenza. j public health manag pract. 2006;12(4):373–80. doi:10.1097/00124784-20060700000011 pmid:16775535 8. oxman ad, lavis jn, lewin s, fretheim a. support tools for evidence-informed health policymaking (stp) 1: what is evidence-informed policymaking? health res policy syst. 2009;7(suppl 1):s1. doi:10.1186/1478-4505-7-s1-s1 pmid:20018099 9. wild a, kunstler b, goodwin d, onyala s, zhang l, kufi m, et al. communicating covid-19 health information to culturally and linguistically diverse communities: insights from a participatory research collaboration. public health res pract. 2021;31(1):3112105. doi:10.17061/phrp3112105 pmid:33690789 10. elias a, paradies y. the costs of institutional racism and its ethical implications for healthcare. j bioeth inq. 2021;18(1):45–58. doi:10.1007/s11673-020-10073-0 pmid:33387263 two-way communication between policy-makers and cald communities to identify culturally appropriate and effective public health control strategies. conclusion despite the health inequities faced by people from cald communities, their voices and needs were not reflected in the pandemic plans assessed in this study. the plans failed to address embedded inequities, which are particularly important in health emergencies. it is recommended that cald communities be included in the development and implementation of pandemic plans. further research should be undertaken with diverse communities to enable effective public health actions for covid-19 and future pandemics. conflicts of interest the authors declare no conflicts of interest. funding no funding was given for this activity. references 1. mude w, meru c, njue c, fanany r. a cross-sectional study of covid-19 impacts in culturally and linguistically diverse communities in greater western sydney, australia. bmc public health. 2021;21(1):2081. doi:10.1186/s12889-021-12172-y pmid:34774039 plan setting website hunter new england pandemic plan for influenza and other respiratory infections regional https://www.hnehealth.nsw.gov.au, accessed 31 august 2020 nsw health influenza pandemic plan state https://www1.health.nsw.gov.au/pds/activepdsdocuments/pd2016_016.pdf, accessed 31 august 2020 covid-19 pandemic plan for the victorian health sector state link is no longer active; available from the corresponding author upon request australian health sector emergency response plan for novel coronavirus (covid-19) national https://www.health.gov.au/resources/publications/australian-health-sector-emergency-response-plan-for-novelcoronavirus-covid-19, accessed 31 august 2020 covid-19 strategy update, world health organization international https://www.who.int/publications/m/item/covid-19-strategy-update, accessed 31 august 2020 operational planning guidelines to support country preparedness and response, covid-19 strategic preparedness and response plan, world health organization international https://www.who.int/publications/i/item/draft-operational-planning-guidance-for-un-country-teams, accessed 31 august 2020 the threat of chikungunya in oceania perspective paul horwood,a grace bande,a rosheila dagina,b laurent guillaumot,c john aaskovd and boris pavline a papua new guinea institute of medical research, goroka, papua new guinea. b papua new guinea national department of health, port moresby, papua new guinea. c institut pasteur de nouvelle calédonie, noumea, nouvelle-caledonie. d who collaborating centre for arbovirus reference and research, queensland university of technology, brisbane, australia. e world health organization, port moresby, papua new guinea. correspondence to paul horwood (e-mail: paul.horwood@pngimr.org.pg). to cite this article: horwood p et al. the threat of chikungunya in oceania. western pacific surveillance and response journal, 2013, 4(2):8–10. doi:10.5365/wpsar.2013.4.2.003 the oceania region, which includes australia, new zealand, papua new guinea and the islands of the tropical pacific ocean, has historically been free from chikungunya. however, the 2011 outbreak in new caledonia and the ongoing outbreak in papua new guinea have highlighted the risk to other communities in oceania where there are competent mosquito vectors and permissive social factors and environmental conditions. in this article we discuss the threat to this region that is posed by the recent evolution of the e1:a226v mutant strains of chikungunya virus (chikv). chikungunya is a mosquito-borne disease caused by infection with chikv, an alphavirus from the togaviridae family. the clinical characteristics of chikungunya include acute onset of fever which may last up to two weeks and painful, potentially debilitating, polyarthritis in adults which may last for up to a year following infection. chikungunya was first recognized in africa in the 1950s, principally, as polyarthritis in adults.1 other symptoms, reported during the large outbreak on réunion island in 2005–2006, included maculopapular rash on the trunk and limbs, headache, nausea, vomiting, diarrhoea and fatigue.2 there are three distinct genotypes of chikv: (1) asian, (2) eastern/central/southern african (ecsa), and (3) western african. the ecsa genotype has been the dominant strain throughout asia and the islands and countries in the indian ocean over the last decade. this genotype gained dominance in 2004 and 2005 when it was introduced from kenya into the indian ocean islands of comoros, réunion, seychelles, mauritius and mayotte where it was associated with an outbreak involving hundreds of thousands of reported cases.3 on the island of réunion, it was estimated that more than 30% of the 770 000 inhabitants were infected by chikv.2 in 2005, an epidemic of chikungunya began in india which resulted in more than 1.39 million suspected cases by 2011.4 the ecsa genotype of chikv also spread to other asian countries including sri lanka, malaysia, singapore, thailand, indonesia, china and myanmar.3,5 previous outbreaks of chikv infection have been associated with the mosquito vector aedes aegypti, which is also the vector of yellow fever and dengue viruses. however, aedes albopictus has been the principal mosquito vector during many of the recent outbreaks of chikungunya associated with ecsa strains.6 analysis of chikv from the explosive outbreaks in réunion and india revealed that the ecsa strains had acquired a point mutation resulting in a change from alanine to valine at position 226 in the e1 glycoprotein which enhanced the transmissibility of chikv in aedes albopictus.7 subsequent studies demonstrated that amino acid changes in the e2 glycoprotein had a strong modulating effect on the e1:a226v change.8 until the outbreak of chikungunya in new caledonia from february to june 2011, which was caused by asian-lineage chikv rather than the e1:a226v esca lineage,9 oceania had been free from chikungunya. during this outbreak, only 33 cases were detected, attributed to the onset of the cold season and the comprehensive control measures implemented after the diagnosis of the first cases. in june 2012, an outbreak of fever and arthritis was detected in vanimo, papua new guinea. subsequent investigations showed that the outbreak was caused by an ecsa strain of chikv which harboured the e1:a226v mutation. during the vanimo outbreak more than 1500 suspected cases of chikungunya were reported through passive surveillance.10 the vector in this outbreak was suspected to be aedes albopictus due to the high density of this mosquito species in the area. following this outbreak, chikungunya cases were confirmed by real-time reverse-transcriptase polymerase chain reaction from eight provinces of papua new guinea, with another three provinces having suspected outbreaks. interestingly, the outbreak extended to the highlands region of papua new guinea, which is the first confirmed arboviral outbreak recorded in this region of the country. although no entomologic surveys have been conducted in the highlands region for many years, it has been shown that aedes mosquitoes are present in abundant numbers. this may have important implications as more than 50% of the papua new guinea population live in the highlands region. in oceania, a considerable number of endemic mosquitoes belonging to the genus stegomyia and the “scutellaris group,” such as ,aedes polynesiensis in french polynesia, are recognized as vectors of chikv.11,12 more importantly, the principal vectors of chikungunya, aedes aegypti and aedes albopictus, are both prevalent throughout the region. aedes aegypti is present in all countries in the pacific except for new zealand, futuna and some small isolated islands.13 aedes albopictus invaded oceania in the 1960s14 and now can be found throughout papua new guinea, the torres strait region of australia, fiji, solomon islands, tonga and probably vanuatu,13,15 thus rendering the human populations of these islands vulnerable to introduction of the epidemic ecsa strains of chikv. the explosive outbreak of chikungunya in the indian ocean islands and the speed with which the related alphavirus, ross river virus, swept through the pacific in 1979 and 1980,16 is a reminder of the potential impact chikv could have in oceania (figure 1). figure 1. recent outbreaks of chikungunya in oceania and the distribution of aedes vectors click to download table 1. jpg, 790kb note: countries in red had previous chikungunya outbreaks. * aedes aegypti is found throughout the region except in futuna and some isolated islands. † the presence of aedes albopictus has not been officially confirmed in vanuatu; however, its presence is strongly suspected. ‡ aedes albopictus has not been detected in the marshall islands or the federated states of micronesia; however, its presence is suspected due to the proximity of islands such as guam and palau where the vector has been confirmed. social, economic and environmental factors all play an important role in the introduction and sustained transmission of arboviral diseases like chikungunya. in developing countries such as papua new guinea and many other pacific island communities, poor living conditions and the abundance of natural and artificial mosquito breeding sites can result in the rapid spread of arboviral epidemics. the climatic conditions of oceania (temperature, humidity) favour year-round mosquito breeding and are unlikely to interrupt the transmission cycle of chikv. it is doubtful that any pacific island community has the human or financial resources to mount a vector control effort that would prevent an outbreak of chikungunya. however, efficient surveillance, targeted vector control (including active community participation for breeding sites elimination) and education in mosquito avoidance measures may provide a cost effective reduction in the burden of disease in the event of an outbreak. a coordinated regional strategy to prevent and respond to vectorborne disease outbreaks in oceania is urgently needed to mitigate future outbreaks of arboviral diseases such as chikungunya and dengue. conflicts of interest none declared. funding none. references: robinson mc. an epidemic of virus disease in southern province, tanganyika territory, in 1952–53. i. clinical features. transactions of the royal society of tropical medicine and hygiene, 1955, 49:28–32. doi:10.1016/0035-9203(55)90080-8 pmid:14373834 borgherini g et al. outbreak of chikungunya on reunion island: early clinical and laboratory features in 157 adult patients. clinical infectious diseases, 2007, 44:1401–1407. doi:10.1086/517537 pmid:17479933 ng lc, hapuarachchi hc. tracing the path of chikungunya virus–evolution and adaptation. infection, genetics and evolution, 2010, 10:876–885. doi:10.1016/j.meegid.2010.07.012 pmid:20654736 kumar np et al. a226v mutation in virus during the 2007 chikungunya outbreak in kerala, india. journal of general virology, 2008, 89:1945–1948. doi:10.1099/vir.0.83628-0 pmid:18632966 qiaoli z et al. maiden outbreak of chikungunya in dongguan city, guangdong province, china: epidemiological characteristics. plos one, 2012, 7:e42830. doi:10.1371/journal.pone.0042830 pmid:22916166 de lamballerie x et al. chikungunya virus adapts to tiger mosquito via evolutionary convergence: a sign of things to come? the journal of general virology, 2008, 5:33–36. doi:10.1186/1743-422x-5-33 pmid:18304328 tsetsarkin ka et al. a single mutation in chikungunya virus affects vector specificity and epidemic potential. plos pathogens, 2007, 3:e201. doi:10.1371/journal.ppat.0030201 pmid:18069894 tsetsarkin ka et al. epistatic roles of e2 glycoprotein mutations in adaption of chikungunya virus to aedes albopictus and aedes aegypti mosquitoes. plos one, 2009, 4:e6835. doi:10.1371/journal.pone.0006835 pmid:19718263 dupont-rouzeyrol m et al. chikungunya virus and the mosquito vector aedes aegypti in new caledonia (south pacific region). vector borne and zoonotic diseases, 2012, 12:1036–1041. doi:10.1089/vbz.2011.0937 pmid:23167500 horwood pf et al. outbreak of chikungunya virus infection, vanimo, papua new guinea. emerging infectious diseases, 2013 doi:10.3201/eid1909.130130 gilotra sk, shah kv. laboratory studies on transmission of chikungunya virus by mosquitoes. american journal of epidemiology, 1967, 86:379–385. pmid:4383438 guillaumot l. arboviruses and their vectors in the pacific–status report. pacific health dialog, 2005, 12:45–52. pmid:18181493 guillaumot l et al. distribution of aedes albopictus (diptera, culicidae) in southwestern pacific countries, with a first report from the kingdom of tonga. parasites & vectors, 2012, 5:247–252. doi:10.1186/1756-3305-5-247 pmid:23130961 cooper rd et al. aedes albopictus (skuse) (diptera: culicidae) in the western province of papua new guinea and the threat of its introduction to australia. journal of the australian entomological society, 1994, 33:115–116. doi:10.1111/j.1440-6055.1994.tb00933.x ritchie sa et al. discovery of a widespread infestation of aedes albopictus in the torres strait, australia. journal of the american mosquito control association, 2006, 22:358–365. doi:10.2987/8756-971x(2006)22[358:doawio]2.0.co;2 pmid:17067032 derraik jg et al. chikungunya virus: a novel and potentially serious threat to new zealand and the south pacific islands. the american journal of tropical medicine and hygiene, 2010, 83:755–759. doi:10.4269/ajtmh.2010.10-0123 pmid:20889861 https://ojs.wpro.who.int/ 1wpsar vol 12, no 1, 2021 | doi: 10.5365/wpsar.202011.3.016 case report/case series a department of internal medicine, baguio general hospital and medical center published: 10 march 2021 doi: 10.5365/wpsar.2020.11.3.016 the rainy season in the philippines is from june to october; this is when the number of dengue cases typically increases. in 2020 during this time, the world was facing the threat of severe acute respiratory syndrome coronavirus 2 (sarscov-2) infection. coronavirus disease 2019 (covid-19) and dengue viral infections have similar presentations and laboratory findings, including fever and thrombocytopenia, and there have been reports of coinfection with sars-cov-2 and arthropod-borne virus. here, we report a case of sars-cov-2–dengue virus coinfection in the philippines in a female aged 62 years, whose early symptom was fever and who was positive for sars-cov-2 and positive for dengue. early recognition of such coinfection is important so that proper measures can be taken in the management of the patient. d engue fever is a mosquito-borne viral infection found mostly in tropical climates, including the philippines. the clinical manifestations of dengue may include high-grade fever, headache, retroorbital pain, muscle and joint pains, and rashes. in 2019, the philippines had one of the highest numbers of reported dengue cases among countries in asia and south-east asia.1 according to the world health organization (who), there were 55 160 cases of dengue in the philippines from 1 january to 18 july 2020, a 66% reduction compared with the same period in 2019.2 the endemic occurrence of dengue in 2020 coincided with the outbreak of covid-19 infection. as of 11 august 2020, the philippines has recorded 139 538 confirmed cases of covid-19, making it the country with the highest number of cases in the who western pacific region.3 here, we present the case of a female aged 62 years who presented at the emergency department with suspected covid-19 and a suspicion of dengue fever; diagnostic tests were positive for both infections. case identification a female aged 62 years with hypertension who resided in the northern part of the philippines presented at the emergency department on the evening of 4 august 2020 with body malaise and fever. two days before her admission, the patient started to experience high-grade fever (highest recorded at 39.5 °c), with associated headache (frontoparietal in location, rated 5/10 and bandlike in character) and retro-orbital pain, generalized body ache, myalgia and arthralgia. there was no associated nausea, vomiting or blurring of vision. the patient had pain over the ankle joints, with no associated warmth or limitation of movement, and no rashes, cough or dyspnoea. the patient had self-medicated with paracetamol, which afforded temporary relief; however, her condition was persistent, with body malaise and weakness, prompting consultation at baguio general hospital and medical center emergency department. the patient was admitted to the covid-19 ward under the internal medicine service, as a suspected case of covid-19. the patient denied any history of travel outside the town or direct contact with anyone positive for covid-19. she reported attending the public market three days before onset of her symptoms. at the emergency department, the initial physical examination of the patient was unremarkable except for decreased breath sound on the right basal lung field. given the history of fever, the patient was managed as a suspected case of covid-19. laboratory tests included reverse transcriptase polymerase chain reaction (rt-pcr) for covid-19 (sansure biotech®), chest x-ray, complete blood count, blood culture, and inflammatory markers such as lactate dengue–covid-19 coinfection: the first reported case in the philippines angyap saipen,a bernard demot,a lowella de leona correspondence to angyap lyn saipen (email: lynzala@gmail.com) wpsar vol 12, no 1, 2021 | doi: 10.5365/wpsar.2019.10.4.003 https://ojs.wpro.who.int/2 saipen et aldengue–covid-19 coinfection: the first reported case in the philippines cov-2) pneumonia and minimal pleural effusion on the right. on the fifth day of hospitalization (day 7 of illness) maculopapular rashes appeared over the patient’s lower extremity, with some areas of erythematous petechial confluence and islands of normal skin (fig. 2). a repeat test for dengue igm/igg on day 8 of illness was positive for igg but negative for igm. a repeat chest x-ray on day 9 of illness showed regression of previously noted densities in both lobes (fig. 1). on the succeeding days, increasing trends in the number of platelets and leukocytes were noted. a further dengue igm/igg test on day 10 of illness yielded the same result as the previous test. after 10 days in hospital, the patient was discharged with her symptoms improved. discussion fever is the most common symptom of covid-19 infection.4 in the case presented here, the patient had experienced two days of febrile episodes. given her recent frequent travels to the public market, she was managed as a suspected case of covid-19 and was isolated pending the result of a swab. however, the patient also manifested with typical symptoms of dengue, such as fever, generalized body ache, myalgia, arthralgia, retroorbital pain and headache.5 because the patient could not remember any history of mosquito bite, we hypothesize that she was exposed to the dengue virus one week before her symptoms, at which time there were cases of dengue in her neighbourhood. the appearance of her symptoms coincided with the incubation period of the dengue virus – usually 4–10 days after the mosquito bite5 – suggesting a high probability of dengue infection in this patient. the decreasing numbers of wbcs and platelets also made the diagnosis of dengue likely.5 however, thrombocytopenia and leukopenia are also common in covid-19 patients.6 the patient’s complete blood count result was consistent with both viral infections (i.e. leukopenia, with progressive thrombocytopenia occurring on succeeding days). the positive result from the dengue ns1 antigen test from the sample taken on the first day of hospitalization confirmed the dengue infection, although the igg/igm test at that time was negative. dengue rt-pcr, enzyme-linked immunoassay (elisa) and viral culture are the ideal laboratory tests dehydrogenase (ldh), erythrocyte sedimentation rate (esr), ferritin, c-reactive protein (crp), aspartate aminotransferase (ast) and alanine aminotransferase (alt). the complete blood count initially revealed leukopenia at 3.16 × 10⁹/l (neutrophils 75%, lymphocytes 18%), with haemoglobin and platelet counts being normal (140 g/l and 156 × 109/l, respectively). chest x-ray revealed pneumonia on the right lower lobe of the lung (fig. 1). there was no growth on blood culture. markers of inflammation were elevated, including ferritin at 2156 ng/ml, esr at 35 mm/hour, crp at 18.73 mg/l and ldh at 317.92 u/l. liver enzymes were elevated, with ast at 100.24 u/l (× 2.86) and alt at 65.11 u/l (×1.86). course in the ward in the covid-19 ward, the patient’s social and environmental history was further investigated. a suspicion of dengue fever was considered after a comprehensive history had been taken from the patient, as she stated that dengue cases were present in her neighbourhood, with the latest case occurring one week before her symptoms commenced. the patient could not recall having any previous dengue infection. rapid diagnostic tests (rdts) for dengue non-structural protein 1 (ns1) antigen and dengue duo (wondfo®) for immunoglobulins (igm/ igg) were requested. the patient was positive for ns1 but negative for both igm and igg. the patient was then managed for suspected coinfection with dengue fever and covid-19. on the second day in hospital, the patient received a positive result from the covid-19 rt-pcr (fam/ orf1ab 36.46). a repeat of the complete blood count showed a sudden drop in the platelet count, from the initial 156 × 109/l to 85 × 109/l. there was persistent leukopenia at 2.85 × 10⁹/l, with a notable increase in the lymphocyte count (from 18% to 37%). the patient consented to receiving favipiravir, started at 1800 mg (9 tablets twice a day) as a loading dose then reduced to four tablets twice a day for 13 days. later tests showed further decreases in platelet counts, falling to 37 × 109/l on the fourth day of hospitalization (table 1). a differential count of white blood cells (wbc) showed a further increase in lymphocytes to 49%. a chest computed tomography (ct) scan showed posterior-basal pneumonia with features atypical of severe acute respiratory syndrome coronavirus 2 (sarswpsar vol 12, no 1, 2021 | doi: 10.5365/wpsar.2019.10.4.003https://ojs.wpro.who.int/ 3 dengue–covid-19 coinfection: the first reported case in the philippinessaipen et al table 1. summary of laboratory tests during the hospital stay (day 3 to day 11 of illness) laboratory tests day of illnessa day 3 day 4 day 5 day 6 day 7 day 8 day 9 day 10 day 11 cbc hgb 140 147 152 136 140 137 hct 0.40 0.43 0.45 0.39 0.40 0.40 wbc 3.16 2.85 6.43 9.41 9.62 8 neu 75 55 39 34 35 49 lym 18 37 43 49 48 42 plt 156 85 49 37 100 197 ldh 317.92 crp 18.73 esr 35 ast 100.24 alt 65.11 ferritin 2156 blood a and b (–) covid-19 rt-pcr (+) (–) dengue ns1 (+) (–) (–) dengue igm/igg (–) igg (+) igg (+) alt: alanine aminotransferase; ast: aspartate aminotransferase; cbc: complete blood count; crp: c-reactive protein; esr: erythrocyte sedimentation rate; hct: haematocrit; hgb: haemoglobin; ig: immunoglobulin; ldh: lactate dehydrogenase; lym: lymphocytes; neu: neutrophils; plt: platelets; rt-pcr: reverse transcriptase polymerase chain reaction; wbc: white blood cells. a the patient developed clinical illness on 2 august 2020 and was admitted to hospital on 4 august 2020 (day 3 of illness). fig. 1. chest radiographic image a b fig. 1a. initial x-ray: pneumonia, both lower lobes. fig. 1b. repeat image: regression of pneumonia. wpsar vol 12, no 1, 2021 | doi: 10.5365/wpsar.2019.10.4.003 https://ojs.wpro.who.int/4 saipen et aldengue–covid-19 coinfection: the first reported case in the philippines for the diagnosis of dengue. however, the only diagnostic tests available to the institution were the rdts for dengue igm/igg and the ns1 antigen. the handbook for clinical management of dengue notes that diagnosis of dengue infection is confirmed by the detection of the virus, the viral genome or ns1 antigen, or by seroconversion of igm or igg (i.e. from negative to positive).5 thus, the positive ns1 antigen test in this patient supported the diagnosis of dengue. the negative igg and igm may have been due to the timing of the collection of serum, given that dengue igm serology has been shown to have low sensitivity during the early phase of dengue fever.7 however, a negative antibody serology does not rule out dengue fever, especially when the dengue ns1 antigen test is positive. samples taken from the patient on days 5 and 8 of hospitalization showed seroconversion of igg but not of igm. given that the patient resided in a locality where dengue is endemic and cases have been reported, and had symptomatology and physical examination results suggestive of dengue fever, the combined positive ns1 test and the seroconversion of igg improved the accuracy of the dengue fever diagnosis in this case. in the natural course of dengue, igm appears a few days following the onset of fever, followed by detectable igg from day 5 onwards. the patient in this case study had a persistent negative igm assay despite seroconversion of igg, suggesting probable secondary dengue infection. although the patient could not recall a previous dengue infection, she resides in a locality where dengue cases occur year-round; thus, it is possible that she had an undetected primary dengue infection. primary dengue virus infections are often asymptomatic, and 90% of cases of dengue fever with symptoms occur following a second exposure.8 also, a low to negative igm and a positive igg for dengue may relate to recent secondary infection rather than being a marker of past infection.9 in the setting of a positive covid-19 rt-pcr result, persistence of a positive igm or igg result on follow-up studies supports coinfection with dengue and covid-19.10 there have been few reported cases of such coinfections globally. two cases reported were patients with a history of travel presenting with respiratory symptoms or rashes (or both).11,12 however, there have also been false positive results of dengue tests concurrent with sars-cov-2 infection.13,14 in march 2020, two patients in singapore were reported as having false positive results from a dengue rdt but were later found to have confirmed sars-cov-2 infection.13 dengue igm and igg were noted to have cross-reactions with other flaviviruses such as malaria and leptospirosis. ns1 antigen testing is useful for differentiating between true dengue infections and false positives or coinfections, especially in resource-limited institutions, because the fig. 2. erythematous petechial rashes on the lower extremities on day 7 of illness wpsar vol 12, no 1, 2021 | doi: 10.5365/wpsar.2019.10.4.003https://ojs.wpro.who.int/ 5 dengue–covid-19 coinfection: the first reported case in the philippinessaipen et al ns1 antigen is highly specific for dengue fever and has no cross-reactions, even with other flaviviruses.10 studies on coinfections with sars-cov-2 and arboviruses are lacking, which is not surprising given that sars-cov-2 is a new disease. an extensive literature search on dengue and covid-19 in the philippines suggested that no previous case of dengue and covid-19 coinfection has been reported in the country. the medical challenge of such coinfection lies in the similarity of the clinical and laboratory features of the two infections;13 that is, fever, myalgia and headache, associated with leukopenia, thrombocytopenia and abnormal liver function.14 hence, it is important to consider the possibility of covid-19 in patients positive for dengue and vice versa, since the result will affect management and prognosis. to avoid missing the diagnosis, we recommend testing for dengue infection once there is a high level of suspicion of dengue fever. at the same time, we recommend that testing for covid-19 infection be considered in patients who present with history of fever or whose symptomatology is suggestive of infection by an agent other than sars-cov-2. ethics informed verbal and written consent was given by the patient. acknowledgement we acknowledge the contribution of dr thea pamela cajulao, fpcp, fpsmid, chair of the infection prevention and control committee and committee on emerging and re-emerging infections, internist (infectious disease specialist) and the incident commander for covid-19 at the baguio general hospital and medical center, for her continued support during the management of the patient and the preparation of this case report, and for leading the team against covid-19. conflict of interest none declared. funding none references 1. philippines: dengue outbreak jul 2019. available from: https:// reliefweb.int/disaster/ep-2019-000084-phl 2. world health organization. dengue situation update. available from: https://www.who.int/docs/default-source/wpro— documents/emergency/surveillance/dengue/dengue-20200702. pdf?sfvrsn=fc80101d_36 3. world health organization. coronavirus disease (covid-19) dashboard. available at: https://covid19.who.int/table 4. interim guidance on the clinical management of adult patients with suspected or confirmed covid-19 infection version 3.1, as of july 20, 2020 psmid.org. 2020 [cited 29 september 2020]. available from: https://www.psmid.org/interim-management-guidelines-for-covid-19-version-3-1/ 5. philippine college of physicians. handbook for clinical management of dengue. available at: https://www.pcp.org.ph/images/ web_posting /others/psbim/handbook_for_clinical_management_of_dengue.pdf 6. violetis oa, chasouraki am, giannou am, baraboutis ig. covid-19 infection and haematological involvement: a review of epidemiology, pathophysiology and prognosis of full blood count findings. sn compr clin med. 2020 jun 29;2(8):1–5 doi:10.1007/s42399-020-00380-3 pmid:32838152 7. teng cl, wong ch. does negative igm dengue serology rule out dengue fever in an adult with fever for three days? malays fam physician. 2013; 8(3): 26–27. available from: https://www.ncbi. nlm.nih.gov/pmc/articles/pmc4391515/ 8. yeo as, azhar na, yeow w, talbot cc jr, khan ma, shankar em, et al. lack of clinical manifestations in asymptomatic dengue infection is attributed to broad down-regulation and selective up-regulation of host defence response genes. plos one. 2014 04 11;9(4):e92240. doi:10.1371/journal.pone.0092240 pmid:24727912 9. rubens costa lima j, rouquayrol mz, monteiro callado mr, florindo guedes mi, pessoa c. interpretation of the presence of igm and igg antibodies in a rapid test for dengue: analysis of dengue antibody prevalence in fortaleza city in the 20th year of the epidemic. rev soc bras med trop. 2012 marapr;45(2):163–7. doi:10.1590/s0037-86822012000200005 pmid:22534985 10. kembuan gj. dengue serology in indonesian covid-19 patients: coinfection or serological overlap? idcases. 2020 aug 5;22:e00927. doi:10.1016/j.idcr.2020.e00927 pmid:32802747 11. epelboin l, blondé r, nacher m, combe p, collet l. covid-19 and dengue co-infection in a returning traveller. j travel med. 2020 sep 26;27(6):taaa114. doi:10.1093/jtm/ taaa114 pmid:32657339 12. verduyn m, allou n, gazaille v, andre m, desroche t, jaffar mc, et al. co-infection of dengue and covid-19: a case report. plos negl trop dis. 2020 aug 3;14(8):e0008476. doi:10.1371/journal.pntd.0008476 pmid:32745101 13. yan g, lee ck, lam ltm, yan b, chua yx, lim ayn, et al. covert covid-19 and false-positive dengue serology in singapore. lancet infect dis. 2020 may;20(5):536. doi:10.1016/ s1473-3099(20)30158-4 pmid:32145189 14. ridwan r. covid-19 and dengue: a deadly duo. trop doct. 2020 jul;50(3):270–2. doi:10.1177/0049475520936874 pmid:32588763 https://ojs.wpro.who.int/ 1wpsar vol 13, no 1, 2022 | doi: 10.5365/wpsar.2022.13.1.906 outbreak investigation report c oronavirus disease 2019 (covid-19), caused by severe acute respiratory syndrome coronavirus 2 (sars-cov-2), was first reported in wuhan city, china, in december 2019 and rapidly spread worldwide.1 nosocomial sars-cov-2 outbreaks have been reported in several countries, including australia,2 china,3,4 germany5 and japan.6-8 on 7 april 2020, a patient who had previously been admitted to a tokyo hospital due to an exacerbation of chronic heart failure developed a fever and dyspnoea 10 days after discharge and was subsequently diagnosed with covid-19. at the same time, a member of the cleaning staff from the same ward as the patient (ward a) was referred to the emergency department with fever and dyspnoea and was subsequently diagnosed with covid-19. on 14 april 2020, two patients, a nurse and a nursing assistant in ward b became febrile. the two health-care workers (hcws) were also diagnosed with covid-19. this report summarizes the outbreak investigation conducted into the covid-19 cases in wards a and b by the hospital infection control team and public health centre staff during the early stages of the covid-19 pandemic, a period of low community transmission in tokyo. a department of infectious diseases, tokyo metropolitan bokutoh general hospital, tokyo, japan. b field epidemiology training program, national institute of infectious diseases, tokyo, japan. c sumida public health center, tokyo, japan. d center for surveillance, immunization, and epidemiologic research, national institute of infectious diseases, tokyo, japan. published: 24 march 2022 doi: 10.5365/wpsar.2022.13.1.906 objective: coronavirus disease 2019 (covid-19), caused by severe acute respiratory syndrome coronavirus 2 (sarscov-2), was first reported in china and subsequently spread worldwide. in japan, many clusters occurred during the first wave in 2020. we describe the investigation of an early outbreak in a tokyo hospital. methods: a covid-19 outbreak occurred in two wards of the hospital from april to early may 2020. confirmed cases were individuals with laboratory-confirmed sars-cov-2 infection linked to wards a and b, and contacts were patients or workers in wards a or b 2 weeks before the index cases developed symptoms. all contacts were tested, and cases were interviewed to determine the likely route of infection and inform the development of countermeasures to curb transmission. results: there were 518 contacts, comprising 472 health-care workers (hcws) and 46 patients, of whom 517 were tested. sars-cov-2 infection was confirmed in 42 individuals (30 hcws and 12 patients). the proportions of sars-cov-2 infections in hcws were highest among surgeons, nurses, nursing assistants and medical assistants. several hcws in these groups reported being in close proximity to one another while not wearing medical masks. among hcws, infection was thought to be associated with the use of a small break room and conference room. discussion: nosocomial sars-cov-2 infections occurred in two wards of a tokyo hospital, affecting hcws and patients. not wearing masks was considered a key risk factor for infection during this outbreak; masks are now a mandated countermeasure to prevent the spread of sars-cov-2 infection in hospital settings. nosocomial outbreak of coronavirus disease in two general wards during the initial wave of the pandemic in 2020, tokyo, japan naoya sakamoto,a masayuki ota,b tomoko takeda,c atsushi kosaka,a takuya washino,a sentaro iwabuchi,a minako beppu,c itaru nishiduka,c tamano matsui,d motoi suzukid and fukumi nakamura-uchiyamaa correspondence to naoya sakamoto (email: naoya_sakamoto@tmhp.jp) wpsar vol 13, no 1, 2022 | doi: 10.5365/wpsar.2022.13.1.906 https://ojs.wpro.who.int/2 sakamoto et alnosocomial outbreak of covid-19 all contacts were tested using rt-pcr. a nasopharyngeal swab or sputum sample was collected from all contacts initially, and if the first test result was negative, contacts were retested if they developed new or persistent symptoms. if a hcw tested positive, all hcws using the same break room or conference room were considered contacts and tested. if a contact tested positive, all patients in the same room as a patient and all hcws who had had contact with the patient were also considered contacts and tested. patients in wards a and b were observed for symptoms for 14 days after outbreak control measures were implemented, and hcws were followed up for 14 days from their final exposure to an index case or cluster. results outbreak description from 7 april to 3 may 2020, the time from the first case until the last contact was tested, 518 contacts were identified (472 hcws and 46 patients). the hcws included 107 doctors, 62 nurses and 303 other medical personnel. all but one contact (471 hcws and 46 patients) underwent rt-pcr testing. table 1 summarizes the outbreak investigation of the hcws. a total of 42 people had positive rt-pcr tests: 30 hcws and 12 patients. of the 30 positive hcws, 12 were symptomatic (nine from ward a or b and three who reported having contact in the break room with workers from ward a or b who tested positive) and 18 were asymptomatic. of the 12 positive patients, 10 were symptomatic and two were asymptomatic. the sars-cov-2 infection rate among surgeons in ward b was 30.4% (7/23), for nursing assistants the rate was 17.2% (5/29), for nurses in ward a it was 11.8% (4/34), for nurses in ward b it was 14.3% (4/28) and among clerks it was 9.7% (3/31), compared with rates of 0–5% among the other occupational groups, which included, for example, pharmacists, laboratory technicians and cleaning staff (table 1). the epidemic curve of symptomatic cases suggests that the outbreak started in ward a and spread to ward b within a week (fig. 1). at interview, some surgeons reported not wearing masks during their biweekly conferences in a small conference room and other hcws reported using the small break room without masks. methods setting the hospital in tokyo is a tertiary care facility with 765 beds and 39 subspecialties, including an infectious diseases department. ward a is a general ward for patients with heart or renal disease, and ward b is a general ward for surgery, gynaecology and gastrointestinal disease patients. during the 3 months preceding april 2020, the occupancy rate in the hospital’s 719 general beds, including 32 intensive care unit beds, ranged from 80% to 85%. outbreak investigation and laboratory methods confirmed cases were defined as individuals with a positive sars-cov-2 result from real-time reverse transcription polymerase chain reaction (rt-pcr) testing of a nasopharyngeal sample or sputum sample, regardless of whether they were symptomatic, as per the world health organization’s interim guidance for covid-19 surveillance.9 a cluster was defined as more than two epidemiologically linked cases, such as people who were on the same ward at the same time. the two clusters of covid-19 in wards a and b were reported to the public health centre on 20 april 2020, and the hospital and public health centre requested assistance in investigating the outbreak from the ministry of health, labour and welfare in japan. the assistance provided by the ministry included developing infection prevention and control measures and interviewing hospital staff to assess their use of personal protective equipment, the break room and conference room; the nursing system – for example, how many patients each nurse was responsible for and how teams of nurses worked; and frequency of patient contact among hcws. interviews were conducted by an experienced interviewer, but the interviewer did not use a standardized questionnaire. as the source of the virus within the hospital was unclear and there was a possibility of additional undetected cases, we used a broad definition of a contact. a contact was defined as an individual who was hospitalized or worked in ward a or b 2 weeks before the index cases developed symptoms. this group included discharged patients from both wards and patients who had been transferred from ward a or b to other wards. wpsar vol 13, no 1, 2022 | doi: 10.5365/wpsar.2022.13.1.906https://ojs.wpro.who.int/ 3 nosocomial outbreak of covid-19sakamoto et al table 1. number and proportion of health-care workers by test result in the investigation of a covid-19 outbreak in two wards of a tokyo hospital, japan, 2020 fig. 1. epidemic curve of confirmed symptomatic cases of covid-19, by date of symptom onset during an outbreak in two wards in a tokyo hospital, japan, 2020 (n = 22) working ward and occupation health-care workers total no. no. defined as contacts no. tested no. positive tests positive test (%)symptomatic asymptomatic ward a nurse 34 34 34 0 4 11.8 doctor cardiologist 14 14 14 0 0 0 nephrologist 9 9 9 0 0 0 cardiac surgeon 3 3 3 0 0 0 other doctor 9 9 9 0 0 0 ward b nurse 28 28 28 4 0 14.3 doctor surgeon 23 23 23 1 6 30.4 gynaecologist 22 22 22 0 1 4.5 gastroenterologist 20 20 20 0 1 5.0 other doctor 7 7 7 0 0 0 unspecified warda nursing assistant 29 29 29 3 2 17.2 clerk 32 32 31 1 2 9.7 medical worker 81 76 76 2 0 2.6 radiology technologist 51 49 49 0 1 2.0 other occupationsb 155 117 117 1 1 1.7 total 517 472 471 12 18 6.4 a this category includes those who worked on all hospital wards – that is, they worked on either or both wards a and b – and those who tested positive during contact tracing. b workers in this category included pharmacists, rehabilitation therapists, laboratory technicians and cleaning staff. hcw: health-care worker outbreak investigation report fig. 1. epidemic curve of confirmed symptomatic cases of covid-19, by date of symptom onset during an outbreak in two wards in a tokyo hospital, japan, 2020 (n = 22) hcw: health-care worker. 0 1 2 3 30 -m ar 31 -m ar 1ap r 2ap r 3ap r 4ap r 5ap r 6ap r 7ap r 8ap r 9ap r 10 -a pr 11 -a pr 12 -a pr 13 -a pr 14 -a pr 15 -a pr 16 -a pr 17 -a pr 18 -a pr 19 -a pr 20 -a pr 21 -a pr 22 -a pr 23 -a pr 24 -a pr patients in ward a hcws in ward a patients in ward b hcws in ward b hcws in other wards date of symptom onset, 2020 n o. o f c as es wpsar vol 13, no 1, 2022 | doi: 10.5365/wpsar.2022.13.1.906 https://ojs.wpro.who.int/4 sakamoto et alnosocomial outbreak of covid-19 the small conference room, and nurses reported using a small break room, both of which may have contributed to transmission, as has been reported previously.2 there were 18 asymptomatic cases in hcws who also may have contributed to the spread of covid-19 in the hospital while they were unknowingly infectious,10-12 especially among those who gathered in close proximity without wearing a medical mask. appropriate mask use by hcws can prevent the spread of sars-cov-2 in hospitals and allow for better infection control.13–15 although self-quarantine, universal mask use and physical distancing are now standard practice,4,16 these were not universal during the early phase of the pandemic. it is also possible that some infections in hcws might not have been transmitted in the hospital but may have been community-acquired, although the rate of communityacquired infection was relatively low at the time. this study has some limitations. a standardized questionnaire was not used during interviews with contacts; therefore, the data collected did not allow for robust analysis of the use of break rooms and conference rooms; personal protective equipment, such as gloves and gowns; handwashing; the performance of medical procedures for inpatient care; and the extent and timing of exposure to infected patients. also, the approximately 2-week delay in collecting information is likely to have resulted in some recall bias. contact tracing was limited to the hospital setting, and there was no contact tracing among outpatients or visitors. however, we consider it unlikely that sars-cov-2 infections were introduced by outpatients or visitors because outpatients usually do not enter the wards and there were restrictions on visitors. finally, we were unable to standardize the timing of testing after exposure and the retest protocol for contacts who were negative on initial testing, and this could have resulted in false-negative cases. in summary, this outbreak investigation documents nosocomial sars-cov-2 infection among hcws and patients that occurred in two hospital wards during the initial wave of the covid-19 pandemic in 2020 in an area with a low rate of community-acquired infection and before vaccines were available. extensive contact tracing was conducted with high testing coverage only of contacts within the hospital setting. because nosocomial infections can spread from asymptomatic or presymptomatic individuals to unmasked hcws, outbreak management after the two clusters of covid-19 were recognized in the two wards, new admissions were stopped on ward a on 14 april 2020, in ward b on 16 april 2020 and hospitalwide on 21 april 2020. all patients who met discharge criteria, except those in wards a and b, were discharged. on 18 april 2020, all medical services were suspended, including at the tertiary care centre. however, 24-hour emergency services for patients not requiring admission, the perinatal medical centre and psychiatric emergency centre remained open. visits by family members had been restricted from early march 2020 (i.e. they were limited to family members who had been asymptomatic within the previous 2 weeks, a maximum of 15 minutes per visit, and only one visitor per patient), and visits were completely banned after 27 april 2020. all covid-19 cases in the hospital were transferred to a dedicated ward, and patients from wards a and b with negative rt-pcr results were isolated in ward a. environmental cleaning was conducted in all wards. break room use by hcws was modified so that fewer people used the rooms; hcws were advised not to sit facing each other; and partitions were provided for when they had to face each other. before starting work each day, staff were asked about symptoms and had their temperature checked. the infection control team provided education to hcws about control measures. these measures were implemented for approximately 1 month, and there were no new laboratory-confirmed cases after 28 april 2020. the hospital resumed regular services on 18 may 2020, with a dedicated ward for patients suspected to have covid-19 (i.e. patients with acute respiratory failure or fever of unknown origin). discussion this report describes a covid-19 outbreak in a tertiary care hospital in tokyo during the first phase of the pandemic. clusters of cases were reported from two general wards, with the infection spreading among hcws. the source of sars-cov-2 infection in each ward was not identified. the infection rate of sars-cov-2 for hcws was highest among surgeons, nurses and clerks. several surgeons reported holding twice-weekly conferences in wpsar vol 13, no 1, 2022 | doi: 10.5365/wpsar.2022.13.1.906https://ojs.wpro.who.int/ 5 nosocomial outbreak of covid-19sakamoto et al 5. schwierzeck v, könig jc, kühn j, mellmann a, correa-martínez cl, omran h, et al. first reported nosocomial outbreak of severe acute respiratory syndrome coronavirus 2 (sars-cov-2) in a pediatric dialysis unit. clin infect dis. 2020;72(2):265–70. doi:10.1093/cid/ciaa491 pmid:33501962 6. uchida t, takagi y, mizuno a, okamura h, saito h, ide s, et al. [retrospective analysis of nosocomial covid-19: a comparison between patients with haematological disorders and other diseases]. rinsho ketsueki. 2020;61(8):857–64 (in japanese). doi:10.11406/ rinketsu.61.857 pmid:32908046 7. iio r, kaneko t, mizuno h, isaka y. clinical characteristics of covid-19 infection in a dialysis center during a nosocomial outbreak. clin exp nephrol. 2021;25(6):652–9. doi:10.1007/s10157-02102025-8 pmid:33555454 8. furuse y, sando e, tsuchiya n, miyahara r, yasuda i, ko yk, et al. clusters of coronavirus disease in communities, japan, january– april 2020. emerg infect dis. 2020;26(9):2176–9. doi:10.3201/ eid2609.202272 pmid:32521222 9. global surveillance for covid-19 caused by human infection with covid-19 virus: interim guidance, 20 march 2020. geneva: world health organization; 2020. available from: https://apps.who.int/ iris/handle/10665/331506, accessed 23 september 2021. 10. zou l, ruan f, huang m, liang l, huang h, hong z, et al. sarscov-2 viral load in upper respiratory specimens of infected patients. n engl j med. 2020;382(12):1177–9. doi:10.1056/nejmc2001737 pmid:32074444 11. arons mm, hatfield km, reddy sc, kimball a, james a, jacobs jr, et al. presymptomatic sars-cov-2 infections and transmission in a skilled nursing facility. n engl j med. 2020;382(22):2081–90. doi:10.1056/nejmoa2008457 pmid:32329971 12. furukawa nw, brooks jt, sobel j. evidence supporting transmission of severe acute respiratory syndrome coronavirus 2 while presymptomatic or asymptomatic. emerg infect dis. 2020;26(7):e201595. doi:10.3201/eid2607.201595 pmid:32364890 13. hendrix mj, walde c, findley k, trotman r. absence of apparent transmission of sars-cov-2 from two stylists after exposure at a hair salon with a universal face covering policy—springfield, missouri. mmwr morb mortal wkly rep. 2020;69(28):930–2. doi:10.15585/mmwr.mm6928e2 pmid:32673300 14. wang x, ferro eg, zhou g, hashimoto d, bhatt dl. association between universal masking in a health care system and sars-cov-2 positivity among health care workers. jama. 2020;324(7):703–4. doi:10.1001/jama.2020.12897 pmid:32663246 15. chu dk, akl ea, duda s, solo k, yaacoub s, schünemann hj; covid-19 systematic urgent review group effort (surge) study authors. physical distancing, face masks, and eye protection to prevent person-to-person transmission of sars-cov-2 and covid-19: a systematic review and metaanalysis. lancet. 2020;395(10242):1973–87. doi:10.1016/ s0140-6736(20)31142-9 pmid:32497510 16. wee le, conceicao ep, sim xyj, aung mk, tan ky, wong hm, et al. minimizing intra-hospital transmission of covid-19: the role of social distancing. j hosp infect. 2020;105(2):113–5. doi:10.1016/j.jhin.2020.04.016 pmid:32294511 stringent infection prevention and control measures are required to prevent hospital-based outbreaks; these measures include wearing masks and avoiding close contact when not wearing medical masks in small rooms. acknowledgments the authors would like to thank all who contributed to management of the outbreak and care of the patients. ethics statement this covid-19 outbreak investigation was conducted according to the policy for active surveillance issued by the ministry of health, labour and welfare in japan. the institutional ethical review board at the hospital approved this project (trial registration no. 02-028; registered on 25 june 2020). conflicts of interest none declared. funding none. references 1. zhu n, zhang d, wang w, li x, yang b, song j, et al. a novel coronavirus from patients with pneumonia in china, 2019. n engl j med. 2020;382(8):727–33. doi:10.1056/nejmoa2001017 pmid:31978945 2. johnston fh, anderson t, harlock m, castree n, parry l, marfori t, et al. lessons learnt from the first large outbreak of covid-19 in health-care settings in tasmania, australia. western pac surveill response j. 2021;12(4):1-7. doi:10.5365/wpsar.2021.12.4.884 pmid:35251738 3. wang d, hu b, hu c, zhu f, liu x, zhang j, et al. clinical characteristics of 138 hospitalized patients with 2019 novel coronavirus–infected pneumonia in wuhan, china. jama. 2020;323(11):1061– 9. doi:10.1001/jama.2020.1585 pmid:32031570 4. wong scy, kwong rt, wu tc, chan jwm, chu my, lee sy, et al. risk of nosocomial transmission of coronavirus disease 2019: an experience in a general ward setting in hong kong. j hosp infect. 2020;105(2):119–27. doi:10.1016/j.jhin.2020.03.036 pmid:32259546 https://ojs.wpro.who.int/ 1wpsar vol 12, no 4, 2021 | doi: 10.5365/wpsar.2021.12.4.878 covid-19: original research g enomic sequencing for characterization of severe acute respiratory syndrome coronavirus 2 (sars-cov-2) was developed early during the coronavirus disease 2019 (covid-19) pandemic.1,2 since then, genomics has been used internationally to understand the dynamics of viral transmission3 and the genetic evolution of the virus.4-6 locally, genomic analysis has been used to analyse transmission routes, assign likely origins of infection, link outbreak cases and inform public health interventions and policies.7–11 integrated analysis of genomic and epidemiological data provides additional benefits for public health investigations12–14 and has been used during the covid-19 pandemic.9,14–16 genomic sequencing of sars-cov-2 polymerase chain reaction (pcr)-positive diagnostic samples combined with epidemiological data has been shown to be beneficial in investigating health-careassociated infections,9,17 monitoring community transmission,8-10 informing public health responses9,10,18 and understanding the pathology of the disease.9,10,18 a tasmanian school of medicine, university of tasmania, tasmania, australia. b public health services, tasmanian department of health, tasmania, australia. c menzies institute for medical research, university of tasmania, tasmania, australia. d microbiological diagnostic unit public health laboratory, department of microbiology & immunology, university of melbourne at the doherty institute, victoria, australia. e tasmanian health services, tasmanian department of health, tasmania, australia. published: 22 december 2021 doi: 10.5365/wpsar.2021.12.4.878 objective: we undertook an integrated analysis of genomic and epidemiological data to investigate a large health-careassociated outbreak of coronavirus disease 2019 (covid-19) and to better understand the epidemiology of covid-19 cases in tasmania, australia. methods: epidemiological data collected on covid-19 cases notified in tasmania between 2 march and 15 may 2020, and positive samples of severe acute respiratory syndrome coronavirus 2 (sars-cov-2) or rna extracted from the samples were included. sequencing was conducted by tiled amplicon polymerase chain reaction with artic v1 or v3 primers and illumina sequencing. consensus sequences were generated, sequences were aligned to a reference sequence and phylogenetic analysis was performed. genomic clusters were determined and integrated with epidemiological data to provide additional information. results: all 231 covid-19 cases notified in tasmania during the study period and 266 sars-cov-2-positive samples, representing 217/231 (94%) notified cases, were included; 184/217 (84%) were clustered, 21/217 (10%) were unique and 12/217 (6%) could not be sequenced. genomics confirmed the presence of seven clusters already identified through epidemiological links, clarified transmission networks in which the epidemiology had been unclear and identified one cluster that had not previously been recognized. discussion: genomic analysis provided useful additional information on covid-19 in tasmania, including evidence of a large health-care-associated outbreak linked to an overseas cruise, the probable source of infection in cases with no previously identified epidemiological link and confirmation that there was no identified community transmission from other imported cases. genomic insights are an important component of the response to covid-19, and continuing genomic surveillance is warranted. covid-19: integrating genomic and epidemiological data to inform public health interventions and policy in tasmania, australia nicola stephens,a,b michelle mcpherson,a,b louise cooley,a,e rob vanhaeften,e mathilda wilmot,d courtney lane,d michelle harlock,b kerryn lodo,b natasha castree,b torsten seemann,d michelle sait,d susan ballard,d kristy horan,d mark veitch,b fay johnston,b,c norelle sherryd and ben howdend correspondence to nicola stephens (email: nicola.stephens@utas.edu.au) wpsar vol 12, no 4, 2021 | doi: 10.5365/wpsar.2021.12.4.878 https://ojs.wpro.who.int/ stephens et alintegrating covid-19 genomic and epidemiological data 2 methods covid-19 cases notified to the tasmanian department of health between 2 march and 15 may 2020 were included in the analysis. pcr-positive samples for sars-cov-2, or extracted rna if such samples were not available, were referred to the mdu with any epidemiological data that had been collected and were stored in the tasmanian government’s covid-19 database. epidemiological clusters were defined as two or more covid-19 cases that were linked by person, place and/or time, cases linked to an international cruise or cases linked to an interstate cluster. the epidemiological data were analysed with stata v14. they comprised demographics; onset date; whether the case resided in an aged-care facility or was a health or aged-care worker and, if so, whether they had worked in the 24 hours and/or 14 days before onset; whether the case was linked to a cluster and, if so, the outbreak code; whether they had travelled overseas or interstate and the countries or jurisdictions visited; whether they had had contact with a known case; and place of acquisition (if known) or whether no source was identified. sequencing and phylogenetic analyses were conducted as described by seemann et al. briefly, rna extracted from sars-cov-2 reverse transcription pcrpositive samples underwent tiled amplicon pcr with artic (version 1 or 3) primers. sequencing libraries were prepared from amplicons with nexteraxt and sequenced on illumina nextseq. reads were aligned against a sars-cov-2 reference genome (mn9008947.3 wuhan hu-1), and consensus sequences were generated. quality control for consensus sequences included requiring 80% of the genome to be recovered, 25 single nucleotide polymorphisms from the reference genome and ≤300 ambiguous or missing bases. sequences with 65–80% genome recovery were assessed for potential inclusion in the phylogenetic analysis. a maximum likelihood algorithm was used for phylogenetic reconstruction. genomic clusters were determined with clusterpicker and curated with the cleaned epidemiological data. each confirmed case was assigned a genomic cluster identifier in australia, integration of genomic sequencing into the response to covid-19 has allowed clusters and outbreaks to be identified and transmission chains to be rapidly detected.9 genomic data enhance national surveillance data by clarifying the source of infection in outbreak settings and in cases with no known source of infection, by characterizing clusters of disease transmission5 and by providing evidence of the introduction of lineages into australia and any changes in cases acquired locally and overseas.19 tasmania, an island state of australia with a population of approximately 540 000, had one of australia’s first documented health-care-associated outbreaks of covid-19. the first case of covid-19 in tasmania was notified on 2 march 2020. by 2 april 2020, a total of 80 cases had been notified, the distribution approximating the geographical distribution of the population throughout the state. epidemiological investigations indicated that most infections had been acquired overseas (68/80, 85%), with a small number acquired locally after exposure to a known case (4/80, 5%) and 8 (10%) cases under investigation at the time (internal reports, department of health tasmania, 2020). on 3 april 2020, two cases were notified in health-care workers (hcws) in a hospital in northwest tasmania, and a third was notified the following day. these three cases signalled the beginning of a large outbreak that occurred among three health-care facilities and resulted in 138 cases.20,21 at the time, the outbreak of covid-19 was the largest to have occurred in a health-care facility in australia, and public health investigations were critical to both control the outbreak and inform future public health actions. to provide further evidence for the public health investigation and management of the outbreak in northwest tasmania and to better understand the epidemiology of all covid-19 cases in the state, the tasmanian department of health in collaboration with the microbiological diagnostic unit public health laboratory (mdu) undertook an integrated analysis of genomic and epidemiological data for covid-19 cases in tasmania. this paper describes the findings. wpsar vol 12, no 4, 2021 | doi: 10.5365/wpsar.2021.12.4.878https://ojs.wpro.who.int/ 3 integrating covid-19 genomic and epidemiological datastephens et al of whom approximately 900 subsequently developed covid-19.22 this genomic cluster had two subgroups (a.1 and a.2 below) with dates of onset of 8 and 17 march, respectively (fig. 1). clusters a.1 and a.2 were very closely related, separated by one cluster-defining single nucleotide polymorphism. genomic cluster a.1 genomic cluster a.1 comprised 29 cases, including 17 returned overseas cruise a passengers (one of whom was admitted to hospital a and was thought to have been one of the index cases of the northwest outbreak), five hcws from hospital a, six of their household contacts and a case not linked epidemiologically to the northwest outbreak. these corresponded to cases in ec02 and ec08. five cases in this cluster, all returned overseas cruise a passengers, were hospitalized (four at a hospital in southern tasmania and one at hospital a), of whom two were admitted to an intensive care unit and two died. three of the hcws from hospital a reported having worked while symptomatic. the number of cases in cluster a.1 was highest in march, and cases continued to be detected until mid-april. the unlinked case was a hcw from another hospital in northwest tasmania, with no identifiable source of infection, despite extensive public health investigations. all hcws who had worked at the hospital during their period of acquisition had done so before overseas cruise a docked in sydney. the infection was thought to have been acquired during unidentified contact with a returned overseas cruise a passenger or a secondary case in the days before symptom onset. this case was not linked epidemiologically to any subsequent case. genomic cluster a.2 genomic cluster a.2 comprised 120 cases and consisted of another overseas cruise a passenger who was also admitted to hospital a and 119 cases associated with the northwest outbreak. this subcluster comprised 72 staff members, 23 patients and 24 of their contacts (linked to hospital cases but who were not admitted to the hospital) and the one overseas cruise a case, corresponding to one case from ec02 and cases from the other northwest outbreak clusters (ec08–ec11). which was uploaded onto the tasmanian covid-19 database. further analysis was conducted with stata v14 to compare epidemiological clusters with the identified genomic clusters, unique cases and those that could not be sequenced. results epidemiological clusters twelve epidemiological clusters were identified in tasmania before the genomic analysis. one was a cluster seeded from a returned international traveller (ec01), six were linked to separate overseas cruises (ec02–ec06, ec12), one was a case linked to an interstate cluster (ec07) and four were part of the northwest outbreak – the main outbreak of 129 cases and smaller linked clusters at an aged-care facility, within the community and at an additional hospital (ec08–ec11) (table 1). genomic clusters the 266 sars-cov-2-positive samples were referred to the mdu, representing 217 of the 231 cases (94% of all cases) notified during the study period. fourteen samples were not referred because of insufficient sample volume or very high cycle threshold (correlated with low levels of virus in the sample). of the 217, 184 were part of a genomic cluster, 21 were unique (singletons) and 12 could not be sequenced (i.e. did not meet the sequencing quality control criteria). eight genomic clusters were identified, clusters a–g (including two subclusters, a.1 and a.2), ranging in size from 2 to 149 cases (fig. 1); all but one genomic cluster corresponded to epidemiological clusters or known travel partners (table 1; fig. 2). genomic cluster a the largest genomic cluster, cluster a, corresponded to cases from overseas cruise a (ec02) and the large northwest outbreak (ec08-ec11), confirming that the northwest outbreak was seeded from infections originally acquired on overseas cruise a. two travellers on this cruise were admitted to hospital a in northwest tasmania and were in genomic cluster a – one in each of the subgroups a.1 and a.2. the ship had travelled from sydney to new zealand with approximately 2700 passengers, wpsar vol 12, no 4, 2021 | doi: 10.5365/wpsar.2021.12.4.878 https://ojs.wpro.who.int/ stephens et alintegrating covid-19 genomic and epidemiological data 4 almost one quarter of the cases (n = 28; 23%) were hospitalized, although 19 were infected as inpatients at the hospital, and one was admitted to an intensive care unit. there were 10 deaths: the returned cruise passenger and nine inpatients. most of the cases in this subcluster (n = 95; 79%) reported having had contact with a confirmed case, and 72 had been identified as contacts before infection. the first three notified cases were in hcws who had had no direct contact with a case. twelve of the 72 staff members, 57 worked at hospital a, six at a co-located private hospital and two at the neighbouring hospital; seven staff worked at more than one of these facilities. five cases were part of a community cluster linked to hospital a (ec10), two were part of a cluster at the neighbouring hospital (ec11) and one from an aged-care facility was linked to a case at hospital a (ec09). cluster a.2 was first detected in mid-march, with the outbreak peaking in the second week of april. table 1. tasmanian covid-19 epidemiological and genomic clusters, 2 march–15 may 2020 fig. 1. epidemic curve of tasmanian covid-19 cases by genomic cluster note: not all cases linked to the epidemiological clusters were submitted for genomic analysis; therefore, the numbers of cases per epidemiological cluster do not always add up to the number by genomic cluster. epidemiological cluster id number of epidemiologically linked cases epidemiological links genomic cluster ec01 3 index case acquired overseas; transmission on local cruise c ec02 22 overseas cruise a a.1 and a.2 ec03 15 (14 on cruise plus one secondary case) overseas cruise b b ec04 1 overseas cruise c not clustered ec05 1 overseas cruise d sequencing failed ec06 9 overseas cruise e d ec07 1 local case linked to interstate cluster g (one of the three cases in this genomic cluster) ec08 129 northwest outbreak a.1 ec09 1 northwest outbreak cluster 1; aged-care facility (index case in ec08) a.2 ec10 6 northwest outbreak cluster 2; community cluster (index case in ec08) a.2 ec11 2 northwest outbreak cluster 3; additional hospital (index case in ec08) a.2 ec12 1 overseas cruise f not clustered 0 2 4 6 8 10 12 14 16 01 f eb 03 f eb 05 f eb 07 f eb 09 f eb 11 f eb 13 f eb 15 f eb 17 f eb 19 f eb 21 f eb 23 f eb 25 f eb 27 f eb 29 f eb 02 m ar 04 m ar 06 m ar 08 m ar 10 m ar 12 m ar 14 m ar 16 m ar 18 m ar 20 m ar 22 m ar 24 m ar 26 m ar 28 m ar 30 m ar 01 a pr 03 a pr 05 a pr 07 a pr 09 a pr 11 a pr 13 a pr 15 a pr 17 a pr 19 a pr 21 a pr 23 a pr 25 a pr 27 a pr 29 a pr 01 m ay 03 m ay 05 m ay 07 m ay 09 m ay 11 m ay 13 m ay 15 m ay 17 m ay 19 m ay 21 m ay 23 m ay 25 m ay 27 m ay 29 m ay a.2 a.1 b d c g e f h sequence data not available not clustered genomic cluster n u m b er o f ca se s date of sample collection wpsar vol 12, no 4, 2021 | doi: 10.5365/wpsar.2021.12.4.878https://ojs.wpro.who.int/ 5 integrating covid-19 genomic and epidemiological datastephens et al fig. 2. tasmanian covid-19 cases by epidemiological link, genomic cluster and putative source of acquisition, 2 march–15 may 2020 just returned from an overseas trip to canada, where they probably acquired covid-19 infection. two further cases were infected during the overnight tour. genomic cluster e cluster e comprised two co-travellers within australia who were linked epidemiologically but not defined as an epidemiological cluster. the onset of the two cases occurred within two days; one case was hospitalized. genomic clusters f and h genomic clusters f and h also comprised two people each, who were co-travellers who had acquired their infection overseas. these two clusters were also linked epidemiologically but not defined as an epidemiological cluster. one couple had travelled to the usa and the other to germany and the united arab emirates. none of these cases was hospitalized. genomic cluster g genomic cluster g contained three cases not epidemiologically linked before the genomic analysis. one case was epidemiologically linked to two travellers from queensland while infectious and corresponded to ec07, cases associated with the outbreak, including 10 hcws, were already experiencing symptoms of covid-19 by the time the first two hospital-acquired cases were notified to the tasmanian department of health. genomic clusters b–h the remaining genomic clusters (b–h) ranged in size from 2 to 17 people, and, aside from cluster g, all had identified epidemiological links to specific sources, such as other cruise ships or travelling companions who had recently returned from interstate or overseas (tables 1 and 2). genomic clusters b and d these two genomic clusters were associated with two separate overseas cruises, comprising 14 and nine cases, respectively, and corresponded to ec03 and ec06. all but one case in cluster b acquired covid-19 while on the cruise. the additional case in cluster b was a contact of a case from the cruise. genomic cluster c this genomic cluster, comprising the cases from ec01, was associated with a group that travelled on a yacht tour of the east coast of tasmania. the index case had ob1 ob2 ob8 ob3 ob4 ob5 ob6 ob7 ob11 ob9 ob10 genomic cluster a.1 a.2 b c d e f g h not clustered sequence data not available putative acquisition tasmanian acquired interstate or overseas acquired wpsar vol 12, no 4, 2021 | doi: 10.5365/wpsar.2021.12.4.878 https://ojs.wpro.who.int/ stephens et alintegrating covid-19 genomic and epidemiological data 6 non-clustered cases there were 21 cases with unique genomic sequences and onset dates between 12 february and 4 april 2020. the group included four of the initial cases notified in tasmania (fig. 1). all were travel-related cases: two cases had travelled on different cruise ships (one each from ec04 and ec12), 18 had travelled internationally and one had travelled to victoria. the cases had visited 15 different countries, and nine had travelled to several countries (table 2, fig. 2). six cases (29%) reported having had contact with confirmed covid-19 cases: two were household contacts and four were travel conwhile the source of infection was not identified for the other two cases. two of the cases were employed in jobs that required close contact with the public (taxi driver and tour bus driver), while the other was a tourist. all three were in the southern tasmania area at the same time as the queensland cases, although no clear epidemiological link was found between two of the cases and the queensland travellers. sequencing results uploaded to australia’s platform for real-time analysis of integrated pathogen genomic data for public health, austrakka,23 have since confirmed that the cluster g cases were closely related to interstate samples from queensland, victoria, new south wales and south australia. table 2. characteristics of covid-19 genomic clusters, tasmania, 2020 genomic cluster id (number of cases) onset date range (duration in days) no. asymptomatic no. in hospital no. of covid-19 deaths no. of health-care workersa contact with covid-19 case in 14 days before symptom onset identified as contact before infection place of acquisition a.1 (n = 29) 8 march– 14 april (38) 1 5 (all cruise), 2 in icu 2 (cruise) 6 27 (5 hs, 6 non-hospital, 17 other) 27 (4 hs, 6 non-hospital, 17 other) 17 overseas 12 tasmania a.2 (n = 120) 17 march– 24 april (39) 6 28 (6 hs, 20 patients) 10 (10 patients) 72 95 (56 hs, 16 patients, 23 other) 72 (41 hs, 10 patients, 20 non-hospital, 1 cruise) 1 overseas 119 tasmania b (n = 14) 14 march– 25 march (12) 1 0 0 3 14 14 13 overseas 1 tasmania c (n = 3) 11 march– 12 march (2) 0 2 0 0 3 2 1 overseas 2 tasmania d (n = 9) 20 march– 4 april (26) 0 1 0 1 9 9 9 overseas e (n = 2) 24 march– 26 march (3) 0 1 icu 0 0 1 1 2 australia f (n = 2) 12 march– 13 march (2) 0 0 0 0 0 0 2 overseas g (n = 3) 18 march– 1 april (15) 0 0 0 0 1 1 3 tasmania h (n = 2) 15 march (1) 0 0 0 0 0 0 2 overseas non-clustered cases (n = 21) 12 february– 4 april (na) 0 2 0 2 6 2 2 cruise 18 overseas 1 australiab n/s (n = 12) 27 february– 16 april (na) 1 3 (2 nw outbreak) 1 (nw outbreak) 2 5 5 (2 cruise, 2 nw outbreak, 1 community cluster) 3 cruise 5 overseas 4 australiab n/s: sequencing not successful; hs: hospital staff; icu: intensive care unit; nw: northwest a indicates whether the case is a hcw, not where their infection was acquired. b australia other than tasmania wpsar vol 12, no 4, 2021 | doi: 10.5365/wpsar.2021.12.4.878https://ojs.wpro.who.int/ 7 integrating covid-19 genomic and epidemiological datastephens et al three cases linked by genomic analysis were not previously epidemiologically linked, suggesting limited community transmission relatively early in the outbreak in tasmania (18 march to 1 april), when most other cases were in returned international travellers. these three cases were linked geographically and temporally and had exposures related to travel or tourists. more recent sequencing has shown that these cases are linked to interstate samples, demonstrating the importance and utility of sequence-sharing between jurisdictions for public health. similarly, a previously unrelated case was linked to the first subcluster of the overseas cruise a/ health-care-associated outbreak. after intensive review of the data, community transmission is also considered to be the most likely source of infection in this case. genomic analysis added value by quantifying the effectiveness of tasmania’s public health interventions. aside from the transmission described above, genomic analysis found no evidence of community transmission in tasmania by the other 113 cases in returned travellers, highlighting the success of quarantine, contact-tracing and testing procedures in the state. integration of genomic sequence data with epidemiological data improves understanding of sars-cov-2 transmission patterns and outbreak dynamics.24 routine inclusion of genomic data into public health surveillance can inform interventions and monitor their success,9 indicate the likely source of infection in outbreaks or in cases with no known source and highlight patterns of transmission in populations.25 the analyses were conducted retrospectively in victoria; however, tasmania has since developed genomic capacity locally, which will improve the timeliness of future outbreak investigations. genomics can also play an important part in monitoring the evolution of sars-cov-2 over time and changes in its pathogenicity, immunogenicity or transmissibility.25,26 genomic surveillance will also be critical in monitoring selective pressure from vaccines as they are rolled out.26,27 a major strength of our study was our ability to combine genomic sequence with epidemiological data for 94% of the tasmanian covid-19 cases. a high rate of genomic sequencing was achieved because genomic surveillance programmes were already in place for other priority public health pathogens, with strong partnerships and capabilities among key organizations, providing the necessary infrastructure, governance and tacts. all the cases were symptomatic, and two were hospitalized; there were no deaths. there were two cases in the group that had travelled together, each initially nominated as a contact of the other. they had travelled to europe (austria, england and italy); they had onset of infection days apart but had unrelated genomic sequences. cases that could not be sequenced samples from 12 cases could not be sequenced: seven were in the epidemiological clusters, and the remaining five had travelled overseas; none reported known contact with a confirmed covid-19 case (fig. 2). those in known clusters included three from separate cruises (one each from ec02, ec03 and ec05) and four from the northwest outbreak (two patients and one staff member from ec08 and one that was part of the community cluster ec10). the onset dates ranged from 27 february to 16 april (fig. 1). discussion we used genomic sequencing to add further evidence to the epidemiological data collected on covid-19 cases in tasmania, australia. we were able to illustrate transmission routes within the state, from when the first case was notified through to when tasmania effectively eliminated the virus. we found 31 groups of sars-cov-2 genomic sequences in 217 cases notified in tasmania (eight genomic clusters, one split into two subclusters and 23 singletons unrelated to other cases by genomics), reflecting the broad travel histories associated with the cases. the most valuable information provided by this study was that a large health-care-associated outbreak in northwest tasmania was seeded from overseas cruise a, as initially hypothesized in the case series review.20 two separate transmission pathways were identified from overseas cruise a passengers admitted to hospital to hcws, which then spread to two other hospital campuses, to close contacts of the hcw cases and to a limited extent into the community. this genomic cluster continued from early march to late april and ended after initiation of control measures, including hospital closure, cleaning and disinfection, a 14-day regional lockdown, quarantining of contacts and their households and screening of hospital staff before they returned to work. wpsar vol 12, no 4, 2021 | doi: 10.5365/wpsar.2021.12.4.878 https://ojs.wpro.who.int/ stephens et alintegrating covid-19 genomic and epidemiological data 8 3. hahn g, lee s, weiss st, lange c. unsupervised cluster analysis of sars-cov-2 genomes reflects its geographic progression and identifies distinct genetic subgroups of sars-cov-2 virus. genet epidemiol. 2021;45(3):316–23. doi:10.1002/gepi.22373 pmid:33415739 4. alouane t, laamarti m, essabbar a, hakmi m, bouricha e, chemao-elfihri mw, et al. genomic diversity and hotspot mutations in 30,983 sars-cov-2 genomes: moving toward a universal vaccine for the “confined virus”? pathogens. 2020;9(10):829. doi:10.3390/pathogens9100829 pmid:33050463 5. communicable disease network of australia. australian national disease surveillance plan for covid-19. canberra: commonwealth of australia; 2020. available from: https://www.health.gov.au/resources/publications/australian-national-disease-surveillance-planfor-covid-19#:~:text=the%20plan%20is%20a%20living,of%20 covid%2d19%20in%20australia, accessed 29 september 2021. 6. rahimi a, mirzazadeh a, tavakolpour s. genetics and genomics of sars-cov-2: a review of the literature with the special focus on genetic diversity and sars-cov-2 genome detection. genomics. 2021;113(1 pt 2):1221–32. doi:10.1016/j.ygeno.2020.09.059 pmid:33007398 7. zhang w, govindavari jp, davis bd, chen ss, kim jt, song j, et al. analysis of genomic characteristics and transmission routes of patients with confirmed sars-cov-2 in southern california during the early stage of the us covid-19 pandemic. jama netw open. 2020;3(10):e2024191. doi:10.1001/jamanetworkopen.2020.24191 pmid:33026453 8. rockett rj, arnott a, lam c, sadsad r, timms v, gray ka, et al. revealing covid-19 transmission in australia by sarscov-2 genome sequencing and agent-based modeling. nat med. 2020;26(9):1398–404. doi:10.1038/s41591-020-1000-7 pmid:32647358 9. seemann t, lane cr, sherry nl, duchene s, goncalves da silva a, caly l, et al. tracking the covid-19 pandemic in australia using genomics. nat commun. 2020;11(1):4376. doi:10.1038/s41467020-18314-x pmid:32873808 10. lai a, bergna a, caucci s, clementi n, vicenti i, dragoni f, et al. molecular tracing of sars-cov-2 in italy in the first three months of the epidemic. viruses. 2020;12(8):798. doi:10.3390/v12080798 pmid:32722343 11. covid-19 genomics uk consortium. reports, news, commentaries and blogs from cog-uk; 2020. available from: https://www. cogconsortium.uk/news/, accessed 29 september 2021. 12. grubaugh nd, ladner jt, lemey p, pybus og, rambaut a, holmes ec, et al. tracking virus outbreaks in the twenty-first century. nat microbiol. 2019;4(1):10–9. doi:10.1038/s41564-0180296-2 pmid:30546099 13. armstrong gl, maccannell dr, taylor j, carleton ha, neuhaus eb, bradbury rs, et al. pathogen genomics in public health. n engl j med. 2019;381(26):2569–80. doi:10.1056/nejmsr1813907 pmid:31881145 14. khoury mj, armstrong gl, bunnell re, cyril j, iademarco mf. the intersection of genomics and big data with public health: opportunities for precision public health. plos med. 2020;17(10):e1003373. doi:10.1371/journal.pmed.1003373 pmid:33119581 15. geoghegan jl, ren x, storey m, hadfield j, jelley l, jefferies s, et al. genomic epidemiology reveals transmission patterns and dynamics of sars-cov-2 in aotearoa new zealand. nat commun. 2020;11(1):6351. doi:10.1038/s41467-020-20235-8 pmid:33311501 referral arrangements and laboratory expertise for rapid development and scaling-up of genomic surveillance for covid-19. these working relationships will be crucial to the success of continuous genomic surveillance, use of genomics in the prevention and control of future sars-cov-2 outbreaks10 and the development of local genomics capacity. acknowledgements we thank members of the public health emergency operations centre in tasmania and clinical and microbiology staff who were involved in the testing, care and public health response to covid-19 in tasmania. we thank the public health doctors and nurses, epidemiologists and data managers for collecting and managing the covid-19 data used for this study. we particularly thank fran tiplady, dr therese marfori, dr chrissie pickin, zoe stephens and iain koolhof. conflicts of interest as an editor of wpsar is an author, another editor on the editorial team managed this publication. ethics statement epidemiological and genomics data were collected in accordance with the tasmanian public health act 1997. ethical approval was received from the university of tasmania human research ethics committee (project number 20079) and the university of melbourne human research ethics committee (id 1954615.3). funding the genomics work was supported by the national health and medical research council, australia, partnership grant (app1149991) and mrff covid-19 genomics grant (mrf9200006). references 1. zhu n, zhang d, wang w, li x, yang b, song j, et al. a novel coronavirus from patients with pneumonia in china, 2019. n engl j med. 2020;382(8):727–33. doi:10.1056/nejmoa2001017 pmid:31978945 2. lu r, zhao x, li j, niu p, yang b, wu h, et al. genomic characterisation and epidemiology of 2019 novel coronavirus: implications for virus origins and receptor binding. lancet. 2020;395(10224):565– 74. doi:10.1016/s0140-6736(20)30251-8 pmid:32007145 wpsar vol 12, no 4, 2021 | doi: 10.5365/wpsar.2021.12.4.878https://ojs.wpro.who.int/ 9 integrating covid-19 genomic and epidemiological datastephens et al 22. special commission of inquiry: ruby princess. sydney: new south wales government health; 2020. available from: https://www. nsw.gov.au/covid-19/special-commission-of-inquiry-ruby-princess, accessed 29 september 2021. 23. austrakka. melbourne: communicable diseases genomics network; 2020. available from: https://www.cdgn.org.au/austrakka, accessed 29 september 2021. 24. national academies of sciences, engineering, and medicine; division on earth and life studies; board on life sciences; health and medicine division; board on health sciences policy; committee on data needs to monitor evolution of sars-cov-2. genomic epidemiology data infrastructure needs for sars-cov-2: modernizing pandemic response strategies. washington, dc: national academies press; 2020. 25. enhanced surveillance plan for covid-19 in nsw. sydney: new south wales government health; 2020. available from: https:// www.health.nsw.gov.au/infectious/covid-19/pages/surveillanceplan.aspx, accessed 29 september 2021. 26. jewell bl. monitoring differences between the sars-cov-2 b.1.1.7 variant and other lineages. lancet public health. 2021;6(5):e267–8. doi:10.1016/s2468-2667(21)00073-6 pmid:33857454 27. rockett r. sars-cov-2 mutations and their relevance. australasian covid-19 virtual conference; 2020. available from: https://www. austcovid-19conference.com/workshops, accessed 29 september 2021. 16. oude munnink bb, nieuwenhuijse df, stein m, o’toole a, haverkate m, mollers m, et al. rapid sars-cov-2 whole-genome sequencing and analysis for informed public health decision-making in the netherlands. nat med. 2020;26(9):1405–10. doi:10.1038/ s41591-020-0997-y pmid:32678356 17. meredith lw, hamilton wl, warne b, houldcroft cj, hosmillo m, jahun as, et al. rapid implementation of sars-cov-2 sequencing to investigate cases of health-care associated covid-19: a prospective genomic surveillance study. lancet infect dis. 2020;20(11):1263–72. doi:10.1016/s1473-3099(20)30562-4 pmid:32679081 18. rabaan aa, al-ahmed sh, sah r, al-tawfiq ja, haque s, harapan h, et al. genomic epidemiology and recent update on nucleic acidbased diagnostics for covid-19. curr trop med rep. 2020:1–7. doi:10.1007/s40475-020-00212-3 pmid:32989413 19. covid-19 national incident room surveillance team. covid-19 australia: epidemiology report 30: fortnightly reporting period ending 22 november 2020. commun dis intell (2018). 2020;44. doi:10.33321/cdi.2020.44.091 pmid:33267752 20. covid-19 north west regional hospital outbreak – interim report. hobart: tasmanian government; 2020. available from: http://www. premier.tas.gov.au/releases/covid-19_north_west_regional_hospital_outbreak_interim_report, accessed 29 september 2021. 21. melick g. independent review: response to the north-west tasmania covid-19 outbreak. hobart: tasmanian government; 2020. available from: http://dpac.tas.gov.au/__data/assets/pdf_ file/0004/564853/report_-_north-west_outbreak.pdf, accessed 29 september 2021. https://ojs.wpro.who.int/ 1wpsar vol 12, no 1, 2021 | doi: 10.5365/wpsar.2020.11.3.012 brief report a yamagata university, yamagata, japan. b centers for disease control and prevention, atlanta, georgia, united states of america. published: 1 february 2021 doi: 10.5365/wpsar.2020.11.3.012 i n japan, the first case of coronavirus disease 2019 (covid-19) was identified in mid-january 2020, and cases peaked in the spring at 720 cases per day on 11 april. thereafter, the number of reported cases per day declined to 50 on 15 may and remained low until mid-june, when numbers again started to increase. on 5 august, 1234 cases were reported, giving a cumulative total of 40 485 cases, with a case fatality proportion of 2.5% (1021 deaths).1 although covid-19 is designated as a reportable disease in japan, severe acute respiratory syndrome coronavirus 2 (sars-cov-2) testing capacity was limited in the early stage of the pandemic. it took up to 4 days for specimens to be tested by reverse transcription polymerase chain reaction (rt-pcr). the japanese government recommended that anyone with mild illness symptoms should stay at home, to avoid overwhelming healthcare facilities. sars-cov-2 testing was prioritized for hospitalized patients and those with chronic comorbidities. thus, the true number of symptomatic cases of covid-19 in japan is likely to be far greater than the number of reported cases. in one chinese study, sars-cov-2-specific immunoglobulin igg and igm were detected in serum samples from most patients (asymptomatic or symptomatic) who were diagnosed with sars-cov-2 by rt-pcr.2 this finding implies that seroepidemiological studies can be used to estimate the infection rate of sars-cov-2 in a population. estimating the point prevalence of sarscov-2 infections might be helpful in assessing population susceptibility, and in balancing public health control measures with the reopening of social and economic activities. results from several seroepidemiological studies have been published, with seroprevalence reported from spain (5%), switzerland (10.8%) and the united states of america (1–6.9%, 4.65% and 14%).3–7 these studies were performed in countries where the incidence of covid-19 was high. in countries in the asia-pacific, where covid-19 incidence was low, a few sars-cov-2 seroepidemiology studies have been conducted that are not population based. among these studies, seroprevalence was 7.6% from a single-centre study of outpatients and their guardians in the republic of korea, and 0.4% in a study using residual sera collected at a single hospital in malaysia.8,9 we conducted a cross-sectional seroepidemiological study in yamagata prefecture, an urban–rural area in northern japan, where the incidence of reported covid-19 cases was 0.007% (i.e. 76 cases among a population of about 1.07 million, as of 5 august 2020).1 this is lower than the overall incidence of covid-19 cases reported throughout japan (0.034%), and lower than in most japanese prefectures and the tokyo metropolitan area (0.102%); however, it is higher than in some low-incidence prefectures (0–0.002%).1 residual sera obtained from patients who visited the outpatient clinic of yamagata university hospital for any acute medical condition during 1–4 june 2020 were tested for sars-cov-2 antibody. blood samples were collected for clinical diagnostic purposes and, after use, were de-identified before serological testing was performed. because samples were de-identified, individual consent was not obtained. this study was approved by the ethics committee of yamagata university school of medicine. serological testing was performed using an electrochemiluminescence immunoassay (eclia) elecsys® anti-sars-cov-2 on cobas® e601 module (roche diagnostics, basel, switzerland). this qualitative assay detects total antibody – primarily igg, but also igm and seroepidemiology of sars-cov-2, yamagata, japan, june 2020 keita morikane,a naohito satoh,a kanji hatano,a kazunori kanouchi,a seiji kakehata,a shinya satoh,a timothy m. uyekib and yoshiyuki uenoa correspondence to keita morikane (email: morikane-tky@umin.net) wpsar vol 12, no 1, 2021 | doi: 10.5365/wpsar.2020.11.3.012 https://ojs.wpro.who.int/2 morikane et alseroepidemiology of sars-cov-2, yamagata, japan ethical statement because samples were de-identified, individual consent was not obtained. this study was approved by the ethics committee of yamagata university school of medicine. acknowledgements the authors acknowledge the phlebotomy staff at the outpatient clinical laboratory of yamagata university hospital for assistance with the study. conflict of interest we have nothing to declare. funding yamagata university provided funding for the serological reagents. otherwise, no additional funding was provided to support this study. references 1. novel coronavirus infection: current situation, as of 5 august 2020. tokyo: ministry of health, labour and welfare; 2020. available from: https://www.mhlw.go.jp/stf/newpage_12851. html, accessed 6 august 2020. 2. long qx, tang xj, shi ql, li q, deng hj, yuan j, et al. clinical and immunological assessment of asymptomatic sars-cov-2 infections. nat med. 2020 aug;26(8):1200–4. doi:10.1038/ s41591-020-0965-6 pmid:32555424 3. sood n, simon p, ebner p, eichner d, reynolds j, bendavid e, et al. seroprevalence of sars-cov-2–specific antibodies among adults in los angeles county, california, on april 10–11, 2020. jama. 2020 jun 16;323(23):2425–7. doi:10.1001/jama.2020.8279 pmid:32421144 4. rosenberg es, tesoriero jm, rosenthal em, chung r, barranco ma, styer lm, et al. cumulative incidence and diagnosis of sars-cov-2 infection in new york. ann epidemiol. 2020;48:2329.e4. 5. havers fp, reed c, lim t, montgomery jm, klena jd, hall aj, et al. seroprevalence of antibodies to sars-cov-2 in 10 sites in the united states, march 23-may 12, 2020. jama intern med 2020 july 21. doi:10.1001/jamainternmed.2020.4130 6. pollán m, pérez-gómez b, pastor-barriuso r, oteo j, hernán ma, pérez-olmeda m, et al.; ene-covid study group. prevalence of sars-cov-2 in spain (ene-covid): a nationwide, population-based seroepidemiological study. lancet. 2020 aug 22;396(10250):535–44. doi:10.1016/s0140-6736(20)314835 pmid:32645347 iga antibody – to the nucleocapsid protein of sarscov-2. a cut-off optical density (od) index value of 1.0 was used to define a seropositive result. according to the manufacturer’s fact sheet, the specificity of the serological assay is 99.80% (i.e. 21 false positives among the 10 453 specimens collected before december 2019).10 among 1009 samples tested, five specimens were positive for sars-cov-2 antibody. the estimated seroprevalence of sars-cov-2 infections was 0.50% (95% confidence interval [ci]: 0.062–0.93%). the od values of five seropositive specimens varied substantially; two had od values close to the cut-off index value (1.3 and 1.6), suggesting low antibody titres, and three were above 5.0. using the 95% ci for the seroprevalence estimate of 0.50%, we estimated that the yamagata prefecture population had 670–10 000 sars-cov-2 antibody-positive individuals. our study has several limitations. first, sera used in this study were obtained from patients visiting our hospital’s outpatient acute care clinic; hence, this sample is probably not representative of the general population of yamagata prefecture. also, because the serum specimens were de-identified, we did not have any demographic data to determine representation across age groups. second, the specificity of the assay suggests an anticipated false positive rate of 0.20%, which may affect the reliability of the estimated seroprevalence in our study. third, in a population with a low prevalence of sars-cov-2 infections, as was the case in yamagata, false positives are more likely than in a population with high prevalence. slight modification of the assay seropositive cut-off index value (e.g. from 1.0 to 1.6) would reduce the estimated seroprevalence. for example, if only the three strongly positive serum samples were considered to be true seropositive results, the estimated seroprevalence would be 0.30% (95% ci: 0–0.63%). this cross-sectional seroepidemiological study in yamagata prefecture, japan, identified low seroprevalence of sars-cov-2 antibody, suggesting that the population is highly susceptible to sars-cov-2. additional studies with population-based sampling are needed to assess the impact of sars-cov-2 in this population over time. wpsar vol 12, no 1, 2021 | doi: 10.5365/wpsar.2020.11.3.012https://ojs.wpro.who.int/ 3 seroepidemiology of sars-cov-2, yamagata, japanmorikane et al 7. stringhini s, wisniak a, piumatti g, azman as, lauer sa, baysson h, et al. seroprevalence of anti-sars-cov-2 igg antibodies in geneva, switzerland (serocov-pop): a population-based study. lancet. 2020 aug 1;396(10247):313–9. doi:10.1016/s01406736(20)31304-0 pmid:32534626 8. sam ic, chong ym, tan cw, chan yf. low postpandemic wave sars-cov-2 seroprevalence in kuala lumpur and selangor, malaysia. j med virol. 2020 aug 13;jmv.26426. doi:10.1002/ jmv.26426 pmid:32790206 9. song sk, lee dh, nam jh, kim kt, do js, kang dw, et al. igg seroprevalence of covid-19 among individuals without a history of the coronavirus disease infection in daegu, korea. j korean med sci. 2020 jul 27;35(29):e269. doi:10.3346/jkms.2020.35. e269 pmid:32715672 10. novel coronavirus infection: current situation, as of 5 august 2020. tokyo: ministry of health, labour and welfare; 2020. available from: https://www.mhlw.go.jp/stf/newpage_12851. html, accessed 6 august 2020. https://ojs.wpro.who.int/ 1wpsar vol 13, no 2, 2022 | doi: 10.5365/wpsar.2022.13.2.921 covid-19: lessons from the field problem coronavirus disease 2019 (covid-19), caused by severe acute respiratory syndrome coronavirus 2 (sars-cov-2), was identified in late december 2019 and declared a pandemic by the world health organization (who) on 11 march 2020.1 in the who western pacific region, by the end of november 2021, there were 10 221 280 confirmed covid-19 cases and 141 864 deaths.2 although the covid-19 death count is essential to understanding the epidemiology of covid-19, the attributable mortality due to covid-19 remains unclear. in any given country, official statistics may not reflect the actual number of lives lost to the disease.3 identifying deaths from covid-19 is difficult, especially in low-resource settings.4 many countries have limited capacity for covid-19 testing at national and subnational levels, and therefore no capability to track the spread of covid-19. even where cases are adequately detected, some deaths may not be reported promptly or even at all.4 also, reporting of cause of death may be inaccurate because the quality of death certification depends on the knowledge and skills of physicians, on the characteristics of the deceased person (older people are the most difficult to certify correctly), on errors in coding the death event and on the format of certification.5 there can also be a long lag between the death occurring and being certified, especially for deaths outside hospitals or other health-care facilities, or those that require an autopsy. service interruptions due to the pandemic may further delay the death certification process. according to an internal rapid assessment in the who western pacific region, most member states have two to four death reporting systems. most systems are a division of data, strategy & innovation team, world health organization regional office for the western pacific, manila, philippines. b department of statistics, university of california, los angeles, ca, united states of america. c division of health security and emergencies, world health organization regional office for the western pacific, manila, philippines. published: 25 may 2022 doi: 10.5365/wpsar.2022.13.2.921 problem: quantifying mortality from coronavirus disease (covid-19) is difficult, especially in countries with limited resources. comparing mortality data between countries is also challenging, owing to differences in methods for reporting mortality. context: tracking all-cause mortality (acm) and comparing it with expected acm from pre-pandemic data can provide an estimate of the overall burden of mortality related to the covid-19 pandemic and support public health decision-making. this study validated an acm calculator to estimate excess mortality during the covid-19 pandemic. action: the acm calculator was developed as a tool for computing expected acm and excess mortality at national and subnational levels. it was developed using r statistical software, was based on a previously described model that used nonparametric negative binomial regression and was piloted in several countries. goodness-of-fit was validated by forecasting 2019 mortality from 2015–2018 data. outcome: three key lessons were identified from piloting the tool: using the calculator to compare reported provisional acm with expected acm can avoid potential false conclusions from comparing with historical averages alone; using disaggregated data at the subnational level can detect excess mortality by avoiding dilution of total numbers at the national level; and interpretation of results should consider system-related performance indicators. discussion: timely tracking of acm to estimate excess mortality is important for the response to covid-19. the calculator can provide countries with a way to analyse and visualize acm and excess mortality at national and subnational levels. tool for tracking all-cause mortality and estimating excess mortality to support the covid-19 pandemic response duan mengjuan,a mark s. handcock,b bart blackburn,b fiona kee,a viema biaukula,c tamano matsuic and babatunde olowokurec correspondence to babatunde olowokure (email: olowokureb@who.int) wpsar vol 13, no 2, 2022 | doi: 10.5365/wpsar.2022.13.2.921 https://ojs.wpro.who.int/2 duan et alall-cause mortality calculator for covid-19 response to month. additionally, if a trend is present over time, using historical averages will not capture the trend or allow it to be projected into the future. a more sophisticated method by weinberger et al.10 fits poisson regression models that adjust for seasonality, year-to-year baseline variation, influenza epidemics and reporting delays. our statistical model, the who western pacific regional office acm calculator (hereafter, the acm calculator), is based on this method. action the who western pacific regional office acm calculator the acm calculator was developed to assist member states in the who western pacific region in tracking and analysing acm.11 the user enters the relevant acm data into the designated template in the calculator, and the expected acm and excess mortality are calculated. the calculator can be used online or installed onto a local machine. the input data are never stored offline and are only accessible to the user. depending on the amount of data entered, the calculator will finish computing within seconds or minutes. various outputs are available, including disaggregated results; for example, the calculator can provide expected acm by age group and sex if the data entered are disaggregated by these factors. the results can be displayed in a variety of formats, including tables and graphs.11 statistical methods the acm calculator is based on the model of weinberger et al.,10 but uses non-parametric negative binomial regression. this approach was preferred to poisson regression because it allows for overdispersion and can account for instances of low or zero counts.10 the mean function includes a smooth trend and a smooth non-parametric annual cycle in mortality over time. these terms were specified using cubic smoothing splines, including a cyclical one for the annual cycle. the model allows for arbitrary time-varying covariates, and the parameters were estimated through restricted maximum likelihood estimation. the methodology does not currently adjust for influenza epidemics and reporting delays because this information is not consistently reported. electronic or partially electronic, and although some are well-integrated within civil registration and vital statistics systems, others are disjointed. the united nations statistics division estimated that death registration coverage is over 80% in 15 of the 27 western pacific regional member states with data available.6 total death counts, reported either weekly or monthly, are publicly available from at least six member states, and data are available internally from at least four. thus, it may be feasible for several member states in the who western pacific region to track all-cause mortality (acm) to provide timely information on covid-19 deaths. ideally, deaths would be reported as soon as possible, with more detailed information (e.g. cause of death) reported later when death certificates become available. context tracking current acm and comparing it with expected acm from pre-pandemic data can provide an estimation of the overall burden of mortality potentially related to the covid-19 pandemic.4 this method requires first estimating the number of deaths that would be expected if the covid-19 pandemic had not occurred (i.e. expected deaths) using historical data and a sophisticated statistical model.7 excess mortality is then estimated by comparing the current reported provisional deaths with the expected deaths.8 the excess mortality may be directly or indirectly due to covid-19. indirect deaths due to covid-19 include those linked to conditions that were present before the pandemic and have resulted in death because health systems were overwhelmed, those due to patients avoiding health-care facilities and those linked to routine service delivery interruption for non-covid-19 disease. these indirect deaths due to covid-19 are not captured in the covid-19 death numbers reported to who.9 given that covid-19 deaths can influence national and subnational response measures, additional effort is required to ensure that this information is readily available and quickly tracked. a common method to estimate the expected acm is to use the average death count for each week over a 5-year period. however, this method does not account for the seasonality of mortality, or for the trend and smoothness of expected mortality from week to week or month wpsar vol 13, no 2, 2022 | doi: 10.5365/wpsar.2022.13.2.921https://ojs.wpro.who.int/ 3 all-cause mortality calculator for covid-19 responseduan et al only were well above the historical average (fig. 1b) but confidence intervals and statistical increase were not calculated. the calculator values are above the historical average because of the presence of an upward trend in reported counts from 2015 to 2019; the calculator takes this into account whereas the historical average does not. because historical averages do a poor job of predicting, comparison with the monthly average alone would lead to false conclusions. the second example illustrates the ability of the calculator to show hidden excess mortality within subregions based on disaggregated data. using data from another country, the national data indicate no excess mortality over a particular period (fig. 2a), whereas the data for that period from a single local region show excess mortality during july and august that is outside the 95% prediction intervals for these months (fig. 2b). therefore, the excess mortality for july and august is statistically significantly different from zero (even after adjusting for multiple comparisons).7 this example highlights the value of being able to analyse subregions, because excess mortality may not be identifiable at the national level in some cases. lessons identified three key lessons were identified from piloting the tool: using the calculator to compare reported provisional acm with expected acm can avoid potential false conclusions from comparing with historical averages alone; using disaggregated data at the subnational level (e.g. by region, sex and age) can detect excess mortality by avoiding dilution of total numbers at the national level; and interpretation of results should consider systemrelated performance indicators such as system coverage, completeness and reporting delays. suggestions for interpreting results given that the quality of mortality reporting varies greatly within and between member states, the results of the acm calculator should be interpreted with caution. death coverage may differ if mortality reporting systems do not cover all death counts, with inconsistencies if a country has multiple systems, especially in low-resource settings. civil registration of deaths is often below 20% in low and middle-income countries.4 there are also timeliness issues and reporting delays, so the death count may be the expected acm deaths are forecast stochastically, to represent uncertainty in the estimate of the expected. thus, statistical significance in observed data can be determined (i.e. a substantial increase or decrease from the baseline). the forecast is an average over the sampling distribution of the parameter estimates, which is a simple way to account for uncertainty in the expected deaths, in addition to the sampling variation of the counts for given model parameters. this approach is preferred to a formal bayesian model because of its simplicity. the model goodness-of-fit was validated by forecasting 2019 mortality from 2015–2018 data (see appendix for details). the validation indicated that the statistical coverage of the procedure is close to its nominal rate and that the prediction interval lengths are smaller than those based on the historical average model. the intervals based on the historical average are misleading and their actual coverage is far below their nominal coverage. the calculator was developed using r statistical software (ver. 4.1.2), which includes the estimation of historical patterns and the computation of expected acm. the software computes the excess mortality from 2020 to the present time; displays different visualizations of expected acm and excess mortality and allows these visualizations and their raw data to be downloaded for further analysis and inclusion in reports; and includes interactive help and documentation of the methodology. the software is open-source. for reproducibility purposes, the exact code used for the analyses in this paper is in a static archive.13 outcome the acm calculator has been tested using publicly available data from several member states. two examples are provided to highlight key lessons from implementing the calculator. the first example from one country (january through september 2020) compares acm plots using the calculator versus acm plots based on historical averages only. the results from the calculator showed that the recorded counts were well within the 95% prediction interval generated (fig. 1a). although the reported counts were sometimes above the expected counts (most notably in august), the reported counts were always within the prediction interval. in contrast, the recorded counts based on the historical average wpsar vol 13, no 2, 2022 | doi: 10.5365/wpsar.2022.13.2.921 https://ojs.wpro.who.int/4 duan et alall-cause mortality calculator for covid-19 response fig. 1. a) monthly reported acm compared with expected acm for the first 9 months of 2020 using the calculator. the red zone is the 95% prediction interval. b) monthly reported acm compared with the expected acm and the historical average acm. the blue lines plot the recorded number of deaths, the orange the expected number of deaths under the model and the green the average number of deaths by month during 2015–2019. 30 000 28 000 26 000 24 000 22 000 jan feb mar apr may jun jul aug sep month (2020) recorded expectedd ea th s d ea th s expected average recorded 28 000 26 000 24 000 22 000 jan feb mar apr may jun jul aug sep month (2020 for expected, 2015–2019 for average and recorded) a b wpsar vol 13, no 2, 2022 | doi: 10.5365/wpsar.2022.13.2.921https://ojs.wpro.who.int/ 5 all-cause mortality calculator for covid-19 responseduan et al fig. 2. acm at the national (a) and subregional level (b) within the same member state in the who western pacific region. looking at the aggregate would lead to a conclusion of no excess mortality present; however, by disaggregating the data into subregions we can identify areas where significant excess mortality is present. recorded expectedd ea th s jan feb mar apr may jun jul aug month (2020) 55 000 50 000 45 000 40 000 recorded expectedd ea th s jan feb mar apr may jun jul aug month (2020) 8000 7000 6000 a b wpsar vol 13, no 2, 2022 | doi: 10.5365/wpsar.2022.13.2.921 https://ojs.wpro.who.int/6 duan et alall-cause mortality calculator for covid-19 response by the pandemic itself. in addition, it is assumed that the negative binomial regression model is adequate to capture this variation, and that counts are independent from period to period (conditional on the annual cycle and covariates). if these assumptions are incorrect, the estimates and prediction intervals will be inaccurate and probably overly optimistic. discussion during an epidemic or other public health emergency where mortality occurs, such as the covid-19 pandemic, many countries experience disruption to routine health-care services and socio-behavioural changes in the population. for example, 90% of countries have reported disruptions to essential health services since the covid-19 pandemic began.12 these changes, together with a lack of reliable data and reporting systems, make the true burden of the pandemic difficult to quantify. acm, when reported in a timely manner, can be used to estimate excess mortality, providing a rapid snapshot of the situation to support decision-makers to identify the extent and progression of the pandemic. analysing and interpreting acm data (including disaggregated data) can also provide important information about who is dying and where, which can then guide decisions on targeted surveillance and efficient use of health resources. the acm calculator was developed to make it easy for member states to analyse and visualize their acm data. users reported that the tool allowed them to analyse data on their own and easily generate results. although the underlying statistical model is sophisticated, the use of complex algorithms in the background provides state-of-the-art summaries in the foreground. the model is standardized for a broad user base but could be customized for the needs of specific member states. however, caution should be exercised when interpreting the results. acknowledgements this article and the calculator described herein are the result of close collaboration between different units of the who regional office for the western pacific and all country offices in the region. we would like to thank all the emergency and health system focal points. we are also grateful for the great support from gao jun in the health information and innovation unit of the division of data, strategy and innovation in the who western pacific regional office. incomplete for certain periods (e.g. the latest week or month). it can take more than 12 months for mortality data to be finalized at the national level owing to deaths not being promptly reported or registered by subnational authorities, a long lag between a death and completion of the death certificate, a backlog at the subnational level that delays reporting to the national level and long processing times for the reporting systems. the use of disaggregated data to improve monitoring sensitivity may be affected by differences in the severity of covid-19 transmission between subnational regions; also, the impact may vary among different population groups (e.g. by sex, age and occupation). proactively tracking acm at the local level may help to capture more timely information, given that reporting and validation from the local to the national level may take several months to complete. also, in both the short and long term, careful interpretation of the results is crucial to tailor specific actions based on conditions within each member state. for countries with existing systems that cover compulsory and universal mortality reporting, it is important to make use of the existing data to monitor weekly and monthly trends, to drive decision-making. for countries with low levels of mortality reporting coverage, it is still worth monitoring weekly and monthly trends based on available data; however, results should be interpreted with caution, as mentioned above. additional resources or channels (e.g. burial or cemetery registration) can be employed to track total death counts. community based mortality reporting should also be considered if necessary. limitations there are two main limitations to the calculator. first, our methodology assumes that reported counts are the actual values and that reports are complete and accurate. however, provisional death counts are normally used for timely monitoring. results should be compared with in-place systems, as mentioned above. second, the fundamental assumption is that the statistical variation in acm during the historical period (2015–2019) is the same as that from 1 january 2020 onward in the counter-factual situation where there was no pandemic. this is not directly testable because of confounding wpsar vol 13, no 2, 2022 | doi: 10.5365/wpsar.2022.13.2.921https://ojs.wpro.who.int/ 7 all-cause mortality calculator for covid-19 responseduan et al 5. challenges in accurate medical certification of cause of death. melbourne: crvs knowledge gateway; 2018. available from: https:// crvsgateway.info/challenges-in-accurate-medical-certification-ofcause-of-death~633, accessed 8 april 2021. 6. coverage of birth and death registration. new york: united nations, department of economic and social affairs, statistics division; 2021. available from: https://unstats.un.org/unsd/demographicsocial/crvs/index.cshtml, accessed 30 november 2021. 7. hsu jc. multiple comparisons: theory and methods. london: chapman & hall: crc press; 1996. 8. humanitarian health action definitions: emergencies. geneva: world health organization; 2020. available from: https://www. who.int/hac/about/definitions/en, accessed 8 april 2021. 9. who covid-19 excess mortality estimation methodology. geneva: world health organization; 2021. available from: https://www. who.int/publications/i/item/who-covid-19-excess-mortality-estimation-methodology, accessed 11 october 2021. 10. weinberger dm, chen j, cohen t, crawford fw, mostashari f, olson d, et al. estimation of excess deaths associated with the covid-19 pandemic in the united states, march to may 2020. jama intern med. 2020;180(10):1336–44. doi:10.1001/jamainternmed.2020.3391 pmid:32609310 11. wpro all-cause-of-mortality and excess death calculator. manila: who regional office for the western pacific; 2021. available from: https://worldhealthorg.shinyapps.io/wpro-all-cause-of-mortalityand-excess-death-calculator/, accessed 20 april 2021. 12. pulse survey on continuity of essential health services during the covid-19 pandemic: interim report, 27 august 2020. geneva: world health organization; 2020. available from: https://apps.who. int/iris/handle/10665/334048, accessed 16 april 2021. 13. handcock ms, blackburn b. handcock/wproacm: methodology and code used in the who wpro acm calculator (v1.0.0). geneva: zenodo; 2021. doi:10.5281/zenodo.5746071 conflicts of interest the authors declare no conflicts of interest. ethics statement this work did not require ethics committee review because it did not involve human participants or active intervention. all data are publicly available. funding none. references 1. timeline: who’s covid-19 response. geneva: world health organization; 2021. available from: https://www.who.int/emergencies/ diseases/novel-coronavirus-2019/interactive-timeline, accessed 11 october 2021. 2. regional covid-19 dashboard. manila: who regional office for the western pacific; 2021. available from: https://who.maps.arcgis. com/apps/opsdashboard/index.html#/345dfdc82b5c4f6a815f1d5 4a05d18ec, accessed 11 october 2021. 3. kaczorowski j, del grande c. beyond the tip of the iceberg: direct and indirect effects of covid-19. lancet digit health. 2021;3(4):e205–6. doi:10.1016/s2589-7500(21)00024-8 pmid:33612431 4. vital strategies, world health organization. revealing the toll of covid-19: a technical package for rapid mortality surveillance and epidemic response. new york: vital strategies; 2020. available from: https://preventepidemics.org/wp-content/uploads/2020/05/ rms_report.pdf, accessed 8 april 2021. vibrio cholerae antimicrobial drug resistance, papua new guinea, 2009–2011 brief report manoj murhekar,a samir dutta,b berry ropa,c rosheila dagina,c enoch posanaic and alexander rosewella a world health organization, port moresby, papua new guinea. b pathology department, port moresby general hospital, papua new guinea. c national department of health, port moresby, papua new guinea. correspondence to manoj murhekar (e-mail: mmurhekar@gmail.com). to cite this article: murhekar m et al. vibrio cholerae antimicrobial drug resistance, papua new guinea, 2009–2011. western pacific surveillance and response journal, 20123, 4(3):60–62. doi:10.5365/wpsar.2013.4.2.002 cholera is an acute infectious disease caused by vibrio cholerae. the disease occurs in a variety of forms ranging from sporadic cases to outbreaks that may transition to endemic disease. while cholera case management focuses on early, rapid rehydration, antimicrobial therapy can reduce the volume of diarrhoea, duration of carriage and symptoms and is frequently recommended for patients with severe dehydration.1–4 for this reason, antibiotics are often indicated for the management of moderate and severe cholera case patients. the current world health organization and médecins sans frontières guidelines for cholera treatment recommend antibiotics for only severe cases, whereas the international centre for diarrhoeal disease research, bangladesh (icddr,b) recommends antibiotics for both severe and moderate cases.5,6 the emergence of antimicrobial drug resistance following the introduction of antibiotics is a commonly reported global phenomenon. vibrio cholerae remained susceptible to many antibiotics for a sustained period, with only 3% of the isolates demonstrating resistance in the worldwide survey conducted in 1976.7 however, during the past two decades, reports from several cholera-endemic countries of strains resistant to antibiotics including tetracycline, ampicillin, kanamycin, streptomycin, sulphonamides, trimethoprim and gentamicin have appeared.4 indiscriminate use of antimicrobials is one of the commonest reasons for emergence of resistance.4 for this reason, recommendations for antibiotic use for cholera case management should promote their selective use and be based on the antibiotic susceptibility pattern of vibrio cholerae in the area. the first outbreak of vibrio cholerae o1 biotype el tor, serotype ogawa was reported in morobe province of papua new guinea in july 2009.8 following this outbreak, cholera spread to other provinces and by april 2011, outbreaks were reported in almost half the provinces in the country, causing more than 15 000 reported cases and 493 deaths.9 occurrence of faecal culture-confirmed cholera diarrhoea in a population for at least three of the past five years is considered as a criteria for defining cholera endemicity in an area.10 as transmission of cholera in papua new guinea continues into the third year (2012), the disease would be classified as endemic. during the outbreak, health authorities recommended doxycycline for adults and erythromycin or azithromycin for children and regnant women for the treatment of cases with moderate and severe dehydration. in previously cholera-free districts, health authorities collected stool samples or two rectal swabs from initial cases during outbreaks of acute watery diarrhoea to confirm the etiology. they also collected stool samples sporadically from districts where the outbreaks were ongoing. the stool specimens were sent to the national reference laboratory for culture following standard procedures for the isolation and identification of vibrio cholerae. the stool samples were inoculated on thiosulphate citrate bile salt sucrose and macconkey’s agar and incubated at 37˚c for 18–24 hours. the isolated vibrio cholerae strains were serotyped using polyvalent and monovalent antisera (denka seiken co, ltd, tokyo, japan). susceptibility to different antibiotics was tested by disk diffusion technique11 following the clinical and laboratory standards institute (clsi) guidelines12 using a commercially available disk (oxoid ltd, england) of eight antimicrobial agents: amoxycillin (10 μg/disc), chloramphenicol (30 μg/disc), ciprofloxacin (5 μg/disc), erythromycin (15 μg/disc), nalidixic acid (30 μg/disc), norfloxacin (10 μg/disc), co-trimoxazole (25 μg/disc) and tetracycline (30 μg/disc). standard strains of escherichia coli atcc 25 922 and staphylococcus aureus atcc 25 923 were used as control strains. interpretation of zone size was done in accordance with the clsi guidelines classifying the antimicrobial resistance.12,13 since there is no vibrio cholerae-specific clsi interpretive criteria for several of the drugs for which resistance is described, we considered a zone of inhibition of 21mm for ciprofloxacin, 23mm for erythromycin, 19mm for nalidixic acid and 17mm for norfloxacin as the cut-off values to determine susceptibility (table 1). we analysed the antimicrobial drug resistance data since the beginning of the cholera outbreak in the country. table 1. details of the drugs, reference zone of inhibition and quality control strains based on clinical and laboratory standards institute guidelines click to download table 1. jpg, 251kb during the period august 2009 to april 2011, vibrio cholerae was isolated from 321 samples, of which 305 (95%) were tested for antibiotic susceptibility. cholera isolates were of el tor biotype and ogawa serotype. of the 299 isolates tested against tetracycline (proxy for doxycycline), 29 (9.7%) were resistant and 94 (31.4%) showed intermediate resistance. of the 254 isolates tested against erythromycin, 97 (38.2%) were resistant while 139 (54.7%) demonstrated intermediate resistance. most isolates (75.8%) were resistant to amoxycillin while the resistance to norfloxacin (0%), nalidixic acid (0.3%), ciprofloxacin (1%) and co-trimoxazole (3.2%) were low (table 2). a total of 251 isolates were tested for both erythromycin and tetracycline. of these, 14 (6%) and 60 (24%) showed complete and intermediate resistance to the antibiotics, respectively. table 2. antimicrobial susceptibility pattern of vibrio cholerae isolates, papua new guinea, 2009 to 2011 click to download table 2. jpg, 384kb the proportion of isolates showing either complete or intermediate resistance to tetracycline rose from 27.8% (10/36) in 2009 to 50.5% (107/212) in 2010 before decreasing to 11.8% (6/51) in 2011. isolates were not tested for erythromycin resistance in 2009, but in 2010 and 2011, 92.1% (187/203) and 96.1% (49/51) of the isolates showed intermediate or complete resistance, respectively. not all the isolates could be tested for all eight antimicrobials. this was a limitation of the data. we report high levels of resistance to erythromycin among the papua new guinea vibrio cholerae isolates with fluctuating resistance to tetracycline. health care in papua new guinea is delivered through provincial hospitals at provincial level and health centres, rural hospitals and aid posts in the rural areas. the standard treatment guidelines prepared by the national department of health are followed in the country for treatment of common ailments in adults and children. health authorities may consider these susceptibility data when reviewing the national treatment guidelines, as well as the availability, cost, usage and clinical outcomes. while doxycycline may still be considered for the treatment of severely dehydrated cases among adults, an alternative antimicrobial therapy to erythromycin should be considered for pregnant women or children. monitoring of antimicrobial resistance of vibrio cholerae should remain a priority for the public health laboratory surveillance system. conflicts of interest none declared. funding none. acknowledgements the authors acknowledge dr subarna roy from the indian council of medical research for his critical comments on the manuscript. references: lindenbaum j, greenough wb, islam mr. antibiotic therapy of cholera. bulletin of the world health organization, 1967, 36:871–883. pmid:4865453 rahaman mm et al. effects of doxycycline in actively purging cholera patients: a double-blind clinical trial. antimicrobial agents and chemotherapy, 1976, 10:610–612. doi:10.1128/aac.10.4.610 pmid:791107 saha d et al. single-dose azithromycin for the treatment of cholera in adults. the new england journal of medicine, 2006, 354:2452–2462. doi:10.1056/nejmoa054493 pmid:16760445 sack da et al. cholera. lancet, 2004, 363:223–233. doi:10.1016/s0140-6736(03)15328-7 pmid:14738797 nelson ej et al. antibiotics for both moderate and severe cholera. the new england journal of medicine, 2011, 364:5–7. doi:10.1056/nejmp1013771 pmid:21142691 bigot a et al. cholera guidelines, 4th edition. médecins sans frontières, 2004. o’grady f, lewis mj, pearson nj. global surveillance of antibiotic sensitivity of vibrio cholerae. bulletin of the world health organization, 1976, 54:181–185. pmid:1088100 rosewell a et al. vibrio cholerae o1 in 2 coastal villages, papua new guinea. emerging infectious diseases, 2011, 17:154–156. doi:10.3201/eid1701.100993 pmid:21192890 horwood pf et al. clonal origins of vibrio cholerae o1 el tor strains, papua new guinea, 2009–2011. ,emerging infectious diseases, 2011, 17:2063–2065. doi:10.3201/eid1711.110782 pmid:22099099 meeting of the strategic advisory group of experts on immunization, october 2009 conclusions and recommendations. weekly epidemiological record, 2009, 84: 517–532. bauer aw et al. antibiotic susceptibility testing by a standardized single disk method. american journal of clinical pathology, 1966, 45:493–496. pmid:5325707 centers for disease control and prevention. manual for the laboratory detection of antimicrobial resistance among acquired bacterial pathogens of public health concern in the developing world (draft). atlanta, georgia, centers for disease control and prevention, 2001, 55–64 (cdc/who/usaid). available from: http://www.who.int/csr/ resources/publications/drugresist/en/iamrmanual.pdf [accessed 1 march 2013]. clinical and laboratory standards institute. performance standards for antimicrobial susceptibility testing, twenty second informational supplement m100–s22. wayne, pennsylvania, clinical and laboratory standards institute, 2012, 31(1). https://ojs.wpro.who.int/ 1wpsar vol 13, no 3, 2022 | doi: 10.5365/wpsar.2022.13.3.955 field investigation report d uring the coronavirus disease (covid-19) pandemic, viet nam changed its policy from “zero covid” to “safe and flexible adaptation and effective control of the covid-19 pandemic” (resolution no. 128/nq-cp, dated 11 october 2021). this was in an attempt to achieve a new normal by the end of september 2021, when the surge of the delta (b.1.617.2) variant had decreased and was under control in southern viet nam. however, a surge of the omicron (b.1.1.529) variant in early 2022 caused the highest peak of severe acute respiratory syndrome coronavirus 2 (sars-cov-2) infections in the country compared to previous waves. the omicron variant of sars-cov-2 was first identified in south africa in mid-november 2021.1 the first case of the omicron variant in viet nam was confirmed in a person who returned to hanoi from the united kingdom of great britain and northern ireland on 27 december 2021.2 the first community cluster of the omicron variant (three cases) was documented in ho chi minh city on 18 january 2022. since then, a large number of cases have been detected among people arriving from overseas. as of 2 january 2022, approximately 79.2% of the population of viet nam had received one dose of covid-19 vaccine and 70.1% had received two doses. however, the omicron variant’s greater transmissibility and ability to evade immunity meant the surge of sars-cov-2 infections and the ensuing community transmission was expected.3,4 since early 2020, the national institute of hygiene and epidemiology (nihe) has conducted active virological surveillance using whole-genome sequencing on samples positive for sars-cov-2. until 15 march 2022, these samples were collected from international arrivals at quarantine centres and new community cluster infections in order to monitor the genomic epidemiology of sars-cov-2 virus circulation in northern viet nam. here a national influenza center, national institute of hygiene and epidemiology, hanoi, viet nam. b department of infection control, 108 military central hospital, hanoi, viet nam. c division of preventive medicine, viet nam military medical department, hanoi, viet nam. d vietnam research station, national institute of hygiene and epidemiology, hanoi, viet nam. e institute of tropical medicine, nagasaki university, nagasaki, japan. published: 19 september 2022 doi: 10.5365/wpsar.2022.13.3.955 the omicron variant caused a surge of infections with severe acute respiratory syndrome coronavirus 2 (sars-cov-2) in viet nam in early 2022, signalling community transmission. we report on active whole-genome sequencing surveillance of positive sars-cov-2 samples collected at that time in northern viet nam from international arrivals and community clusters. we used an amplicon protocol developed with 14 polymerase chain reaction products and the illumina iseq 100 platform. overall, 213 nasopharyngeal or throat swabs were analysed, of which 172 samples were identified with the omicron variant. of these, 80 samples were collected from community cases in february 2022, among which 59 samples were sublineage ba.2 and one sample was the recombinant xe variant. our results indicated that omicron had replaced delta as the dominant variant in a very short period of time and that continuously conducting active whole-genome sequencing surveillance is necessary in monitoring the evolution and genomic diversity of sars-cov-2 in viet nam. occurrence of the omicron variant of sars-cov-2 in northern viet nam in early 2022 trang thi hong ung,a phuong vu mai hoang,a son vu nguyen,a hang le khanh nguyen,a phuong thi kim nguyen,b dan tan phan,c thanh thi le,a anh phuong nguyen,a thach co nguyen,a futoshi hasebed,e and mai thi quynh lea correspondence to mai thi quynh le (email: lom9@hotmail.com or ltqm@nihe.org.vn) wpsar vol 13, no 3, 2022 | doi: 10.5365/wpsar.2022.13.3.955 https://ojs.wpro.who.int/2 ung et alomicron variant in northern viet nam, 2022 quarantine centres in northern viet nam in accordance with immigration requirements (fig. 1). after the vietnamese lunar new year (tet holiday from 31 january to 4 february 2022), increases in sars-cov-2 infections in many cities and provinces in viet nam were reported, and samples collected from community outbreaks were sent to nihe. we analysed a total of 116 samples in february, 80 of which came from community outbreaks in 18 cities and provinces in northern viet nam. most of these (58/80; 72.5%) were collected during week 8 of 2022 (20 february). the other 36 samples were collected from quarantine centres (table 1). two variants of concern were detected in this study. the delta variant was at its most dominant (81.3%; 13/16) in week 1 of 2022, then decreased to 6.8% (5/74) by the last week of february. conversely, the omicron variant was detected in week 1 in 18.8% (3/16) of samples, then increased to 85.7% (12/14) by the last week of january (fig. 1). among the samples analysed in february 2022, the omicron variant comprised 90.5% (105/116) overall and reached its highest rate of 93.2% (69/74) in week 8 (fig. 1). sublineages of sars-cov-2 variants detected in northern viet nam in early 2022 of the 213 positive samples, 41 (19.2%) were the delta variant. most of these (75.6%; 31/41) were imported: 30 in january and one in early february. the other 10 delta samples were detected in the community throughout february. the remaining 172 positive samples were the omicron variant. we detected four omicron sublineages: 21.5% ba.1 (37/172), 22.1% ba.1.1 (38/172), 55.8% ba.2 (96/172) and one sample (0.58%) was determined to be recombinant omicron xe (table 1). the xe variant was first detected in week 8 (on 26 february) from a community outbreak in the capital of hanoi (gisaid id: epi_isl_11776032). time course of the omicron variant in community outbreaks our results show that the omicron variant was first detected in the community in week 7 of 2022 and accounted for the majority of cases in weeks 7 and 8. ba.2 was the predominant sublineage comprising most of the new covid-19 cases in northern viet nam after the tet we report the results of complete genome sequences of sars-cov-2 from samples collected from 1 january to 28 february 2022 in northern viet nam. methods we sequenced 213 nasopharyngeal or throat swab samples that were sent to nihe from 22 of the 28 provincial centers for disease control and prevention in northern viet nam. all samples were positive for sars-cov-2 with a ct value of <30 by real-time reverse transcription polymerase chain reaction (rtpcr). of the 213 specimens, 80 were collected from community outbreaks during february 2022, and the remaining 133 were from international arrivals at quarantine centres during january and february 2022 (fig. 1, table 1). we used the amplicon protocol developed with 14 pcr products – primers designed for sequential amplified fragments with a size band of about 2.5 kb based on the sars-cov-2 reference genome (id: mn 908947-wuhan-hu-1). firstly, rna was converted into cdna using superscripttm iv vilotm (thermo fisher scientific, waltham, ma, united states of america), then 14 amplicons were amplified from the cdna using platinumtm superfi ii green pcr master mix (thermo fisher scientific). following amplification, pcr products were checked by electrophoresis using a 1% agarose gel. pcr fragments were pooled and purified by applied biosystems exosap-ittm (thermo fisher scientific). library preparation was performed following protocol using the nextera xt library preparation kit (illumina, san diego, ca, united states of america) and sequencing was performed on the illumina iseq 100 system (illumina). data analysis was performed using clc genomics workbench 11.0 for consensus assembly and variant detection. the sublineages were assigned using nextclade v1.14.0 and pangolin (lineage version 202202-28).5,6 these sequences were uploaded to gisaid (ids: epi_isl_11775985 to epi_isl_11776195). results sample source among the 213 samples in this study, 97 were collected in january 2022 (45.5%), all of which were from foreigners or returning vietnamese citizens who were staying in wpsar vol 13, no 3, 2022 | doi: 10.5365/wpsar.2022.13.3.955https://ojs.wpro.who.int/ 3 omicron variant in northern viet nam, 2022ung et al fig 1. distribution of samples sent for whole-genome sequencing by sars-cov-2 variant in northern viet nam, january and february 2022 epidemiological week total samples delta (%) omicron (%) n u m b er o f sa m p le s p er ce nt ag e of s am p le s 80 70 60 50 40 30 20 10 1 16 27 40 32.5% 14.3% 16 12.5% 26 15.4% 6.7% 14 7.4% 18.9% 81.2% 92.6% 67.5% 85.7% 87.5% 84.6% 93.3% 74 2 3 4 5 6 7 8 februaryjanuary 0 100% 90% 80% 70% 50% 60% 40% 20% 30% 10% 0% samples were not collected during week 5 due to the tet holiday. a samples were not collected during week 5 due to the tet holiday. table 1. circulation of sars-cov-2 variants in samples sent for whole-genome sequencing in northern viet nam, january and february 2022 variant january (week) february (week) 1 2 3 4 total 5a 6 7 8 total imported cases delta 13 2 13 2 30 tet holiday 1 0 0 1 omicron ba.1 3 9 15 2 29 3 0 1 4 omicron ba.1.1 0 14 10 3 27 5 0 0 5 omicron ba.2 0 2 2 7 11 6 5 15 26 community cases delta 0 0 0 0 0 tet holiday 1 4 5 10 omicron ba.1 0 0 0 0 0 0 1 3 4 omicron ba.1.1 0 0 0 0 0 0 3 3 6 omicron ba.2 0 0 0 0 0 0 13 46 59 omicron xe 0 0 0 0 0 0 0 1 1 wpsar vol 13, no 3, 2022 | doi: 10.5365/wpsar.2022.13.3.955 https://ojs.wpro.who.int/4 ung et alomicron variant in northern viet nam, 2022 viet nam, suggesting that those included in this study are a small fraction of total cases.12 our results provide additional information about the spread of the omicron ba.2 sublineage in viet nam, which may help plan for and manage infections in the near future. active surveillance of sars-cov-2 variants based on whole-genome sequencing is one source of information along with other sources of surveillance that contribute to risk assessment for adjusting public health measures and assessing vaccine effectiveness. acknowledgements the authors acknowledge the support of the provincial centers for disease control and prevention in northern viet nam and the national foundation for science and technology development. conflicts of interest the authors have no conflicts of interest to declare. ethics approval the analyses conducted in this study were conducted as part of the regular activities of the national institute of hygiene and epidemiology. patient data are anonymized and no ethical approval was required for this study. funding this study was supported by the national foundation for science and technology development (nafosted – 108.04-2019.08). references 1. he x, hong w, pan x, lu g, wei x. sars-cov-2 omicron variant: characteristics and prevention. medcomm. 2021;2:838–45. doi:10.1002/mco2.110 pmid:34957469 2. le c. vietnam confirms first omicron infection. vnexpress international. 27 december 2021. available from: https://e.vnexpress.net/ news/news/vietnam-confirms-first-omicron-infection-4409195. html, accessed 5 june 2022. 3. viet nam covid-19 situation report #75. hanoi: who representative office for viet nam; 2022. available from: https://www.who. int/vietnam/internal-publications-detail/covid-19-in-viet-nam-situation-report-75, accessed 17 april 2022. 4. sars-cov-2 genomic sequencing for public health goals: interim guidance, 8 january 2021. geneva: world health organization; 2021. available from: https://apps.who.int/iris/handle/10665/338483, accessed 5 june 2022. holiday.2 co-circulating with ba.2 were the ba.1 and ba.1.1 sublineages, both of which outnumbered ba.2 among cases in january but accounted for only a small number of cases in february (table 1). from week 7 to week 8, the number of ba.2 cases in the community jumped from 13 to 46, far outpacing the growth rate of other sublineages (table 1). discussion as of writing, the omicron variant is the predominant variant circulating globally.6–8 our findings revealed the rapid replacement of delta by the omicron variant in viet nam in january 2022, during which all positive samples were collected from people arriving in viet nam from abroad. our results showed the proportion of the omicron variant increased over time and accounted for 69.9% of infections among international arrivals in january 2022. these results corresponded to the epidemiological situation in other parts of asia such as hong kong special administrative region (china), japan, the republic of korea and singapore at that time.7–10 among the omicron sublineages, ba.2 was the main cause of community outbreaks. this sublineage accounted for 73.8% of analysed samples that underwent genetic sequencing and increased quickly among samples from the community (0 in week 6, 13 in week 7 and 46 in week 8), which shows the omicron ba.2 sublineage to be a more contagious strain. this report is the first to identify the omicron xe variant in the community in viet nam. because all imported cases were sequenced and the xe variant was not found among international arrivals, this case had no known link to the xe variant circulating in the united kingdom at the time and may have developed independently.11 our study has some limitations. it was conducted during the first 8 weeks of 2022 and was paused during week 5 due to the tet holiday, so the data are not consecutive. the results were only collected in northern viet nam and were not representative of the entire country at the time. additionally, this study focused on virological data, thus epidemiological data were not included. as specimens sent for whole-genome sequencing are from international arrivals and community clusters, not all notified cases are included in virological surveillance. for example, during the week of 14–20 february 2022, there were 276 633 new covid-19 cases reported in wpsar vol 13, no 3, 2022 | doi: 10.5365/wpsar.2022.13.3.955https://ojs.wpro.who.int/ 5 omicron variant in northern viet nam, 2022ung et al 9. kim m-k, lee b, choi yy, um j, lee k-s, sung hk, et al. clinical characteristics of 40 patients infected with the sars-cov-2 omicron variant in korea. j korean med sci. 2022;37(3):6–10. doi:10.3346/jkms.2022.37.e31 pmid:35040299 10. karim ssa, karim qa. omicron sars-cov-2 variant: a new chapter in the covid-19 pandemic. lancet. 2021;398(10317):2126–8. doi:10.1016/s0140-6736(21)02758-6 pmid:34871545 11. sars-cov-2 variants of concern and variants under investigation in england. london: uk health security agency; 2021 (technical briefing 31). available from: https://assets.publishing.service. gov.uk/government/uploads/system/uploads/attachment_data/ file/1042367/technical_briefing-31-10-december-2021.pdf, accessed 8 april 2022. 12. viet nam covid-19 situation report 81. hanoi: who representative office for viet nam; 2022. available from: https://www.who. int/vietnam/internal-publications-detail/covid-19-in-viet-nam-situation-report-81, accessed 6 june 2022. 5. phuong hvm, tung ts, trang uth, hang nlk, son nv, hien pt, et al. novel mutation of sars-cov-2, vietnam, july 2020. emerg infect dis. 2021;27(5):1519–21. doi:10.3201/eid2705.210013 pmid:33647228 6. chiara m, d’erchia am, gissi c, manzari c, parisi a, resta n, et al. next generation sequencing of sars-cov-2 genomes: challenges, applications and opportunities. brief bioinform. 2021;22(2):616– 30. doi:10.1093/bib/bbaa297 pmid:33279989 7. okumura n, tsuzuki s, saito s, saito t, takasago s, hojo m, et al. the first eleven cases of sars-cov-2 omicron variant infection in japan: a focus on viral dynamics. glob health med. 2021;4(2):133– 6. doi:10.35772/ghm.2021.01124 pmid:35586770 8. gu h, krishnan p, ng dym, chang ldj, liu gyz, cheng ssm, et al. probable transmission of sars-cov-2 omicron variant in quarantine hotel, hong kong, china, november 2021. emerg infect dis. 2022;28(2):460–2. doi:10.3201/eid2802.212422 pmid:34860154 https://ojs.wpro.who.int/ 1wpsar vol 14, no 2, 2023 | doi: 10.5365/wpsar.2023.14.2.985 field investigation report i n malaysia, the first case of coronavirus disease (covid-19) was diagnosed on 25 january 2020. in the urban city of seremban, which is the state capital of negeri sembilan with a population of 636 400, the first case was diagnosed on 5 february 2020.1 malaysia initiated the national covid-19 immunisation programme on 24 february 2021, which commenced in negeri sembilan on 3 march 2021.2 the programme provided free covid-19 vaccines across three phases: phase 1 targeted front-line health-care workers; phase 2 commenced on 19 april 2021 for elderly adults and high-risk groups; and phase 3 began on 12 july 2021 for all eligible people over the age of 18. herd immunity for covid-19 was estimated to require 50–66% of the population to be immunized, either spontaneously or artificially,3 and the ministry of health malaysia projected a herd immunity threshold of 70–80% vaccination coverage.4 to the best of our knowledge, there has been no local study on covid-19 vaccination in negeri sembilan; therefore, the objective of this study is to describe the characteristics of covid-19 cases and two-dose vaccination coverage in seremban district during 2021. methods a descriptive analysis of all covid-19 cases registered in seremban was undertaken from 1 january to 31 december 2021. a confirmed case of covid-19 was defined as a person with a positive rapid antigen test in predetermined areas with an incidence of covid-19 a seremban district health office, ministry of health malaysia, seremban, negeri sembilan, malaysia. b department of community health, faculty of medicine and health sciences, universiti putra malaysia, serdang, selangor, malaysia. c department of social and preventive medicine, faculty of medicine, universiti malaya, kuala lumpur, malaysia. d department of public health medicine, faculty of medicine, universiti teknologi mara, shah alam, selangor, malaysia. e disease control division, ministry of health, putrajaya, malaysia. published: 24 may 2023 doi: 10.5365/wpsar.2023.14.2.985 objective: malaysia’s first case of coronavirus disease (covid-19) was reported in january 2020, with the first case in the state of negeri sembilan diagnosed on 17 february 2020. the national covid-19 immunisation programme commenced in early march 2021 in negeri sembilan. this study describes the covid-19 cases and vaccination coverage in seremban district, negeri sembilan, during 2021. methods: the demographic and clinical characteristics of covid-19 cases and the district’s vaccination coverage were described. vaccination coverage was plotted against covid-19 cases on the epidemic curve. the chi-square test was used to examine the differences between the vaccination status of covid-19 cases and severity category, hospitalization status and mortality. results: in seremban district, there were 65 879 confirmed cases of covid-19 in 2021. the data revealed that the 21–30-year age group had the highest proportion of cases (16 365; 24.8%), the majority of cases were male (58.3%), and most cases were from the sub-district of ampangan (23.1%). the majority of cases were malaysian. over half (53.5%) were symptomatic, with fever (29.8%) and cough (22.8%) being the most frequently reported symptoms. covid-19 vaccination status was significantly associated with severity category, hospitalization and mortality (p < 0.001 for all categories). discussion: this is the first study to describe two-dose vaccination coverage and the trend in covid-19 cases in seremban district. it was observed that covid-19 cases had been reduced following more than 60.0% vaccination coverage. epidemiology of covid-19 cases and vaccination coverage in seremban district, malaysia, 2021 khairul hafidz alkhair khairul amin,a,b nur nadiatul asyikin bujang,a,c siti aishah abas,a,d nadiatul ima zulkifli,a syuaib aiman amir,a sharina mohd shah,a veshny ganesan,a nurul fazilah aziz,a muhammad adli jalaluddin,a mohd shahrol abd wahil,e muhamad hazizi muhamad hasani,a noor khalili mohd alia and mohamad paid yusofa correspondence to khairul hafidz alkhair khairul amin (email: drkhairulhafidz@gmail.com) wpsar vol 14, no 2, 2023 | doi: 10.5365/wpsar.2023.14.2.985 https://ojs.wpro.who.int/2 khairul amin et alcovid-19 cases and vaccination coverage in seremban almost all of the reported cases (65 642; 99.6%) were locally acquired, 23 333 (35.4%) were hospitalized for isolation and treatment, and 561 died (0.9%) (table 1). the number of covid-19 cases per week increased between march and august 2021, declined in early august 2021, and then plateaued until december 2021. on 8 august 2021, two-dose vaccination coverage for adults reached 56% (fig. 1). before the vaccination programme, from 1 january to 20 march 2021, there were 7149 confirmed covid-19 cases including 31 deaths. most of these cases were in severity categories 1 (4807; 67.2%) and 2 (2297; 32.2%), while 14 cases (0.2%) were in category 3. none were in categories 4 and 5 (table 2). from the start of the vaccination programme on 21 march 2021 until 60.0% coverage was reached on 15 august 2021, 43 375 patients were registered with covid-19, of whom 37 937 (87.5%) were unvaccinated. of the 476 deaths, 431 (90.5%) were unvaccinated. in terms of severity, 23 265 were category 1 (21 316 unvaccinated vs 1949 vaccinated), 18 970 were category 2 (15 679 unvaccinated vs 3291 vaccinated), 656 were category 3 (507 unvaccinated vs 149 vaccinated), 7 were category 4 (4 unvaccinated vs 3 vaccinated), and 1 was category 5 (vaccinated) (table 2). for the period of 15 august to 5 september 2021 (with vaccination coverage of 60.0–84.0%), 4965 covid-19 cases were reported. with regard to covid-19 severity, 3048 cases were category 1 (1389 unvaccinated vs 1659 vaccinated), 1771 were category 2 (693 unvaccinated vs 1078 vaccinated), 82 were category 3 (31 unvaccinated vs 51 vaccinated), 12 were category 4 (5 unvaccinated vs 7 vaccinated), and 3 were category 5 (2 unvaccinated vs 1 vaccinated) (table 2). twenty of the 49 covid-19 deaths (40.8%) during this period were unvaccinated. there was a large decline in cases once vaccination coverage of more than 60.0% was reached (fig. 1). it was also found that the case fatality rate was higher when vaccine coverage was less than 60.0% (1.1%) compared to when it was 60.0–84.0% (0.3%). there was a significant difference in the distribution of unvaccinated and vaccinated (two doses) cases by severity category, hospitalization and mortality (p < 0.001; greater than 10% or a person (alive or dead) with a positive reverse transcription polymerase chain reaction test.5 covid-19 severity was classified into five categories: category 1, asymptomatic; category 2, symptomatic without pneumonia symptoms; category 3, symptomatic with pneumonia symptoms; category 4, requiring intensive care and supplemental oxygen; and category 5, critical illness with multiple organ involvement.6 telephone interviews for every case were conducted by employees of the seremban district health office to gather data on demographics, symptoms, onset date, date of exposure, travel history, comorbidities and vaccination status. vaccination coverage for seremban district from march to july 2021 was obtained from data compiled manually in microsoft excel® from each health-care facility and the malaysia vaccine administration system. from 23 july to 31 december 2021, vaccination coverage was obtained through an automated system.7 vaccination coverage was plotted against covid-19 cases on an epidemic curve (fig. 1). all verified data were recorded in a line list, and microsoft excel® was used for data analysis. the demographic and clinical characteristics of confirmed covid-19 cases and district vaccination coverage were tabulated and analysed using descriptive statistics. the chi-square test was used to examine the differences between the vaccination status of covid-19 cases and severity category, hospitalization status and mortality. results there were 65 879 confirmed cases of covid-19 in seremban district in 2021, giving an incidence rate of 10 358 per 100 000 population. the cases were distributed unevenly among the eight sub-districts. subdistrict ampangan recorded the highest number of cases (15 213; 23.1%), while sub-district pantai had the lowest (362; 0.5%). a plurality of cases were aged 21–30 years (16 365; 24.8%), and a majority were male (38 421; 58.3%), malaysian nationals (54 023; 82.0%) and symptomatic (35 262; 53.5%). fever (19 602; 29.8%), cough (15 049; 22.8%) and loss of smell and taste (5448; 8.3%) were the most frequently observed symptoms. the majority of cases had no comorbidities (55 981; 85.0%) and had a history of close contact with at least one other confirmed case (47 480; 72.1%). wpsar vol 14, no 2, 2023 | doi: 10.5365/wpsar.2023.14.2.985https://ojs.wpro.who.int/ 3 covid-19 cases and vaccination coverage in serembankhairul amin et al which reported that vaccination could prevent severe covid-19 illness, hospitalization, intensive care unit admission and death.12 our data showed that the number of covid-19 cases per week was decreasing when two-dose vaccination coverage reached 60.0%. while vaccination has been shown to reduce covid-19 outbreaks,13,14 the impact of other response components also needs to be considered. malaysia was under its third movement control order from 12 may 2021 to 1 april 2022, during which international, inter-state and inter-district travel, as well as economic, social, educational, sports and business operation hours, were restricted. physical distancing and mask use were enforced nationwide under the prevention and control of infectious diseases act 1988. personal hygiene practices including hand washing were continuously promoted by the ministry of health through various media platforms. during this period, covid-19 variants alpha and beta were mostly circulating in malaysia before the delta variant emerged in july 2021.15 another intervention for covid-19 was the establishment of the greater klang valley special task force on 12 july 2021. this task force was a multi-agency collaboration for covid-19 management in the klang valley (covering the federal territories of kuala lumpur and putrajaya and the state of selangor) and seremban district. the task force’s objectives included organizing strategic actions to improve health-care delivery, lessening the transmission of infectious diseases, and assisting both the general public and health-care professionals.16 table 3). the proportion of cases being hospitalized or dying who received two vaccine doses was lower compared to those who were unvaccinated (table 3). discussion this study describes the demographic and clinical characteristics of 65 879 cases of covid-19 from the most densely populated district in the state of negeri sembilan. it demonstrated that the number of cases per week declined after the district vaccination coverage reached 60.0%. the 21–30-year age group had the highest proportion of covid-19 cases, possibly due to rapid housing development and a growing workforce in this district.8 the fact that there were more cases among the male population could be due to their being less compliant with preventive measures such as frequent hand washing, face-mask use and stay-at-home orders.9 the high proportion of cases registered among malaysian nationals is most likely due to international travel restrictions. the high urbanization and population density in ampangan sub-district10 may also account for the elevated number of cases. most covid-19 cases were asymptomatic and detected through contact tracing. the high proportion of young cases may have contributed to the increased number of asymptomatic individuals, as younger individuals tend to have mild or no symptoms.11 compared to vaccinated cases, unvaccinated cases had higher proportions of cases in the higher severity categories, hospitalizations and deaths, similar to a previous study from malaysia, fig. 1. number of covid-19 cases by week and vaccination coverage in seremban district, malaysia, 1 january to 31 december 2021 100 50 25 0 75 125 3 january 2021 31 january 2021 28 february 2021 28 march 2021 25 april 2021 23 may 2021 20 june 2021 18 july 2021 15 august 2021 12 september 2021 10 october 2021 7 november 2021 5 december 2021 5000 4000 3000 2000 1000 0 number of cases 4 september 2021 nrp phase 3 12 may 2021 third movement control order 26 august 2021 national recovery plan (nrp) phase 2 vaccination coverage: ≥85% vaccination coverage: 60-84% vaccination coverage: <60% 24 september 2021 nrp phase 4 two-dose vaccination coverage (%) wpsar vol 14, no 2, 2023 | doi: 10.5365/wpsar.2023.14.2.985 https://ojs.wpro.who.int/4 khairul amin et alcovid-19 cases and vaccination coverage in seremban table 1. characteristics of covid-19 cases in seremban district, malaysia, 1 january to 31 december 2021 (n = 65 879) characteristic n % age group 0–10 9075 13.8 11–20 8236 12.5 21–30 16 365 24.8 31–40 12 576 19.1 41–50 7190 10.9 51–60 4965 7.5 >60 3947 6.0 no information 3525 5.4 sex male 38 421 58.3 female 27 458 41.7 nationality malaysian 54 023 82.0 other 11 856 18.0 symptomatic yes 35 262 53.5 no 30 617 46.5 sub-district ampangan 15 213 23.1 labu 13 445 20.4 setul 10 761 16.3 rantau 9286 14.1 rasah 7278 11.0 seremban 6558 10.0 lenggeng 2038 3.1 bandar seremban 938 1.4 pantai 362 0.5 symptoms fever 19 602 29.8 cough 15 049 22.8 loss of smell and taste 5448 8.3 sore throat 3572 5.4 myalgia 2760 4.2 headache 2096 3.2 stomach pain 1155 1.8 comorbidities none 55 981 85.0 hypertension 5508 8.4 diabetes mellitus 3731 5.7 asthma 1408 2.1 heart disease 652 1.0 dyslipidaemia 477 0.7 characteristic n % history of close contact with confirmed covid-19 case yes 47 480 72.1 no 18 399 27.9 source of infection local 65 642 99.6 imported 237 0.4 hospitalized yes 23 333 35.4 no 42 546 64.6 status alive 65 318 99.1 dead 561 0.9 to our knowledge, this is the first study to describe two-dose vaccination coverage and the trend of covid-19 cases in seremban district. it was observed that covid-19 cases decreased once 60.0% vaccination coverage had been reached. the strength of this study is in the use of large datasets acquired from the seremban district health office, which may reflect the real number of covid-19 cases in other districts. these data are managed systematically, making their source more reliable. this study has limitations, the first of which is that it is a descriptive observational study of one area in malaysia. a more sophisticated statistical analysis is needed to compare vaccination coverage and the number of covid-19 cases. given that only symptomatic patients were screened for covid-19,15 a potentially large number of individuals with asymptomatic infection may have remained undiagnosed, thus contributing to the lower number of reported covid-19 cases. other limitations include: the lack of data on disease progression and on the use of the severity categories during diagnosis; the unavailability of covid-19 vaccine for the different variants; and the fact that case data on covid-19 variants were not obtained during field investigations as they were not a priority for the primary management of covid-19. the findings of this study need to be interpreted with caution. in summary, this study describes the epidemiology of covid-19 cases in 2021 in seremban district, malaysia. although we show that the covid-19 case wpsar vol 14, no 2, 2023 | doi: 10.5365/wpsar.2023.14.2.985https://ojs.wpro.who.int/ 5 covid-19 cases and vaccination coverage in serembankhairul amin et al table 2. covid-19 cases by severity category before and after the vaccination programme started in seremban district, malaysia, 1 january to 31 december 2021 (n = 65 879) category 1: asymptomatic. category 2: symptomatic without pneumonia symptoms. category 3: symptomatic with pneumonia symptoms. category 4: requiring intensive care and supplemental oxygen. category 5: critical illness with multiple organ involvement. before vaccination programme, 1 january to 20 march 2021 severity category cases (n = 7149) n % 1 4807 67.2 2 2297 32.2 3 14 0.2 4 0 0 5 0 0 deaths 31 0.4 vaccination coverage <60.0%, 21 march to 14 august 2021 severity category cases (n = 43 375) unvaccinated (n = 37 937) vaccinated (n = 5438) n % n % 1 23 265 21 316 91.6 1949 8.4 2 18 970 15 679 82.7 3291 17.3 3 656 507 77.3 149 22.7 4 7 4 57.1 3 42.9 5 1 0 0 1 100 deaths 476 431 90.5 45 9.5 vaccination coverage 60.0–84.0%, 15 august to 5 september 2021 severity category cases (n = 4965) unvaccinated (n = 2140) vaccinated (n = 2825) n % n % 1 3048 1389 45.6 1659 54.4 2 1771 693 39.1 1078 60.9 3 82 31 37.8 51 62.2 4 12 5 41.7 7 58.3 5 3 2 66.7 1 33.3 deaths 49 20 40.8 29 59.2 vaccination coverage >85.0%, 6 september to 31 december 2021 severity category cases (n = 10 390) unvaccinated (n = 2353) vaccinated (n = 8037) n % n % 1 4976 1450 29.1 3526 70.9 2 5244 886 16.9 4358 83.1 3 144 12 8.3 132 91.7 4 18 3 16.7 15 83.3 5 3 2 66.7 1 33.3 deaths 5 0 0 5 100 wpsar vol 14, no 2, 2023 | doi: 10.5365/wpsar.2023.14.2.985 https://ojs.wpro.who.int/6 khairul amin et alcovid-19 cases and vaccination coverage in seremban table 3. factors associated with vaccination status in covid-19 cases in seremban district, malaysia, 1 january to 31 december 2021 (n = 65 874)a variable unvaccinated (n = 49 579) vaccinated (n = 16 295) p n % n % severity category 1 29 109 58.7 7155 43.9 <0.001 2 19 819 40.0 8763 53.8 3 633 1.3 345 2.1 4 12 0.02 26 0.2 5 6 0.01 6 0.04 hospitalized yes 20 075 40.5 3258 20.0 <0.001 no 29 504 59.5 13 037 80.0 outcome alive 49 097 99.0 16 216 99.5 <0.001 dead 482 1.0 79 0.5 a five of the total 65 879 covid-19 cases are excluded for lack of information on vaccination status. category 1: asymptomatic. category 2: symptomatic without pneumonia symptoms. category 3: symptomatic with pneumonia symptoms. category 4: requiring intensive care and supplemental oxygen. category 5: critical illness with multiple organ involvement. numbers decreased as vaccination coverage increased, other control measures such as movement control orders, physical distancing, mask use and regular hand washing are likely to have also contributed to the decrease in cases. additional analyses are needed to confirm an association between covid-19 cases and vaccination coverage. acknowledgements the authors would like to express their gratitude to supervisors and doctors from the seremban district health office for the opportunity to study and develop the analytical experience required for the preparation of this article. conflicts of interest the authors have no conflicts of interest to declare. ethics statement the study protocol was approved by the medical research and ethics committee, ministry of health malaysia (nmrr id-22-01171-6ar). funding none references 1. situasi terkini 06 feb 2020 [website]. putrajaya: ministry of health malaysia; 2020 (in malay). available from: https://covid-19.moh. gov.my/terkini/022020/situasi-terkini-06-feb-2020, accessed 24 november 2022. 2. jawatankuasa khas jaminan akses bekalan vaksin covid-19 (jkjav) [the special committee for ensuring access to covid-19 vaccine supply (jkjav)]. putrajaya: ministry of science, technology and innovation malaysia; 2021 (in malay). available from: https://www.mosti.gov.my/wp-content/uploads/2021/03/siaran-media-jkjav-21-mac-20201-pemberian-vaksin-fasapertama-diutamakan-kepada-barisan-hadapan.pdf, accessed 3 february 2023. 3. neagu m. the bumpy road to achieve herd immunity in covid-19. j immunoassay immunochem. 2020;41(6):928–45. doi:10.1080/ 15321819.2020.1833919 pmid:33086932 4. khairy: no specific herd immunity threshold for covid-19. in: codeblue [website]. kuala lumpur: galen centre for health & social policy; 2021. available from: https://galencentre.org/codeblueproject/, accessed 24 november 2022. 5. case definition of sars-cov-2 infection – three (3) options, a through c (annex 1). putrajaya: ministry of health malaysia; 2020. available from: https://covid-19.moh.gov.my/garis-panduan/garispanduan-kkm/annex-01-covid-19-case-definition-23052022. pdf, accessed 24 november 2022. https://covid-19.moh.gov.my/terkini/022020/situasi-terkini-06-feb-2020 wpsar vol 14, no 2, 2023 | doi: 10.5365/wpsar.2023.14.2.985https://ojs.wpro.who.int/ 7 covid-19 cases and vaccination coverage in serembankhairul amin et al 6. post covid-19 management protocol (annex 50), first edition. putrajaya: ministry of health malaysia; 2021. available from: https://covid-19.moh.gov.my/garis-panduan/garis-panduan-kkm/annex_50_ post_covid-19_management_protocol_12july2021.pdf, accessed 24 november 2022. 7. mysejahtera [website]. putrajaya: ministry of health malaysia; 2021. available from: https://mysejahtera.moh.gov.my/en/, accessed 24 november 2022. 8. nasir ahmad nsb, mustafa fb. analisis perubahan guna tanah negeri sembilan melalui aplikasi sistem maklumat geografi (gis) [analysis of land use changes of negeri sembilan using geographic information system (gis)]. malays j soc space. 2019;15(1):113– 31. doi:10.17576/geo-2019-1501-09 9. de la vega r, ruíz-barquín r, boros s, szabo a. could attitudes toward covid-19 in spain render men more vulnerable than women? glob public health. 2020;15(9):1278–91. doi:10.1080/17441692 .2020.1791212 pmid:32623959 10. zamzuri maia, ibrahim fe, reffien mam, hanan mfm, dasani mhm, ali nkm, et al. epidemiological characteristics of covid-19 in seremban, negeri sembilan, malaysia. open access maced j med sci. 2020;8(t1):471–5. doi:10.3889/oamjms.2020.5461 11. kronbichler a, kresse d, yoon s, lee kh, effenberger m, shin ji. asymptomatic patients as a source of covid-19 infections: a systematic review and meta-analysis. int j infect dis. 2020;98:180–6. doi:10.1016/j.ijid.2020.06.052 pmid:32562846 12. suah jl, tok psk, ong sm, husin m, tng bh, sivasampu s, et al. pick-ing malaysia’s epidemic apart: effectiveness of a diverse covid-19 vaccine portfolio. vaccines (basel). 2021;9(12):1381. doi:10.3390/vaccines9121381 pmid:34960126 13. moghadas sm, vilches tn, zhang k, wells cr, shoukat a, singer bh, et al. the impact of vaccination on coronavirus disease 2019 (covid-19) outbreaks in the united states. clin infect dis. 2021;73(12):2257–64. doi:10.1093/cid/ciab079 pmid:33515252 14. bartsch sm, wedlock pt, o’shea kj, cox sn, strych u, nuzzo jb, et al. lives and costs saved by expanding and expediting coronavirus disease 2019 vaccination. j infect dis. 2021;224(6):938–48. doi:10.1093/infdis/jiab233 pmid:33954775 15. kenyataan akhbar kpk 28 julai 2021 – situasi semasa jangkitan penyakit coronavirus 2019 (covid-19) di malaysia [director-general of health press statement 28 july 2021 – the current coronavirus disease 2019 (covid-19) situation in malaysia]. putrajaya: ministry of health malaysia; 2021 (in malay). available from: https:// kpkesihatan.com/2021/07/28/kenyataan-akhbar-kpk-28-julai2021-situasi-semasa-jangkitan-penyakit-coronavirus-2019-covid19-di-malaysia/, accessed 3 february 2023. 16. kenyataan media kementerian kesihatan malaysia – pendaftaran sebagai sukarelawan “greater klang valley special task force” [media statement of the ministry of health malaysia – registration as volunteers for “greater klang valley special task force”]. putrajaya: ministry of health malaysia; 2021 (in malay). available from: https://covid-19.moh.gov.my/semasa-kkm/2021/07/pendaftaran-sukarelawan-greater-klang-valley-special-task-force, accessed 3 february 2023. https://covid-19.moh.gov.my/garis-panduan/garis-panduan-kkm/annex_50_post_covid-19_management_protocol_12july2021.pdf https://ojs.wpro.who.int/ 1wpsar vol 14, no 1, 2023 | doi: 10.5365/wpsar.2023.14.1.998 original research the coronavirus disease (covid-19) pandemic has affected all countries but has had a disproportionate impact on lowand middle-income countries such as papua new guinea.1 papua new guinea is one of the world’s most diverse countries – geographically, ethnically, linguistically, environmentally and culturally. the majority of the population (>85%) lives in rural villages, which are often difficult to access due to the country’s challenging terrain.2 as of 3 february 2023, there were 46 750 confirmed cases of covid-19 and 670 confirmed deaths in papua new guinea.3 however, these case numbers are likely underestimates due to low testing rates.4 several factors have increased the vulnerability of the population of papua new guinea to covid-19. cultural practices and events unique to papua new guinea, including funeral practices (haus krai), religious and sporting gatherings, as well as cultural events such as singings, have the potential to cause widespread transmission of severe acute respiratory syndrome coronavirus 2 (sars-cov-2) within communities. traditional greeting practices, which include shaking hands or embracing,5 and crowded community living also pose a high risk for transmission of sars-cov-2 and other diseases, such as tuberculosis.6 in papua new guinea, the average household size is 6.24 people in rural areas and 8.01 in urban areas. the highest density is in the national capital district (ncd), with 9.19 people per household.7 these factors, combined with poor sanitation and hygiene practices, greatly increase the risk of sars-cov-2 transmission in many communities.8 as the transmission of sars-cov-2 is predominantly via an airborne route, a papua new guinea institute of medical research, goroka, eastern highland province, papua new guinea. b public health intervention research program, kirby institute, university of new south wales, sydney, new south wales, australia. c school of public health and community medicine, university of new south wales, sydney, new south wales, australia. d biosecurity program, kirby institute, university of new south wales, sydney, new south wales, australia. e school of public affairs, college of public service and community solutions, arizona state university, az, united states of america. published: 28 march 2023 doi: 10.5365/wpsar.2023.14.1.998 objective: during the coronavirus disease (covid-19) pandemic, face mask wearing was mandated in port moresby, papua new guinea in july 2020, but compliance was observed to be low. we aimed to determine the frequency of face mask wearing by the general public in papua new guinea under the mask mandate. methods: to estimate compliance with the mandate, we analysed photographs of people gathering in port moresby published between 29 september and 29 october 2020. photo-epidemiology was performed on the 40 photographs that met predefined selection criteria for inclusion in our study. results: among the total of 445 fully visible photographed faces, 53 (11.9%) were observed wearing a face mask over mouth and nose. complete non-compliance (no faces wearing masks) was observed in 19 (4.3%) photographs. physical distancing was observed in 10% of the 40 photographs. mask compliance in indoor settings (16.4%) was higher than that observed in outdoor settings (9.8%), and this difference was statistically significant (p < 0.05). mask compliance was observed in 8.9% of large-sized gatherings (>30 people), 12.7% of medium-sized gatherings (11–30 people) and 25.0% of small-sized gatherings (4–10 people; photographs with <4 people were excluded from analysis). discussion: we found very low population compliance with face mask mandates in papua new guinea during the prevaccine pandemic period. individuals without face coverings and non-compliant with physical distancing guidelines are considered to be in a high-risk category for covid-19 transmission particularly in mediumand large-sized gatherings. a new strategy to enforce public health mandates is required and should be clearly promoted to the public. early pandemic use of face masks in papua new guinea under a mask mandate mark raphael,a angela kelly-hanku,a,b david heslop,c danielle hutchinson,d mohana kunasekaran,d ashley quigleyd and raina macintyred,e correspondence to danielle hutchinson (email: dani.hutchinson@protonmail.com) wpsar vol 14, no 1, 2023 | doi: 10.5365/wpsar.2023.14.1.998 https://ojs.wpro.who.int/2 raphael et alearly pandemic use of face masks in papua new guinea under a mask mandate methods a search was conducted in the online archives of the national newspaper for photographs of gatherings in port moresby between 29 september and 29 october 2020. this month-long time period was chosen because at that time the mask mandate remained in place in ncd due to ongoing community transmission (rather than a covid-19 surge), while across the country all other restrictions had been lifted, including those on schools, sporting matches and international travel.12 a list of sources for each photograph is given in supplementary table 1. only one newspaper was searched to avoid duplication of photographs capturing the same event. each photograph was assessed against a set of inclusion and exclusion criteria (table 1). in order to be included in the study, photographs had to be of gatherings held in port moresby between 29 september and 29 october 2020, spontaneous and of sufficient quality with clear visibility for easy counting purposes. in addition, there had to be a minimum of four people in the photograph. data analysis photo-epidemiology was performed by two reviewers independently (dh and mk); any discrepancies were resolved by a third reviewer (aq).17,18 a manual head count was done to determine the gathering size, and a count of all faces with the mouth and nose visible was performed. finally, a mask count was performed; to be included in the mask count, masks had to cover both the mouth and nose (masks covering only the mouth were not included in the count). masks could be of the surgical, n95, disposable or cloth types; any other form of face covering was excluded from the count. mask wearing was calculated as the number of people wearing a mask as a percentage of the number of visible faces. each photograph was counted twice by each reviewer, with the average of the four counts used for analysis. inter-rater reliability score was calculated to ascertain the level of agreement between the two reviewers (dh and mk) who performed the counting of the photographs. the statistical package r (version 3.6.3) was used for this analysis, with the kappa coefficient obtained using the “psych” and “irr” packages.19 inter-rater reliability crowded gatherings have been identified as an important contributor to the spread of covid-19. although large mass gatherings have been frequently cited as a major source of case transmission, the so-called super-spreader events, gatherings of less than 100 people in private or enclosed public places, have been shown to cause the highest incidence of new cases, suggesting that density and ventilation may have more effect on transmission risk than crowd size.9 in 2020, as covid-19 case numbers increased globally, papua new guinea adopted several public health and social measures to prevent community transmission, including travel restrictions, quarantine and isolation measures, physical distancing and face mask wearing.10 however, despite the government-imposed restrictions, daily routine mobility persisted, especially in rural areas or communities where enforcement of restrictions was limited.11 on 3 october 2020, following a plateau in case numbers across the nation, most of the measures were relaxed, including restrictions on domestic and international flights, and business premises and recreational centres reopened.3 in contrast, the face mask mandate, implemented on 23 july 2020, remained in place in areas with continued levels of community transmission such as port moresby, ncd, which had accounted for 70 of the 91 cases nationwide from the month of september 2020.3,12 as of 4 october 2020, ncd accounted for 60% (n = 322) of the country’s cumulative reported cases.3 evidence suggests that mask wearing by healthy people in community settings provides protection against sars-cov-2 infection,13 and face mask wearing is also a well established method of source control.14 in addition, a study conducted in australia, the united kingdom of great britain and northern ireland and the united states of america showed that mandating the use of face masks results in higher usage of masks.15 in papua new guinea, however, anecdotal evidence was suggestive of widespread non-compliance with mandatory face mask wearing.16 this study therefore aimed to estimate the frequency of face mask wearing by the general public in port moresby during the early stages of the covid-19 pandemic prior to vaccines being available, when community transmission was established and mask wearing was mandated. wpsar vol 14, no 1, 2023 | doi: 10.5365/wpsar.2023.14.1.998https://ojs.wpro.who.int/ 3 early pandemic use of face masks in papua new guinea under a mask mandateraphael et al screened for eligibility; 31 photographs were subsequently excluded because they had the appearance of being “non-spontaneous” (i.e. staged), and one was excluded because it was of fewer than four people. analysis was performed on the 40 remaining photographs that met all study inclusion criteria. a total of 944 people were captured in the photographs; 445 faces were sufficiently visible to assess mask wearing. averaged across all 40 photographs, the proportion of people observed wearing a mask was 11.9% (n = 53) (table 2). in nearly half of the photographs (n = 19; 47.5%), no one was wearing a mask. of these 19 photographs where zero mask compliance was observed, 4 were of indoor settings and 15 were of outdoor settings; 18 of the 19 exhibited no evidence of physical distancing. nearly two thirds of the 19 photographs showing no mask compliance (n = 12; 63.1%) were of small-sized gatherings; 5 (26.4%) were of medium-sized gatherings and 2 (10.5%) were of large-sized gatherings (p < 0.05). table 2 shows the levels of mask compliance by setting (indoor vs outdoor), presence of physical distancing (yes vs no) and gathering size (small vs medium vs large) across all 40 photographs. there were statistically significant differences between the proportion of people wearing masks by setting, presence of physical distancing and gathering size. the proportion of faces with masks was higher in indoor settings than in outdoor settings (16.4% vs 9.8%; p < 0.05). the prevalence of mask wearing was higher among those who were observed practising physical distancing relative to those who were not (37.8% vs 9.6%; p < 0.0001). finally, mask compliance was highest among those attending small gatherings (25.0%), followed by those participating in medium-sized gatherings (12.7%). at 8.9%, the lowest level of compliance was observed among those attending large gatherings. was high: cicchetti-allison weighted kappa = 0.995 (confidence interval: 0.991–0.997),20 implying an almost perfect level of agreement between the two reviewers. the united states centers for disease control and prevention defines small gatherings as informal and usually occurring with family and friends within a regular social gathering, and large gatherings as consisting of many people from multiple households in a public space, such as conferences, sporting events, festivals and large parties.21 as risk of covid-19 transmission is considered to vary according to the size of gatherings,22 photographs were further categorized according to small (4–10), medium (11–30) and large (>30) in-person gatherings, which was extrapolated from the head count (as a minimum number of people at the gathering).22 the photographs were also examined for evidence of physical distancing; photographs were rated as “yes” if people were more than 1.5 m apart in the photographs, and “no” if the distance between people was less than this. photographed gatherings were also categorized as either “indoor” or “outdoor”. we calculated the proportions of mask compliance by setting (indoor vs outdoor), presence of physical distancing (yes vs no) and gathering size (small vs medium vs large). to ascertain whether there were significant differences in mask wearing compliance by setting and presence of physical distancing, a two-sample z-test was used. to assess the effect of gathering size on compliance, we used a chi-squared test (3x2 contingency table). a 95% level of significance was used for all statistical tests. results a total of 72 photographs published from 29 september to 29 october 2020 were identified by the search and table 1. inclusion and exclusion criteria for photograph selection inclusion criteria exclusion criteria photograph captured in port moresby between 29 september and 29 october 2020 photograph taken outside of the reporting period photograph clearly visible for purpose of counting photograph is blurred or unclear photograph used only once duplicate photograph a minimum of four people in the photograph less than four people in the photograph photograph is taken spontaneously/unplanned photograph is arranged, planned or orchestrated (e.g. group portrait) wpsar vol 14, no 1, 2023 | doi: 10.5365/wpsar.2023.14.1.998 https://ojs.wpro.who.int/4 raphael et alearly pandemic use of face masks in papua new guinea under a mask mandate mask wearing has a strong cultural significance in papua new guinean societies and features prominently in many traditional ceremonies and festivals. mask types differ by region and serve a variety of purposes, including representation of totems, entertainment, intimidation and concealment of the wearers’ identity. in the majority of circumstances, traditional masks are worn by men.26 wearing of face masks for protection from an airborne virus was an unfamiliar context, with high potential for cultural resistance and low uptake. in a study of risk perceptions and responses to covid-19 conducted early in the pandemic on a university campus, both students and lecturers reported physical distancing as being contrary to papua new guinean culture. hugging, shaking hands and standing closely in groups are seen as cultural practices and “a way of life” that is very difficult to stop.27 this study also noted that although there were directions by university management to wear a mask on campus, compliance diminished quickly, and there was a lack of compliance with mask use on campus by both students and lecturers.27 other possible reasons for low compliance include difficulties in obtaining face masks because of a lack of supply, a lack of accessibility and/or high cost. supplies of personal protective equipment (ppe) were indeed limited in papua new guinea during the height of the discussion using photo-epidemiology, we found low levels of compliance with government-mandated regulations relating to face mask wearing in port moresby during october 2020. an overall compliance of just 11.9% was observed; compliance was especially low among people attending outdoor events and mediumand large-sized gatherings, highlighting the potential for higher covid-19 transmission in these settings. in papua new guinea, sociocultural norms, as well as personal, social and environmental barriers, are likely to impact population attitudes and compliance with public health measures.23 in july 2020, papua new guinea formally adopted niupela pasin – guidelines for the “new normal” in the time of the covid-19 pandemic. these guidelines included physical distancing, hand hygiene, respiratory etiquette and the use of face masks when physical distancing is not possible.24 however, widespread adoption of niupela pasin, including hand washing and face mask wearing, failed to materialize and there was little evidence of compliance.25 cultural factors and social barriers, such as a fear of being considered sick with covid-19 when wearing a mask, being stigmatized when wearing a mask or fear of judgement when wearing a mask, have been suggested as possible reasons for low compliance. table 2. mask compliance according to setting, presence of physical distancing and gathering size variable number of photographs (% of column total) total number of faces (% of column total) mask compliance number of faces with masks (% of faces) p setting indoor 11 (27.5%) 140 (31.5%) 23 (16.4%) <0.05 outdoor 29 (72.5%) 305 (68.5%) 30 (9.8%) total 40 (100.0%) 445 (100.0%) 53 (11.9%) physical distancing present yes 4 (10.0%) 37 (8.3%) 14 (37.8%) <0.0001 no 36 (90.0%) 408 (91.7%) 39 (9.6%) total 40 (100.0%) 445 (100.0%) 53 (11.9%) gathering size small (1–10 people) 8 (20.0%) 32 (7.2%) 8 (25.0%) <0.0001 medium (11–30 people) 23 (57.5%) 221 (49.7%) 28 (12.7%) large (>30 people) 9 (22.5%) 192 (43.1%) 17 (8.9%) total 40 (100.0%) 445 (100.0%) 53 (11.9%) note: final count numbers are expressed as an average of three reviewers and represented as whole persons. wpsar vol 14, no 1, 2023 | doi: 10.5365/wpsar.2023.14.1.998https://ojs.wpro.who.int/ 5 early pandemic use of face masks in papua new guinea under a mask mandateraphael et al in conclusion, we found very low face mask compliance in port moresby, papua new guinea during a mask mandate in the period prior to vaccines being available. health authorities in papua new guinea will require better strategies to address the individual, social and cultural barriers to improve population attitudes towards face mask use and prevent sars-cov-2 transmission, especially in high-risk gatherings. conflicts of interest rm currently consults for mask manufacturers detmold and ascend, and receives funding for investigator-driven research on influenza from sanofi. she currently receives funding from australian grant bodies, the national health and medical research council (nhmrc) and the medical research future fund. she is on the world health organization (who) technical advisory group on covid-19 vaccine composition and the who strategic advisory group of experts on immunization (sage) on smallpox and mpox vaccines. the other authors have no conflicts of interest to declare. ethics statement not applicable. funding rm is supported by a nhmrc principal research fellowship (grant no. 1137582). references 1. eaton l. covid-19 has harmed poorest countries the most across asia pacific, says oecd. bmj. 2020;371:m4660. doi:10.1136/ bmj.m4660 pmid:33243755 2. grundy j, dakulala p, wai k, maalsen a, whittaker m. independent state of papua new guinea health system review. health syst transit. 2019;9(1):1–201. available from: https://apps.who.int/iris/ handle/10665/280088, accessed 11 july 2022. 3. ritchie h, mathieu e, rodés-guirao l, appel c, giattino c, ortiz-ospina e, et al. papua new guinea: coronavirus pandemic country profile. our world in data; 2020. available from: https:// ourworldindata.org /coronavirus/countr y/papua-new-guinea, accessed 5 february 2023. 4. papua new guinea coronavirus disease 2019 (covid-19) health situation report #45. png national department of health and world health organization; 2020. available from: https://www. who.int/docs/default-source/wpro---documents/countries/papuanew-guinea/covid-19/png-covid-19-health-situation-report-45.pdf, accessed 8 november 2022. 5. moffatt a. papua new guinean cultural profile. brisbane: diversicare; 2012. available from: http://www.diversicare.com.au/ wp-content/uploads/2015/10/culturalprofile_png.pdf, accessed 8 november 2022. covid-19 pandemic, with most ppe donated by foreign organizations for use within the health service.28 many people could not afford disposable masks for daily use or had difficulty cleaning reusable masks due to lack of water supply. strategies aimed at removing those barriers would be needed to improve face mask use. understanding the reasons behind the lack of enforcement of the mask mandate would also help to strengthen covid-19 prevention efforts. although the papua new guinea national pandemic act 2020 specifies which geographical areas and settings require mandatory face mask wearing, when people should be exempted and who is responsible for enforcing the orders, it does not describe how the mandate should be enforced.29 similar regulatory gaps were evident in other countries, such as the united states of america, where the state governments relied on businesses to enforce the mandate, but businesses expected the government to enforce the mandate.30 this implies that any attempts to improve face mask wearing through mandatory regulations would need to be accompanied by a greater level of community engagement and better health promotion messaging. this study is subject to some limitations. photoepidemiology is not a well established science. however, in the absence of more rigorous methods for monitoring mask wearing, it serves as an appropriate surrogate measure and has been used effectively in other fields of research.17,18 the sample we captured may not be representative of the whole community. physical distancing calculations were estimated and may have introduced measurement error. counting issues may arise as the visibility of faces in photographs is subjective and could differ between viewers. we addressed this by calculating an inter-rater reliability score to assess variability between reviewers. we acknowledge that some people may have taken their mask off for a photo but took this into account by excluding posed photographs. a qualitative study to assess behaviour around taking photographs while wearing a face mask would have addressed this issue but was beyond the scope of this study. the photographs taken during the study period may not be representative of normal daily life. finally, the level of community transmission declined during the study period, with cases decreasing in ncd from 70 in the previous month (september 2020) to 22 confirmed cases during the study period (october 2020),3,4,12 which may have impacted attitudes towards mask wearing. https://apps.who.int/iris/handle/10665/280088 https://apps.who.int/iris/handle/10665/280088 https://ourworldindata.org/coronavirus/country/papua-new-guinea https://ourworldindata.org/coronavirus/country/papua-new-guinea https://www.who.int/docs/default-source/wpro---documents/countries/papua-new-guinea/covid-19/png-covid-19-health-situation-report-45.pdf https://www.who.int/docs/default-source/wpro---documents/countries/papua-new-guinea/covid-19/png-covid-19-health-situation-report-45.pdf https://www.who.int/docs/default-source/wpro---documents/countries/papua-new-guinea/covid-19/png-covid-19-health-situation-report-45.pdf http://www.diversicare.com.au/wp-content/uploads/2015/10/culturalprofile_png.pdf http://www.diversicare.com.au/wp-content/uploads/2015/10/culturalprofile_png.pdf wpsar vol 14, no 1, 2023 | doi: 10.5365/wpsar.2023.14.1.998 https://ojs.wpro.who.int/6 raphael et alearly pandemic use of face masks in papua new guinea under a mask mandate 17. elachola h, gozzer e, rahman nmm, ditekemena j, pando-robles v, pa k, et al. photo-epidemiology to estimate face covering use in select areas in asia versus the americas and africa during the covid-19 pandemic. j travel med. 2020;27(8):taaa121. doi:10.1093/jtm/taaa121 pmid:32761134 18. cannuscio cc, weiss ee, fruchtman h, schroeder j, weiner j, asch da. visual epidemiology: photographs as tools for probing street-level etiologies. soc sci med. 2009;69(4):553–64. doi:10.1016/j.socscimed.2009.06.013 pmid:19573966 19. gamer m, lemon j, fellows i, singh p. package ‘irr’: various coefficients of interrater reliability and agreement. the comprehensive r archive network; 2012. available from: https://cran.r-project.org/ web/packages/irr/irr.pdf, accessed 8 november 2022. 20. mchugh ml. interrater reliability: the kappa statistic. biochem med (zagreb). 2012;22(3):276–82. pmid:23092060 21. small and large gatherings. atlanta, ga: united states centers for disease control and prevention; 2022. available from: https:// www.cdc.gov/coronavirus/2019-ncov/your-health/gatherings.html, accessed 8 november 2022. 22. brauner jm, mindermann s, sharma m, johnston d, salvatier j, gavenčiak t, et al. inferring the effectiveness of government interventions against covid-19. science. 2021;371(6531):eabd9338. doi:10.1126/science.abd9338 pmid:33323424 23. promoting mask-wearing during the covid-19 pandemic: a policymaker’s guide. preventepidemics.org; 2021. available from: https://preventepidemics.org/wp-content/uploads/2020/08/ promoting-mask-wearing-during-covid-19.pdf, accessed 8 november 2022. 24. niupela pasin: the “new normal”. port moresby: who representative office for papua new guinea; 2020. available from: https://www. who.int/papuanewguinea/emergencies/covid-19-in-papuanewguinea/ information/niupela-pasin, accessed 11 july 2022. 25. connell j. challenging modernity? covid-19, sorcery, religion and vaccines in papua new guinea. small states & territories. 2022;5(1):121–40. available from: https://www.um.edu.mt/library/ oar/handle/123456789/94156, accessed 8 november 2022. 26. waula bablis g. the great mask debate – to wear or not to wear? oceania. 2020;90(s1):25–9. doi:10.1002/ocea.5261 27. schuele e, kuman g, gibbs p, pus a, vamilat m, namun k. risk perceptions and responses to covid-19 at a papua new guinea university. contemporary png studies. 2020;33:59–80. doi:10.3316/informit.355977248324229 28. harriman b. png’s covid-19 risk still high despite drop in case numbers. abc news; 2021. available from: https://www. abc.net.au/radio-australia/programs/pacificbeat/png-ppe-cokedistribution/13674146, accessed 8 november 2022. 29. national pandemic act 2020. port moresby: national parliament of papua new guinea; 2020. available from: https://www.parliament. gov.pg/uploads/acts/20a_08.pdf, accessed 8 november 2022. 30. jacobs p, ohinmaa ap. the enforcement of statewide mask wearing mandates to prevent covid-19 in the us: an overview. f1000res. 2020;9:1100. doi:10.12688/f1000research.25907.1 pmid:33520192 6. honjepari a, madiowi s, madjus s, burkot c, islam s, chan g, et al. implementation of screening and management of household contacts of tuberculosis cases in daru, papua new guinea. public health action. 2019;9(suppl 1):s25–31. doi:10.5588/ pha.18.0072 pmid:31579646 7. papua new guinea demographic and health survey 2016-18. port moresby: national statistical office; 2019. available from: https:// sdd.spc.int/digital_library/papua-new-guinea-demographic-andhealth-survey-report-2016-18, accessed 8 november 2022. 8. davis t. covid-19: women, water, sanitation and hygiene in the market places of papua new guinea. wateraid; 2020. available from: https://www.wateraid.org/au/articles/covid-19-women-watersanitation-and-hygiene-in-the-market-places-of-papua-new-guinea, accessed 8 november 2022. 9. liu c, huang j, chen s, wang d, zhang l, liu x, et al. the impact of crowd gatherings on the spread of covid-19. environ res. 2022;213:113604. doi:10.1016/j.envres.2022.113604 pmid:35691382 10. masks become mandatory in port moresby after papua new guinea coronavirus spike. sbs news; 2020. available from: https://www. sbs.com.au/news/article/masks-become-mandator y-in-portmoresby-after-papua-new-guinea-coronavirus-spike/fg695kune, accessed 8 november 2022. 11. people still crossing indonesia border, says png governor. radio new zealand; 2020. available from: https://www.rnz.co.nz/ international/pacific-news/417111/people-still-crossing-indonesiaborder-says-png-governor, accessed 8 november 2022. 12. papua new guinea coronavirus disease 2019 (covid-19) health situation report #41. png national department of health and world health organization; 2020. available from: https://www. who.int/docs/default-source/wpro---documents/countries/papuanew-guinea/covid-19/png-covid-19-health-situation-report-41.pdf, accessed 8 november 2022. 13. andrejko kl, pry jm, myers jf, fukui n, deguzman jl, openshaw j, et al. effectiveness of face mask or respirator use in indoor public settings for prevention of sars-cov-2 infection – california, february–december 2021. mmwr morb mortal wkly rep. 2022;71(6):212–6. doi:10.15585/mmwr.mm7106e1 pmid:35143470 14. macintyre cr, chughtai aa. a rapid systematic review of the efficacy of face masks and respirators against coronaviruses and other respiratory transmissible viruses for the community, healthcare workers and sick patients. int j nurs stud. 2020;108:103629. doi:10.1016/j.ijnurstu.2020.103629 pmid:32512240 15. macintyre cr, nguyen py, chughtai aa, trent m, gerber b, steinhofel k, et al. mask use, risk-mitigation behaviours and pandemic fatigue during the covid-19 pandemic in five cities in australia, the uk and usa: a cross-sectional survey. int j infect dis. 2021;106:199–207. doi:10.1016/j.ijid.2021.03.056 pmid:33771668 16. covid-19 information for papua new guinea, solomon islands, and vanuatu. port moresby: u.s. embassy to papua new guinea, solomon islands, and vanuatu; 2022. available from: https:// pg.usembassy.gov/covid-19-information/, accessed 8 november 2022. https://cran.r-project.org/web/packages/irr/irr.pdf https://cran.r-project.org/web/packages/irr/irr.pdf https://www.cdc.gov/coronavirus/2019-ncov/your-health/gatherings.html https://www.cdc.gov/coronavirus/2019-ncov/your-health/gatherings.html https://preventepidemics.org/wp-content/uploads/2020/08/promoting-mask-wearing-during-covid-19.pdf https://preventepidemics.org/wp-content/uploads/2020/08/promoting-mask-wearing-during-covid-19.pdf https://www.who.int/papuanewguinea/emergencies/covid-19-in-papuanewguinea/information/niupela-pasin https://www.who.int/papuanewguinea/emergencies/covid-19-in-papuanewguinea/information/niupela-pasin https://www.who.int/papuanewguinea/emergencies/covid-19-in-papuanewguinea/information/niupela-pasin https://www.um.edu.mt/library/oar/handle/123456789/94156 https://www.um.edu.mt/library/oar/handle/123456789/94156 https://www.abc.net.au/radio-australia/programs/pacificbeat/png-ppe-coke-distribution/13674146 https://www.abc.net.au/radio-australia/programs/pacificbeat/png-ppe-coke-distribution/13674146 https://www.abc.net.au/radio-australia/programs/pacificbeat/png-ppe-coke-distribution/13674146 https://www.parliament.gov.pg/uploads/acts/20a_08.pdf https://www.parliament.gov.pg/uploads/acts/20a_08.pdf https://sdd.spc.int/digital_library/papua-new-guinea-demographic-and-health-survey-report-2016-18 https://sdd.spc.int/digital_library/papua-new-guinea-demographic-and-health-survey-report-2016-18 https://sdd.spc.int/digital_library/papua-new-guinea-demographic-and-health-survey-report-2016-18 https://www.wateraid.org/au/articles/covid-19-women-water-sanitation-and-hygiene-in-the-market-places-of-papua-new-guinea https://www.wateraid.org/au/articles/covid-19-women-water-sanitation-and-hygiene-in-the-market-places-of-papua-new-guinea https://www.sbs.com.au/news/article/masks-become-mandatory-in-port-moresby-after-papua-new-guinea-coronavirus-spike/fg695kune https://www.sbs.com.au/news/article/masks-become-mandatory-in-port-moresby-after-papua-new-guinea-coronavirus-spike/fg695kune https://www.sbs.com.au/news/article/masks-become-mandatory-in-port-moresby-after-papua-new-guinea-coronavirus-spike/fg695kune https://www.rnz.co.nz/international/pacific-news/417111/people-still-crossing-indonesia-border-says-png-governor https://www.rnz.co.nz/international/pacific-news/417111/people-still-crossing-indonesia-border-says-png-governor https://www.rnz.co.nz/international/pacific-news/417111/people-still-crossing-indonesia-border-says-png-governor https://www.who.int/docs/default-source/wpro---documents/countries/papua-new-guinea/covid-19/png-covid-19-health-situation-report-41.pdf https://www.who.int/docs/default-source/wpro---documents/countries/papua-new-guinea/covid-19/png-covid-19-health-situation-report-41.pdf https://www.who.int/docs/default-source/wpro---documents/countries/papua-new-guinea/covid-19/png-covid-19-health-situation-report-41.pdf https://pg.usembassy.gov/covid-19-information/ https://pg.usembassy.gov/covid-19-information/ https://ojs.wpro.who.int/ 1wpsar vol 12, no 3, 2021 | doi: 10.5365/wpsar.2021.12.3.858 regional analysis l eprosy, also known as hansen’s disease, is a chronic infectious disease caused by mycobacterium leprae. depending upon the bacillary load, the disease is classified as paucibacillary (pb) or multibacillary (mb) leprosy. early diagnosis and treatment prevent lifelong disabilities and deformities.1 in 1982, the world health organization (who) recommended the use of multidrug therapy (mdt) to treat both mb and pb leprosy.2 in who’s western pacific region, implementation of mdt began in 1985, and full coverage was achieved by 1994.3 in 1991, the world health assembly endorsed resolution wha 44.9 aimed at eliminating leprosy as a public health problem by the year 2000.4 elimination was defined as reducing the prevalence of registered leprosy cases to <1/10 000 population. globally, in 2019 the number of registered leprosy cases was 177 175 and the number of new cases reported was 202 185. this translates to a global prevalence of 0.22/10 000 population and a new case detection rate (ncdr) of 2.59/100 000 population. of the total number of new cases (202 185) reported in 2019, 68.9% (143 787) were reported by who’s south-east asia region, followed by 14.3% (29 936) from the region of the americas, 9.7% (20 205) from the african region and 2% (4211) from the eastern mediterranean region, with the western pacific region accounting for 1.9% (4004) of new cases.5 the leprosy elimination target was achieved at the global level in 20006 and at the national level in most countries by 2005. the western pacific region, which consists of 37 countries and areas, achieved the leprosy elimination target at the regional level before 1988. however, a few small pacific island countries have not reached this target. during the two decades since 2000, four 5-year global leprosy strategies were implemented that aimed at improving the availability and accessibility of leprosy services and ending leprosy worldwide. a world health organization regional office for the western pacific, manila, philippines. published: 23 august 2021 doi: 10.5365/wpsar.2021.12.3.858 background: leprosy elimination was achieved in the western pacific region of the world health organization (who) in the late 1980s. however, cases continue to be reported within the region. this paper analyses leprosy cases in the region reported to who during 1991–2019. methods: descriptive analyses were conducted of data from leprosy surveillance reported in the region. key indicators included prevalence, the number and rate of new cases detected, proportions of cases with multibacillary leprosy or grade 2 disability, and the numbers and proportions of cases among children and cases by sex. results: from 1991 to 2019, the number of registered cases detected in the region decreased by 94% (from 68 313 in 1991 to 4381 in 2019), and the number of new cases detected decreased by 72.1% (from 15 002 in 1991 to 4004 in 2019). the proportion of cases of multibacillary leprosy increased from 67.4% (8045/11 943) in 1995 to 85.6% (3428/4004) in 2019, and between 1997 and 2019 the number of leprosy cases occurring in children decreased from 1240 to 424. the proportion of new cases with grade 2 disability decreased from 15.4% in 1997 to 6.6% in 2019. with few exceptions, nearly two thirds of reported cases occurred in males. conclusion: most countries and areas in the region have successfully eliminated leprosy, although some pockets remain in countries with hard-to-reach areas. the introduction of multidrug therapy and who’s 1991 elimination goals may have prompted the initial decline in leprosy cases. continued efforts are required in case-finding, care and prevention in areas with a high burden of disease. epidemiological review of leprosy in who’s western pacific region: 1991–2019 kalpeshsinh rahevar,a fukushi morishita,a kyung hyun oha and tauhid islama correspondence to kalpeshsinh rahevar (email: rahevark@who.int) wpsar vol 12, no 3, 2021 | doi: 10.5365/wpsar.2021.12.3.858 https://ojs.wpro.who.int/2 rahevar et alepidemiological trend of leprosy in the western pacific region, 1991-2019 type, the number of children aged <15 years, and the number of cases with g2d. in 2019, 29 countries and areas reported, representing more than 99% of the total population of the region. we requested that national leprosy programmes in 36 countries and areas in the region (all except the pitcairn islands, which has an extremely small population) review and validate their historical data from 1991 to 2014, of which 14 (39%) complied. population data used for calculating prevalence and ncdrs were sourced from the united nations population division.8 analysis descriptive analyses of leprosy cases in the region and by country and area were conducted, with key programme indicators calculated for the period between 1991 and 2019. these indicators included prevalence and ncdrs, proportions of cases with mb leprosy and g2d, proportions of cases occurring in children and females, and the rate of new cases with g2d. annual ncdrs in the region were assessed for 1991–2019. the number and rate of new cases detected were compared for the countries with the highest number of leprosy cases. owing to issues with completeness of data, the annual ncdrs stratified by disease type were assessed for 1995–2019, for children and g2d for 1997–2019, and for sex for 2007–2019. ethics statement ethical clearance was not required because this report used routinely available data and no personal identifying information was collected. results prevalence the number of registered leprosy cases decreased by 94%, from 68 313 in 1991 to 4381 in 2019 (fig. 1). most of the decline occurred between 1991 and 2001, when registered cases dropped by almost 83%, from 68 313 in 1991 to 11 757 in 2001. in the following decade, the number of registered leprosy cases continued to decrease, with minor fluctuations. the lowest number of registered cases was in 2019 (4381) (fig. 1). the objective of this study was to analyse the data on leprosy reported to who from 1991 to 2019 by countries and areas in the western pacific region. methods definitions a case of leprosy is a person who has yet to complete a full course of treatment and who has one or more of the following: (1) a definite loss of sensation in a pale (hypopigmented) or reddish skin patch; (2) a thickened or enlarged peripheral nerve, with a loss of sensation or with weakness of the muscles supplied by that nerve, or both; or (3) acid-fast bacilli on a slit-skin smear.7 a pb case is defined as a person who has one to five skin lesions without demonstrated presence of acid-fast bacilli on a slit-skin smear. an mb case is defined as a person with leprosy who has more than five skin lesions or has nerve involvement (either pure neuritis or any number of skin lesions and neuritis) or who has the demonstrated presence of acid-fast bacilli on a slit-skin smear, irrespective of the number of skin lesions.1 the prevalence of leprosy was defined as the total number of leprosy cases registered for treatment in a given population at one point in time (usually the end of the reporting year) divided by the mid-year population and expressed as a rate per 10 000 population.6 the ncdr was defined as the number of new cases detected in a given population in a year, expressed as a rate per 100 000 population.6 grade 2 disability (g2d) was defined as the presence of visible deformity or damage to the hands or feet, or severe visual impairment caused by leprosy. the rate of g2d was defined as the number of new cases with g2d detected among the new cases of leprosy (never treated before) in a defined population in a year, expressed as a rate per 1 million population.6 data sources leprosy surveillance data reported annually from each country and area of the western pacific region to who were analysed.5,8 these data include the number of registered cases and new cases by sex and disease wpsar vol 12, no 3, 2021 | doi: 10.5365/wpsar.2021.12.3.858https://ojs.wpro.who.int/ 3 epidemiological trend of leprosy in the western pacific region, 1991-2019rahevar et al new case detection the number of new cases detected in the region declined by 73%, from 15 002 in 1991 to 4004 in 2019 (fig. 3). in the 6 years from 1991, there were annual fluctuations in the number of new cases and a cumulative decline of 9%. however, from 1997 to 2003, the number of new cases decreased by another 50%, which was followed by a slower decline until 2015; from 2016 to 2018, there was an average annual increase of 5%. between 2018 and 2019, there was about a 5% reduction in the number of new cases detected (189 fewer cases). similarly, the ncdr decreased by almost 80%, from 1.02/100 000 population in 1991 to 0.21/100 000 in 2019 (fig. 3). in 2019, the three countries with the highest number of new cases were the philippines (n = 2122), papua new guinea (n = 577) and china (n = 464) (fig. 4). these countries accounted for 79.0% of the total number of new cases (4004) in the region. similarly, the prevalence of leprosy in the region declined sharply from 1991 until 2000, from 0.47/10 000 population to 0.02/10 000 population, and it has remained relatively static since 2011, ranging from between 0.04/10 000 and 0.02/10 000 population (fig. 1). in 2019, the highest number of registered cases was reported in the philippines (n = 2122), followed by china (n = 748), papua new guinea (n = 457) and malaysia (n = 382) (fig. 2). thirteen countries accounted for almost 99% of the prevalent cases in the region (fig. 2). in 2019, the highest prevalence in a country or area was in the northern mariana islands (8.82/10 000), although this was higher than in previous years: from 2008 to 2018 the rate was consistently <1/10 000. other countries and areas with high prevalences in 2019 included the marshall islands (6.85/10 000), the federated states of micronesia (4.26/10 000) and kiribati (2.69/10 000); thus, all had prevalences above the elimination level of <1/10 000. fig. 1. number of registered cases and prevalence of leprosy in the who western pacific region, 1991–2019 0.47 0.07 0.04 0.02 0.00 0.05 0.10 0.15 0.20 0.25 0.30 0.35 0.40 0.45 0.50 0 10 000 20 000 30 000 40 000 50 000 60 000 70 000 80 000 1991 1995 2000 2005 2010 2015 2019 pr ev al en ce p er 1 0 00 0 po pu la ti on n um be r of r eg is te re d ca se s year registered cases prevalence wpsar vol 12, no 3, 2021 | doi: 10.5365/wpsar.2021.12.3.858 https://ojs.wpro.who.int/4 rahevar et alepidemiological trend of leprosy in the western pacific region, 1991-2019 fig. 2. countries and areas with the highest number of registered cases and prevalence of leprosy in the who western pacific region, 2019 fig. 3. number of new cases and new case detection rates of leprosy in the who western pacific region, 1991–2019 2122 748 457 382 128 127 96 58 49 45 42 37 32 4.26 8.82 6.85 2.69 0 1 2 3 4 5 6 7 8 9 10 0 500 1000 1500 2000 2500 p re va le n ce p er 1 0 00 0 p o p u la ti o n n um be r of r eg is te re d ca se s registered cases prevalence 15 002 13 608 4004 1.02 0.21 0.00 0.20 0.40 0.60 0.80 1.00 1.20 0 2 000 4 000 6 000 8 000 10 000 12 000 14 000 16 000 1991 1995 2000 2005 2010 2015 2019 n ew c as es d et ec te d pe r 10 0 00 0 po pu la ti on n um be r of n ew c as es year new cases new case detection rate wpsar vol 12, no 3, 2021 | doi: 10.5365/wpsar.2021.12.3.858https://ojs.wpro.who.int/ 5 epidemiological trend of leprosy in the western pacific region, 1991-2019rahevar et al fig. 4. countries and areas with the highest number of new cases and new case detection rates in the who western pacific region, 2019 in 2019 (fig. 7a). in 2007, the proportion of cases (68.3%) reflected a similar decrease to that reported by the philippines. the overall patterns observed largely reflected those of the three countries with the highest number of new cases (the philippines, china and papua new guinea). since 2002, the proportion of mb cases in the philippines has been more than 90% of all new cases detected, while the proportion in china increased from 69% in 1995 to 90.3% in 2019, and in papua new guinea the proportion increased from 52.4% to 80.4% during the same period (fig. 7a). in contrast, the three pacific island countries with the highest number of new cases reported lower proportions of mb cases. the proportion of mb cases in the federated states of micronesia and kiribati also increased during the study period, from 29.7% (25/84) and 25.4% (15/59), respectively, in 1995 to 47.9% (69/144) and 44.1% (60/136), respectively, in 2019 (fig. 7b). of the three countries with the highest number of new cases in 2019, the number of new cases in china and the philippines decreased during the study period by 86% (from 3400 in 1991 to 464 in 2019) and 70% (from 7169 in 1991 to 2122 in 2019), respectively, while in papua new guinea, the annual number of new cases was 519 in 1991 and 577 in 2019, with fluctuations ranging between 231 and 713. the number of new cases in the philippines increased during 2017–2019 (fig. 5). the number of new cases decreased between 2015 and 2019 in the three countries in the region that had the highest number of new cases in 2019 (the federated states of micronesia, kiribati and the marshall islands) (fig. 6). disease type the proportion of mb cases in the region increased from 67.4% (8045/11 943) in 1995 to 85.6% (3428/4004) 2122 577 464 195 144 136 92 60 57 38 31 15 12 12 125.2 114.3 57.4 120.0 0 20 40 60 80 100 120 140 0 500 1000 1500 2000 2500 n ew c as es d et ec te d p er 1 00 0 00 p o p u la ti o n n u m b er o f n ew c as es new cases new case detection rate wpsar vol 12, no 3, 2021 | doi: 10.5365/wpsar.2021.12.3.858 https://ojs.wpro.who.int/6 rahevar et alepidemiological trend of leprosy in the western pacific region, 1991-2019 fig. 5. number of new cases of leprosy in china, papua new guinea and the philippines by year, 1991–2019 fig. 6. number of new cases of leprosy in the federated states of micronesia, kiribati and the marshall islands, 2015–2019 0 1000 2000 3000 4000 5000 6000 7000 8000 1991 1995 2000 2005 2010 2015 2019 n um be r of n ew c as es year china papua new guinea philippines 0 50 100 150 200 250 300 350 199 164 169 141 127 144 180 218 187 173 136 56 80 53 59 31 0 50 100 150 200 250 2015 2016 2017 2018 2019 n um be r of n ew c as es year micronesia (federated states of) kiribati marshall islands 0 1000 2000 3000 4000 5000 6000 7000 8000 1991 1995 2000 2005 2010 2015 2019 n um be r of n ew c as es year china papua new guinea philippines 0 50 100 150 200 250 300 350 199 164 169 141 127 144 180 218 187 173 136 56 80 53 59 31 0 50 100 150 200 250 2015 2016 2017 2018 2019 n um be r of n ew c as es year micronesia (federated states of) kiribati marshall islands wpsar vol 12, no 3, 2021 | doi: 10.5365/wpsar.2021.12.3.858https://ojs.wpro.who.int/ 7 epidemiological trend of leprosy in the western pacific region, 1991-2019rahevar et al fig. 7. (a) proportion of new cases of multibacillary leprosy in the who western pacific region overall and the three countries with the highest number of new cases in the region and (b) in the pacific islands, 1995–2019 leprosy cases in children was lowest in 2007 (5.8%; 327/5683) and highest in 2017 (12%; 498/4140). in the philippines, the proportion of new cases occurring in children declined from 8.0% in 1997 to leprosy among children the number of new leprosy cases among children in the region decreased by 65%, from 1240 cases in 1997 to 424 cases in 2019 (fig. 8a). the proportion of new 67.4 85.6 0 10 20 30 40 50 60 70 80 90 100 1995 2000 2005 2010 2015 2019 pr op or ti on o f c as es w it h m ul ti ba ci lla ry le pr os y year western pacific region china papua new guinea philippines 47.9 44.1 45.2 0 10 20 30 40 50 60 70 80 90 1995 2000 2005 2010 2015 2019 pr op or ti on o f c as es w it h m ul ti ba ci lla ry le pr os y year micronesia (federated states of) kiribati marshall islands 67.4 85.6 0 10 20 30 40 50 60 70 80 90 100 1995 2000 2005 2010 2015 2019 pr op or ti on o f c as es w it h m ul ti ba ci lla ry le pr os y year western pacific region china papua new guinea philippines 47.9 44.1 45.2 0 10 20 30 40 50 60 70 80 90 1995 2000 2005 2010 2015 2019 pr op or ti on o f c as es w it h m ul ti ba ci lla ry le pr os y year micronesia (federated states of) kiribati marshall islands (a) the numbers on the graph represent the overall proportion of new cases in the region at the beginning and end of the study period. (a) (b) wpsar vol 12, no 3, 2021 | doi: 10.5365/wpsar.2021.12.3.858 https://ojs.wpro.who.int/8 rahevar et alepidemiological trend of leprosy in the western pacific region, 1991-2019 consistently accounted for more than one third of new cases. in 2019, the proportion of new cases occurring among children was 31.9% in the federated states of micronesia, 27.2% in kiribati, 31.2% in papua new guinea and 67.7% in the marshall islands (fig. 8b). 4.7% in 2019, and in china the proportion of new cases in children decreased from 3.4% to 1.3% (fig. 8a). in the pacific island countries of the federated states of micronesia, kiribati, the marshall islands and papua new guinea, the proportion of new cases in children fig. 8. proportion of new leprosy cases occurring among children in countries in the who western pacific region with the highest number of new cases, by year, (a) 1997–2019 and (b) 2019 1.3 27.2 67.7 31.9 31.2 4.7 10.6 0 10 20 30 40 50 60 70 80 china kiriba� marshall islands micronesia (federated states of) papua new guinea philippines western pacific region % o f n ew c as es a m on g ch ild re n 0 10 20 30 40 50 60 70 80 19 97 19 98 19 99 20 00 20 01 20 02 20 03 20 04 20 05 20 06 20 07 20 08 20 09 20 10 20 11 20 12 20 13 20 14 20 15 20 16 20 17 20 18 20 19 % o f n ew c as es a m on g ch ild re n year china kiriba� marshall islands micronesia (federated states of) papua new guinea philippines 1.3 27.2 67.7 31.9 31.2 4.7 10.6 0 10 20 30 40 50 60 70 80 china kiriba� marshall islands micronesia (federated states of) papua new guinea philippines western pacific region % o f n ew c as es a m on g ch ild re n 0 10 20 30 40 50 60 70 80 19 97 19 98 19 99 20 00 20 01 20 02 20 03 20 04 20 05 20 06 20 07 20 08 20 09 20 10 20 11 20 12 20 13 20 14 20 15 20 16 20 17 20 18 20 19 % o f n ew c as es a m on g ch ild re n year china kiriba� marshall islands micronesia (federated states of) papua new guinea philippines (a) (b) wpsar vol 12, no 3, 2021 | doi: 10.5365/wpsar.2021.12.3.858https://ojs.wpro.who.int/ 9 epidemiological trend of leprosy in the western pacific region, 1991-2019rahevar et al leprosy and among females increased during the study period, whereas the rate of g2d and proportion of cases with g2d declined. the substantial reduction in prevalence and ncdrs of leprosy in the region demonstrates the success of the regional and national responses to leprosy, particularly during the 1990s. in the second half of the 20th century, leprosy was considered a major public health problem, and in a 1975 survey who estimated that there were about 10 million leprosy cases globally and approximately 2 million of those were in the western pacific region.9 in 1981, who recommended using mdt for leprosy, comprising a three-drug regimen for mb cases and a two-drug regimen for pb cases.2 the region adopted mdt by the mid-1980s and completed population coverage by 1994.3 this introduction of effective chemotherapy was likely the main driver of the decrease in leprosy cases in the region and why the region achieved the leprosy elimination target by 1988. given that socioeconomic development and increased health care coverage are also linked with lower leprosy risk,10 these factors may also have contributed to the decrease of cases in the region. the 1991 world health assembly resolution aimed at eliminating leprosy by the year 20006 also may have contributed to global campaigns to reduce the incidence of leprosy, as evidenced by the large decrease in new cases in the years directly after the resolution. this decrease did not occur at the same rate after 2000. this suggests that the final efforts targeting disease elimination are harder to maintain than the initial efforts and that disease elimination requires sustained commitment. the global leprosy strategy 2016–2020 reflects these changes in elimination status, as earlier strategies focused on eliminating leprosy as a public health problem, whereas later strategies emphasized further reducing the burden in areas where elimination had not been achieved.6 although the leprosy elimination target was achieved regionally in the 1990s, some countries and areas have not reached the target at the national or subnational level. elimination at the subnational level can be difficult after national-level elimination is achieved. mobilizing human and financial resources, including national and international partners, to support the implementation of essential activities at the subnational level can be difficult. finding a way to leprosy among females in 2019, the male:female ratio of new leprosy cases in the region was 2:1. in 2007, the proportion of new cases that were female was 26.8% (1570/5863), which gradually increased to 33.0% (1321/4004) by 2019 (fig. 9a). between 2007 and 2019, the proportion of new cases among females in the federated states of micronesia and the philippines increased from 20.6% to 43.8% and from 20.0% to 41.8%, respectively. kiribati has consistently reported that half of its new cases occur in females, whereas in the marshall islands the proportion of females has fluctuated and in 2019 was 54.8% (fig. 9b). grade 2 disability the g2d rate in the region declined from 1.37/1 million population in 1997 to 0.14/1 million population in 2019 (fig. 10a). the proportion of g2d occurring among new cases also dropped, from 15.2% (890/5863) in 1997 to 6.6% (264/4004) in 2019, with some minor fluctuations in between (fig. 10a). in 1999, the region achieved the global g2d target of <1 case/1 million population. in 2019, the number of new cases with g2d was 264, and the rate was 0.14/1 million. however, in 2019 seven countries and areas in the region (the federated states of micronesia, fiji, french polynesia, guam, kiribati, lao people’s democratic republic and papua new guinea) had g2d rates higher than the global target (fig. 10b). there was no reporting of g2d among children before 2016; however, 14 children were reported to have g2d in 2019. discussion our analyses provide an overview of the leprosy surveillance data reported to who from the western pacific region during nearly three decades. during this time, the prevalence and ncdrs declined regionally, while several countries and areas continued to report high rates and numbers of new cases every year, including cases in children. the proportions of cases of mb wpsar vol 12, no 3, 2021 | doi: 10.5365/wpsar.2021.12.3.858 https://ojs.wpro.who.int/10 rahevar et alepidemiological trend of leprosy in the western pacific region, 1991-2019 fig. 9. (a) proportion of new leprosy cases by year and sex in the who western pacific region and (b) the proportion of new cases occurring in females in the countries with the highest number of new cases, 2007–2019 26.8 32.3 26.3 34.2 33.0 0 10 20 30 40 50 60 70 80 90 100 2 0 0 7 2 0 0 9 2 0 1 1 2 0 1 3 2 0 1 5 2 0 1 7 2 0 1 9 % o f n ew c as es year female male 0 10 20 30 40 50 60 2007 2009 2011 2013 2015 2017 2019 % o f n ew c as es in fe m al es year china kiriba� marshall islands micronesia (federated states of) papua new guinea philippines western pacific region 26.8 32.3 26.3 34.2 33.0 0 10 20 30 40 50 60 70 80 90 100 2 0 0 7 2 0 0 9 2 0 1 1 2 0 1 3 2 0 1 5 2 0 1 7 2 0 1 9 % o f n ew c as es year female male 0 10 20 30 40 50 60 2007 2009 2011 2013 2015 2017 2019 % o f n ew c as es in fe m al es year china kiriba� marshall islands micronesia (federated states of) papua new guinea philippines western pacific region (a) (b) wpsar vol 12, no 3, 2021 | doi: 10.5365/wpsar.2021.12.3.858https://ojs.wpro.who.int/ 11 epidemiological trend of leprosy in the western pacific region, 1991-2019rahevar et al fig. 10. (a) proportion and rate of new leprosy cases with grade 2 disability (g2d), by year, 1997–2019, and (b) the rate of grade 2 disability among new cases in selected countries, 2019 15.2 6.6 1.37 0.14 0 0.2 0.4 0.6 0.8 1 1.2 1.4 1.6 0 2 4 6 8 10 12 14 16 1997 2000 2005 2010 2015 2019 g 2d / 1 m ill io n p o p u la ti o n % o f n ew c as es w it h g 2d year % with g2d rate of g2d 25.21 8.70 7.14 6.70 5.95 5.48 2.20 0.00 5.00 10.00 15.00 20.00 25.00 30.00 kiribati micronesia (federated states of) french polynesia fiji guam papua new guinea lao people's democratic republic % of new cases with g2d (a) (b) wpsar vol 12, no 3, 2021 | doi: 10.5365/wpsar.2021.12.3.858 https://ojs.wpro.who.int/12 rahevar et alepidemiological trend of leprosy in the western pacific region, 1991-2019 are pb, and eliciting sensory loss in children is challenging. it is not understood why there is a higher proportion of males with leprosy in most countries, but it could be due to differences in physiology, risk of exposure and access to health care. this last factor may play a part, considering that the proportion of female cases increases remarkably during active case-finding activities.7 although the overall proportion of g2d among new cases decreased in the region during the study period, some countries still have many cases of g2d. there is limited information about rehabilitation services for these cases. the visible impairment that results from leprosy causes stigma and discrimination, as shown by a study conducted in cebu, the philippines. the study sought to quantify the impact of the diagnosis of leprosy and of visible impairment on the activities and attitudes of people affected by leprosy. a severe visible impairment was a risk factor for activity limitation and a low level of self-efficacy.12 careful assessment of all new cases of leprosy for g2d is required because a failure to conduct these assessments may result in a missed diagnosis of g2d. delayed presentation is a recognized risk factor for disability in leprosy, and it is the result of complex interactions between physical, social, economic and psychological factors.13 therefore, it is important that countries not only continue active case-finding to diagnose and treat cases early but also assess for g2d in all new cases. this analysis has several limitations. the number of countries and areas reporting data each year differed, with earlier data not available from many countries and areas. therefore, the regional-level results require careful interpretation because they were largely influenced by the countries that reported high caseloads. however, this analysis provides useful insights into the regional situation, based on data reported from most of the countries in the region across nearly three decades. in conclusion, progress in leprosy control has been possible due to the widespread and free availability of robust mdt, the implementation of good strategies for diagnosis and treatment, strong collaboration with major partners and political commitment from countries where leprosy is endemic. however, leprosy cases occurring among children continue to be reported in the region, sustain the political commitment and financing during the post-elimination stage is critical to achieving the vision of a world free of leprosy. we observed recent fluctuations in the number of new leprosy cases in some countries. this could be explained by ad hoc case-finding efforts in these countries, which largely rely on external funds and other resources, such as mass integrated screening in ebaye and majuro in the marshall islands and active case-finding in kiribati undertaken during 2017–2018. a small population can also contribute to fluctuating rates of new cases. the decrease in the overall number of new cases seen during the past 5 years in the pacific island countries might be due to programmes continuing routine case-finding and contact tracing and maintaining high treatment completion rates for leprosy cases. the global decline in the incidence of leprosy may have resulted in a corresponding reduction in awareness of the disease among health workers and in the community. this may translate into delays in diagnosis and treatment and an increase in progression to g2d. maintaining general awareness about leprosy, sustaining skills among health care workers through basic training and ensuring that there are proper referral mechanisms are essential in areas that continue to report cases. other possible reasons for the increased proportion of mb cases include ageing populations, as mb disease is more likely to occur in older age groups, undetected mb cases accumulating over the years and being diagnosed during mass screening efforts, shifting from active to passive case detection and using a broader case definition of mb leprosy.11 in high-burden pacific island countries, cases may be detected earlier due to ongoing high transmission, which could explain the relatively low proportion of mb disease. the decrease in the proportion of cases in children, especially in large countries, suggests that transmission is decreasing among the general population; however, case-finding efforts need to be considered. in highburden pacific island countries and papua new guinea, the high proportion of cases occurring in children may suggest there is continuing transmission or that active case-finding efforts are targeted at schoolchildren.11 the possibility of an incorrect diagnosis due to the similarity of leprosy with many childhood skin conditions should also be considered, as the majority of cases in children wpsar vol 12, no 3, 2021 | doi: 10.5365/wpsar.2021.12.3.858https://ojs.wpro.who.int/ 13 epidemiological trend of leprosy in the western pacific region, 1991-2019rahevar et al 5. global leprosy (hansen disease) update, 2019: time to step-up prevention initiatives. wkly epidemiol rec. 2020;95(36):417– 40. 6. global leprosy strategy 2016–2020: accelerating towards a leprosy-free world. new delhi: world health organization, regional office for south-east asia; 2016. available from: https://apps.who. int/iris/handle/10665/208824, accessed 22 april 2021. 7. global leprosy strategy 2016–2020: accelerating towards a leprosy-free world. monitoring and evaluation guide. new delhi: world health organization, regional office for south-east asia; 2017. available from: https://apps.who.int/iris/handle/10665/254907, accessed 22 april 2021. 8. epidemiological review of leprosy in the western pacific region: 1983–2018. manila: world health organization, regional office for the western pacific; 2021. available from: https://apps.who.int/ iris/handle/10665/339782, accessed 22 april 2021. 9. sansarricq h. leprosy in the world today. lepr rev. 1981;52 (suppl. 1):15–31. doi:10.5935/0305-7518.19810053 pmid:7040876 10. pescarini jm, strina a, nery js, skalinski lm, andrade kvf, penna mlf et al. socioeconomic risk markers of leprosy in high-burden countries: a systematic review and meta-analysis. plos negl trop dis. 2018;12(7):e0006622. doi:10.1371/journal.pntd.0006622 pmid:29985930 11. india: disability, mb and child proportion – epidemiological significance and interpretation. new delhi: national leprosy eradication programme; 2008. available from: https://www.medbox. org/document/india-disability-mb-and-child-proportion-epidemiological-significance-and-interpretation#go, accessed 22 april 2021. 12. boku n, lockwood dn, balagon mv, pardillo fe, maghanoy aa, mallari ib et al. impacts of the diagnosis of leprosy and of visible impairments amongst people affected by leprosy in cebu, the philippines. lepr rev. 2010;81(2):111–20. doi:10.47276/lr.81.2.111 pmid:20825115 13. muthuvel t, govindarajulu s, isaakidis p, shewade hd, rokade v, singh r et al. “i wasted 3 years, thinking it’s not a problem”: patient and health system delays in diagnosis of leprosy in india: a mixed-methods study. plos negl trop dis. 2017;11(1):e0005192. doi:10.1371/journal.pntd.0005192 pmid:28081131 and there are many areas of endemicity at subnational levels. persons diagnosed with leprosy and their family members continue to face stigma and discrimination, which may act as barriers to early case detection and treatment, limit their opportunities in life and lead to social and economic exclusion. strong collaboration to ensure universal health coverage using the principles of integrated service delivery and a patient-centred approach will be the keys to ending leprosy. it is essential that strong partnerships are built to address the remaining challenges in diagnosing and treating leprosy. a few countries with relatively higher burdens require more aggressive steps and enhanced commitment and resources to eliminate leprosy. references 1. guidelines for the diagnosis, treatment and prevention of leprosy. new delhi: world health organization, regional office for southeast asia; 2018. available from: https://apps.who.int/iris/handle/10665/274127, accessed 22 april 2021. 2. chemotherapy of leprosy for control programmes: report of a who study group [meeting held in geneva from 12 to 16 october 1981]. geneva: world health organization; 1982 (who technical report series no. 675); available from: https://apps.who.int/iris/handle/10665/38984, accessed 22 april 2021. 3. overview and epidemiological review of leprosy in the who western pacific region 1991–2001. manila: world health organization, regional office for the western pacific; 2003. available from: https://apps.who.int/iris/handle/10665/206979, accessed 22 april 2021. 4. resolution wha 44.9. elimination of leprosy. in: forty-fourth world health assembly, geneva, may 1991. geneva: world health organization; 1991. available from: https://www.who.int/neglected_diseases/mediacentre/wha_44.9_eng.pdf, accessed 22 april 2021. https://ojs.wpro.who.int/ 1wpsar vol 13, no 4, 2022 | doi: 10.5365/wpsar.2022.13.4.941 covid-19: original research t he coronavirus disease 2019 (covid-19) pandemic, caused by infection with severe acute respiratory syndrome coronavirus 2 (sars-cov-2), continues, bringing significant morbidity and mortality. as of 15 september 2022, there were more than 607 million confirmed cases and nearly 6.5 million deaths worldwide.1 since the pandemic began, there has been a rapid increase in understanding of the disease and its management, with swift development and approval of vaccines and therapeutics. in brunei darussalam, the first wave of the covid-19 pandemic started on 9 march 2020 with the detection of the first case, a patient who had attended a religious gathering in a neighbouring country. the last community case was detected on 6 may 2020, with a total of 141 cases reported at that point. only imported cases were detected until the second wave started on 7 august 2021, during which the predominant sars-cov-2 strain was confirmed to be delta (b.1.617.2).2 the third wave, caused by the more infectious omicron strain, started on 5 february 2022.3 covid-19 is predominantly a respiratory illness. common symptoms include fever, cough, fatigue, body aches, sore throat, anosmia and ageusia/dysgeusia.4 severe symptoms include shortness of breath and chest pain. symptoms may appear 2–14 days after exposure and usually last 5–7 days, but they can be prolonged, resulting in more severe illness. clinically, covid-19 ranges from an asymptomatic presentation to severe pneumonia requiring ventilatory support and causing death. nonrespiratory symptoms may also occur, including cardiovascular, gastrointestinal, neurological and cutaneous symptoms.5 in earlier reports from china, anosmia and ageusia were not recognized as typical covid-19 symptoms, but they are currently acknowledged as distinctive symptoms.6–8 differences in symptoms and a national isolation centre, ministry of health, tutong, brunei darussalam. b department of medicine, raja isteri pengiran anak saleha hospital, bandar seri begawan, brunei darussalam. c pengiran anak puteri rashidah sa’adatul bolkiah institute of health sciences, universiti brunei darussalam, bandar seri begawan, brunei darussalam. published: 7 november 2022 doi: 10.5365/wpsar.2022.13.4.941 objective: this retrospective, cross-sectional, observational study assessed the duration of coronavirus disease 2019 (covid-19) symptoms during the second wave in brunei darussalam. methods: data from covid-19 cases admitted to the national isolation centre during 7–30 august 2021 were included in the study. symptom onset and daily symptom assessments were entered into a database during hospitalization and disease was categorized by severity. the time between symptom onset and hospital admission, the duration of symptoms and length of hospitalization were assessed separately by age group, disease severity and vaccination status using one-way analysis of variance with bonferroni post hoc corrections. results: data from 548 cases were included in the study: 55.7% (305) of cases were male, and cases had a mean age of 33.7 years. overall, 81.3% (446) reported symptoms at admission (mean number of symptoms and standard deviation: 2.8 ± 1.6), with cough (59.1%; 324), fever (38.9%; 213) and sore throat (18.4%; 101) being the most common. being older, having more severe disease and being unvaccinated were significantly associated with the time between symptom onset and hospital admission, symptom duration and length of hospitalization. discussion: knowing which factors predict the duration of covid-19 symptoms can help in planning management strategies, such as the duration of isolation, predict the length of hospitalization and treatment, and provide more accurate counselling to patients regarding their illness. covid-19 symptom duration: associations with age, severity and vaccination status in brunei darussalam, 2021 shi ying tan,a,b shyh poh teo,b muhd syafiq abdullah,a-c pui lin chong,a,b rosmonaliza asli,a,b babu ivan mani,a natalie riamiza momin,a,b adrian chin ann lim,a noor affizan rahman,a chee fui chonga and vui heng chonga,b,c correspondence to shyh poh teo (email: shyhpoh.teo@moh.gov.bn) wpsar vol 13, no 4, 2022 | doi: 10.5365/wpsar.2022.13.4.941 https://ojs.wpro.who.int/2 tan et alduration of symptoms and illness for delta variant covid-19 without other organ failure. category 2 is divided into two subcategories: c2a – milder symptoms (i.e. cough, nausea, vomiting, rhinorrhoea, anosmia or dysosmia, ageusia or dysgeusia, diarrhoea <2 times in 24 hours, myalgia and lethargy); and c2b – worsening c2a symptoms (i.e. new onset fever, fever persistence >2 days, chest pain, dyspnoea, unable to ambulate independently, reduced oral intake and reduced urine output). these categories were introduced and implemented on 13 august 2021.9 symptom categories cases were categorized based on their reported symptoms at admission: asymptomatic (no symptoms), presymptomatic (asymptomatic at admission but subsequently developed symptoms during hospitalization; these cases were reassigned at hospital discharge), recovered (symptoms had resolved by admission) and symptomatic (symptomatic at admission). data collection details of cases and the relevant investigations were collected and prospectively entered into a database. this database was used to track patients’ movements between the nic, community isolation centres and home; track clinical progress; assist in the overall management of covid-19 cases; and report daily to the ministry of health. data collected included age, sex, vaccination status, symptoms reported, disease severity, and prevalence and duration of oxygen use. symptom duration was calculated based on the reported date of symptom onset, with symptom resolution considered to be the first day the case achieved disease category c1. vaccination status the brunei darussalam national vaccination programme for covid-19 was implemented in phases beginning 3 april 2021; the first to be vaccinated were frontline staff and older people, followed by people with comorbidities.10 the covid-19 vaccines used were bbibp-corv (sinopharm), comirnaty (pfizer–biontech), spikevax (moderna) and vaxzevria (oxford–astrazeneca). vaccination status was categorized as complete (received two doses), partial (received one dose), unvaccinated and ineligible (age <18 years or had any contraindication based on recommendations at the time, such as receiving their duration may be due to viral variants, underlying comorbidities or race, or a combination of these. while the symptoms of covid-19 are well known, the duration of symptoms is less well studied. this study aimed to assess the duration of symptoms of covid-19 by age, disease severity and vaccination status in brunei darussalam during the start of the second wave of the pandemic. methods study design and population this was a retrospective, cross-sectional, observational study conducted using data from cases diagnosed with sars-cov-2 infection by reverse transcription–polymerase chain reaction (rt-pcr) who were admitted to the national isolation centre (nic) in brunei darussalam, between 7 august 2021 (the start of the second wave) and 30 august 2021. individuals with incomplete records were excluded from the study. setting and management in brunei darussalam, all cases diagnosed with covid-19 were admitted to the nic for isolation and treatment. this arrangement continued until the second week of the second wave (18 august 2021), when community isolation centres were opened to cope with the increasing number of cases. during admission to the nic, patients provided a detailed history of symptoms and underwent clinical examination and relevant investigations, such as laboratory testing and chest imaging. during hospitalization, cases had their symptoms assessed and documented daily. cases underwent an rt-pcr test on day 8 to determine if they could be discharged, and they were considered recovered if this test was negative. if the day 8 test was positive, rt-pcr was repeated at 48-hour intervals. a case was considered recovered if the day 10 or subsequent test was negative or a cycle threshold value >30.0 was obtained. disease severity categories cases were categorized based on disease severity as follows: category 1 (c1) – asymptomatic; c2 – symptomatic but without pneumonia (clinical or radiological); c3 – pneumonia; c4 – needing oxygen therapy; and c5 – needing intubation and ventilatory support, with or wpsar vol 13, no 4, 2022 | doi: 10.5365/wpsar.2022.13.4.941https://ojs.wpro.who.int/ 3 duration of symptoms and illness for delta variant covid-19tan et al symptoms reported by disease category (given with the standard deviation [sd]) as classified during hospitalization: c2 = 2.8 ± 1.6; c3 = 2.8 ± 1.6; c4 = 3.1 ± 1.6; and c5 = 3.0 ± 0.9 (p = 0.065 by anova). the mean (sd) number of days between symptom onset and admission was 4.9 (± 3.4). the mean (sd) symptom duration was 10.4 (± 5.1) days. the mean (sd) length of hospitalization was 10.8 (± 4.3) days. there was a positive correlation between age and symptom duration, with a predicted increase in symptom duration of 0.1 day for each additional year increase in age (y = 6.94 + 0.1x) (fig. 1). each of these categories was also significantly different by age group (p = 0.034 for symptom onset to admission, p < 0.001 for symptom duration, p = 0.004 for length of hospitalization; table 3). when comparing each of these by age group, for time of symptom onset to admission, the youngest age group (≤12 years) had a significantly shorter interval compared with those in the 50–59 year group. there were no differences in this category between any of the other age groups. symptom duration was significantly shorter for each of the three youngest age groups (≤12, 13–19 and 20–29 years) when compared with each of the two oldest age groups (50–59 and ≥60 years). length of hospitalization was significantly shorter in adolescents (13–19 years) compared with those in the 40–49 year group, with all other comparisons being nonsignificant (table 3). there was a statistically significant difference between each of these categories and the disease category (p < 0.001 each for time from symptom onset to admission, symptom duration and length of hospitalization). when comparing each of these categories with the disease category groups, c2 cases had a significantly shorter interval from symptom onset to admission when compared with c3 cases; symptom duration was significantly shorter in c2 cases when compared with c3 and c4 cases; and length of hospitalization was significantly shorter for the less severe category for most comparisons between c1, c2, c3 and c4 cases (table 3). altogether, 6.0% (33) of cases were categorized as c4 at admission and 11.5% (63) were assessed as c4 at any time during their hospitalization. for the 63 cases assessed as c4 at any time during their illness, the mean chemotherapy or on immunosuppressive medications). a vaccine dose was considered complete if the case had received it at least 14 days prior to covid-19 infection. at the time of the study, covid-19 vaccine booster doses (third doses) had not yet been introduced. statistical analysis anonymized data were entered into the database and analysed using ibm spss version 26.0 (ibm, new york, united states of america). descriptive statistics were used to describe case characteristics. age was divided into several categories: ≤12 years (children), 13–19 years, 20–29 years, 30–39 years, 40–49 years, 50–59 years and ≥60 years. one-way analysis of variance (anova) testing was used to assess the time between symptom onset and hospital admission, symptom duration and length of hospitalization separately by age group, disease severity and vaccination status. this provided p values for trends. post hoc bonferroni analysis was used to assess the differences between the age groups, again providing p values for each comparison. a scatterplot was used to assess correlations between age and symptom duration. two-sided tests were used and p < 0.05 was considered statistically significant. results of the 751 covid-19 cases admitted to the nic during the study period, 548 (73%) were included in the analysis and 203 cases were excluded. reasons for exclusion were being admitted prior to use of the disease severity score (163 cases), death (20) and incomplete data (20). the mean age of covid-19 cases included in the analysis was 33.7 years; there was a higher proportion of males (55.7%; 305). the most common comorbidities were hypertension (18.1%; 99), dyslipidaemia (10.4%; 57) and diabetes mellitus (9.5%; 52). most cases were either unvaccinated (59.1%; 324) or ineligible for vaccination because of age (20.8%; 114), with only 13.0% (71) having had at least one dose of vaccine (table 1). symptoms were reported at admission by 81.3% (446) of cases, with the most common being cough (59.1%; 324), fever (38.9%; 213) and sore throat (18.4%; 101) (table 2). among these symptomatic cases, the mean number of symptoms reported on admission was 2.8. there was no significant difference in the number of wpsar vol 13, no 4, 2022 | doi: 10.5365/wpsar.2022.13.4.941 https://ojs.wpro.who.int/4 tan et alduration of symptoms and illness for delta variant covid-19 symptoms compared with older cases; cases with less severe disease (c1 and c2) had a shorter duration of symptoms than those with more severe disease (c3 and c4); and those who were fully vaccinated had a shorter duration of symptoms than those who were unvaccinated. knowing about symptoms, including their likely duration, can help in planning management strategies, such as the duration of isolation or quarantine, predicting the length of hospitalization and treatment, as well as providing better and more accurate counselling to (sd) interval from symptom onset to admission was 4.6 (± 3.9) days, and the mean (sd) interval from admission to needing oxygen therapy was 2.1 (± 2.5) days. for all cases, the mean (sd) interval from symptom onset to needing oxygen was 6.8 (± 3.9) days. for all cases, the mean (sd) duration of oxygen therapy was 6.4 (± 5.4) days. cases who had received two doses of covid-19 vaccine had a significantly shorter symptom duration than cases who had received one dose of vaccine or were unvaccinated. those ineligible for vaccination had a significantly shorter symptom duration compared with unvaccinated cases (table 4). discussion this study showed that the duration of covid-19 symptoms was associated in separate analyses with being older, having more severe disease and being unvaccinated. younger cases had a shorter duration of table 1. characteristics of 548 covid-19 cases admitted to the national isolation centre, 7–30 august 2021, brunei darussalam table 2. reported symptoms in 548 covid-19 cases admitted to the national isolation centre, 7–30 august 2021, brunei darussalam characteristic no. (%) age group (years) ≤12 64 (11.7) 13–19 55 (10.0) 20–29 118 (21.5) 30–39 101 (18.4) 40–49 111 (20.3) 50–59 59 (10.8) ≥60 40 (7.3) sex male 305 (55.7) female 243 (44.3) comorbidities diabetes mellitus 52 (9.5) dyslipidaemia 57 (10.4) hypertension 99 (18.1) vaccination status ineligible 114 (20.8) unvaccinated 324 (59.1) partial (1 dose) 71 (13.0) complete (2 doses) 39 (7.1) symptom no. (%) symptoms reported at admission 446 (81.3) cough 324 (59.1) fever 213 (38.9) sore throat 101 (18.4) rhinorrhoea 97 (17.7) anosmia 86 (15.7) dyspnoea 74 (13.5) ageusia or dysgeusia 70 (12.8) loose stool or diarrhoea 54 (9.9) myalgia 48 (8.8) headache 41 (7.5) nausea or vomiting 19 (3.5) symptom category asymptomatic 73 (13.3) recovered 40 (7.3) presymptomatic 29 (5.3) symptomatic 406 (74.1) disease category at admission c1 187 (34.1) c2 315 (57.5) c3 13 (2.4) c4 33 (6.0) c5 0 most severe disease category during hospitalization c1 113 (20.6) c2 267 (48.7) c3 95 (17.3) c4 63 (11.5) c5 10 (1.8) c1: asymptomatic; c2: symptomatic but without pneumonia (clinical or radiological); c3: pneumonia; c4: needing oxygen therapy; c5: needing intubation and ventilatory support with or without other organ failure. wpsar vol 13, no 4, 2022 | doi: 10.5365/wpsar.2022.13.4.941https://ojs.wpro.who.int/ 5 duration of symptoms and illness for delta variant covid-19tan et al fig. 1. scatterplot of age and duration of covid-19 symptoms for 548 cases admitted to the national isolation centre, 7–30 august 2021, brunei darussalam during the first 2 weeks of symptoms.15,16 knowledge of symptom duration may be useful as a proxy measure for infectivity in patients, removing the need for laboratory testing. this is important for advising patients about the required period of isolation or quarantine, and it also applies to asymptomatic cases, as studies have shown no differences in clinical features and virological course in cases with asymptomatic or symptomatic non-severe covid-19.17 apart from the correlation with age, this study also showed that symptom duration was associated with disease severity. cases in the c2 symptomatic category had a mean (sd) duration of symptoms of 8.7 (± 3.9) days. this was significantly shorter than in those who had pneumonia on imaging (c3: 11.4 ± 4.8 days) and those needing oxygen therapy (c4: 16.1 ± 5.1 days). this is expected: the more severe the illness, the longer it would take to recover. to date, no studies have assessed symptom duration based on the severity of disease. viral shedding has been shown to correlate with symptom duration and severity of illness.18 this study also showed that vaccination status was associated with symptom duration: fully vaccinated cases had a significantly shorter duration of symptoms than unvaccinated and partially vaccinated cases. vaccination reduces the risk of covid-19,19–22 as well as the durapatients regarding covid-19, depending on the severity of their disease at the time of presentation. this information may also encourage cases to present in a timely manner if their illness does not improve as expected, particularly those who have not been admitted or are isolating at home. the mean (sd) duration of symptoms of covid-19 in this study was 10.4 (± 5.1) days, with the duration of symptoms increasing approximately linearly with age. symptom duration was associated with age group, with younger cases having shorter duration. generally, symptomatic children have mild disease and a short duration of illness,11,12 with one study from the united kingdom of great britain and northern ireland reporting that the median duration of illness was shorter for younger children (duration: 5 days, interquartile range [iqr] = 2–9) compared with older children (duration: 7 days, iqr = 3–12).12 a study from italy reported that 4.4% of children had prolonged illness lasting up to 28 days, and this was more common in older children (5.1%) than in younger children (3.1%) (p = 0.046).13 a study from the united states of america reported that at least one in five young, healthy adults aged 18–34 years had unresolved symptoms up to 3 weeks after diagnosis.14 symptom duration has also been correlated with the duration of viral shedding and infectivity, especially r2 linear = 0.066 wpsar vol 13, no 4, 2022 | doi: 10.5365/wpsar.2022.13.4.941 https://ojs.wpro.who.int/6 tan et alduration of symptoms and illness for delta variant covid-19 showed that cases who had received a two-dose vaccination regimen had shorter duration of symptoms compared with unvaccinated and partially vaccinated cases. among cases who required oxygen therapy (c4), the requirement for oxygen occurred a mean (sd) of 6.8 (± 3.9) days after symptom onset. the mean (sd) duration of oxygen therapy was 6.4 (± 5.4) days, similar to cases in ethiopia (6.0 days),26 but shorter than patients in germany (8.0 days).27 this may be due to the relatively tion and severity of illness.23 in the united kingdom, vaccinated cases were more likely to be asymptomatic, had fewer symptomatic days and less severe illness, and had lower hospitalization rates, with the analysis including patients aged ≥60 years.24 the impact of vaccination on symptom duration should reinforce the drive to vaccinate as many people as possible during the current pandemic. while the first vaccine dose provides some protection, completing the two-dose primary vaccination series provides better protection against infection.25 this study table 3. time from symptom onset to admission, and duration of symptoms and hospitalization, by age group and disease category for 548 covid-19 cases admitted to the national isolation centre, 7–30 august 2021, brunei darussalam values are mean ± sd. c1: asymptomatic; c2: symptomatic but without pneumonia (clinical or radiological); c3: pneumonia; c4: needing oxygen therapy; c5: needing intubation and ventilatory support with or without other organ failure; na: not applicable; sd: standard deviation. a significant compared with 50–59 year age group (p = 0.045). b significant compared with 50–59 year age group (p = 0.002) and ≥60 year age group (p = 0.002). c significant compared with 50–59 year age group (p = 0.019) and ≥60 year age group (p = 0.022). d significant compared with 50–59 year age group (p = 0.004) and ≥60 year age group (p = 0.012). e significant compared with 40–49 year age group (p = 0.019) and ≥60 year age group (p = 0.006). f comparison between c2 and c3 categories (p = 0.017). g significant compared with c3 and c4 categories (both p < 0.001). h significant compared with c2 and c4 categories (both p < 0.001). i significant compared with c2 and c3 categories (both p < 0.001). j significant compared with c3 and c4 categories (both p < 0.001). k significant compared with c3 category (p = 0.005) and c4 (p < 0.001). l significant compared with c1 category (p < 0.001), c2 (p = 0.005) and c4 (p < 0.001). m significant compared with c1, c2 and c3 categories (all p < 0.001). characteristic time from symptom onset to admission (days) p duration of symptoms (days) p duration of hospitalization (days) p age group (years) ≤12 3.5 ± 2.5a 0.034 6.9 ± 3.3b <0.001 10.9 ± 3.3 0.004 13–19 4.1 ± 2.3 8.8 ± 2.8c 9.1 ± 3.3e 20–29 4.8 ± 3.3 9.2 ± 4.2d 10.4 ± 3.6 30–39 5.0 ± 3.3 10.7 ± 4.9 10.5 ± 4.0 40–49 4.9 ± 3.1 10.9 ± 5.6 11.5 ± 5.3 50–59 6.2 ± 4.7 12.6 ± 6.3 11.5 ± 4.4 ≥60 4.4 ± 2.9 13.3 ± 5.9 12.5 ± 5.6 disease category c1 na 0.018 na <0.001 9.2 ± 4.2j <0.001 c2 4.4 ± 3.0f 8.7 ± 3.9g 10.1 ± 3.5k c3 5.7 ± 3.5 11.4 ± 4.8h 11.7 ± 4.1l c4 4.6 ± 3.9 16.1 ± 6.0i 14.9 ± 4.9m c5 5.8 ± 3.3 na na overall 4.8 ± 3.3 10.4 ± 5.1 10.8 ± 4.3 wpsar vol 13, no 4, 2022 | doi: 10.5365/wpsar.2022.13.4.941https://ojs.wpro.who.int/ 7 duration of symptoms and illness for delta variant covid-19tan et al table 4. duration of covid-19 symptoms by vaccination status for 548 cases admitted to the national isolation centre, 7–30 august 2021, brunei darussalam sd: standard deviation. a significant compared with partial (p = 0.024) and unvaccinated (p < 0.001). b significant compared with unvaccinated (p < 0.001). vaccination status duration of symptoms (days, mean ± sd) p overall 10.4 ± 5.1 <0.001 complete 6.8 ± 3.5a partial 10.1 ± 5.2 unvaccinated 11.3 ± 5.3 ineligible 8.2 ± 3.1b high proportion of young cases in this study. older cases required a longer time to be weaned off oxygen therapy due to their comorbidities and reduced immunity.26 with the delta variant of covid-19, there is a rapid transition from becoming symptomatic to having dyspnoea and needing oxygen therapy, perhaps exacerbated by the phenomenon of happy (or silent) hypoxia.28,29 for cases admitted to hospital, pneumonia can be identified early by the deterioration in their condition and with chest imaging so that the need for oxygen therapy can be anticipated. however, knowing the average time from symptom onset to oxygen requirement can be useful to gauge when to closely monitor cases at risk of further deterioration. there are several limitations to this study. first, while it was a retrospective study, it used prospectively collected data from a real-time database used for patient management. retrospective studies are associated with missing or incomplete data. even though the data used in this study were captured prospectively, some data were missing due to the number of cases; thus, a small number had to be excluded. second, this study included cases from the first few weeks of the second wave of the pandemic, when all cases were admitted to the nic. this enabled the whole spectrum of covid-19 disease severity to be studied, but it meant that cases occurring after this time were excluded. in addition, cases admitted during the first 6 days of the second wave were excluded from the study, as disease was categorized differently.9 third, symptoms were closely followed only during hospitalization; thus, cases with mild to moderate disease (c1 or c2) or symptoms persisting after discharge were not evaluated. however, using the length of hospitalization was deemed to be adequate to cover the duration of illness, taking into account the interval from symptom onset to admission. additionally, management protocols permit patients to be discharged only after clinical improvement, with most being fully recovered on discharge. the main strength of this study is its link to the patient management system that required all cases to be assessed daily and included information about their symptoms, and this daily assessment was continued for the duration of hospitalization. this allowed accurate data to be collected systematically, which was possible due to the local management protocol requiring cases to be asymptomatic or minimally symptomatic before repeating sars-cov-2 testing to document recovery. furthermore, this study also assessed the association between symptom duration and vaccination status, information that has not been published previously. in conclusion, this study showed that symptom duration was associated separately with age, disease severity and vaccination status, with longer duration of symptoms associated with being older and having more severe disease. receiving two doses of covid-19 vaccine was significantly associated with a shorter duration of symptoms, highlighting the importance of vaccination. these findings are relevant as they illustrate that the duration of symptoms varied and was affected by several factors. recommendations about the duration of isolation for patients who do not require hospitalization, discharge planning and counselling of patients diagnosed with covid-19 can be guided by this information. this is mostly relevant for cases infected with the delta strain of sars-cov-2, but it may also provide a reference for other variants that may emerge during the pandemic. conflicts of interest the authors have no conflicts of interest to declare. ethics statement the study was performed in accordance with the principles of the declaration of helsinki. wpsar vol 13, no 4, 2022 | doi: 10.5365/wpsar.2022.13.4.941 https://ojs.wpro.who.int/8 tan et alduration of symptoms and illness for delta variant covid-19 13. vassallo m, manni s, klotz c, fabre r, pini p, blanchouin e, et al. patients admitted for variant alpha covid-19 have poorer outcomes than those infected with the old strain. j clin med. 2021;10(16):3550. doi:10.3390/jcm10163550 pmid:34441844 14. tenforde mw, kim ss, lindsell cj, billig rose e, shapiro ni, files dc, et al. symptom duration and risk factors for delayed return to usual health among outpatients with covid-19 in a multistate health care systems network – united states, march–june 2020. mmwr morb mortal wkly rep. 2020;69(30):993–8. doi:10.15585/mmwr. mm6930e1 pmid:32730238 15. kim dy, bae ek, seo jw, yun nr, kim cm, kim dm. viral kinetics of severe acute respiratory syndrome coronavirus 2 in patients with coronavirus disease 2019. microbiol spectr. 2021;9(2):e0079321. doi:10.1128/spectrum.00793-21 pmid:34704783 16. van kampen jja, van de vijver damc, fraaij pla, haagmans bl, lamers mm, okba n, et al. duration and key determinants of infectious virus shedding in hospitalized patients with coronavirus disease-2019 (covid-19). nat commun. 2021;12(1):267. doi:10.1038/s41467-020-20568-4 pmid:33431879 17. li y, shi j, xia j, duan j, chen l, yu x, et al. asymptomatic and symptomatic patients with non-severe coronavirus disease (covid-19) have similar clinical features and virological courses: a retrospective single center study. front microbiol. 2020;11:1570. doi:10.3389/fmicb.2020.01570 pmid:32754137 18. munker d, osterman a, stubbe h, muenchhoff m, veit t, weinberger t, et al. dynamics of sars-cov-2 shedding in the respiratory tract depends on the severity of disease in covid-19 patients. eur respir j. 2021;58(1):2002724. doi:10.1183/13993003.02724-2020 pmid:33602859 19. voysey m, clemens sac, madhi sa, weckx ly, folegatti pm, aley pk, et al; oxford covid vaccine trial group. safety and efficacy of the chadox1 ncov-19 vaccine (azd1222) against sars-cov-2: an interim analysis of four randomised controlled trials in brazil, south africa, and the uk. lancet. 2021;397(10269):99–111. doi:10.1016/s0140-6736(20)32661-1 pmid:33306989 20. baden lr, el sahly hm, essink b, kotloff k, frey s, novak r, et al; cove study group. efficacy and safety of the mrna-1273 sarscov-2 vaccine. n engl j med. 2021;384(5):403–16. doi:10.1056/ nejmoa2035389 pmid:33378609 21. thomas sj, moreira ed jr, kitchin n, absalon j, gurtman a, lockhart s, et al; c4591001 clinical trial group. safety and efficacy of the bnt162b2 mrna covid-19 vaccine through 6 months. n engl j med. 2021;385(19):1761–73. doi:10.1056/nejmoa2110345 pmid:34525277 22. al kaabi n, zhang y, xia s, yang y, al qahtani mm, abdulrazzaq n, et al. effect of 2 inactivated sars-cov-2 vaccines on symptomatic covid-19 infection in adults: a randomized clinical trial. jama. 2021;326(1):35–45. doi:10.1001/jama.2021.8565 pmid:34037666 23. coppeta l, balbi o, grattagliano z, mina gg, pietroiusti a, magrini a, et al. first dose of the bnt162b2 mrna covid-19 vaccine reduces symptom duration and viral clearance in healthcare workers. vaccines (basel). 2021;9(6):659. doi:10.3390/vaccines9060659 pmid:34204252 24. antonelli m, penfold rs, merino j, sudre ch, molteni e, berry s, et al. risk factors and disease profile of post-vaccination sars-cov-2 infection in uk users of the covid symptom study app: a prospective, community-based, nested, case–control study. lancet infect dis. 2022;22(1):43–55. doi:10.1016/s1473-3099(21)00460-6 pmid:34480857 25. pritchard e, matthews pc, stoesser n, eyre dw, gethings o, vihta k-d, et al. impact of vaccination on new sars-cov-2 infections in the united kingdom. nat med. 2021;27(8):1370–8. doi:10.1038/ s41591-021-01410-w pmid:34108716 funding none. references 1. who coronavirus (covid-19) dashboard. geneva: world health organization; 2020. available from: https://covid19.who.int/, accessed 16 september 2022. 2. 106 new cases covid-19 reported today, 26 august 2021: media statement on the current situation of covid-19 in brunei darussalam. bandar seri begawan: ministry of health; 2021. available from: https://www.moh.gov.bn/lists/latest%20news/newdispform.aspx?id=1007, accessed 14 april 2022. 3. 368 new cases covid-19 reported today, 07 february 2022: media statement on the current situation of covid-19 in brunei darussalam. bandar seri begawan: ministry of health; 2022. available from: https://www.moh.gov.bn/lists/latest%20news/newdispform.aspx?id=1159, accessed 14 april 2022. 4. symptoms of covid-19. atlanta (ga): centers for disease control and prevention; 2022. available from: https://www.cdc.gov/ coronavirus/2019-ncov/symptoms-testing/symptoms.html, accessed 14 april 2022. 5. mizrahi b, shilo s, rossman h, kalkstein n, marcus k, barer y, et al. longitudinal symptom dynamics of covid-19 infection. nat commun. 2020;11(1):6208. doi:10.1038/s41467-020-20053-y pmid:33277494 6. santos rea, da silva mg, do monte silva mcb, barbosa dam, gomes alv, galindo lcm, et al. onset and duration of symptoms of loss of smell/taste in patients with covid-19: a systematic review. am j otolaryngol. 2021;42(2):102889. doi:10.1016/j.amjoto.2020.102889 pmid:33445036 7. lechien jr, chiesa-estomba cm, de siati dr, horoi m, le bon sd, rodriguez a, et al. olfactory and gustatory dysfunctions as a clinical presentation of mild-to-moderate forms of the coronavirus disease (covid-19): a multicenter european study. euro arch otorhinolaryngol. 2020;277(8):2251–61. doi:10.1007/s00405-020-05965-1 pmid:32253535 8. sheng wh, liu wd, wang jt, chang sy, chang sc. dysosmia and dysgeusia in patients with covid-19 in northern taiwan. j formos med assoc. 2021;120(1 pt 2):311–7. doi:10.1016/j. jfma.2020.10.003 pmid:33139151 9. rahman ar, abdullah ma, asli r, chong pl, mani bi, chong vh. challenges during the second wave of covid-19 in brunei darussalam: national isolation centre to national covid-19 hospital. western pac surveill response j. 2022;13(3):1–7. doi:10.5365/ wpsar.2022.13.3.913 10. the national vaccination program for covid-19 commenced on saturday, 20 syaaban 1442/3 april 2021 and will be implemented in phases outlined in the national vaccination program for brunei darussalam. bandar seri begawan: ministry of health; 2021. available from: https://www.moh.gov.bn/sitepages/covid-19%20vaccine.aspx, accessed 15 april 2022. 11. viner rm, ward jl, hudson ld, ashe m, patel sv, hargreaves d, et al. systematic review of reviews of symptoms and signs of covid-19 in children and adolescents. arch dis child. 2020:archdischild-2020-320972. doi:10.1136/archdischild-2020-320972 pmid:33334728 12. molteni e, sudre ch, canas ls, bhopal ss, hughes rc, antonelli m, et al. illness duration and symptom profile in symptomatic uk school-aged children tested for sars-cov-2. lancet child adolesc health. 2021;5(10):708–18. doi:10.1016/s23524642(21)00198-x pmid:34358472 https://covid19.who.int/ https://www.moh.gov.bn/lists/latest%20news/newdispform.aspx?id=1007 https://www.moh.gov.bn/lists/latest%20news/newdispform.aspx?id=1007 https://www.moh.gov.bn/lists/latest%20news/newdispform.aspx?id=1159 https://www.moh.gov.bn/lists/latest%20news/newdispform.aspx?id=1159 https://www.cdc.gov/coronavirus/2019-ncov/symptoms-testing/symptoms.html https://www.cdc.gov/coronavirus/2019-ncov/symptoms-testing/symptoms.html https://www.moh.gov.bn/sitepages/covid-19%20vaccine.aspx https://www.moh.gov.bn/sitepages/covid-19%20vaccine.aspx wpsar vol 13, no 4, 2022 | doi: 10.5365/wpsar.2022.13.4.941https://ojs.wpro.who.int/ 9 duration of symptoms and illness for delta variant covid-19tan et al 28. brouqui p, amrane s, million m, cortaredona s, parola p, lagier jc, et al. asymptomatic hypoxia in covid-19 is associated with poor outcome. int j infect dis. 2021;102:233–8. doi:10.1016/j. ijid.2020.10.067 pmid:33130200 29. couzin-frankel j. the mystery of the pandemic’s ‘happy hypoxia’. science. 2020;368(6490):455–6. doi:10.1126/science.368.6490.455 pmid:32355007 26. leulseged tw, hassen is, edo mg, abebe ds, maru eh, zewde wc, et al. duration of supplemental oxygen requirement and predictors in severe covid-19 patients in ethiopia: a survival analysis. ethiop j health sci. 2021:31(4):699–708. doi:10.4314/ejhs.v31i4.3 pmid:34703168 27. daher a, balfanz p, aetou m, hartmann b, müller-wieland d, müller t, et al. clinical course of covid-19 patients needing supplemental oxygen outside the intensive care unit. sci rep. 2021;11(1):2256. doi:10.1038/s41598-021-81444-9 pmid:33500431 https://ojs.wpro.who.int/ 1wpsar vol 12, no 3, 2021 | doi: 10.5365/wpsar.2021.12.3.870 case report c oronavirus disease 2019 (covid-19), a respiratory disease caused by the novel severe acute respiratory syndrome coronavirus 2 (sars-cov-2), was first reported in wuhan, china, in december 2019. since its spread worldwide, several mutations have been detected, leading to the emergence of multiple genetic variants. the lineage b.1.1.7, or vui 202012/01, was first detected in september 2020 and has since been detected in numerous countries around the world.1 this variant was reported to have higher transmissibility than the original strain and thus threatened to further burden already overwhelmed health-care systems. given the limited resources available for studying the clinical features of adult patients with b.1.1.7, little information has been recorded for other vulnerable patients, including newborns.2,3 the sars-cov-2 variant b.1.1.7 index case in viet nam was recorded in tokyo, japan, in a person who had arrived on a flight from hanoi in late january 2021. after intensive investigation, a large cluster of covid-19 was found among employees at an industrial production company in hai duong province, northern viet nam, all of whom had epidemiological links to the index case. as of mid-march 2021, more than 300 covid-19 cases had been confirmed among workers at the company and more than 400 secondary community cases among close contacts. this was the largest detected outbreak in viet nam since the beginning of the covid-19 pandemic, with cases confirmed in 13 cities and provinces. among the confirmed cases in this outbreak, sars-cov-2 variant b.1.1.7 was detected in the youngest covid-19 case: a 21-day-old newborn. we report here the clinical characteristics, treatment a pediatrics department, bach mai hospital, hanoi, viet nam. b university of medicine and pharmacy, viet nam national university, hanoi, viet nam. c the general department of preventive medicine, ministry of health, hanoi, viet nam. d national institute of health sciences, bach mai hospital, hanoi, viet nam. published: 16 august 2021 doi: 10.5365/wpsar.2021.12.3.870 sars-cov-2 variant b.1.1.7, first detected in september 2020 in the united kingdom of great britain and northern ireland, has spread quickly to many countries around the world. while some publications have described the clinical features of adult patients with the b.1.1.7 variant, little information is available on newborn patients. we report the clinical characteristics, treatment and care practices for a 21-day-old newborn patient who was confirmed to be infected with sars-cov-2 variant b.1.1.7 in viet nam during contact tracing after her father was confirmed to be infected with sars-cov-2. the patient displayed no symptoms of covid-19 on admission but 3 days later developed diarrhoea, vomiting, a runny nose and a productive cough. these symptoms lasted for 3 days before becoming milder for 1 day and then stopping until discharge. during treatment, the patient received vietnamese traditional herbal peppermint extracts for cough and digestive probiotics for diarrhoeal symptoms. a saltwater solution (sterimar 0.9%) was used to clean the patient’s sinuses. the patient was cared for and fed breastmilk by her mother, who was provided with personal protective equipment, including sterilized infant equipment, medical masks and hand sanitizer, during hospitalization. the patient’s mother tested negative for sars-cov-2 throughout hospitalization. in conclusion, we found no severely abnormal clinical symptoms in a newborn infected with sars-cov-2 variant b.1.1.7 during treatment. our case suggests that newborn patients with the b.1.1.7 variant can receive exclusive breastmilk feeding if sufficient preventive measures are provided for both mother and child. the first newborn patient with sars-cov-2 variant b.1.1.7 identified in viet nam: treatment and care practices dem van pham,a,b hai hoang do,a anh viet nguyen,a nam thanh nguyen,a ngoc van hoangc and ngoc-anh thi hoangd correspondence to ngoc-anh thi hoang (email: ngocanhhoang.22@gmail.com) wpsar vol 12, no 3, 2021 | doi: 10.5365/wpsar.2021.12.3.870 https://ojs.wpro.who.int/2 pham et alnewborn with the b.1.1.7 variant in viet nam digestive symptoms. between 9 february and discharge, the patient had no cough or other symptoms. the patient was free from fever with no shortness of breath during hospitalization (fig. 1). the patient’s first positive test for sars-cov-2 by reverse-transcription polymerase chain reaction (rt–pcr) was performed on 2 february. the sample was used for genomic sequencing on 3 february for comparison with a sample from the patient’s father: both showed sarscov-2 variant b.1.1.7. therapeutic intervention the patient was isolated in a negative-pressure room immediately after admission. one paediatrician and two nurses were responsible for her treatment and care. the patient was given a vietnamese traditional herbal peppermint extract (2 ml, three times per day, 30 minutes before meals) for cough and digestive probiotics (bioflora; 100 mg, once per day) for diarrhoea. her sinuses were cleaned with a saltwater solution (sterimar 0.9%; three times per day). these treatments were applied for 5 consecutive days from the date of symptom onset (5 february) to the date of last symptoms (9 february). the patient was fed eight times per day with breastmilk from her mother in sterilized bottles. the mother was given sterilized breastmilk pumps, hand sanitizer and medical masks throughout, and both she and her infant were monitored closely by health-care staff. the mother was allowed to care for the patient during isolation. she tested negative for sars-cov-2 seven times consecutively by rt–pcr. follow-up and outcomes hai duong’s center for disease control and prevention collected the patient’s oropharyngeal swab samples for sars-cov-2 testing by rt–pcr every 3 days during hospitalization and every 2 days from the day of the first negative test, for a total of seven tests during hospitalization (fig. 1). the patient had four positive tests and then three consecutive negative tests for sars-cov-2 (48 hours apart, the first negative test on the ninth day of hospitalization) before being discharged on 18 february, for a total of 16 days of hospitalization. during hospitalization, the patient’s vital signs were stable, and the results of all blood tests were in the range of normal values (table 1). and care practices of this case, which is a reminder that covid-19 can affect infants and children. the report may be useful for both education and clinical practice in covid-19 case management. it is reported according to the consensus-building clinical case report guidelines.4 patient information the patient was a 21-day-old female newborn, the firstborn of her mother and father, in hai duong province, northern viet nam. her birth weight was 3200 g. before admission, she had received exclusive breastfeeding and had no history of adverse obstetric outcomes. her father was an employee at the industrial production company involved in the large cluster in january 2021. on 28 january, all employees were mandatorily tested for sars-cov-2, and those with epidemiological links to the index case were quarantined. on 29 january, the patient’s father tested positive for sars-cov-2 infection and was immediately transferred to a designated hospital for isolation, where he experienced cough, fever and sore throat 1 day later. his daughter (the patient) and his wife (the patient’s mother) were placed in a designated quarantine facility on 30 january. the last close contact (≤2 m for more than 15 minutes) between the father and the patient was on 29 january, and the last close contact between the father and the patient’s mother was on 26 january. the father was the patient’s sole caretaker between 26 and 29 january. during quarantine, the patient was kept in the same room as her mother. on 2 february, after 4 days in quarantine, the patient was confirmed positive for sars-cov-2 and immediately admitted to hai duong’s covid-19 specialized mobile hospital. clinical findings and timeline on admission, the patient was fully conscious, well fed and displayed no respiratory or digestive symptoms. she had no fever and her respiratory rate was 58 breaths per minute. she weighed 3500 g. three days after admission, the patient displayed several symptoms of covid-19, including diarrhoea, vomiting, runny nose and productive cough. these symptoms lasted for 3 days, during which the frequency of diarrhoea was three times a day and vomiting twice a day. on 8 february, the patient had a dry cough with no wpsar vol 12, no 3, 2021 | doi: 10.5365/wpsar.2021.12.3.870https://ojs.wpro.who.int/ 3 newborn with the b.1.1.7 variant in viet nampham et al mothers, one of two newborns tested positive for sarscov-2 at 2 weeks of age while remaining asymptomatic.6 in one study of 10 neonates born to nine mothers with confirmed sars-cov-2 infection in china, it was stated that vertical transmission of sars-cov-2 could not be confirmed conclusively. no newborns tested positive for sars-cov-2 in the first 9 days of life despite adverse symptoms such as fetal distress, premature labour, respiratory distress, thrombocytopenia accompanied by abnormal liver function and even death.7 clinical evidence on neonatal covid-19 infection is also scant in viet nam; one 3-month-old infant with sars-cov-2 infection, though not the b.1.1.7 variant, was reported in february 2020. her mild upper respiratory symptoms lasted 6 days, longer than in our patient (4 days). the source of infection was her grandmother, who had tested positive by pcr earlier. the time between the first positive pcr test and the first negative test was shorter than for our patient (7 days versus 9 days).8 we report the first case of neonatal covid-19 infection with the b.1.1.7 variant in viet nam. the father was infected and was shown to be the source of infection by epidemiological investigation and genetic sequencing. he had strong epidemiological links to a known covid-19 cluster in the region, while the mother remained uninfected with sars-cov-2 throughout the period. the patient was cared for mainly by the father during his infectious period (26–29 january), just before symptom onset on 30 january. we followed up the infant’s condition after she was discharged and transferred home for a 14-day quarantine. during quarantine, she tested negative for sars-cov-2, was well and had no fever and no respiratory or digestive symptoms. she had gained 2500 g since admission to hospital on 2 february. ethics approval the study protocol was reviewed and the need for approval was waived by the bach mai hospital as a part of routinely conducted disease investigation. discussion we report the clinical characteristics, treatment and care practices in a 21-day-old newborn in viet nam infected with sars-cov-2 variant b.1.1.7. the patient was fed her mother’s breastmilk exclusively during hospitalization, both being provided with sufficient preventive measures. the mother tested negative throughout hospitalization. clinical data on newborn patients with covid-19 are still very limited, and most concern mother-to-child transmission of sars-cov-2. in the first reported case of neonatal covid-19 infection in china in february 2020, both the mother and the 3-day-old neonate were confirmed positive. while both patients’ vital signs were stable, the baby displayed no critical clinical features but was not breastfed throughout hospitalization.5 in an observational study of neonates born to covid-19-infected fig. 1. timeline of the first covid-19 newborn patient with sars-cov-2 variant b.1.1.7, identified in hai duong province, viet nam, february 2021 2 feb consciousness: awake feeling well no respiratory symptoms no digestive symptoms 3 feb 4 feb admission symptom onset discharge 5 feb 6 feb 7 feb 8 feb 9 feb 11 feb 12 feb 14 feb 16 feb 18 feb + + + + – + – – – diarrhoea: 3 times/day vomiting: 2 times/day runny nose productive cough no fever, no shortness of breath no cough no digestive symptoms positive test result negative test result dry cough no digestive symptoms wpsar vol 12, no 3, 2021 | doi: 10.5365/wpsar.2021.12.3.870 https://ojs.wpro.who.int/4 pham et alnewborn with the b.1.1.7 variant in viet nam all close contact with the patient in the isolation room, while the patient wore infant masks. thus, infection prevention and control measures during covid-19 case management and treatment are very important, especially for infants, for whom constant care and special diets are required. we acknowledge several limitations to our study. first, although we report the first detected case of a newborn with b.1.1.7 infection in viet nam, the findings might not be applicable to a larger population. given the ever-changing landscape of the covid-19 pandemic, further studies with larger sample sizes should be conducted to clarify clinical treatment of covid-19infected infants. second, because of the limitations of case reporting, we did not include a control newborn who was uninfected with sars-cov-2 or infected with sars-cov-2 but not the b1.1.7 variant. such a comparison would provide important information on the clinical manifestations and appropriate treatment of different mutations of sars-cov-2 viruses in infant patients. third, though imaging investigation was done, the results were not available for our case, although this would have provided insights for clinical practice. breastfeeding is a cornerstone of infant development. the world health organization recommends that every child be breastfed for at least the first 6 months.9 for infants or mothers infected with sars-cov-2, however, concern has been raised about potential vertical transmission through breastfeeding. while there are insufficient data on such a risk,10 there are no firm recommendations for safe breastfeeding of infants with covid-19.11 in our study, the infant was exclusively fed with breastmilk from sterilized bottles because, at the time, we did not have enough evidence about the risk of transmitting sars-cov-2 through direct breastfeeding. furthermore, no specific process was available for sterilizing the mother’s breasts after breastfeeding, while sterilized breast-pumping equipment and guidance on pumping techniques were accessible and feasible. a previous report from viet nam indicated that exclusive breastfeeding of infants with covid-19 may be safe for the mother, as the infant’s mother did not test positive for sars-cov-2 during the infant’s infectious period.8 we considered this practice safe for the mother and the infected child if both adhered to strict infection prevention and control measures. in our case, the mother wore personal protective clothing and an n95 mask during table 1. clinical testing results for the first covid-19 newborn patient with sars-cov-2 variant b.1.1.7, detected in hai duong province, viet nam, february 2021 thoracic computed tomography was conducted three times and showed no damage to the lung parenchyma. mchc: mean corpuscular haemoglobin concentration. test 2 feb 2021 (admission) 5 feb 2021 (onset) 18 feb 2021 (discharge) reference range white blood cells 11.5 × 10⁹/l 8.2 × 10⁹/l 6.2 × 10⁹/l 4–10 × 109/l neutrophils 3.1 × 10⁹/l 2.4 × 10⁹/l 3.4 × 10⁹/l 1.9–7.8 × 10⁹/l lymphocytes 7.2 × 10⁹/ l 4.8 × 10⁹/l 2.2 × 10⁹/l 0.9–5.2 × 10⁹/l platelets 528 × 109/l 311.4 × 10⁹/l 278 × 109/l 140–440 × 109/l mchc 123 g/l 107.1 g/l 117.1 g/l 117.1 g/l haematocrit 38.9% 30.7% 34.7% 34–487% fasting blood sugar 5.5 mmol/l 5.7 mmol/l 5.7 mmol/l 3.6–6.4 mmol/l c-reative protein 1.2 mg/l 1.5 mg/l 1.5 mg/l < 5 mg/l pro-calcitonin 0.01 mg/l 0.02 mg/l 0.02 mg/l < 0.05 mg/l lactate dehydrogenase 217 u/l 314 u/l 314 u/l < 450 u/l aspartate aminotransferase 23 u/l 28 u/l 28 u/l < 50 u/l alanine aminotransferase 32 u/l 31 u/l 29 u/l < 50 u/l urea 2.8 mmol/l 2.1 mmol/l 3.1 mmol/l 2.8–8.0 mmol/l creatinine 24 µmol/l 34 µmol/l 24 µmol/l < 120 µmol/l na+ 137 mmol/l 136 mmol/l 138 mmol/l 135–145 mmol/l k+ 3.4 mmol/l 3.7 mmol/l 3.5 mmol/l 3.5–5.0 mmol/l cl103 mmol/l 102 mmol/l 101 mmol/l 98–106 mmol/l fibrinogen 3.2 g/l 2.8 g/l 3.6 g/l 2.0–4.0 g/l wpsar vol 12, no 3, 2021 | doi: 10.5365/wpsar.2021.12.3.870https://ojs.wpro.who.int/ 5 newborn with the b.1.1.7 variant in viet nampham et al funding this report involved no sources of funding for any of the authors. references 1. risk related to the spread of new sars-cov-2 variants of concern in the eu/eea – first update. stockholm: european centres for disease prevention and control; 2021. available from: https://www. ecdc.europa.eu/en/publications-data/covid-19-risk-assessmentspread-new-variants-concern-eueea-first-update, accessed 27 march 2021. 2. graham ms, sudre ch, may a, antonelli m, murray b, varsavsky t et al. the effect of sars-cov-2 variant b.1.1.7 on symptomatology, re-infection and transmissibility. medrxiv. 2021;21250680. 3. galloway se, paul p, maccannell dr, johansson ma, brooks jt, macneil a et al. emergence of sars-cov-2 b.1.1.7 lineage united states, december 29, 2020-january 12, 2021. mmwr morb mortal wkly rep. 2021 jan 22;70(3):95–9. doi:10.15585/mmwr. mm7003e2 pmid:33476315 4. care case report guideline. oxford: enhancing the quality and transparency of health research; 2021. available from: https:// www.care-statement.org/, accessed 27 march 2021. 5. wang s, guo l, chen l, liu w, cao y, zhang j et al. a case report of neonatal 2019 coronavirus disease in china. clin infect dis. 2020 jul 28;71(15):853–7. doi:10.1093/cid/ciaa225 pmid:32161941 6. buonsenso d, costa s, sanguinetti m, cattani p, posteraro b, marchetti s et al. neonatal late onset infection with severe acute respiratory syndrome coronavirus 2. am j perinatol. 2020 jun;37(8):869– 72. doi:10.1055/s-0040-1710541 pmid:32359227 7. zhu h, wang l, fang c, peng s, zhang l, chang g et al. clinical analysis of 10 neonates born to mothers with 2019-ncov pneumonia. transl pediatr. 2020 feb;9(1):51–60. doi:10.21037/ tp.2020.02.06 pmid:32154135 8. le ht, nguyen lv, tran dm, do ht, tran ht, le yt et al. the first infant case of covid-19 acquired from a secondary transmission in vietnam. lancet child adolesc health. 2020 may;4(5):405–6. doi:10.1016/s2352-4642(20)30091-2 pmid:32213326 9. breastfeeding. geneva: world health organization; 2021. available from: https://www.who.int/health-topics/ breastfeeding#tab=tab_2, accessed 26 may 2021. 10. breastfeeding and covid-19. 2020 geneva: world health organization; 2021. available from: https://www.who.int/news-room/ commentaries/detail/breastfeeding-and-covid-19, accessed 20 may 2021. 11. care for breastfeeding women – interim guidance on breastfeeding and breast milk feeds in the context of covid-19. atlanta (ga): centers for disease control and prevention; 2019. available from: https://www.cdc.gov/coronavirus/2019-ncov/hcp/care-for-breastfeeding-women.html, accessed 20 may 2021. our study showed no severe abnormal clinical features in a newborn infected with the b.1.1.7 variant. close monitoring and strict preventive measures are necessary to reduce the risk of cross-transmission between caretakers and patients. our study suggests that newborn patients with b.1.1.7 can receive exclusive breastfeeding if sufficient personal preventive measures are provided for both mother and child. dvp was involved in the management of the patient and contributed to the study design, data collection, data interpretation and drafting of the article. hhd, avn, nvh and ntn performed examinations and data analysis and reviewed the final article. nath and nvh were involved in drafting and critically revising the article. all authors read and approved the final article. acknowledgements we thank health-care workers at the hai duong provincial centers for disease control, hai duong’s covid-19 specialized mobile hospital, and local authorities for case-finding, contact tracing, disease control, prevention measures and treatment. we also recognize dr van minh hoang at the national institute of health sciences, bach mai hospital in viet nam for his suggestions and support in writing the article. we thank the patient’s family for their consent, contribution and support. informed consent oral informed assent was obtained from the patient’s family for publication of this report. conflicts of interest the authors declare that they have no competing interests. wpsar vol 12, no 3, 2021 | doi: 10.5365/wpsar.2021.12.3.870 https://ojs.wpro.who.int/6 pham et alnewborn with the b.1.1.7 variant in viet nam https://ojs.wpro.who.int/ 1wpsar vol 13, no 1, 2022 | doi: 10.5365/wpsar.2022.13.1.896 surveillance report t uberculosis (tb) continues to be a leading cause of death for people living with hiv or aids, and hiv remains the strongest known risk factor for progression to active tb disease for persons with latent tb infection.1 in 2019, it was estimated that globally, 8.2% of all people with tb were living with hiv or aids.2 japan has a middle-level, nearly low-level, burden of tb, with 12 739 cases newly notified in 2020, giving a notification rate of 10.1 per 100 000 population.3 in the same year, 750 cases of hiv infection and 345 cases of aids were newly reported.4 the number of new cases of tb, hiv and aids has continued to decline; however, there have been increases observed in the burden of these diseases among foreign-born persons. because recent reports on the epidemiology of tb/hiv coinfection in japan have been limited to regional analyses5,6 or hospital-based studies,7 we analysed national tb surveillance data to examine the characteristics and treatment outcomes of people with tb coinfected with hiv in japan from 2012 to 2020. methods this was a cross-sectional study of active tb cases newly notified to the nationwide japan tuberculosis surveillance (jtbs) system between 1 january 2012 and 31 december 2020. japan tuberculosis surveillance system the jtbs system was japan’s first nationwide computerized tb surveillance system, introduced in 1987. as tb is a notifiable disease, new cases are notified to public health centres, which are responsible for collecting and entering case data into the system. the specific data items included in the jtbs system can be found elsea centre for japan pre-entry tuberculosis screening quality assessment, research institute of tuberculosis, japan anti-tuberculosis association, tokyo, japan. b department of epidemiology and clinical research, research institute of tuberculosis, japan anti-tuberculosis association, tokyo, japan. c department of global and community health, graduate school of nursing, nagoya city university, nagoya, japan. d department of infectious diseases and immunology, clinical research center, nagoya medical center, nagoya, japan. published: 28 march 2022 doi: 10.5365/wpsar.2022.13.1.896 this report examines the characteristics and treatment outcomes of patients with tuberculosis (tb) who are coinfected with hiv in japan. active tb cases newly notified to the japan tuberculosis surveillance system during 2012–2020 were analysed retrospectively, during which 379 hiv-positive tb cases were reported. the proportion of hiv-positive cases among those with known hiv status increased, from 1.9% (62/3328) in 2012 to 3.5% (31/877) in 2020. the proportion of those with unknown hiv testing status was consistently high, at approximately 60%, and the proportion of those who did not undergo hiv testing increased significantly, from 21.6% (4601/21 283) in 2012 to 33.7% (4292/12 739) in 2020. the proportion of foreign-born cases more than tripled, from 14.5% (9/62) in 2012 to 45.2% (14/31) in 2020. the tb treatment success rate was higher among hiv-negative than hiv-positive cases (72.7% [3796/5222] versus 60.3% [88/146]), and among japan-born than foreign-born hiv-positive patients (65.6% [61/93] versus 50.9% [27/53]), owing largely to the high rate of foreign-born cases transferring to care outside japan. the increasing proportion of hiv positivity among tb cases tested for hiv in this study requires ongoing monitoring, especially among foreign-born persons. however, because the number of reported cases was small, and there was low completeness of reporting of hiv testing data in the tb surveillance system, these results should be interpreted with caution. encouraging more complete data collection by training public health nurses who complete tb case interviews and ensuring ongoing monitoring of patients with tb/hiv coinfection are recommended. epidemiology of coinfection with tuberculosis and hiv in japan, 2012–2020 lisa kawatsu,a kazuhiro uchimura,b noriyo kanekoc and mayumi imahashid correspondence to lisa kawatsu (email: kawatsu@jata.or.jp) wpsar vol 13, no 1, 2022 | doi: 10.5365/wpsar.2022.13.1.896 https://ojs.wpro.who.int/2 kawatsu et altb and hiv coinfection in japan p values. r version 3.6.3 (r development core team, vienna, austria) was used for all statistical analyses. results general trends, 2012–2020 during the study period, a total of 156 876 tb cases were notified, of which 379 were categorized as hiv-positive, with the number of notifications steadily declining each year (fig. 1). the proportion of hiv-positive cases among all tb cases was consistent at 0.2–0.3%; however, the proportion of hiv-positive cases among those tested for hiv increased significantly, from 1.9% (62/3328) in 2012 to 3.5% (31/877) in 2020 (p < 0.01). the proportion of those with unknown hiv testing status was consistently high, at 59.4% in 2020, whereas the proportion of those reported as not being tested for hiv increased significantly, from 21.6% (4601/21 283) in 2012 to 33.7% (4292/12 739) in 2020, although this decrease was not statistically significant (p < 0.01). the proportion of foreign-born cases among hiv-positive tb cases more than tripled, from 14.5% (9/62) in 2012 to 45.2% (14/31) in 2020 (fig. 2). proportions of cases by hiv status and selected characteristics among people with tb, 379 were categorized as hiv-positive, 14 339 were hiv-negative, 43 035 were not tested for hiv and 99 123 had unknown hiv testing status (table 1). the proportion of those tested among the total tb cases was 9.4% (14 718/156 876). the proportion of hiv-positive cases among those tested was significantly higher in males (3.4% [313/9124]) versus 1.2% [66/5594]), highest among those aged 25–64 years old (4.8%; 290/5993) and highest for those whose country of birth was unknown (8.1%; 7/86), followed by those who were foreign-born (7.1%; 107/1505). among occupational categories, the proportion of hiv-positive cases was highest among service industry workers (6.8%; 38/558), followed by temporary workers (5.1%; 34/666) (table 1). the proportion of those not tested for hiv was significantly higher in females than males (75.7% [17 406/23 000] versus 73.7% [25 269/34 753]), highest in those aged ≥65 years old (78.7%; 29 116/ where.3 the jtbs data are summarized monthly and annually and are made publicly available online (https:// jata-ekigaku.jp/english). mechanisms to ensure data quality include an automatic verification programme and regular meetings attended by hospital and public health centre staff. hiv status the information regarding a case’s hiv status upon diagnosis of tb is categorized as hiv-positive, hiv-negative, not tested for hiv and unknown hiv testing status. entering these data is optional, and they are not crossreferenced with any other clinical database. country of birth information regarding country of birth is reported as japan-born, foreign-born or unknown. foreign-born cases are defined as people, including japanese citizens, who were born outside of japan. treatment outcomes prior to 2016, treatment outcomes were evaluated automatically using a computerized algorithm available only for pulmonary tb cases treated with a standard regimen. since 2016, treatment outcomes have been entered directly by public health centres for all cases of active and latent tb. therefore, this study examined treatment data from 2016 to 2020. because the numbers of cases with treatment data available were quite small, statistical testing was not conducted to compare the proportions. one case with an unknown country of birth was excluded from the analysis. data analysis and ethics trends in the epidemiological and clinical characteristics of tb cases notified in japan were examined. hiv-positive tb cases, those not tested for hiv and those with unknown hiv testing status were compared. hiv-positive tb cases notified between 2016 and 2019 were analysed by country of birth, and their treatment outcomes were compared with those of hiv-negative tb cases. trends were tested using the cochran−armitage test, and proportions were compared with tests for multiple comparisons, using the hochberg correction to adjust the https://jata-ekigaku.jp/ https://jata-ekigaku.jp/ wpsar vol 13, no 1, 2022 | doi: 10.5365/wpsar.2022.13.1.896https://ojs.wpro.who.int/ 3 tb and hiv coinfection in japankawatsu et al fig. 1. number of newly notified tb cases by hiv status and proportion that were hiv-positive, by year, japan, 2012–2020 0.0 0.5 1.0 1.5 2.0 2.5 3.0 3.5 4.0 0 5000 10 000 15 000 20 000 25 000 2012 2013 2014 2015 2016 2017 2018 2019 2020 % o f h iv -p os iti ve ca se s n o. o f n ew ly n ot ifi ed t b ca se s unknown hiv testing status untested for hiv hiv-negative hiv-positive % hiv-positive among those tested % hiv-positive among all tb cases fig. 2. number of newly notified tb cases by country of birth and proportion that were foreign-born, by year, japan, 2012–2020 0.0 10.0 20.0 30.0 40.0 50.0 60.0 0 10 20 30 40 50 60 70 2012 2013 2014 2015 2016 2017 2018 2019 2020 japan-born foreign-born country of birth unknown % foreign-born % o f f o re ig n -b o rn t b c as es n o. o f n ew ly n o ti �e d h iv -p o si ti ve t b c as es wpsar vol 13, no 1, 2022 | doi: 10.5365/wpsar.2022.13.1.896 https://ojs.wpro.who.int/4 kawatsu et altb and hiv coinfection in japan in hiv-positive than hiv-negative cases (65.6% [61/93] versus 72.2% [3288/4557]), despite a larger proportion of those who were hiv-negative having died (8.6% [8/93] versus 19.0% [865/4557]). the lower treatment success rate among the hiv-positive cases was largely attributable to the higher proportion of those still on treatment (17.2% [16/93] versus 4.1% [185/4557] of hiv-negative cases still on treatment) (table 3). among foreign-born cases, again, the treatment success rate was lower among hiv-positive than hiv-negative cases (50.9% [27/53] versus 76.4% [508/665]). this was largely attributable to higher proportions who were still undergoing treatment (11.3% [6/53] versus 5.6% [37/665]), as well as those who had transferred out (28.3% [15/53] versus 14.4% [96/665]) (table 3). discussion japan has historically had a low hiv prevalence, at less than 0.1 per 1000 population aged 15–49 years,8 with a concentrated epidemic among men who have sex with men (msm);9 therefore, tb/hiv comorbidity has had less public health importance in japan compared with other similarly industrialized countries. however, this study has shown an increasing proportion of hiv positivity among tb cases who were tested for hiv, which was 3.5% of those notified in 2020. this positivity rate is higher than in the united kingdom of great britain and northern ireland (2.8% in 2018), but lower than in the united states of america (4.7% in 2019).2 the overall increase in hiv positivity in japan may be due to the increase in the number of foreign-born persons with hiv who are in japan: hiv positivity increased by 46%, from 91 cases in 2000 to 133 cases in 2019.4 there have also been changes in the countries of birth of foreign-born persons with hiv in japan between 2008 and 2013, with numbers decreasing from countries in the world health organization’s south-east asia region and increasing from countries in the western pacific region, where the estimated number of people living with hiv has increased in recent years.8,10 issues associated with diagnosing hiv among foreign-born persons in japan suggest that cases may be underreported. one study estimated that approximately 50% of hiv cases among foreign-born persons in japan are currently diagnosed,11 as opposed to approximately 80% 36 988) and highest in those whose country of birth was unknown (88.0%; 632/718), followed by those who were born in japan (74.9%; 39 215/52 342). among occupational categories, the proportion of those not tested for hiv was highest among children and infants (i.e. excluding high school and university students) at 83.0% (225/271), followed by unemployed adults (78.0%; 28 971/37 124) (table 1). the proportion of those with unknown hiv testing status did not significantly differ by sex (63.3% [59 924/94 677] for males versus 63.0% [39 199/62 199] for females); however, it was highest among those aged ≥65 years old (64.2%; 66 295/103 283) and in those whose country of birth was unknown (86.9%; 4752/5470), followed by those who were born in japan (62.5%; 87 179/139 521). regarding occupational category, the proportion was highest among those in the category “other or job unknown”, at 69.0% (4351/6303) (table 1). demographic characteristics of hiv-positive tb cases by country of birth the majority of both the japan-born and foreign-born hiv-positive tb cases were in the two younger age groups (0–24 years and 25–64 years). however, those aged 25–64 years accounted for 85.0% (91/107) of all foreign-born cases compared with 73.6% (195/265) of japan-born cases. males comprised 68.2% (73/107) and 88.3% (234/265) of foreign-born and japan-born cases, respectively. for occupational categories for both japan-born and foreign-born cases, the highest number of cases was among unemployed adults, followed by other full-time workers, service industry workers and temporary workers. these four occupational categories accounted for 86.8% (230/265) and 80.4% (86/107) of all japan-born and foreign-born cases, respectively. among foreign-born cases, high school and university students accounted for another 10.3% (11/107) of cases, but they were not represented in japan-born cases (table 2). treatment outcomes among tb cases by hiv status the overall treatment success rate among hiv-positive tb cases was lower among foreign-born than japan-born cases (50.9% [27/53] versus 65.6% [61/93]). among japan-born cases, the treatment success rate was lower wpsar vol 13, no 1, 2022 | doi: 10.5365/wpsar.2022.13.1.896https://ojs.wpro.who.int/ 5 tb and hiv coinfection in japankawatsu et al table 1. number and proportion of tb cases by selected characteristics and hiv status, japan, 2012–2020 characteristic notified tb cases total no. hivpositive no. hiv negative no. untested for hiv no. hiv testing status unknown % hivpositive % untested for hiv % hiv testing status unknown total 156 876 379 14 339 43 035 99 123 2.6 74.5 63.2 sex male 94 677 313 8811 25 629 59 924 3.4 73.7 63.3 female 62 199 66 5528 17 406 39 199 1.2 75.7 63.0 age group (years) 0–24 7059 17 836 2039 4167 2.0 70.5 59.0 25–64 46 534 290 5703 11 880 28 661 4.8 66.5 61.6 ≥65 103 283 72 7800 29 116 66 295 0.9 78.7 64.2 country of birth japan-born 139 521 265 12 862 39 215 87 179 2.0 74.9 62.5 foreign-born 11 885 107 1398 3188 7192 7.1 67.9 60.5 unknown 5470 7 79 632 4752 8.1 88.0 86.9 occupational category health-care worker 4526 15 478 1259 2774 3.0 71.9 61.3 service industry worker 3916 38 520 1102 2256 6.8 66.4 57.6 other full-time worker 22 524 98 2741 5884 13 801 3.5 67.5 61.3 temporary worker 5256 34 632 1303 3287 5.1 66.2 62.5 self-employed 6154 20 656 1714 3764 3.0 71.7 61.2 unemployed adults 103 310 152 8001 28 971 66 186 1.9 78.0 64.1 high school and university students 4360 11 636 1265 2448 1.7 66.2 56.1 children and infants 527 1 45 225 256 2.2 83.0 48.6 other or job unknown 6303 10 630 1312 4351 1.6 67.2 69.0 provided free of charge and anonymously at public health centres, low uptake has been reported in japan13,14 among younger populations and among msm, who are considered to be more knowledgeable and conscious about the risk of hiv infection.15 the number of hiv tests conducted at these centres has also gradually decreased, from about 146 000 tests in 2008 to 105 000 tests in 2019.4 the proportion of adult males who have ever had an hiv test in japan is around 10%,16 much lower than in the united states (41.3%),17 canada (40.4%)18 and england (32.4%).19 inconvenience, social stigma against homosexuality and discrimination against msm and people living with hiv or aids are some reasons for the low uptake of testing,9 and these may prevent the active promotion of hiv counselling and testing, even to those considered to be at high risk. it is necessary for public among those born in japan.9 this estimate, along with delays in seeking hiv care among foreign-born cases8,10 and the findings of this study, suggest that japan could potentially be facing a large pool of foreign-born persons at risk of tb/hiv coinfection. a low hiv testing rate (9.4%) was observed among tb cases in this study. although hiv testing is recommended for all people with tb in japan,12 and questions about comorbidities are asked during the tb case interview, anecdotal evidence suggests that in practice, public health nurses are reluctant to counsel tb cases about hiv and offer testing. because approximately 70% of japan’s tb cases are aged ≥65 years, they are not perceived to be at risk of hiv infection or aids. therefore, the question may seem unnecessary. despite hiv testing being wpsar vol 13, no 1, 2022 | doi: 10.5365/wpsar.2022.13.1.896 https://ojs.wpro.who.int/6 kawatsu et altb and hiv coinfection in japan health centres to have staff who are adequately trained and have counselling skills to communicate with patients with tb about hiv and aids in multiple languages. treatment success differed by hiv status and country of birth. treatment success was lower for japan-born hiv-positive tb cases, at 65.6%, compared with japan-born hiv-negative cases, at 72.2%, largely due to the high proportion of hiv-positive tb cases who were still undergoing treatment. since treatment outcomes are entered into the jtbs system after 1 year of surveillance, it is possible that the final treatment outcomes of tb cases with hiv coinfection are not captured, especially as their treatment may have been prolonged due to complications. among foreign-born patients with tb, treatment success for hiv-positive patients, at 50.9%, was lower than that for hiv-negative cases, at 76.4%. cases not in the category of treatment success include those still undergoing treatment and those who have transferred out of the system, for example, to return to their home country for treatment. although there are various public subsidies for antiretroviral therapy in japan, it is not completely free, and the process of applying for these subsidies can be complicated for people born outside of japan. thus the financial burden of antiretroviral therapy, coupled with psychological stress owing to difficulties in communication and cultural differences, table 2. demographic characteristics of hiv-positive tb cases, by country of birth, japan, 2012–2020 (n = 379) table 3. treatment outcomes for tb cases by country of birth and hiv status, japan, 2016–2019 characteristic country of birth japan (n = 265) foreign country (n = 107) unknown (n = 7) sex male 234 73 6 female 31 34 1 age group (years) 0-24 3 14 0 25-64 195 91 4 ≥65 67 2 3 occupational category health-care worker 13 2 0 service industry worker 26 12 0 other full-time worker 67 29 2 temporary worker 18 16 0 self-employed 17 3 0 unemployed adults 119 29 4 high school and university students 0 11 0 children and infants 0 1 0 other or job unknown 5 4 1 treatment outcome country of birth japan, n (%) foreign country, n (%) hiv-positive hiv-negative hiv-positive hiv-negative success 61 (65.6) 3288 (72.2) 27 (50.9) 508 (76.4) cured 17 (18.3) 815 (17.9) 7 (13.2) 161 (24.2) treatment completed 44 (47.3) 2473 (54.3) 20 (37.7) 347 (52.2) died 8 (8.6) 865 (19.0) 3 (5.7) 14 (2.1) failure 0 (0.0) 4 (0.1) 0 (0.0) 1 (0.2) lost to follow-up 4 (4.3) 89 (2.0) 1 (1.9) 7 (1.1) transferred out 2 (2.2) 122 (2.7) 15 (28.3) 96 (14.4) treatment ongoing 16 (17.2) 185 (4.1) 6 (11.3) 37 (5.6) unknown 2 (2.2) 4 (0.1) 1 (1.9) 2 (0.3) total 93 (100.0) 4557 (100.0) 53 (100.0) 665 (100.0) wpsar vol 13, no 1, 2022 | doi: 10.5365/wpsar.2022.13.1.896https://ojs.wpro.who.int/ 7 tb and hiv coinfection in japankawatsu et al have encouraged people who are hiv-positive, and also prompted physicians to persuade them, to return to their countries of birth to continue treatment.20,21 to prevent disruption of treatment and poor treatment outcomes, social protection measures are urgently required to ensure that foreign-born tb patients receive appropriate care and treatment in japan; additionally, cross-border referral mechanisms are also needed. limitations our study had several limitations. first, entering whether a person is living with hiv into the jtbs system is optional. therefore, public health nurses who interview patients with tb are not obligated to ask for that information. second, when hiv status is recorded, it is self-reported and not verified or linked to other clinical databases. therefore, it is possible that the hiv positivity rate reported among tb cases is an underestimation of the true occurrence in japan. also, because there are no data in japan about the uptake of hiv testing stratified by sociodemographic characteristics, it is difficult to assess whether the increase in hiv positivity among those tested was due to a real increase in the number of hiv-positive tb cases or if hiv testing was more focused on high-risk groups.22 conclusions the increasing proportion of hiv positivity among tb patients tested for hiv shown in this study requires ongoing monitoring, especially among foreign-born persons. however, as the number of reported cases was small, and the data on hiv testing reported in the jtb system were not complete, these results need to be interpreted with caution. encouraging more complete data collection by training the public health nurses who complete tb case interviews, as well as ensuring there is ongoing monitoring of patients with tb/hiv coinfection is recommended. acknowledgements the authors thank all those involved in collecting and entering data into the japan tuberculosis surveillance system. conflicts of interest the authors have no conflicts of interest to declare. ethics statement the study protocol was approved by the institutional review board of the research institute of tuberculosis, japan anti-tuberculosis association (reference no. rit/ irb 2021-5). informed consent was deemed unnecessary by the review board, as the surveillance data did not contain personal identifiers. funding no funding was received to conduct this study. references 1. tuberculosis and hiv: progress towards the 2020 target. geneva: joint united nations programme on hiv/aids; 2019. available from: https://www.unaids.org/en/resources/documents/2019/tuberculosis-and-hiv-progress-towards-the-2020-target, accessed 20 october 2021. 2. global tuberculosis report 2020. geneva: world health organization; 2020. available from: https://apps.who.int/iris/handle/10665/336069, accessed 20 october 2021. 3. tuberculosis in japan: annual report 2021. tokyo: tuberculosis surveillance center, research institute of tuberculosis; 2021. available from: https://jata.or.jp/english/dl/pdf/tb_in_japan_2021.pdf, accessed 1 february 2022. 4. [annual aids report 2020]. tokyo: aids surveillance committee, ministry of health, labour and welfare; 2021 (in japanese). available from: https://api-net.jfap.or.jp/status/japan/nenpo. html, accessed 25 october 2021. 5. matsumoto k, komukai j, tsuda y, ueda h, adachi m, shimizu n, et al. [treatment support and treatment outcomes of pulmonary tuberculosis in patients with hiv infection in osaka city]. kekkaku. 2017;92(1):21–6 (in japanese). pmid:30646469 6. ikeda m, nishikiori h, kondo s, kobayashi t, taya t, mori y, et al. [the current situation of foreign tuberculosis patients and their concurrent hiv infection in hokkaido]. kekkaku. 2016;91(2):33–9 (in japanese). pmid:27263222 7. kasai d, hirota k, ikuma m, ogawa y, yajima k, watanabe d, et al. [clinical status analysis of tuberculosis in patients infected with human immunodeficiency virus.] ann jpn respir soc. 2015;4(1):66–71 (in japanese). 8. hiv data and statistics [online database]. geneva: world health organization, global hiv programme; 2021. available from: https://www.who.int/teams/global-hiv-hepatitis-and-stis-programmes/hiv/strategic-information/hiv-data-and-statistics, accessed 20 october 2021. wpsar vol 13, no 1, 2022 | doi: 10.5365/wpsar.2022.13.1.896 https://ojs.wpro.who.int/8 kawatsu et altb and hiv coinfection in japan 9. iwamoto a, taira r, yokomaku y, koibuchi t, rahman m, izumi y, et al. the hiv care cascade: japanese perspectives. plos one. 2017;12(3):e0174360. doi:10.1371/journal.pone.0174360 pmid:28319197 10. sawada t, yamamoto y, tsukada k, yokomaku y, iwamuro s, tarui m, et al. [factors related to delays in health-care access among hiv-positive migrants in japan]. j aids res. 2020;22(3):172–81 (in japanese). 11. shimizu k, nishiura h, imamura a. investigation of the proportion of diagnosed people living with hiv/aids among foreign residents in japan. j clin med. 2019;8;804. doi:10.3390/ jcm8060804 pmid:31195745 12. yotsumoto m, ed. [anti-hiv treatment guideline]. osaka: aids medical center; 2021 (in japanese). available from: https://www. haart-support.jp/guideline.htm, accessed 25 july 2021. 13. takano m, iwahashi k, satoh i, araki j, kinami t, ikushima y, et al. assessment of hiv prevalence among msm in tokyo using self-collected dried blood spots delivered through the postal service. bmc infect dis. 2018;18(1):627. doi:10.1186/s12879018-3491-0 pmid:30518333 14. ishimaru t, wada k, smith dr. hiv testing and attitudes among the working-age population of japan: annual health checkups may offer an effective way forwards. ind health. 2016;54(2):116–22. doi:10.2486/indhealth.2015-0087 pmid:26423333 15. kaneko n, shiono s, hill ao, homma t, iwahashi k, tateyama m, et al. correlates of lifetime and past one-year hiv-testing experience among men who have sex with men in japan. aids care. 2021;33(10):1270–7. doi:10.1080/09540121.2020.183 7339 pmid:33138624 16. kaneko n, shiono s, utsumi m, yamamoto m, tateyama m, onitsuka t, et al. [hiv testing and related factors among japanese adult males: comparison of survey results in 2009 and 2012]. j aids res. 2017;19(1):16–23 (in japanese). 17. hiv testing and diagnosis among adults – united states, 2001–2009. mmwr morb mortal wkly rep. 2010;59:1550–5. pmid:21124295 18. houston s, archibald cp, strike c, sutherland d. factors associated with hiv testing among canadians: results of a population-based survey. int j std aids. 1998;9:341–6. doi:10.1258/0956462981922377 pmid:9671248 19. mcgarrigle ca, mercer ch, fenton ka, copas aj, welling k, erens b, et al. investigating the relationship between hiv testing and risk behaviour in britain: national survey of sexual attitudes and lifestyles 2000. aids. 2005;19:77–84. doi:10.1097/00002030200501030-00009 pmid:15627036 20. ikeda k, nishikiori h, kondo s, kobayashi t, taya t, mori y, et al. [the current situation of foreign tuberculosis patients and their concurrent hiv infection in hokkaido]. kekkaku. 2016;91(2):33–9 (in japanese). pmid:27263222 21. sawada t. [international society is trying to promote access to treatment: expected role of local government in responding to hiv]. j natl inst public health. 2007;56(3):253–6 (in japanese). 22. ichikawa s. [the current situation of hiv/aids among msm (men who have sex with men) in japan – from the viewpoint of socio-epidemiology]. j aids res. 2017;19(2):71–80 (in japanese). https://ojs.wpro.who.int/ 1wpsar vol 13, no 1, 2022 | doi: 10.5365/wpsar.2022.13.1.883 covid-19: brief report t he theta variant of severe acute respiratory syndrome coronavirus 2 (sars-cov-2) was first reported in the central visayas region, philippines, in january 2021. the world health organization (who) designated the theta variant as a variant of interest on 24 march 2021,1 given that it contains the mutations e484k, which has been associated with antigenic escape; n501y, associated with increased transmissibility; and other mutations of concern found in existing variants of concern (tablizo fa, kim km, lapid cm, castro mjr, yangzon msl, maralit ba, et al. philippine genome center, unpublished data, 2021). this report is the first to describe the epidemiological profile of this variant. surveillance for pathogens in the philippines is coordinated at the national level by the department of health epidemiology bureau and at the regional level by regional epidemiology and surveillance units (regional units); surveillance at the local level is conducted by city and municipal epidemiology and surveillance units. regional units identify candidates for sequencing among sars-cov-2 specimens that are positive by nucleic acid amplification test and send these samples to the philippine genome center for whole-genome sequencing (wgs). the criteria for sample selection established by the central visayas regional unit include specimens from cases with known travel history from countries with variants of concern or interest, specimens that are part of large clusters of positive coronavirus 2019 (covid-19) cases and specimens that have a volume >500 µl and a cycle threshold value <30 (central visayas center for health development, unpublished guidance: collection and testing guidelines for genomic sequencing, 2021). to meet the national capacity for wgs, which is about 750 samples weekly,2 the epidemiology bureau further narrows down samples for wgs. as of 10 june 2021, 950 samples, one sample per case, had been sent for wgs from the central visayas region, and 321 (33.8%) had been sequenced. the samples were collected from 30 october 2020 to 16 february 2021. the wgs results were provided to the central visayas regional unit between 12 february and 12 march 2021. cases were followed up for 60 days post-diagnosis to determine whether they resolved through clinical recovery or death; clinical recovery was defined as the date when a case was discharged from a hospital or isolation facility following sars-cov-2 infection. outcomes were ascertained based on standard discharge and recovery criteria as reported by city and municipal surveillance units or local health facilities.3 cases were excluded from the analysis if they had any of the four variants of concern identified as of june 2021 – that is, alpha, beta, gamma or delta – as these are known to be associated with higher transmissibility and mortality. some specimens were from cases in the same outbreak cluster or shared the same home address and date of specimen collection; therefore, all statistical analyses considered clustering at this level. the risk ratio (rr) for covid-19 hospitalization was calculated using a log-binomial generalized estimating equation with an a health sciences program, ateneo de manila university, quezon city, philippines. b department of epidemiology, johns hopkins bloomberg school of public health, baltimore, md, united states of america. c center for health and development, region 7 (central visayas region), department of health, cebu city, philippines. published: 9 february 2022 doi: 10.5365/wpsar.2022.13.1.883 epidemiological characteristics of the sars-cov-2 theta variant (p.3) in the central visayas region, philippines, 30 october 2020–16 february 2021 nel jason l. haw,a,b eugenia mercedes r. cañal,c juanito zuasula jr.,c mary jean lorechec and jaime bernadasc correspondence to nel jason l. haw (email: nhaw@ateneo.edu) wpsar vol 13, no 1, 2022 | doi: 10.5365/wpsar.2022.13.1.883 https://ojs.wpro.who.int/2 haw et alepidemiologic characteristics of sars-cov-2 theta variant all cases, most specimens (200/317; 63.1%) and almost all specimens from theta variant cases (64/68; 94.1%) were collected during the first 2 weeks of february (table 1). additionally, most specimens were collected from cases in cebu province, including from the independent cities of cebu city, lapu-lapu city and mandaue city (191 [60.3%] of specimens overall and 48/68 [70.6%] among theta variant cases). the median age of all cases was 33 years (interquartile range [iqr]: 21–46), and 142 (44.8%) cases occurred among women. the age and sex distributions were similar between cases with the theta and non-theta variants (table 1). hospitalization was required for 18 of the 68 cases with the theta variant (26.5%) compared with 77 of the 249 non-theta variant cases (30.9%) (data not shown). the risk for hospitalization was not significantly associated with having the theta variant (crude rr: 0.86; 95% confidence interval [ci]: 0.48–1.51; adjusted rr: 0.76; 95% ci: 0.40–1.47) (data not shown). the median time to recovery was similar, at 17 days, and the hr for recovery also was not associated with the theta variant (crude hr: 1.00; 95% ci: 0.70–1.44; adjusted hr: 0.92; 95% ci: 0.65–1.30) (data not shown). three cases died, none of whom had the theta variant. nineteen clusters were identified from two major cities, with the index case having the theta variant. the independent working correlation structure and robust sandwich variance estimator.4 median recovery times were calculated from kaplan–meier survival curves. the hazard ratios (hrs) for recovery were estimated using a shared frailty model, which is an extension of the cox proportional hazards model that accounts for clustering, and the proportional hazards assumption was checked using schoenfeld residuals.4 for both rr and hr, the models were adjusted for morbidity, week of specimen collection of first positive test, age, sex and province. finally, because contact tracing is done by city and municipal surveillance units, two major cities provided a copy of their database to the regional unit. for cases with the theta variant in those cities, close contacts were counted and cross-referenced with the regional unit’s confirmed covid-19 line list to determine which close contacts had tested positive. the secondary attack rate was calculated as the number of positive close contacts divided by the total number of close contacts. all analyses were conducted using stata version 17 (statacorp, college station, tx, usa). of the 321 cases with wgs results, four had the variant of concern and were excluded; thus, the final sample size was 317 cases, comprising 2.6% of the 12 136 cases confirmed by nucleic acid amplification tests during the specimen collection period. the theta variant was detected in 68 (21.5%) of the samples. for table 1. comparison of theta variant and non-theta variant sars-cov-2 cases in the central visayas region, philippines, 30 october 2020–16 february 2021 characteristic severe acute respiratory syndrome coronavirus 2 alla (n = 317) theta variant (n = 68) non-theta variant (n = 249) female, n (%) 142 (44.8) 30 (44.1) 112 (45.0) age (years), median (iqr) 33 (21–46) 34.5 (20.5–42) 33 (21–49) age group (years), n (%) 0–17 69 (21.8) 15 (22.1) 54 (21.7) 18–44 161 (50.8) 39 (57.3) 122 (49.0) 45–60 53 (16.7) 8 (11.8) 45 (18.1) >60 34 (10.7) 6 (8.8) 28 (11.2) in cebu province, n (%)b 191 (60.3) 48 (70.6) 143 (57.4) specimens collected during the first 2 weeks of february 2021, n (%)c 200 (63.1) 64 (94.1) 136 (54.6) iqr: interquartile range. a excludes four sequenced samples with variants of concern. b a full provincial breakdown is not available due to small sample sizes from some provinces (<5 cases); counts from cebu province include the independent cities of cebu city, lapu-lapu city and mandaue city. c other dates of specimen collection are not available due to small sample sizes in some months (<5 cases). wpsar vol 13, no 1, 2022 | doi: 10.5365/wpsar.2022.13.1.883https://ojs.wpro.who.int/ 3 epidemiologic characteristics of sars-cov-2 theta varianthaw et al median number of close contacts was 8 (iqr: 5–13). there were 182 close contacts, 81 of whom tested positive. therefore, the overall secondary attack rate for cases infected with the theta variant was 44.5%. these preliminary results, showing that the theta variant did not seem to be associated with more severe disease, were similar to findings on the iota variant (b.1.526) in new york, which also contained the e484k mutation.5 additionally, while the secondary attack rate was more than twice as high as the 16.6% previously reported,6 the number of clusters examined was too few to draw any definitive conclusions. since march 2021, most of the country’s biosurveillance capacity has been dedicated to testing samples from the national capital region and from repatriated filipinos.7 further investments to expand biosurveillance capacity, as well as to facilitate timelier linkages of genomic, epidemiological and clinical data, may be needed to further understand the epidemiological profile of the theta variant. nonetheless, our results can contribute to the evidence base used by who and countries affected by the theta variant to clarify its status as a variant of interest. acknowledgments we thank the cebu city and mandaue city health departments for providing a copy of their database used for contact tracing. we also thank the disease surveillance officers of the department of health in central visayas for their work in collecting and processing the data required for this analysis. conflicts of interest the authors have no conflicts of interest to declare. ethics statement this analysis received institutional review board exemption from the ateneo de manila university research ethics committee (protocol no.: admurec_21_011). funding none. references 1. tracking sars-cov-2 variants. geneva: world health organization; 2021. available from: https://www.who.int/activities/tracking-sars-cov-2-variants/, accessed 12 june 2021. 2. manahan j. ph genome testing capacity still limited amid presence of covid-19 variants – doh. manila: abs-cbn news; 2021. available from: https://news.abs-cbn.com/ news/05/08/21/ph-genome-capacity-limited-covid19-variants, accessed 12 june 2021. 3. [discharge and recovery criteria for covid-19 patients]. manila: department of health; 2020 (in filipino). available from: https://doh.gov.ph/discharge-and-recovery-criteria-para-samga-pasyenteng-nagkaroon-ng-covid-19, accessed 12 june 2021. 4. rabe-hesketh s, skrondal a. multilevel and longitudinal modeling using stata, third edition. college station (tx): stata press; 2012. 5. thompson cn, hughes s, ngai s, baumgartner j, wang jc, mcgibbon e, et al. rapid emergence and epidemiologic characteristics of the sars-cov-2 b.1.526 variant — new york city, new york, january 1–april 5, 2021. mmwr morb mortal wkly rep. 2021;70(19):712–6. doi:10.15585/mmwr.mm7019e1 pmid:33983915 6. madewell zj, yang y, longini im, halloran me, dean ne. household transmission of sars-cov-2: a systematic review and metaanalysis. jama netw open. 2020;3(12):e2031756. doi:10.1001/ jamanetworkopen.2020.31756 pmid:33315116 7. dela cruz rc. 4 of 5 covid-19 variants have 24 active cases. manila: philippine news agency; 2021. available from: https://www.pna.gov.ph/articles/1140700, accessed 12 june 2021. https://ojs.wpro.who.int/ 1wpsar vol 14, no 3, 2023 | doi: 10.5365/wpsar.2023.14.3.948 original research t he australian and new zealand governments’ response to the coronavirus disease (covid-19) pandemic has been described as “hard and fast”, with the initial aim of elimination.1 both countries swiftly introduced a range of public health and social measures (phsms), such as physical distancing, mask use, school closures, border closures and travel restrictions. the stringency of these phsms fluctuated in both countries throughout 2020–2021, in response to local covid-19 outbreaks. during this time, circulating patterns of influenza and other respiratory viruses changed dramatically.2 respiratory viruses cause significant morbidity and mortality.3,4 influenza is known to cause severe illness in elderly adults,3 while human parainfluenza virus types 1–3 (piv-1–3) have the potential to cause severe disease in infants and children.5 however, human piv type 4 a who collaborating centre for reference and research on influenza, royal melbourne hospital, melbourne, victoria, australia. b centre for infectious diseases and microbiology laboratory services, new south wales health pathology-institute of clinical pathology and medical research, westmead hospital, westmead, new south wales, australia. c canterbury health laboratories, christchurch, new zealand. d pathwest laboratory medicine wa, nedlands, western australia, australia. e infection and immunity, school of biomedical sciences, university of western australia, perth, western australia, australia. f faculty of health and medical sciences, university of western australia, nedlands, western australia, australia. g institute of environmental science and research, wellington, new zealand. h counties manukau district health board, auckland, new zealand. i virology and immunology department, labplus, auckland city hospital, auckland district health board, auckland, new zealand. j department of microbiology and immunology, university of melbourne, peter doherty institute for infection and immunity, melbourne, victoria, australia. k department of infectious diseases and centre for epidemiology and biostatistics, university of melbourne, melbourne, victoria, australia. published: 27 july 2023 doi: 10.5365/wpsar.2023.14.3.948 objective: circulation patterns of influenza and other respiratory viruses have been globally disrupted since the emergence of coronavirus disease (covid-19) and the introduction of public health and social measures (phsms) aimed at reducing severe acute respiratory syndrome coronavirus 2 (sars-cov-2) transmission. methods: we reviewed respiratory virus laboratory data, google mobility data and phsms in five geographically diverse regions in australia and new zealand. we also described respiratory virus activity from january 2017 to august 2021. results: we observed a change in the prevalence of circulating respiratory viruses following the emergence of sars-cov-2 in early 2020. influenza activity levels were very low in all regions, lower than those recorded in 2017–2019, with less than 1% of laboratory samples testing positive for influenza virus. in contrast, rates of human rhinovirus infection were increased. respiratory syncytial virus (rsv) activity was delayed; however, once it returned, most regions experienced activity levels well above those seen in 2017–2019. the timing of the resurgence in the circulation of both rhinovirus and rsv differed within and between the two countries. discussion: the findings of this study suggest that as domestic and international borders are opened up and other covid-19 phsms are lifted, clinicians and public health professionals should be prepared for resurgences in influenza and other respiratory viruses. recent patterns in rsv activity suggest that these resurgences in non-covid-19 viruses have the potential to occur out of season and with increased impact. circulation of influenza and other respiratory viruses during the covid-19 pandemic in australia and new zealand, 2020–2021 genevieve k o’neill,a janette taylor,b jen kok,b dominic e dwyer,b meik dilcher,c harry hua,c avram levy,d,e david smith,d,f cara a minney-smith,d timothy wood,g lauren jelley,g q sue huang,f,g adrian trenholme,h gary mcauliffe,i ian barra,j and sheena g sullivana,k correspondence to sheena g sullivan (email: sheena.sullivan@influenzacentre.org) wpsar vol 14, no 3, 2023 | doi: 10.5365/wpsar.2023.14.3.948 https://ojs.wpro.who.int/2 o’neill et alcirculation of respiratory viruses during the covid-19 pandemic in australia and new zealand laboratory medicine, wa; (iii) institute of environmental science and research (esr), wellington, and auckland and counties manukau district health boards, auckland; and (iv) canterbury health laboratories, christchurch. respiratory specimens underwent nucleic acid amplification testing (naat) using semi-quantitative real-time reverse transcription polymerase chain reaction (pcr) or transcription-mediated amplification testing. in addition, respiratory specimens underwent rapid pcr testing at canterbury health laboratories for influenza and rsv, and rapid pcr testing for influenza at esr. icpmr and pathwest laboratories are major diagnostic hubs that provide state-wide testing for respiratory viruses, in both hospitalized and community populations. esr data included laboratory-based respiratory virus testing results from specimens ordered by clinicians for hospital inpatients and outpatients during normal clinical practice from two hospital laboratories in auckland (labplus and counties manukau district health board lab). data from esr also included testing results (severe acute respiratory infection, influenza-like illness [ili]) from its national influenza centre for public health surveillance and from wellington-based community cohorts. canterbury health laboratories is a reference laboratory that provides services to general practice surgeries and hospitals in the canterbury district health board region. the proportion of positive tests (referred to as virus activity) was calculated and smoothed using a 3-week, centred moving average. covid-19 notification data australian and new zealand covid-19 notification data were sourced from our world in data (https://ourworldindata.org) on 7 march 2022.9 public health and social measures different phsms were adopted by the five study regions (nsw, wa, auckland, canterbury and wellington) (supplementary table 1). moreover, the intensity of these measures changed throughout the study period.10,11 google mobility data sourced on 6 october 2021 were used as an indicator of compliance with phsms.12 using mapping apps, google mobility data capture the daily movements of people with an android device relative to a baseline period. google provides these data in the form of covid-19 community mobility reports, expressed as a daily percentage change relative to a 5-week baseline usually only causes mild or asymptomatic infections. respiratory syncytial virus (rsv) and human metapneumovirus (hmpv) can cause severe disease in infants, children, elderly adults and immunocompromised patients.6 human rhinoviruses, one of the most commonly reported viruses in childcare centres where it is not uncommon for children to experience multiple infections in the same season, are almost invariably associated with mild disease.7 likewise, human adenoviruses usually only cause mild symptoms, but they have occasionally been associated with severe nosocomial outbreaks.8 in the temperate zones, most of these common respiratory viruses have tended to exhibit predictable seasonal patterns, with activity levels peaking in the winter months. respiratory virus surveillance systems are designed to correspond to this seasonality and may be activated only during the winter months; however, most systems retain the capacity to be reactivated out of season in order to detect and monitor unexpected outbreaks.2 the emergence of severe acute respiratory syndrome coronavirus 2 (sars-cov-2), currently characterized as an endemic respiratory virus without a clearly defined seasonality, has highlighted the importance of having systems capable of detecting and monitoring any variations in seasonal respiratory virus activity in order to inform clinical management, public health planning and resource allocation. here we describe respiratory virus activity from january 2020 to august 2021 in selected regions of australia and new zealand. methods study populations the study was conducted using data from five regions: new south wales (nsw) and western australia (wa) in australia; and auckland, canterbury and wellington in new zealand. these represent geographically diverse locations (fig. 1) that experienced different levels of covid-19 restrictions and sars-cov-2 activity. laboratory-based surveillance laboratory data routinely collected as part of regional public health surveillance were prospectively collated. data were provided by (i) centre for infectious diseases and microbiology laboratory services, nsw health pathology-institute of clinical pathology and microbiology research (icpmr), westmead, nsw; (ii) pathwest https://ourworldindata.org https://ourworldindata.org wpsar vol 14, no 3, 2023 | doi: 10.5365/wpsar.2023.14.3.948https://ojs.wpro.who.int/ 3 circulation of respiratory viruses during the covid-19 pandemic in australia and new zealando’neill et al covid-19) respiratory viruses were rhinoviruses and rsv, followed by piv-1–3 in all regions. all of these non-covid-19 respiratory virus outbreaks occurred in the absence of any substantial sars-cov-2 circulation (fig. 2). mobility data showed that mobility in all five regions dropped below baseline levels before or shortly after the introduction of covid-19 restrictions. in nsw, restrictions were introduced on 18 march 2020 (week 11), with a reduction in mobility observed in week 11 (fig. 3). in wa, restrictions were introduced on 23 march 2020 (week 12), with a reduction in mobility observed from week 10. in auckland, wellington and canterbury, restrictions were introduced on 21 march 2020 (week 11), with a reduction in mobility observed in week 12 (fig. 3, supplementary table 1).11 the only region reporting mobility above baseline levels after the introduction of restrictions was canterbury, which peaked at 2% above baseline in week 19, 2021 (fig. 3). overall, mobility data showed an inverse relationship with restriction levels, with mobility decreasing as restrictions increased in all regions (fig. 3). in all regions, outbreaks of rhinoviruses, rsv, piv-1–3 and adenoviruses in 2020–2021 coincided with lower levels of restrictions and higher levels of population mobility (fig. 3). in contrast, increases in hmpv activity were for the most part observed at a time when mobility levels were decreasing; the only exception was wa, where hmpv activity increased as mobility increased (fig. 3). period (3 january–6 february 2020) for six key mobility categories.12 for each of the five regions, the daily average percentage change for three mobility categories (retail and recreation, transit stations, workplaces) was calculated. the other mobility categories (i.e. grocery and pharmacy, parks, residential) were excluded, as these activities were allowed even during periods of the most restrictive phsms in all regions and thus unlikely to reflect phsm compliance. the proportion of change from baseline was smoothed using a 3-week, centred moving average, and plotted in a time series along with local phsms and respiratory virus activity. data were analysed using r version 4.0.4 (r project for statistical computing). results the amount of respiratory specimen testing for influenza and other respiratory viruses varied by region and year. in february 2020, both countries experienced their first wave of covid-19 notifications (fig. 2), and in response, respiratory virus testing (excluding covid-19) in all regions increased (fig. 3). by august 2021, the end of our study period, respiratory virus testing rates in all regions had not returned to their usual seasonal patterns. in all regions, influenza was the most commonly detected respiratory virus in 2017–2019, followed by rhinoviruses and rsv. in contrast, between april 2020 and august 2021, the most commonly detected (nonfig. 1. geographical representation of the five study regions in (a) australia and (b) new zealand 100s 150s 200s 250s 300s 350s 400s 450s 1000e 1100e 1200e 1300e 1400e 1500e 1600e 1700e 1660e la ti tu d e la ti tu d e longitudelongitude (a) australia (b) new zealand 480s 460s 440s 420s 400s 380s 360s 340s 1680e 1700e 1720e 1740e 1760e 1780e western australia new south wales auckland wellington canterbury wpsar vol 14, no 3, 2023 | doi: 10.5365/wpsar.2023.14.3.948 https://ojs.wpro.who.int/4 o’neill et alcirculation of respiratory viruses during the covid-19 pandemic in australia and new zealand activity. rsv and piv-1–3 both showed a delay in their usual seasonal pattern. once they returned, both viruses experienced rates of activity above their 2017–2019 levels; however, in both cases, the timing of the increased activity differed between the two countries. below we discuss some of the factors that likely contributed to these observed patterns in post-pandemic non-covid-19 respiratory virus activity. the nature of the relationship between infectious disease activity and mobility – specifically how, where and when people move – is well established.13 generally discussion we observed variable respiratory virus activity in five regions of australia and new zealand following the start of the covid-19 pandemic in february 2020, with the notable exception of influenza, which did not circulate in either australia or new zealand during the pandemic period studied. after the relaxation of phsms in may 2020, adenovirus and rhinovirus activity increased above 2017–2019 levels in most regions (fig. 3). in comparison, hmpv activity only began to rise in the autumn/winter of 2021 (i.e. may to august) after 18 months of low fig. 2. new weekly covid-19 notifications in (a) australia and (b) new zealand against mobility data and level of restrictions, 2020–2021 (up to week 36, 2021) restrictions: mobility: mobility: -80 -60 -40 -20 0 restrictions: level 1 level 2 level 3 level 4 0 4000 8000 12 000 w52 2019 w04 2020 w08 2020 w12 2020 w16 2020 w20 2020 w24 2020 w28 2020 w32 2020 w36 2020 w40 2020 w44 2020 w48 2020 w52 2020 w04 2021 w08 2021 w12 2021 w16 2021 w20 2021 w24 2021 w28 2021 w32 2021 w36 2021 n u m b er o f c o v id -1 9 n o ti fic at io n s (a) australia 0 200 400 600 w52 2019 w04 2020 w08 2020 w12 2020 w16 2020 w20 2020 w24 2020 w28 2020 w32 2020 w36 2020 w40 2020 w44 2020 w48 2020 w52 2020 w04 2021 w08 2021 w12 2021 w16 2021 w20 2021 w24 2021 w28 2021 w32 2021 w36 2021 week and year n u m b er o f c o v id -1 9 n o ti fic at io n s (b) new zealand a b covid-19 notifications (3-week moving average). google mobility data are expressed as a percentage change from a 5-week baseline period. restriction levels are summarized in supplementary table 1. the highest level of restrictions and corresponding google mobility in each region are displayed (nsw in australia; auckland and wellington in new zealand). grey shading indicates the period of quarantine-free travel between australia (16 october 2020 to 22 june 2021) and new zealand (19 april to 22 june 2021). in the case of australia, the peak labelled (a) indicates a time when covid-19 cases were driven by an outbreak in victoria, while the peak labelled (b) indicates a time when covid-19 cases were driven by outbreaks in nsw and victoria. wpsar vol 14, no 3, 2023 | doi: 10.5365/wpsar.2023.14.3.948https://ojs.wpro.who.int/ 5 circulation of respiratory viruses during the covid-19 pandemic in australia and new zealando’neill et al fig. 3. seasonal respiratory virus activity in selected regions of (a, b) new zealand and (c, d) australia against mobility data and level of restrictions, 2017–2021 (up to week 36, 2021) google mobility data are expressed as a percentage change from a 5-week baseline period. restriction levels are summarized in supplementary table 1. grey shading indicates the period of quarantine-free travel between australia (16 october 2020 to 22 june 2021) and new zealand (19 april to 22 june 2021). virus activity is denoted by the percentage of samples testing positive for respiratory viruses (3-week moving average) and is shown as a heat map by week. hmpv: human metapneumovirus; piv-1–3: parainfluenza virus types 1, 2 and 3; rsv: respiratory syncytial virus. restrictions: mobility:influenza tests other respiratory tests (excluding covid-19) 0 500 1000 1500 to ta l t es ts (a) auckland & wellington adenovirus hmpv influenza piv-1–3 rhinovirus rsv rsv/influenza tests other respiratory tests (excluding covid-19) 0 250 500 to ta l t es ts (b) canterbury adenovirus hmpv influenza piv-1–3 rhinovirus rsv respiratory virus tests (excluding covid-19) 0 1500 3000 4500 to ta l t es ts (c) new south wales adenovirus hmpv influenza piv-1–3 rhinovirus rsv respiratory tests (excluding covid-19) rhinovirus tests 0 500 1000 1500 to ta l t es ts (d) western australia adenovirus hmpv influenza piv-1–3 rhinovirus rsv w01 2017 w13 2017 w25 2017 w37 2017 w49 2017 w09 2018 w21 2018 w33 2018 w45 2018 w04 2019 w16 2019 w28 2019 w40 2019 w52 2019 w12 2020 w24 2020 w36 2020 w48 2020 w08 2021 w20 2021 w32 2021 week and year mobility: restrictions: -80 -60 -40 -20 0 level 4level 3level 2level 1per cent positive: 0 10 20 30 40 50 wpsar vol 14, no 3, 2023 | doi: 10.5365/wpsar.2023.14.3.948 https://ojs.wpro.who.int/6 o’neill et alcirculation of respiratory viruses during the covid-19 pandemic in australia and new zealand testing centres were established within and outside medical facilities, providing the community with free and rapid access to sars-cov-2 testing. while most of the new capacity provided by the private laboratories was restricted to sars-cov-2 only, a number of public health laboratories continued to screen samples for other respiratory viruses.17,18 although all regions experienced a reduction in testing capacity during the early stage of the pandemic due to pressures on staff availability, testing reagents and equipment,17,18 nsw, wa, auckland and wellington were able to increase their testing rates for other respiratory viruses. the introduction of rapid sars-cov-2 naat and multiplex naat, which target sars-cov-2 and other respiratory viruses simultaneously, likely played a role in enabling these regions to not only maintain but even increase their testing rates for non-sars-cov-2 respiratory viruses.19 the relatively lower levels of testing in canterbury can be attributed to the inclusion of data captured by public health surveillance programmes in the auckland and wellington datasets, whereas the canterbury dataset only included the results of testing in hospitals and general practice surgeries. additionally, after the closure of international borders in new zealand, canterbury implemented a stricter respiratory virus testing triaging system, which limited availability of multiplex respiratory virus testing to hospitalized patients. however, while increased testing may explain the increased detection of rhinoviruses and adenoviruses in 2020, it is unlikely to be a major contributor to the observed resurgence in adenovirus and rhinovirus activity, given the concurrent increase in activity of both viruses in canterbury, where respiratory virus testing rates were significantly lower than in auckland and wellington. we consider it unlikely that stringent phsms alone resulted in substantial decreases in the transmission of influenza and some other respiratory viruses that we observed during 2020 and suggest that viral displacement and interference could have played a contributory role. viral interference between respiratory viruses, whereby two viruses interact within a host, has been well documented.20,21 for example, a rhinovirus outbreak in 2009 is believed to have delayed the arrival of the 2009 influenza a (h1n1) pandemic in some european countries.22,23 evidence of similar interactions between sars-cov-2 and other viruses is now beginning to emerge; one recent study found prior infection with rhinoviruses reduced the speaking, as mobility increases, the number of contacts or interactions between contagious and susceptible individuals also increases, resulting in an increase in virus prevalence and an outbreak of a communicable disease. the reverse is also generally true; as mobility declines, so too does respiratory virus activity. we observed reductions in population mobility coinciding with increased phsms in all five regions since march 2020. overall, mobility remained below the pre-pandemic baseline in all regions, apart from a short period in canterbury. an early measure to contain the spread of sarscov-2 was the closure of schools, with classes moving to online and home learning. schools in new zealand and wa reopened on 18 may 2020, while in nsw schools never officially closed but students were encouraged to learn from home from 24 march to 22 may 2020.10,11 the initial decline and subsequent resurgence of adenoviruses and rhinoviruses in 2020 corresponded with the relaxation of some phsms and the reopening of schools, supporting the role of children in their circulation. interestingly, the subsequent reintroduction of more restrictive phsms including school closures did not appear to reduce their activity. possible explanations for this observation include the non-enveloped features of rhinoviruses and adenoviruses (which may make them more durable),14 and post-covid-19 changes in respiratory testing patterns. non-enveloped viruses such as adenoviruses and rhinoviruses are unique among the viruses included in this study in that they have some heat-resistant properties and can survive some disinfection processes including handwashing.14 in addition, it has been suggested that surgical face masks are not particularly effective at reducing the emission of rhinovirus particles (aerosols and droplets).15 given that in both countries mandatory mask use was limited to times with stricter restrictions and only recommended at other times (supplementary table 1), it seems likely that at least some of the covid-19 infection control measures may have been less effective against adenovirus and rhinovirus transmission and this allowed these viruses to continue to circulate despite the reintroduction of more restrictive phsms. changes in the volume of, and in the way in which the public accessed, respiratory virus testing may also have played a role in the observed patterns of adenovirus and rhinovirus activity.16 in both countries, covid-19 wpsar vol 14, no 3, 2023 | doi: 10.5365/wpsar.2023.14.3.948https://ojs.wpro.who.int/ 7 circulation of respiratory viruses during the covid-19 pandemic in australia and new zealando’neill et al seen at the end of 2021.29 in contrast, rsv activity in nsw returned to its normal seasonality in 2021, with no out-of-season activity reported during the 2021–2022 summer season.30 in both countries, high influenza vaccination rates could have contributed to the observed low influenza activity. this is unlikely to have been a key factor, as in 2020, australia and new zealand reported their highestever rates of influenza vaccinations.31,32 however, influenza vaccination rates were significantly lower in both countries in 2021,31,32 possibly due to interference with covid-19 vaccination campaigns and complacency due to low influenza activity. it is highly improbable that circulating influenza viruses were less transmissible as influenza viruses have continued to circulate in various parts of the world such as western africa and china since the start of the covid-19 outbreak.33 past pandemics have shown that we need to be prepared for unpredictable resurgences in respiratory viruses, including out-of-season outbreaks.22,34 in this respect at least, the covid-19 pandemic is not exceptional. the observed out-of-season outbreaks of rsv28 were not entirely unexpected given that modelling studies had predicted an rsv resurgence after the relaxation of phsms. it is also likely that rsv seasonality will take several years to return to its pre-pandemic pattern.35 as fewer people are exposed to (and infected with) respiratory viruses, population immunity decreases and the chance of more substantial outbreaks increases. when influenza returns, low rates of influenza vaccination and a possible mismatch between circulating viruses and vaccines (due to low influenza numbers in 2020 and 2021 and geographic differences in virus circulation) could increase population susceptibility and lead to larger outbreaks with more cases of severe disease. as covid-19 vaccination rates rise and countries relax phsms, including easing of travel restrictions and reopening borders, respiratory virus activity will need to be closely monitored.36,37 this study has several limitations. first, laboratory surveillance is passive and subject to selection bias due to the subjectivity of health-care providers testing patients and variations in health-seeking behaviours. moreover, rapid pcr testing at canterbury health laboratories and reported by esr only detects influenza a/b viruses and rsv, whereas standard multiplex pcr testing used by the other surveillance programmes and laboratories is ability of sars-cov-2 to replicate in respiratory tract epithelium,24 suggesting that the immune-mediated effects of rhinoviruses, a common and generally mild respiratory virus, might provide a low level of protection against both sars-cov-2 infection and severe covid-19 disease. similarly, viral displacement and interference may have contributed to the delayed rise in hmpv, a rise that we observed only towards the end of the study period at a time when rsv activity was either low (as in nsw and wa) or waning after an outbreak (as in auckland, canterbury and wellington). evidence to support this hypothesis comes from a pre-pandemic study on circulating respiratory viruses conducted in victoria, australia, which found that rsv protected against a subsequent hmpv infection.21 domestic and international travel have previously been linked to the introduction and subsequent spread of influenza,25,26 and our data suggest that the lifting of restrictions may have played a role in the spread of several non-covid-19 respiratory viruses. after march 2020, international travel was severely limited in both countries, and strict border restrictions were in place throughout 2020–2021 (supplementary table 1). apart from short-lived travel bubbles between some australian states and new zealand, both countries required all international arrivals to undergo government-managed 14-day quarantine. additionally, during covid-19 outbreaks, domestic travel was severely restricted, with travellers from locations with current covid-19 outbreaks prevented from entering another region or required to self-isolate on arrival for 14 days and to restrict movement within these cities (supplementary table 1). however, shortly after new zealand allowed people from australia to enter the country without quarantining, a resurgence in rsv activity was observed, leading to speculation that australian travellers reseeded rsv in new zealand in april 2021. before the travel bubble with australia was introduced, rsv activity was below 1% in new zealand but above 5% in nsw and wa. this, coupled with the fact that there is no known non-human reservoir for rsv,27 does suggest international travel was the most likely cause of the increased rsv activity observed in new zealand in 2021. sequencing data support the hypothesis that rsv was imported from nsw into victoria, australia in 2020 after the second covid-19 wave.28 however, the lifting of travel restrictions does not explain the rise of rsv in wa in 2020 or the second out-of-season peak that was wpsar vol 14, no 3, 2023 | doi: 10.5365/wpsar.2023.14.3.948 https://ojs.wpro.who.int/8 o’neill et alcirculation of respiratory viruses during the covid-19 pandemic in australia and new zealand funding the melbourne who collaborating centre for reference and research on influenza is supported by the australian government department of health. the opinions expressed in this paper are those of the authors and do not necessarily represent the views of the department. references 1. willis o. australia is flattening the curve. but should we try to squash it like new zealand? sydney: abc news; 2020. available from: https://www.abc.net.au/news/health/2020-04-15/coronavirus-elimination-australia-new-zealand/12150302, accessed 23 july 2023. 2. huang qs, wood t, jelley l, jennings t, jefferies s, daniells k, et al. impact of the covid-19 nonpharmaceutical interventions on influenza and other respiratory viral infections in new zealand. nat commun. 2021;12(1):1001. doi:10.1038/s41467-021-21157-9 pmid:33579926 3. iuliano ad, roguski km, chang hh, muscatello dj, palekar r, tempia s, et al. estimates of global seasonal influenzaassociated respiratory mortality: a modelling study. lancet. 2018;391(10127):1285–300. doi:10.1016/s01406736(17)33293-2 pmid:29248255 4. jin x, ren j, li r, gao y, zhang h, li j, et al. global burden of upper respiratory infections in 204 countries and territories, from 1990 to 2019. eclinicalmedicine. 2021;37:100986. doi:10.1016/j. eclinm.2021.100986 pmid:34386754 5. wang x, li y, deloria-knoll m, madhi sa, cohen c, arguelles vl, et al. global burden of acute lower respiratory infection associated with human parainfluenza virus in children younger than 5 years for 2018: a systematic review and meta-analysis. lancet glob health. 2021;9(8):e1077–87. doi:10.1016/s2214-109x(21)00218-7 pmid:34166626 6. kinder jt, moncman cl, barrett c, jin h, kallewaard n, dutch re. respiratory syncytial virus and human metapneumovirus infections in three-dimensional human airway tissues expose an interesting dichotomy in viral replication, spread, and inhibition by neutralizing antibodies. j virol. 2020;94(20):e01068-20. doi:10.1128/ jvi.01068-20 pmid:32759319 7. martin et, kuypers j, chu hy, foote s, hashikawa a, fairchok mp, et al. heterotypic infection and spread of rhinovirus a, b, and c among childcare attendees. j infect dis. 2018;218(6):848–55. doi:10.1093/infdis/jiy232 pmid:29684211 8. cassir n, hraiech s, nougairede a, zandotti c, fournier pe, papazian l. outbreak of adenovirus type 1 severe pneumonia in a french intensive care unit, september–october 2012. euro surveill. 2014;19(39):20914. doi:10.2807/1560-7917. es2014.19.39.20914 pmid:25306980 9. ritchie h, mathieu e, rodés-guirao l, appel c, giattino c, ortiz-ospina e, et al. coronavirus pandemic (covid-19): confirmed cases. ourworldindata.org; 2022. available from: https:// github.com/owid/covid-19-data/tree/master/public/data, accessed 7 march 2022. 10. implementation progress towards covid normal: as of announcements @ 1600hrs 24 december 2020. canberra: australian government, department of the prime minister and cabinet; 2021. available from: https://www.pmc.gov.au/sites/default/files/publications/covid-19-restrictions-tracker-20201224.pdf, accessed 20 october 2021. 11. history of the covid-19 alert system: wellington: new zealand government; 2021. available from: https://covid19.govt.nz/alertlevels-and-updates/history-of-the-covid-19-alert-system/, accessed 15 october 2021. capable of detecting a wider range of clinically relevant respiratory viruses, including human rhinoviruses, hmpv, piv and human adenoviruses. additionally, it is difficult to determine the proportion of testing that was provided by public health laboratories as testing conducted by private pathology services was not included in this analysis. the impact of changes in testing processes and reporting mechanisms at public health laboratories overburdened with sars-cov-2 testing over the period of our analysis is also difficult to assess. finally, it is unlikely that our baseline mobility is a true reflection of pre-pandemic mobility. google mobility data reflected the movement of people with an android device using mapping apps relative to a 5-week baseline period (3 january–6 february 2020). google mobility baseline data in australia were collected during the 2019–2020 bushfire season, with active bushfires in nsw and wa occurring during the entire 5-week baseline period. furthermore, the baseline period largely coincided with school holidays in australia and new zealand, a period during which mobility patterns are different.38 conclusion seasonal respiratory virus circulation patterns have been disrupted during the covid-19 pandemic. epidemics of some viruses such as rsv have been observed out of season and with greater intensity than in the past. it is likely to take several years for respiratory viruses to return to their characteristic, pre-pandemic seasonal patterns. during this period, health-care systems should not rely on historical seasonal patterns to inform resource allocation and interventions. this study also serves to underscore the importance of surveillance systems with real-time data that can signal relevant epidemiological information back to clinicians and so prompt timely public health action and response. conflicts of interest the authors have no conflicts of interest to declare. ethics statement laboratory-based respiratory virus surveillance data were collected following relevant public health acts in each region under public health surveillance. as a result, ethical approval was not deemed necessary for the collection and use of these data. wpsar vol 14, no 3, 2023 | doi: 10.5365/wpsar.2023.14.3.948https://ojs.wpro.who.int/ 9 circulation of respiratory viruses during the covid-19 pandemic in australia and new zealando’neill et al 26. geoghegan jl, saavedra af, duchene s, sullivan s, barr i, holmes ec. continental synchronicity of human influenza virus epidemics despite climatic variation. plos pathog. 2018;14(1):e1006780. doi:10.1371/journal.ppat.1006780 pmid:29324895 27. di mattia g, nenna r, mancino e, rizzo v, pierangeli a, villani a, et al. during the covid-19 pandemic where has respiratory syncytial virus gone? pediatr pulmonol. 2021;56(10):3106–9. doi:10.1002/ ppul.25582 pmid:34273135 28. eden js, sikazwe c, xie r, deng ym, sullivan sg, michie a, et al. off-season rsv epidemics in australia after easing of covid-19 restrictions. nat commun. 2022;13(1):2884. doi:10.1038/s41467022-30485-3 pmid:35610217 29. paediatric respiratory pathogen report week 52, 27th december 2021 – 02nd january 2021. perth: pathwest laboratory medicine wa; 2022. available from: https://ww2.health.wa.gov.au/~/media/ corp/documents/health-for/infectious-disease/paediatric-respiratory-pathogen-weekly-report/2021/paediatric-respiratory-pathogen-report-week-52.pdf, accessed 26 july 2022. 30. covid-19 weekly surveillance in nsw: epidemiological week 51 ending 25 december 2021. sydney: nsw government, ministry of health; 2022. available from: https://www.health.nsw.gov.au/infectious/covid-19/documents/covid-19-surveillance-report-20220107. pdf, accessed 26 july 2022. 31. influenza dashboard: vaccination. porirua, new zealand: institute of environmental science and research; 2021. available from: https://www.esr.cri.nz/our-services/consultancy/flu-surveillance-andresearch, accessed 22 october 2021. 32. van buynder pg, newbound a, macintyre cr, kennedy at, clarke c, anderson j. australian experience of the sh21 flu vaccination program during the covid-19 vaccine program. hum vaccin immunother. 2021;17(11):1–6. doi:10.1080/21645515.2021.19670 42 pmid:34542384 33. influenza surveillance outputs. geneva: world health organization global influenza programme; 2022. available from: https:// www.who.int/teams/global-influenza-programme/surveillanceand-monitoring/influenza-surveillance-outputs, accessed 9 march 2022. 34. lo jy, tsang th, leung yh, yeung ey, wu t, lim ww. respiratory infections during sars outbreak, hong kong, 2003. emerg infect dis. 2005;11(11):1738–41. doi:10.3201/eid1111.050729 pmid:16318726 35. baker re, park sw, yang w, vecchi ga, metcalf cje, grenfell bt. the impact of covid-19 nonpharmaceutical interventions on the future dynamics of endemic infections. proc natl acad sci u s a. 2020;117(48):30547–53. doi:10.1073/pnas.2013182117 pmid:33168723 36. roadmap for easing covid-19 restrictions. sydney: nsw government; 2021. available from: https://www.nsw.gov.au/covid-19/ easing-covid-19-restrictions, accessed 13 october 2021. 37. new zealand pm jacinda ardern abandons plans for covid-19 elimination as auckland plans to reopen in phases. abc news; 2021. available from: https://www.abc.net.au/news/2021-10-04/ new-zealand-extends-auckland-lockdown-but-eases-some-coronavirus/100512666, accessed 26 july 2022. 38. ruktanonchai nw, sadilek a, woods d, tatem aj, steele je, sorichetta a. practical geospatial and sociodemographic predictors of human mobility. sci rep. 2021;11(1):15389. doi:10.1038/ s41598-021-94683-7 pmid:34321509 12. covid-19 community mobility reports. mountain view (ca): google llc; 2021. available from: https://www.google.com/covid19/ mobility/, accessed 6 october 2021. 13. findlater a, bogoch ii. human mobility and the global spread of infectious diseases: a focus on air travel. trends parasitol. 2018;34(9):772–83. doi:10.1016/j.pt.2018.07.004 pmid:30049602 14. leung nhl. transmissibility and transmission of respiratory viruses. nat rev microbiol. 2021;19(8):528–45. doi:10.1038/s41579021-00535-6 pmid:33753932 15. leung nhl, chu dkw, shiu eyc, chan kh, mcdevitt jj, hau bjp, et al. respiratory virus shedding in exhaled breath and efficacy of face masks. nat med. 2020;26(5):676–80. doi:10.1038/s41591020-0843-2 pmid:32371934 16. atmore c, stokes t. turning on a dime–preand post-covid-19 consultation patterns in an urban general practice. n z med j. 2020;133(1523):65–75. pmid:33032304 17. covid-19 testing strategy for aotearoa new zealand. wellington: new zealand government, ministry of health; 2021. p. 14. available from: https://www.beehive.govt.nz/sites/default/files/2021-10/ covid-19%20testing%20rapid%20review%20report.pdf, accessed 22 august 2022. 18. submission: inquiry into the victorian government’s response to the covid-19 pandemic. submission no. 224. queensland: public pathology australia; 2020. available from: https://parliament.vic.gov.au/images/stories/committees/paec/covid-19_inquiry/submissions/224._ public_pathology_australia.pdf, accessed 26 july 2022. 19. coronavirus (covid-19) – testing framework for covid-19 in australia. canberra: australian government department of health; 2021. available from: https://www.health.gov.au/sites/default/files/ documents/2021/02/coronavirus-covid-19-testing-framework-forcovid-19-in-australia.pdf, accessed 22 august 2022. 20. nickbakhsh s, mair c, matthews l, reeve r, johnson pcd, thorburn f, et al. virus-virus interactions impact the population dynamics of influenza and the common cold. proc natl acad sci u s a. 2019;116(52):27142–50. doi:10.1073/pnas.1911083116 pmid:31843887 21. price oh, sullivan sg, sutterby c, druce j, carville ks. using routine testing data to understand circulation patterns of influenza a, respiratory syncytial virus and other respiratory viruses in victoria, australia. epidemiol infect. 2019;147:e221. doi:10.1017/ s0950268819001055 pmid:31364539 22. mak gc, wong ah, ho wy, lim w. the impact of pandemic influenza a (h1n1) 2009 on the circulation of respiratory viruses 2009–2011. influenza other respir viruses. 2012;6(3):e6–10. doi:10.1111/j.1750-2659.2011.00323.x pmid:22212717 23. casalegno js, ottmann m, duchamp mb, escuret v, billaud g, frobert e, et al. rhinoviruses delayed the circulation of the pandemic influenza a (h1n1) 2009 virus in france. clin microbiol infect. 2010;16(4):326–9. doi:10.1111/j.1469-0691.2010.03167.x pmid:20121829 24. dee k, goldfarb dm, haney j, amat jar, herder v, stewart m, et al. human rhinovirus infection blocks severe acute respiratory syndrome coronavirus 2 replication within the respiratory epithelium: implications for covid-19 epidemiology. j infect dis. 2021;224(1):31–8. doi:10.1093/infdis/jiab147 pmid:33754149 25. bedford t, cobey s, beerli p, pascual m. global migration dynamics underlie evolution and persistence of human influenza a (h3n2). plos pathog. 2010;6(5):e1000918. doi:10.1371/journal. ppat.1000918 pmid:20523898 https://www.google.com/covid19/mobility/ https://www.beehive.govt.nz/sites/default/files/2021-10/covid-19%20testing%20rapid%20review%20report.pdf https://parliament.vic.gov.au/images/stories/committees/paec/covid-19_inquiry/submissions/224._public_pathology_australia.pdf https://www.health.gov.au/sites/default/files/documents/2021/02/coronavirus-covid-19-testing-framework-forcovid-19-in-australia.pdf https://ww2.health.wa.gov.au/~/media/corp/documents/health-for/infectious-disease/paediatric-respiratory-pathogen-weekly-report/2021/paediatric-respiratory-pathogen-report-week-52.pdf https://www.health.nsw.gov.au/infectious/covid-19/documents/covid-19-surveillance-report-20220107.pdf https://www.nsw.gov.au/covid-19/easing-covid-19-restrictions https://www.abc.net.au/news/2021-10-04/new-zealand-extends-auckland-lockdown-but-eases-some-coronavirus/100512666 https://ojs.wpro.who.int/ 1wpsar vol 12, no 4, 2021 | doi: 10.5365/wpsar.2021.12.4.852 covid-19: original research c oronavirus disease 2019 (covid-19), caused by severe acute respiratory syndrome coronavirus 2 (sars-cov-2), primarily targets the respiratory system. in december 2019, an epidemiological alert was released in china following a rise in cases of pneumonia of unknown cause. the philippines announced its first confirmed case on 31 january 2020.1,2 the world health organization (who) officially declared a global pandemic on 11 march 2020, by which time the philippines already had 49 confirmed cases, largely in the national capital region.2 baguio city is located north of manila, within the cordillera central mountain range in northern luzon. the estimated population is 345 000, with adults (aged 19–60 years) and those aged over 60 years comprising 52% and 6.6% of the population, respectively.3 leading causes of morbidity include hypertension, diabetes, bronchitis and asthma.4 the first confirmed case in baguio city was recorded on the city’s ninth day of quarantine during march 2020, with local sustained transmission declared six months later.5 worldwide, by the end of october 2020, there were 43 623 111 confirmed cases and 1 161 311 deaths. at that time in the philippines, cases had risen a department of internal medicine, baguio general hospital and medical center, baguio city, philippines. published: 11 november 2021 doi: 10.5365/wpsar.2021.12.4.852 objective: coronavirus disease 2019 (covid-19), caused by severe acute respiratory syndrome coronavirus 2 (sars-cov-2), primarily targets the respiratory system. this study describes the characteristics associated with mortality among patients infected with sars-cov-2 at a single hospital in baguio city, philippines. methods: we reviewed medical records (including history, laboratory results and treatment regimen) of 280 confirmed covid-19 patients admitted to a single hospital during march–october 2020. clinical characteristics and outcomes (frequency and type of complication, recovery rate and mortality) were evaluated. multiple logistic regression was used to analyse factors associated with mortality. results: the mean age of covid-19 patients was 48.4 years and the female-to-male ratio was 1.8:1. hypertension, cardiovascular disease (cvd) and diabetes were the most frequent comorbidities reported. common presenting symptoms were respiratory and constitutional, with 41% of patients not reporting symptoms on admission. patients with moderate, severe and critical disease comprised 45%, 8% and 4%, respectively. a total of 15% had complications, health careassociated pneumonia being the most frequent complication. the recovery rate was 95%; 5% of patients died, with multiorgan failure being the most common cause. the presence of cvd, chronic kidney disease, prolonged prothrombin time and elevated lactate dehydrogenase (ldh) were associated with mortality. discussion: most covid-19 patients in our population had asymptomatic to moderate disease on admission. mortality from covid-19 was associated with having cvd, chronic kidney disease, elevated ldh and prolonged prothrombin time. based on these results, we emphasize that people should take all necessary precautions to avoid infection with sars-cov-2. clinical characteristics and outcomes of covid-19 patients in a tertiary hospital in baguio city, philippines karen joyce c. cortez,a bernard a. demot,a samantha s. bartolo,a dexter d. feliciano,a verna moila p. ciriaco,a imari irish e. labi,a denzelle diane m. viray,a jenna charise m. casuga,a karol anne b. camonayan-flor,a precious mae a. gomez,a marie ellaine n. velasquez,a thea pamela t. cajulao,a jovy e. nigos,a maria lowella f. de leon,a domingo p. solimen,a angelita g. go,a francis m. pizarro,a larry c. haya jr,a ray p. aswat,a virginia b. mangati,a caesar noel i. palaganas,a mylene n. genuino,a kimberley m. cutiyog-ubando,a karen c. tadeo,a marienelle l. longid,a nowell benedict c. catbagan,a joel b. bongotan,a beverly anne t. dominguez-villara and joeffrey b. dalaoa correspondence to karen joyce c. cortez (email: medicine@bghmc.doh.gov.ph) wpsar vol 12, no 4, 2021 | doi: 10.5365/wpsar.2021.12.4.852 https://ojs.wpro.who.int/2 cortez et alclinical characteristics and outcomes of covid-19 patients in a tertiary hospital in baguio city, philippines patients were labelled “asymptomatic” if they had no symptoms; “mild” if they had constitutional and nonspecific symptoms; “moderate” if they had pneumonia but did not require oxygen; “severe” if they had pneumonia plus hypoxemia, tachypnoea or hypotension; and “critical” if they had worsening pneumonia, sepsis or septic shock.11 in our analysis, we explored clinical characteristics and outcomes (frequency and type of complication, recovery rate and mortality) and identified factors associated with mortality in covid-19 patients. median, means, standard deviations and proportions were used to summarize the data. the t-test and chi-squared test were used to test for differences in means and proportions, respectively. the mann-whitney u test was used to compare differences in median values. fisher’s exact test or the chi-squared test was used to examine differences between categorical data. a stepwise analysis model using multiple logistic regression was used to determine which variables were associated with mortality. variables that were statistically significant (p < 0.05) in the univariate analysis were selected. although both disease severity and qsofa were statistically significant at the univariate level, only the former was included in the final model because these two variables had overlapping definitions. epi-info version 7.2.4.0 was used to process the data. results characteristic of cases at hospital admission the mean age of the 280 covid-19 patients was 48.4 years and the majority (64%) were females. two thirds (63%) were aged under 60 years. more than half (62%) had exposure to a known case through either travel or close contact. the majority (58%, 161/280) of cases had at least one comorbidity, and 34% (94/280) had two or more comorbidities, with hypertension, cardiovascular disease (cvd) and diabetes being the most frequent. pregnant patients comprised 16% of the cases and health care workers 23% (table 1a). among pregnant patients, 71% were in their third trimester of pregnancy. upon admission, 59% of patients complained of symptoms, most commonly respiratory (cough, cold or dyspnoea) and constitutional (fever or malaise) in nature. the other 41% did not report symptoms on admission. twenty-one per cent of patients were observed to have to 373 144 and deaths to 7053. baguio city comprised 0.53% of confirmed cases and 0.37% of deaths nationwide.6–8 covid-19 patients in baguio city were admitted and treated in six local hospitals and three community isolation units. many reports describing the characteristics and outcomes of covid-19 in different settings are being published. in this study, we describe the clinical characteristics and outcomes of covid-19 patients and the characteristics associated with mortality at one hospital in baguio city, philippines. methods we conducted a retrospective study of all patients aged over 18 years with covid-19, confirmed by reverse transcription polymerase chain reaction (rt-pcr), who were admitted to a tertiary hospital that was one of the government-mandated covid-19 referral hospitals in baguio city, philippines from 1 march to 27 october 2020. a total of 371 patients were admitted during this period. paediatric cases (n = 80) and cases dead on arrival (n = 9) were excluded. charts were excluded if they lacked information on age, sex, travel history or exposure, official rt-pcr result, complete blood count or chest radiography (n = 2), leaving 280 charts for analysis. the following data were extracted: patient history, exposure, initial laboratory results, treatment and outcome. baseline routine blood examinations included complete blood count, high-sensitivity c-reactive protein, procalcitonin, lactate dehydrogenase (ldh), creatinine, aspartate aminotransferase, alanine transaminase, ferritin, prothrombin time, partial thromboplastin and d-dimer. radiography and computerized tomography were used for chest imaging. on admission, each patient was scored for quick sequential organ failure assessment (qsofa), glasgow coma score and neutrophil-lymphocyte ratio.9,10 standard of care was based on national guidelines that were continuously being updated during the study period.11 medications such as antiviral drugs and immunomodulators were not consistently available. the severity of covid-19 disease was categorized as asymptomatic, mild, moderate, severe and critical. wpsar vol 12, no 4, 2021 | doi: 10.5365/wpsar.2021.12.4.852https://ojs.wpro.who.int/ 3 clinical characteristics and outcomes of covid-19 patients in a tertiary hospital in baguio city, philippinescortez et al table 1a. demographic characteristics of adult covid-19 patients admitted to baguio general hospital and medical center from 1 march to 27 october 2020 clinical characteristics total, n (%) recovered, n (%) died, n (%) p total number of patients 280 267 13 age, years mean ± sd 48.4 ± 18.5 47.7 ± 18.5 62.2 ± 13.5 0.71 18–44 131 (46.8) 129 (48.3) 2 (15.3) 0.01 45–59 44 (15.7) 43 (16.1) 1 (7.7) 60–79 98 (35.0) 88 (33.0) 10 (76.9) ≥80 7 (2.5) 7 (2.6) sex female 179 (64.0) 174 (65.2) 5 (38.5) 0.05 male 101 (36.1) 93 (34.8) 8 (61.5) comorbidities 161 (57.5) 148 (55.4) 13 (100) <0.01 hypertension 124 (44.3) 114 (42.7) 10 (76.9) 0.02 diabetes mellitus 47 (17.0) 45 (16.9) 2 (15.4) 0.62 cardiovascular disease 34 (12.1) 26 (9.7) 8 (61.5) <0.01 bronchial asthma 17 (6.1) 16 (6.0) 1 (7.7) 0.57 malignancy 12 (4.3) 12 (4.5) chronic kidney disease 4 (1.4) 1 (0.4) 3 (23.1) <0.01 chronic obstructive pulmonary disease 3 (1.1) 3 (1.1) number of comorbidities 0 119 (42.5) 119 (44.6) <0.01 1 68 (24.3) 65 (24.3) 3 (23.1) 2 66 (23.6) 59 (22.1) 7 (53.9) >2 27 (9.6) 24 (9.0) 3 (23.1) patient reported symptoms 164 (58.6) 153 (57.3) 11 (84.6) 0.04 cough 111 (39.6) 101 (37.8) 10 (76.9) <0.01 cold 49 (17.5) 48 (18.0) 1 (7.7) 0.30 fever 40 (14.3) 35 (13.1) 5 (38.5) 0.03 malaise 37 (13.2) 31 (11.6) 6 (46.2) <0.01 dyspnoea 35 (12.5) 28 (10.5) 7 (53.9) 0.27 sore throat 26 (9.3) 26 (9.7) headache 24 (8.6) 24 (9.0) anosmia 17 (6.1) 17 (6.4) dysgeusia 14 (5.0) 14 (5.2) anorexia 12 (4.3) 10 (3.8) 2 (15.4) 0.10 diarrhoea 11 (3.9) 11 (4.1) chills 4 (1.4) 2 (0.8) 2 (15.4) 0.01 seizure 2 (0.7) 2 (0.8) disease severity at admission based on national covid-19 case definitions asymptomatic 43 (15.4) 43 (16.1) mild 77 (27.5) 76 (28.5) 1 (7.1) <0.01 moderate 126 (45.0) 123 (46.1) 3 (23.1) severe 23 (8.2) 21 (7.9) 2 (15.4) critical 11 (3.9) 4 (1.5) 7 (53.8) wpsar vol 12, no 4, 2021 | doi: 10.5365/wpsar.2021.12.4.852 https://ojs.wpro.who.int/4 cortez et alclinical characteristics and outcomes of covid-19 patients in a tertiary hospital in baguio city, philippines 4.0–54.0) with the mean hospital stay being 11.7 (±5.6) days (range: 3.0–49.0). for cases who died, the mean time from illness to death was 11.5 days (range: 4.0–29.0) (fig. 2). forty-two (15%) cases had complications, most of whom had moderate to critical disease on admission (32/42) (table 2, fig. 2). health care-associated pneumonia was the most frequent complication. among the 14 patients who developed acute kidney injury, six underwent haemodialysis and none of those six survived. among patients with complications, 30 (71%) recovered and 12 (29%) died. among those who died, many had cardiovascular or renal complications or secondary infections (table 2). treatment of cases antibiotics were prescribed for 73% of cases and antiviral drugs for 55% of cases (table 3). the most common antiviral drugs used were oseltamivir (83/154), favipiravir (54/154), remdesivir (16/154) and lopinavirritonavir (1/154). hydroxychloroquine was administered during march–may 2020, while steroids, particularly dexamethasone, were prescribed to patients from august 2020. supplemental oxygen was used in 11% of cases (table 3). among the seven cases who underwent renal replacement therapy, only one had underlying chronic kidney disease. patients with extrapulmonary syndrome such as stroke, myocardial infarction and seizure were treated according to guidelines for the general population. mortality from covid-19 using multiple logistic regression with a stepwise analysis model, factors associated with mortality in patients with covid-19 were chronic kidney disease, cvd, prothrombin time >15.3 seconds and ldh >400 (table 4). tachypnoea, hypotension or altered mental state. six patients (2.2%) had a qsofa score of at least 2 (table 1a). forty-five per cent of patients were assessed against the national case definitions as having moderate disease. concomitant non-pulmonary syndromes such as stroke and myocardial infarction were noted (table 1a). most patients (93.6%) had procalcitonin <0.5 ng/ ml. many had high-sensitivity c-reactive protein >10 ng/ ml (37%) and ferritin >341 ng/ml (42%). a few had elevations in other inflammatory markers such as ldh, aspartate aminotransferase, alanine transaminase and d-dimer, whereas anaemia, leukopenia and thrombocytopenia were not typical (table 1b). more than half of the population had chest radiography findings, with infiltrates being the most common. computed tomography was available to two thirds (62%) of patients. findings were noted in 71%, ground glass opacity being the most common (table 1b). illness outcomes the overall recovery rate was 95% (267/280), with most recovered cases having asymptomatic to moderate disease on admission. all health care workers and pregnant patients recovered. mortality occurred in 5% (13/280) of patients, with the most common cause of death being multiorgan failure (39%, 5/13). among those who died, most were males in the 60–79-year age group with at least one comorbidity, respiratory symptoms on admission, a qsofa score ≥1 and bilateral lung involvement. nine were assessed as having severe to critical disease at admission (fig. 1). the mean time from illness onset to discharge from hospital for recovered patients was 15.5 days (range: p values <0.05 are italicized. clinical characteristics total, n (%) recovered, n (%) died, n (%) p quick sequential organ failure assessment (qsofa) score 0 228 (81.4) 225 (84.3) 3 (23.1) <0.01 1 46 (16.4) 39 (14.6) 7 (53.9) 2 5 (1.8) 3 (1.1) 2 (15.4) 3 1 (0.4) 0 (0.0) 1 (7.7) glasgow coma score <15 4 (1.4) 1 (0.4) 3 (23.1) <0.01 respiratory rate ≥22 breaths/min 32 (11.4) 24 (9.0) 8 (61.5) <0.01 systolic blood pressure ≤100 mmhg 23 (8.2) 20 (7.5) 3 (23.1) 0.08 wpsar vol 12, no 4, 2021 | doi: 10.5365/wpsar.2021.12.4.852https://ojs.wpro.who.int/ 5 clinical characteristics and outcomes of covid-19 patients in a tertiary hospital in baguio city, philippinescortez et al table 1b. pertinent baseline diagnostic test results of adult covid-19 patients admitted to baguio general hospital and medical center from 1 march to 27 october 2020 diagnostic test reference range total n (range/%) recovered n (range/%) died n (range/%) p serum haemoglobin (g/l) (n = 280) 120–160 141 (131–152) 141 (131–152) 140 (124–142) 0.56 <120 21 (7.5) 20 (7.5) 1 (7.7) 0.65 haematocrit (l/l) (n = 280) 0.37–0.47 0.4 (0.4–0.5) 0.4 (0.4–0.5) 0.4 (0.38–0.41) 0.37 ≥0.47 46 (16.4) 45 (16.9) 1 (7.7) 0.34 leukocytes (109/l) (n = 280) 5–10 7.5 (5.8–9.8) 7.5 (5.8–9.7) 8.0 (6.3–10.9) 0.47 <4 14 (5.0) 14 (5.2) – neutrophil–lymphocyte ratio 1–3 2.5 (1.6–22.8) 2.4 (1.6–3.5) 4.4 (3.2–8.6) <0.01 ≤3 185 (66.1) 182 (68.2) 3 (23.1) <0.01 >3 to <9 83 (29.6) 76 (28.5) 7 (53.9) 0.05 ≥9 12 (4.3) 9 (3.4) 3 (23.1) 0.01 platelets (n = 279) 150–400 253.0 (198–313) 257.0 (202–316) 196.0 (158.5–211.5) <0.01 <125 5 (1.8) 4 (1.5) 1 (8.3) 0.20 high-sensitivity c-reactive protein (mg/l) (n = 264) <5 5.0 (1.5–18.7) 4.7 (1.5–16.0) 83.6 (33.4–131.5) <0.01 5–10 33 (12.5) 33 (13.1) – >10 98 (37.1) 87 (34.5) 11 (91.7) <0.01 procalcitonin (ng/ml) (n = 236) 0.05 (0.02–0.12) 0.05 (0.02–0.11) 1.17 (0.13–1.81) <0.01 <0.5 221 (93.6) 217 (96.4) 4 (36.4) <0.01 lactate dehydrogenase (u/l) (n = 263) <247 216.3 (174.6–285.8) 214.9 (174.3–278.9) 407.6 (236.5–657.3) <0.01 >400 19 (7.2) 12 (4.8) 7 (53.9) <0.01 creatinine (mg/dl) (n = 278) 0.55–1.02 0.71 (0.60–0.86) 0.71 (0.60–0.85) 0.76 (0.71–2.6) 0.04 >1.02 36 (13.0) 30 (11.3) 6 (46.2) <0.01 aspartate aminotransferase (u/l) (n = 277) <35 29.3 (23.2–40.0) 28.8 (22.9–39.0) 52.1 (33.7–86.0) <0.01 >95 12 (4.3) 9 (3.4) 3 (23.1) 0.01 alanine transaminase (u/l) (n = 278) <35 29.6 (17.8–46.0) 28.8 (17.4–44.1) 42.9 (25.0–49.4) 0.09 >95 17 (6.1) 15 (5.7) 2 (15.4) 0.18 ferritin (ng/ml) (n = 190) 4–341 295.0 (68.1–653.7) 281.1 (63.5–604.8) 982.1 (238.7–1611.0) 0.04 >341 80 (42.1) 75 (41.0) 5 (71.4) 0.11 prothrombin time (seconds) (n = 266) 12.1 (11.5–12.8) 12.1 (11.4–12.7) 12.8 (12.3–18.7) <0.01 >15.3 7 (2.6) 2 (0.8) 5 (38.5) <0.01 partial thromboplastin time (seconds) (n = 263) 29.6 (27.7–31.8) 29.5 (27.7–31.8) 33.2 (27.1–39.7) 0.12 >35 24 (9.1) 20 (8.0) 4 (33.3) 0.02 d-dimer (µg/ml) (n = 260) <0.5 0.54 (0.18–1.19) 0.52 (0.34–1.17) 0.94 (0.63–5.36) 0.03 >1 61 (29.6) 57 (28.8) 4 (50.0) 0.18 wpsar vol 12, no 4, 2021 | doi: 10.5365/wpsar.2021.12.4.852 https://ojs.wpro.who.int/6 cortez et alclinical characteristics and outcomes of covid-19 patients in a tertiary hospital in baguio city, philippines diagnostic test reference range total n (range/%) recovered n (range/%) died n (range/%) p imaging chest radiograph n = 276 n = 263 n = 13 patients with findings 151 (54.7) 140 (53.2) 11 (84.6) 0.04 infiltrates 147 (97.4) 139 (99.3) 8 (72.7) <0.01 effusion 2 (1.3) 1 (0.7) 1 (9.1) 0.11 consolidation 3 (2.0) 1 (0.7) 2 (18.2) 0.01 computed tomography n = 174 n = 166 n = 8 patients with findings 124 (71.3) 118 (71.1) 6 (75.0) 1.00 ground glass opacity 111 (89.5) 105 (89.0) 6 (100) 1.00 p values <0.05 are italicized. sd: standard deviation. p values <0.05 are italicized. cauti: catheter-associated urinary tract infection; hcap: health care-associated pneumonia. table 2. frequency of complications in adult covid-19 patients admitted to baguio general hospital and medical center from 1 march to 27 october 2020 complications total n (%) recovered n (%) died n (%) p total number of patients 280 267 13 number of patients with complications 42 (15.0) 30 (11.2) 12 (92.3) <0.01 secondary infection 22 (7.9) 16 (6.0) 6 (46.2) <0.01 hcap 17 (6.1) 13 (4.9) 4 (30.8) <0.01 septic shock 6 (2.1) 2 (0.8) 4 (30.8) <0.01 bacteraemia 3 (1.1) 3 (1.1) cauti 1 (0.4) 1 (7.7) acute kidney injury 14 (5.0) 5 (1.9) 9 (69.2) <0.01 cardiovascular 11 (3.9) 2 (0.8) 9 (69.2) <0.01 myocardial infarction 7 (2.5) 1 (0.4) 6 (46.2) <0.01 fatal arrhythmia 7 (2.5) 1 (0.4) 6 (45.2) <0.01 transaminitis 11 (3.9) 10 (3.8) 1 (7.7) 0.41 haematologic/immunologic 8 (2.9) 4 (1.5) 4 (30.8) <0.01 cytokine storm 4 (1.4) 2 (0.8) 2 (15.4) 0.01 thrombocytopenia 3 (1.1) 1 (0.4) 2 (15.4) 0.01 leukopenia 1 (0.4) 1 (0.4) neurological 2 (0.7) 2 (15.4) seizure 1 (0.4) 1 (7.7) stroke (ischaemic) 2 (0.7) 2 (15.4) wpsar vol 12, no 4, 2021 | doi: 10.5365/wpsar.2021.12.4.852https://ojs.wpro.who.int/ 7 clinical characteristics and outcomes of covid-19 patients in a tertiary hospital in baguio city, philippinescortez et al p values <0.05 are italicized. table 3. treatment modalities of adult covid-19 patients admitted to baguio general hospital and medical center from 1 march to 27 october 2020 fig. 1. outcomes of adult patients with covid-19 based on disease severity on admission to baguio general hospital and medical center (n = 280) treatment total n (%) recovered n (%) died n (%) p total number of patients 280 267 13 antibiotics 203 (72.5) 192 (71.9) 11 (84.6) 0.26 antivirals 154 (55.0) 149 (55.8) 5 (38.5) 0.17 immunomodulators 70 (25.0) 61 (22.9) 9 (69.2) <0.01 hydroxychloroquine 25 (8.9) 24 (9.0) 1 (7.7) 0.67 corticosteroids 45 (16.1) 37 (13.9) 8 (61.5) <0.01 intravenous immunoglobulin 4 (1.4) 3 (1.1) 1 (7.7) 0.17 tocilizumab 3 (1.1) 2 (0.8) 1 (7.7) 0.13 oxygen support 32 (11.4) 24 (9.0) 8 (2.9) <0.01 nasal cannula 24 (8.6) 21 (7.9) 3 (23.1) 0.09 face mask 3 (1.1) 1 (0.4) 2 (15.4) 0.01 invasive mechanical ventilation 5 (1.8) 2 (0.8) 3 (23.1) <0.01 renal replacement therapy 7 (2.5) 1 (0.4) 6 (46.2) <0.01 haemodialysis 5 (1.8) 1 (0.4) 4 (30.8) <0.01 haemodialysis with haemoperfusion 2 (0.7) 2 (15.4) !"#$#%&'()*+*&",-( ! j$o+&)$0r& 7&d6a6e& 6&d3a@e& 1&d6ba@e& !"!#$ z'n$0/n+&)+oq$'/o$%& n+'#/%$#/"'& b&d6a2e& 1&d3a2e& 7&d17a6e& %!"!#$ a+'$%&,+.%$o+)+'#&#q+,$.;& 5&d1abe& 6&d3a@e& 4&d@4a1e& %!"!#$ m$+)"l/$%;0/0& b&d6a2e& 6&d3a@e& @&d73a2e& %!"!#$ m$+)"l/$%;0/0&_/#q& q+)".+,-(0/"'& 1&d3a5e& h&& 1&d6ba@e& $ u&n$%(+0&`3a3b&$,+&/#$%/o/w+la& & !"#$%& p)& l"23,.4& "44,21"3%6& q130& +,.3"$13n& ,5& "67$3& 89:;*<'=& /"31%>34& "6+133%6& 3,& ?"-71,& @%>%."$&a,4/13"$&">6&b%612"$&8%>3%.&5.,+&'&b".20&3,&cd&923,#%.&cece' :".1"#$%4& (6r743%6&,664& ."31,4& =sg&2,>516%>2%& 1>3%.j"$& k&j"$7%& u,+0+'o+&"-&oq,"'/o&r/l'+;& l/0+$0+& 71@a5& 61ab&#"&2@b4a@& !"!!#$ u,+0+'o+&"-&o$,l/"n$0o(%$,& l/0+$0+& 63a4& 6a5&#"&44a2& !"!#&$ u,"#q,")*/'&#/)+&g6ba7&0+o&& 5@a4& 7a4&#"&6b41a4& !"!!)$ g$o#$#+&l+q;l,"9+'$0+&t@33& 14a@& 7a2&#"&62@a4& !"!!#$ u&n$%(+0&`3a3b&$,+&/#$%/o/w+la& & ! l1-)&')&9732,+%4&,5&"67$3&/"31%>34&q130&89:;*<'=&#"4%6&,>&614%"4%&4%j%.13n&,>&"6+1441,>&3,& ?"-71,&@%>%."$&a,4/13"$&">6&b%612"$&8%>3%.&f>&t&cueh& & wpsar vol 12, no 4, 2021 | doi: 10.5365/wpsar.2021.12.4.852 https://ojs.wpro.who.int/8 cortez et alclinical characteristics and outcomes of covid-19 patients in a tertiary hospital in baguio city, philippines with having chronic kidney disease, cvd, elevated ldh and prolonged prothrombin time at hospital admission. the female-to-male ratio in our study was 1.8:1, yet 62% of cases that died were male. several other studies have shown a male predominance of covid-19 cases,12,13 and a recent meta-analysis showed that male sex was significantly associated with severe disease.14 however, in our study, there was no significant difference discussion our study assessed the clinical profile and outcomes of hospitalized adult covid-19 patients in a single hospital in baguio city, philippines. the covid-19 cases comprised mostly female patients with a mean age of 48.4 years. moderate, severe and critical disease made up 45%, 8% and 4% of the covid-19 patients, respectively. the recovery rate was 95% and mortality was associated p values <0.05 are italicized. aki: acute kidney injury; hcap: health care-associated pneumonia. table 4. factors associated with mortality of adult covid-19 patients admitted to baguio general hospital and medical center from 1 march to 27 october 2020 fig. 2. mean duration (in days) of illness to admission, hospital duration, and onset of complications among patients admitted to baguio general hospital and medical center from 1 march to 27 october 2020 variables adjusted odds ratios 95% confidence interval p value presence of chronic kidney disease 324.7 12.5 to 8456.4 0.001 presence of cardiovascular disease 10.6 1.7 to 66.8 0.012 prothrombin time ≥15.3 sec 74.6 3.6 to 1562.6 0.006 lactate dehydrogenase >400 26.4 3.8 to 184.6 0.001 !"#$#%&'()*+*&",-( ! ! ! l1-)& c)& b%">& 67."31,>& f1>& 6"n4h& ,5& 1$$>%44& 3,& "6+1441,>v& 0,4/13"$& 67."31,>v& ">6& ,>4%3& ,5& 2,+/$12"31,>4&"+,>-&/"31%>34&"6+133%6&3,&?"-71,&@%>%."$&a,4/13"$&">6&b%612"$&8%>3%.&5.,+& '&b".20&3,&cd&923,#%.&cece& 8izd&$o(#+&r/l'+;&/'f(,;h&mk8ud&q+$%#q&o$,+h$00"o/$#+l&.'+()"'/$a& & p onset of illness to recovery/death onset of illness to admission hospital duration onset of illness to complication hcap septic shock aki cytokine storm wpsar vol 12, no 4, 2021 | doi: 10.5365/wpsar.2021.12.4.852https://ojs.wpro.who.int/ 9 clinical characteristics and outcomes of covid-19 patients in a tertiary hospital in baguio city, philippinescortez et al associated with the inflammation and organ dysfunction brought about by covid-19 infection. in a pooled analysis, elevated ldh values were associated with a 6-fold increase in odds of severe covid-19 disease and >16-fold increase in odds of mortality.26 since ldh is present in lung tissue, patients with severe covid-19 infections who present with a severe form of interstitial pneumonia can be expected to release greater amounts of ldh in the circulation. high baseline levels of inflammatory biomarkers (e.g. serum ldh, alanine transaminase and d-dimer) are considered poor prognostic factors that are associated with mortality, increased stay in the intensive care unit and severe disease.11 certain haematological abnormalities (e.g. decreased haemoglobin, white blood cell count and platelets), although not rare in covid-19, are seen in severe disease.27 both scenarios were seen in a minority of our cases. this may relate to our population’s low mortality rate. meanwhile, a low or normal procalcitonin level, observed in a high number of patients in our study, is compatible with a viral infection. elevated levels may be due to other non-viral, even non-infectious, causes.11 that 73% of our patients received antibiotics is a concern, although this was mainly as a preventive measure and due to many patients having a secondary infection, including hospital-acquired pneumonia, bacteraemia and complicated urinary tract infections. secondary infections can contribute to a poorer outcome, and when faced with severely ill hospitalized patients where the diagnosis of a bacterial superinfection is uncertain, antibiotics are often started.28 because this study was in the early phase of the pandemic, hydroxychloroquine and lopinavir-ritonavir were included among the investigational drugs given to patients. the most common symptoms in our covid-19 patients were cough, cold, fever, dyspnoea and malaise. although, in the univariate analysis, the proportions reporting cough, fever and malaise were significantly higher in cases that died than in those that recovered, these proportions were not associated with mortality in multivariate analysis. other studies have identified various symptoms as prognosticators for mortality. dyspnoea was consistently identified as a risk factor for mortality in multinational meta-analyses involving thousands of patients.29,30 in contrast, a meta-analysis involving >50 000 patients in 13 countries showed that headache, in sex between the cases that recovered and those that died. the high female-to-male ratio in our study may have been due to the former outnumbering the latter in all age groups except for those aged 1–4 years in baguio city.4 in our study, 77% of covid-19 cases that died were aged 60–79 years, reflecting national data, whereby 60% of confirmed deaths were males aged at least 60 years.15 old age is a known risk factor for severe covid-19, for reasons not yet fully understood.16,17 changes in the immune system and prevalence of comorbidities in this age group contribute to the risk. who recognizes that underlying comorbidities can negatively impact outcomes in covid-19 patients,18 with confirmed covid-19 patients with comorbidities having increased admission rates to intensive care units and mortality.19 although all the cases in our study who died had at least one comorbidity, the presence of a comorbidity did not in itself significantly increase the likelihood of death. however, having chronic kidney disease and cvd were significantly associated with mortality. chronic kidney disease is considered the most prevalent risk factor for severe covid-19 worldwide, especially for patients with an estimated glomerular filtration rate <30 ml/min/1.73 m2.17,20 in addition to chronic kidney disease, a higher proportion of those who died also had acute renal complications warranting haemodialysis. it is hypothesized that kidney involvement is through direct cellular and immune-mediated damage due to the presence of the virus.21 covid-19 patients presenting with acute kidney injury have been shown to have a higher risk of death than patients with acute kidney injury from other conditions.22 a recent meta-analysis found that preexisting cvd is also an independent risk factor associated with poor outcomes from covid-19.23 patients who have pre-existing comorbidities or present with complications should be closely monitored for severe outcomes. this, in combination with evidence relating to other complications during covid-19 infection (e.g. hospital-acquired infections), supports the rapidly accumulating evidence that covid-19 may have multisystemic affectations. our study found an association between mortality and prolonged prothrombin time (>15.3 seconds) and elevated ldh (>400). several studies have shown that a prolonged prothrombin time is associated with a poorer outcome among covid-19 patients.24,25 coagulation parameters not only reflect haemostasis but are also wpsar vol 12, no 4, 2021 | doi: 10.5365/wpsar.2021.12.4.852 https://ojs.wpro.who.int/10 cortez et alclinical characteristics and outcomes of covid-19 patients in a tertiary hospital in baguio city, philippines acknowledgements the year 2020 was truly a challenge in every community worldwide. we thank the first responders, front-line workers, essential workers, public health leaders, physicians and scientists who are continuing to work tirelessly to treat covid-19 patients, protect vulnerable populations and prevent the spread of this virus. we would also like to acknowledge ms. carla a. yee, ms. kathleen hazel c. sy, the institutional infection control committee and the hospital information management division. conflicts of interest the authors declare no conflicts of interest. ethics approval this study has been approved by the ethics review board of baguio general hospital and medical center, baguio city, philippines. funding statement this study was self-funded. references 1. huang c, wang y, li x, ren l, zhao j, hu y, et al. clinical features of patients infected with 2019 novel coronavirus in wuhan, china. lancet. 2020;395(10223):497–506. doi:10.1016/s0140– 6736(20)30183–5 pmid:31986264. erratum in: lancet. 2020 jan 30. pmid:31986264 2. updates on novel coronavirus disease (covid-19). republic of the philippines: department of health; 2020. available from: https:// www.doh.gov.ph/2019-ncov?page=1&fbclid=iwar124c0ndfx o6hyqkqxxp1o8iotjbqfvzpbz8sxh20nd_dvfetg5cp1ks3y, accessed 24 september 2021. 3. population of the cordillera administrative region (based on the 2015 census of population). republic of the philippines: philippine statistics authority; 2020. available from: https://psa.gov.ph/content/population-cordillera-administrative-region-based-2015-census-population, accessed 24 september 2021. 4. the city government of baguio, baguio city ecological profile 2018. republic of the philippines; 2020. available from: https:// www.baguio.gov.ph/sites/default/files/city_planning_and_development_office/downloadable_forms/ecological%20profile%20 2018%20%28chapter%203%29.pdf, accessed 24 september 2021. 5. catajan me. 52 covid-19 clusters in baguio. sunstar baguio; 24 august 2020. available from: https://www.sunstar.com.ph/article/1867996/baguio/local-news/52-covid-19-clusters-in-baguio, accessed 24 september 2021. diarrhoea, vomiting and cough indicate a lower risk of death.29 in addition, anosmia and dysgeusia are peripheral neurological symptoms of covid-19 that have been investigated for their association with recovery, with studies on anosmia reporting it as being inversely associated with hospitalization and as a marker of milder covid-19 disease.31,32 conversely, a meta-analysis showed that olfactory and taste dysfunction had no bearing on severity of covid-19 disease.33 in our study, all patients presenting with dysgeusia and anosmia recovered. differences in study definitions, study methodologies and tools for detecting anosmia and dysgeusia may account for the differences in results. pregnancy is now recognized as a risk factor for contracting covid-19. a weakened immune system during pregnancy confers a higher risk of infection with sars-cov-2.34 in this study, 45 patients were pregnant but none died. possible causes for this low mortality rate could be the lower age of pregnant patients as well as the lower rate of concomitant comorbidity in this subgroup. our study had some limitations. first, the study design was cross-sectional; causal inference and associations may be inherently difficult to make and interpret because the outcome, exposure and investigated risk factors were collected simultaneously. the frequency and type of complications seen in our patients cannot be wholly attributed to the effects of covid-19. second, the selection of our study population was non-randomized, and data analysis was non-stratified and non-matching. although multiple logistic regression was used to identify risk factors associated with mortality, our sample size was small, leading to wide confidence intervals. therefore, caution should be applied when interpreting the results. at the time of writing, the pandemic is ongoing and the clinical profile and prognosis of covid-19 patients in our institution may change over time. in conclusion, most of the patients in our population were classified with asymptomatic to moderate disease on admission and few had complications. overall, 95% of cases recovered and 5% died. the presence of chronic kidney disease, cvd, elevated ldh and prolonged prothrombin time were associated with mortality in our population. based on these results, we strongly recommend that patients with comorbidities, including pregnancy and those of older age, should take all necessary precautions to avoid getting infected with sars-cov-2. wpsar vol 12, no 4, 2021 | doi: 10.5365/wpsar.2021.12.4.852https://ojs.wpro.who.int/ 11 clinical characteristics and outcomes of covid-19 patients in a tertiary hospital in baguio city, philippinescortez et al 21. adapa s, chenna a, balla m, merugu gp, koduri nm, daggubati sr, et al. covid-19 pandemic causing acute kidney injury and impact on patients with chronic kidney disease and renal transplantation. j clin med res. 2020;12(6):352–61. doi:10.14740/ jocmr4200 pmid:32587651 22. kolhe nv, fluck rj, selby nm, taal mw. acute kidney injury associated with covid-19: a retrospective cohort study. plos med. 2020;17(10):e1003406. doi:10.1371/journal.pmed.1003406 pmid:33125416 23. xu j, xiao w, liang x, shi l, zhang p, wang y, et al. a meta-analysis on the risk factors adjusted association between cardiovascular disease and covid-19 severity. bmc public health. 2021;21(1):1533. doi:10.1186/s12889–021–11051-w pmid:34380456 24. wang l, he wb, yu xm, hu dl, jiang h. prolonged prothrombin time at admission predicts poor clinical outcome in covid-19 patients. world j clin cases. 2020;8(19):4370–9. doi:10.12998/ wjcc.v8.i19.4370 pmid:33083396 25. long h, nie l, xiang x, li h, zhang x, fu x, et al. d-dimer and prothrombin time are the significant indicators of severe covid-19 and poor prognosis. biomed res int. 2020;2020:6159720. doi:10.1155/2020/6159720 pmid:32596339 26. henry bm, aggarwal g, wong j, benoit s, vikse j, plebani m, et al. lactate dehydrogenase levels predict coronavirus disease 2019 (covid-19) severity and mortality: a pooled analysis. am j emerg med. 2020;38(9):1722–6. doi:10.1016/j.ajem.2020.05.073 pmid:32738466 27. liu x, zhang r, he g. hematological findings in coronavirus disease 2019: indications of progression of disease. ann hematol. 2020;99(7):1421–8. doi:10.1007/s00277–020–04103–5 pmid:32495027 28. ginsburg as, klugman kp. covid-19 pneumonia and the appropriate use of antibiotics. lancet glob health. 2020;8(12):e1453–4. doi:10.1016/s2214–109x(20)30444–7 pmid:33188730 29. mesas ae, cavero-redondo i, álvarez-bueno c, sarriá cabrera ma, maffei de andrade s, sequí-dominguez i, et al. predictors of inhospital covid-19 mortality: a comprehensive systematic review and meta-analysis exploring differences by age, sex and health conditions. plos one. 2020;15(11):e0241742. doi:10.1371/journal. pone.0241742 pmid:33141836 30. mudatsir m, fajar jk, wulandari l, soegiarto g, ilmawan m, purnamasari y, et al. predictors of covid-19 severity: a systematic review and meta-analysis. f1000res. 2020;9:1107. doi:10.12688/ f1000research.26186.1 pmid:33163160 31. talavera b, garcía-azorín d, martínez-pías e, trigo j, hernándezpérez i, valle-peñacoba g, et al. anosmia is associated with lower in-hospital mortality in covid-19. j neurol sci. 2020;419:117163. doi:10.1016/j.jns.2020.117163 pmid:33035870 32. yan ch, faraji f, prajapati dp, ostrander bt, deconde as. selfreported olfactory loss associates with outpatient clinical course in covid-19. int forum allergy rhinol. 2020;10(7):821–31. doi:10.1002/alr.22592 pmid:32329222 33. zahra sa, iddawela s, pillai k, choudhury ry, harky a. can symptoms of anosmia and dysgeusia be diagnostic for covid-19? brain behav. 2020;10(11):e01839. doi:10.1002/brb3.1839 pmid:32935915 34. phoswa wn, khaliq op. is pregnancy a risk factor of covid-19? eur j obstet gynecol reprod biol. 2020;252:605–9. doi:10.1016/j. ejogrb.2020.06.058 pmid:32620513 6. coronavirus resource center. johns hopkins university & medicine; 2020. available from: https://coronavirus.jhu.edu/, accessed 24 september 2021. 7. who coronavirus (covid-19) dashboard. geneva: world health organization; 2020. available from: https://covid19.who.int/, accessed 24 september 2021. 8. the city government of baguio. republic of the philippines; 2020. available from: http://endcov19.baguio.gov.ph, accessed 24 september 2021. 9. singer m, deutschman cs, seymour cw, shankar-hari m, annane d, bauer m, et al. the third international consensus definitions for sepsis and septic shock (sepsis-3). jama. 2016;315(8):801–10. doi:10.1001/jama.2016.0287 pmid:26903338 10. simadibrata dm, calvin j, wijaya ad, ibrahim naa. neutrophil-to-lymphocyte ratio on admission to predict the severity and mortality of covid-19 patients: a meta-analysis. am j emerg med. 2021;42:60–9. doi:10.1016/j.ajem.2021.01.006 pmid:33453617 11. philippine interim guidance on the clinical management of adult patients with suspected or confirmed covid-19 infection. philippine college of physicians; 2020. available from: https://pcp.org.ph/index.php/interim-guidelines, accessed 24 september 2021. 12. zhou f, yu t, du r, fan g, liu y, liu z, et al. clinical course and risk factors for mortality of adult inpatients with covid-19 in wuhan, china: a retrospective cohort study. lancet. 2020;395(10229):1054– 62. doi:10.1016/s0140–6736(20)30566 pmid:32171076 13. soria mlj, macalalad-josue aa, quiwa l, duya j, calvario mkj, and the pcp covid-19 profile study group. clinical profile and outcomes of hospitalized patients with covid-19 in the philippines: a preliminary report [unpublished manuscript]. philippine college of physicians (2020). 14. peckham h, de gruijter nm, raine c, radziszewska a, ciurtin c, wedderburn lr, et al. male sex identified by global covid-19 meta-analysis as a risk factor for death and itu admission. nat commun. 2020;11(1):6317. doi:10.1038/s41467–020–19741–6 pmid:33298944 15. covid-19 in the philippines situation report 63. geneva: world health organization; 2020. available from: https://www.who.int/ philippines/internal-publications-detail/covid-19-in-the-philippinessituation-report-63, accessed 24 september 2021. 16. marcon g, tettamanti m, capacci g, fontanel g, spanò m, nobili a, et al. covid-19 mortality in lombardy: the vulnerability of the oldest old and the resilience of male centenarians. aging (albany ny). 2020;12(15):15186–95. doi:10.18632/aging.103872 pmid:32788424 17. williamson ej, walker aj, bhaskaran k, bacon s, bates c, morton ce, et al. factors associated with covid-19-related death using opensafely. nature. 2020;584(7821):430–6. doi:10.1038/ s41586–020–2521–4 pmid:32640463 18. franceschi c, bonafè m. centenarians as a model for healthy aging. biochem soc trans. 2003;31(2):457–61. doi:10.1042/ bst0310457 pmid:12653662 19. sanyaolu a, okorie c, marinkovic a, patidar r, younis k, desai p, et al. comorbidity and its impact on patients with covid-19. sn compr clin med. 2020 jun 25;1–8. doi:10.1007/s42399–020– 00363–4 pmid:32838147 20. era-edta council; eracoda working group. chronic kidney disease is a key risk factor for severe covid-19: a call to action by the era-edta. nephrol dial transplant. 2021;36(1):87–94. doi:10.1093/ndt/gfaa314 pmid:33340043 https://ojs.wpro.who.int/ 1wpsar vol 13, no 1, 2022 | doi: 10.5365/wpsar.2022.13.1.887 original research b otulism is a life-threatening condition caused by botulinal neurotoxins (bonts). the typical symptoms are neurological, including blurred vision, slurred speech, difficulty swallowing and muscle weakness.1 the mortality rate may be up to 60% without adequate medical intervention.1 bonts are produced by clostridium botulinum, a gram-positive, rodshaped, anaerobic, spore-forming, motile bacterium.2 of the eight types of bont (a–h), a, b, e and f are associated with human botulism.1 c. botulinum spores grow and produce toxins in foods in an anaerobic, nonacidic environment with low sugar and salt. the spores are highly resistant to heat (several hours at 100 °c), desiccation, ultraviolet light and alcohol.1 c. botulinum is present in the environment, with type a or b spores being found primarily in terrestrial vegetables and type e commonly found in fish and aquatic products.3 several outbreaks of botulism have been reported globally, due to consumption of a wide range of foods. in egypt, a type e botulism outbreak was reported in 1991 in 91 patients, with 19 fatalities, related to consumption of a fermented grey mullet fish (faseikh).4 in finland, an outbreak of bont type e in 1997 was linked to consumption of hot-smoked canadian whitefish.5 tinned bamboo shoots were found to be the cause of three outbreaks of botulism in thailand, comprising nine cases in 1998,6 19 cases in 1997–19987 and up to 209 cases in 2006.8 in taiwan (china), two outbreaks have been recorded, one caused by type a botulism in nine patients who consumed preserved peanuts in 19869 and another caused by type b botulism in five cases related to consumption of fermented food in 2006.10 in china, two type a bont outbreaks were caused by consumption of smoked ribs by two patients in 201311 and of vacuum-packaged salted fish and ham in four cases in 2021.12 liquid herbal tea was found to be the main source of a type a botulism outbreak in two elderly people in the united states in 2017.13 no outbreaks of botulism had been reported in viet nam before the recent outbreak in the southern provinces in july 2020.14 an initial case series from this outbreak, which comprised the first six cases in a hospital in ho chi minh city, linked cases to consumption of a tinned vegetarian pâté. in addition, the institute of public health a institute of public health, ministry of health, ho chi minh city, viet nam. published: 6 january 2022 doi: 10.5365/wpsar.2022.13.1.887 objective: to investigate the cause of a botulism outbreak in several provinces in viet nam in 2020. methods: an initial investigation was conducted to confirm the outbreak and to form hypotheses about the potential causes, followed by a case–control assessment of the plausible causative food item. collected food samples were tested to identify the pathogen, and mouse bioassays were performed. control measures were introduced to stop the outbreak and to prevent similar events in the future. results: twelve people in six southern provinces of viet nam were identified as having symptoms of botulism, of whom 11 were in critical condition requiring breathing support. a history of foods eaten in the 4 days before illness onset indicated that all the cases had eaten a tinned vegetarian pâté, and a case–control assessment showed that this was significantly associated with the outbreak, with an odds ratio of 35.2 (95% confidence interval: 3.4–∞). clostridium botulinum type b was detected in three of eight pâté samples collected from the houses of cases. in the mouse bioassay for the toxicity of the pâté samples, all the mice died with clinical symptoms of botulism. discussion: a tinned vegetarian pâté was the plausible cause of a botulism outbreak in viet nam in 2020. revision of food safety regulations to improve quality control of tinned foods to prevent future outbreaks is recommended. an outbreak of type b botulism in southern viet nam, 2020 tinh huu ho,a ha phan ai nguyen,a nhan dinh trong le,a phuong hoai hoang,a ninh thi haa and chinh van danga correspondence to tinh huu ho (email: hohuutinh@iph.org.vn) wpsar vol 13, no 1, 2022 | doi: 10.5365/wpsar.2022.13.1.887 https://ojs.wpro.who.int/2 ho et alan outbreak of type b botulism in southern viet nam, 2020 vision, during the same period who was not admitted to hospital. age, sex, symptoms, date of onset and history of foods consumed during the 4 days before the date of onset were recorded for each patient. the incubation period was calculated as the time between consumption of the pâté and the onset of symptoms. for patients who ate the pâté more than once during the 4 days before onset of symptoms, the incubation period was calculated as the time between the first and last consumption of the pâté and the onset of symptoms. case–control assessment after the initial investigation, a case–control assessment was conducted to confirm epidemiologically that the implicated food item was the source of the outbreak. the cases were those from the initial investigation, and controls were defined as people who had shared at least one meal with a case in the 4 days before the onset of illness in that case, who showed none of the above symptoms of botulism intoxication. a structured questionnaire was used to interview the cases and controls, which included age, sex and history of food consumption (including names of foods and quantity ingested) within 4 days of the onset of any symptom. controls were asked only about their exposure to the implicated food. odds ratios (ors) were calculated by exact logistic regression, and p values were calculated for exposure to the implicated food only with fisher’s exact test. laboratory investigation vegetarian pâté samples from opened tins that had been consumed by patients within 4 days of symptom onset and samples from three unopened tins were collected from household members and sent to the iph for examination. patient specimens (faeces and stomach fluid) collected in hospital at admission were also examined. testing for c. botulinum and botulinal toxin was conducted according to standard methods.15 briefly, 1 g of pâté sample was added to 15 ml of cooked meat broth in a tube (becton dickinson, sparks, md, usa). after 5 days of incubation at 35 °c, enrichment cultures were examined for turbidity, gas production, digestion (iph) within the ministry of health, located in ho chi minh city, received notification of several suspected cases from this and two other hospitals via a hotline. the aim of this study was therefore to investigate the source of the botulism outbreak by examining food consumption histories and pathogens from collected samples to provide information for preventing future foodborne outbreaks. methods the investigation was conducted in three stages: 1) an initial investigation to confirm the outbreak; 2) an epidemiological investigation to identify foods possibly implicated in the outbreak, including a case–control assessment of the implicated food product; and 3) a laboratory investigation to identify the pathogen. environmental studies and investigations at food facilities related to the outbreak were conducted by a different institution, and the results were not shared with our investigation team. initial investigation at the end of july 2020, seven patients with severe neurological symptoms were transferred from four provincial hospitals to two central hospitals in ho chi minh city. initial diagnosis of the six initial cases suggested a potential outbreak of botulism intoxication.14 a full investigation of all cases in the southern provinces was conducted by the rapid outbreak response team of the iph. although cases were also recorded in northern provinces, they were not included in this investigation because of limited resources. details of the cases in all hospitals in the southern provinces were collected to confirm whether an outbreak of food poisoning had occurred. the team examined hospital case reports, consulted physicians who treated the patients and interviewed the patients or their caregivers. to avoid missing new cases, the iph also notified all central hospitals in ho chi minh city to report all suspected cases to iph between 1 august and 30 september 2020. the case definition used for the outbreak was any individual admitted to any central hospital in ho chi minh city between july and september 2020 who was diagnosed with botulism intoxication or any individual with three or more of the following symptoms: limb weakness, bilateral ptosis, dysphagia, difficulty breathing, dysarthria, descending paralysis and double and blurred wpsar vol 13, no 1, 2022 | doi: 10.5365/wpsar.2022.13.1.887https://ojs.wpro.who.int/ 3 an outbreak of type b botulism in southern viet nam, 2020ho et al onset. all but one case reported having eaten at least 1.5 spoonfuls. the ingredients of the pâté were mushrooms (such as shiitake, wood ear, chicken drumstick, oatmeal and straw mushrooms), soya bean and nuts (cashew, almond and walnut). all other foods reported in the food histories were consumed by 17–42% of cases (table 2). the incubation period ranged from 11 to 222 hours (median, 73 hours) (fig. 1). case–control assessment all 12 cases and nine controls were included in the case–control assessment of the implicated food product. as most of the cases were vegetarians, their meals were usually different from those of other household members; thus, it was difficult to find controls who had shared meals with the cases. the nine controls identified had all shared a meal with the cases in the 4 days before symptom onset and were relatives (children, spouses, parents or grandparents) or roommates (table 3). controls were not obtained for six cases who ate meals different from those of other household members. as the only food item consumed by all cases was a tinned vegetarian pâté, the case–control analysis included only the pâté. only two controls reported having eaten the pâté, giving an or of 35.2 (95% confidence interval [ci]: 3.4–∞). the or for consuming more than one spoonful of pâté was 12.5 (95% ci: 0.84–∞); however, this association was not statistically significant. laboratory investigation eight pâté samples, three from unopened tins and five from opened tins and consumed by the cases, and specimens from four patients were collected (table 4). three of five opened pâté samples were positive for bont type b c. botulinum by pcr test. none of the unopened tinned pâté samples was positive for bont. in the mouse bioassay, all mice died with clinical symptoms of botulism after exposure to the three pâté samples positive for c. botulinum. the four specimens from cases were all negative for c. botulinum. six cases had consumed pâté from the three opened tins that were positive for c. botulinum: three in dong nai province, one in ho chi minh city and two in khanh hoa province. of meat particles, odour and gram stain. the enrichment culture was also inoculated onto anaerobic egg yolk agar (himedia, india) and incubated at 35 °c for 48 hours. a single pearly zone colony was selected and inoculated into trypticase peptone glucose yeast extract broth (himedia). after incubation for 5 days at 26 °c, the culture in broth was used for further detection of toxin in a mouse bioassay. the culture was diluted 1:5, 1:10 and 1:100 in gelatin phosphate buffer (himedia), and mice weighing 15–20 g were injected intraperitoneally with 0.5 ml of each dilution of test sample. all the mice were observed periodically for symptoms of botulism for 48 hours. typically, signs of botulism in mice begin within the first 24 hours with ruffling of fur, followed in sequence by laboured breathing, weakness of limbs and total paralysis with gasping for breath, followed by death due to respiratory failure. c. botulinum isolates carrying botulinum neurotoxin a, b, e and f genes were identified in a polymerase chain reaction (pcr) assay, as reported previously.16 results initial investigation twelve cases of botulism were linked to the outbreak between 24 july and 15 september 2020, 11 of which were treated in intensive care units in three central hospitals; the other case was not admitted to hospital. the cases ranged in age from 20 to 64 years (median, 38 years). eight of the 12 were female and reported eating a vegetarian diet. the cases were from six southern provinces, with five cases from two families (two cases in khanh hoa province and three in long an province), three cases among roommates in dong nai province and four unlinked cases from vung tau (n = 2), ho chi minh city and binh duong (table 1). the three most common symptoms were limb weakness (10/12), bilateral ptosis (9/12) and dysarthria (8/12). all 11 hospitalized patients required ventilator support. no deaths were reported (table 1). the four most serious cases were treated with botulinum antitoxins provided by the world health organization; however, we were unable to evaluate the effectiveness of botulinum antitoxin treatment. all 12 cases reported having eaten the same brand of tinned vegetarian pâté in the 4 days before symptom wpsar vol 13, no 1, 2022 | doi: 10.5365/wpsar.2022.13.1.887 https://ojs.wpro.who.int/4 ho et alan outbreak of type b botulism in southern viet nam, 2020 table 1. characteristics of cases and controls in the botulism outbreak investigation, southern viet nam, 2020 characteristic cases (n = 12) controls (n = 9) n % n % age (years), median (min–max) 38 (20–64) 27 (18–56) sex female 8 67 8 89 male 4 33 1 11 vegetarian diet 8 67 3 33 home province long an 3 25 0 0 dong nai 3 25 2 22 khanh hoa 2 17 0 0 vung tau 2 17 5 56 ho chi minh city 1 8 2 22 binh duong 1 8 0 0 symptoms limb weakness 10 83 bilateral ptosis 9 75 dysarthria 8 67 vomiting 6 50 difficulty breathing 5 42 hospitalized 11 92 required ventilator 11 92 relationship to case patients roommate 2 22 child 3 33 spouse 2 22 parent or grandparent 2 22 fig. 1. fig. 1. epidemic curve and incubation period after consumption of the implicated food of 12 cases of botulism, southern viet nam, 2020 * range for incubation period of cases that consumed the vegetarian pâté more than once during the 4 days before symptom onset. 0 1 2 3 4 9-jul 11-jul 13-jul 15-jul 17-jul 19-jul 21-jul 23-jul 25-jul 27-jul 29-jul 31-jul 2-aug 4-aug 6-aug 8-aug 10-aug 12-aug 14-aug 16-aug 18-aug 20-aug 22-aug 24-aug 26-aug n o. o f b ot ul is m c as es onset date 90 h 11 h 56 h 24 h 33 h 50 h 24–168 h* 12–222 h* 12–216 h* wpsar vol 13, no 1, 2022 | doi: 10.5365/wpsar.2022.13.1.887https://ojs.wpro.who.int/ 5 an outbreak of type b botulism in southern viet nam, 2020ho et al table 2. food consumption of 12 cases of botulism in the 4 days before onset of symptoms – southern viet nam, 2020 table 3. odds ratios (ors) and 95% confidence intervals (cis) for case and control consumption of vegetarian pâté – southern viet nam, 2020 the most plausible source of this outbreak was a tinned vegetarian pâté. all the cases reported having eaten the same brand of the pâté, and the case–control assessment found that consumption of the pâté was significantly associated with the outbreak, with an or of 35.2. the incubation period was estimated to be 11–222 hours (median, 73 hours), consistent with foodborne botulism, which can occur between 2 hours to 8 days after exposure (usually 12–72 hours).1 in the laboratory investigation, positive results for discussion this outbreak of botulism comprised 12 cases in six southern provinces of viet nam in 2020. no deaths were recorded, probably due to timely treatment of all patients and to administration of botulinum antitoxins provided by the world health organization to the four most serious cases. in addition, the strain identified was bont type b, which is less likely to be fatal than other types, such as bont types a and e.1 food n % vegetarian pâté 12 100 bread 5 42 steamed rice 5 42 pickled vegetables 5 42 vegetable soup 3 25 steamed vegetables 3 25 tofu 3 25 sweet taro 3 25 potato 3 25 bamboo shoot 3 25 noodle 2 17 snail 2 17 cumulative intake of vegetarian pâté (spoonfuls) ≤ 1 1 8 1.5 6 50 2 3 25 > 2 2 17 pâté consumption case (n = 12) control (n = 9) or (95% ci) pâté eaten yes 12 2 35.2 (3.4–∞) no 0 7 cumulative amount of pâté eaten > 1 coffee spoon 11 0 12.5 (0.84–∞) ≤ 1 coffee spoon 1 2 wpsar vol 13, no 1, 2022 | doi: 10.5365/wpsar.2022.13.1.887 https://ojs.wpro.who.int/6 ho et alan outbreak of type b botulism in southern viet nam, 2020 table 4. results of testing of food and patient samples – southern viet nam, 2020 c. botulinum spores were found per kg of soil and 2100 type b spores per kg of mushrooms.17 as c. botulinum is ubiquitous in the environment, viable c. botulinum or c. botulinum spores can occur in food. botulism occurs only when c. botulinum in foods has enough nutritional requirements and anaerobic conditions for growth and production of toxins, such as in tinned foods. although the optimum temperature for the growth and production of toxins is 35–40 °c, bonts can be produced at 3 °c.1,18 the normal temperature in a refrigerator compartment, which is usually set at 4.4 °c (40 °f) or less, may not be low enough to inhibit the growth of c. botulinum. the growth of c. botulinum in tinned foods can nevertheless be controlled by several methods, such as low ph, low water activity, high salt concentration and other food preservatives.16 the limitations of this outbreak investigation are that it was restricted to the southern provinces of viet nam and did not include cases linked to consumption of the vegetarian pâté in the northern provinces lack of access to the results of the environmental investigation also limited our study. the availability of reagent kits for detection of bonts has been a challenge for all laboratories in viet nam. in this study, we attempted to cultivate c. botulinum from samples and then used pcr to determine bont type, in addition to performing mouse bioassays. another limitation of the response to this outbreak is that botulism is not covered in the national surveillance system, and no outbreaks of botulism had been seen previously. c. botulinum type b were found in three opened pâté tins. the finding that all four patient specimens were negative for c. botulinum may be explained by the fact that the adult gastrointestinal tract is not a natural habitat for c. botulinum. detection of bonts in patient specimens was also hindered by lack of reagents for additional testing. after identification of the contaminated pâté as the cause of this outbreak, the information was widely spread through all media channels, and the population was advised not to eat the product; furthermore, all stocks of the product were recalled. the outbreak was successfully controlled, as no additional cases were identified at the national level. as the pâté implicated in this outbreak was distributed nationally, cases occurred throughout the country. the ingredients of the pâté – mushrooms, soya beans and nuts – are common environments for c. botulism types a and b.1 a limitation of this investigation was the inability to determine at which step(s) of the pâté production process the contamination was introduced, as the environmental investigation was conducted by another team, and our investigation team could not inspect the canning company. foods may be contaminated with c. botulinum at all steps of the production process, including cultivation, harvesting, processing and after processing. contamination often occurs during growth in an environment with a high incidence of spores.17 c. botulinum is common in soil and organic fertilizers, usually at low concentrations.1 in a survey in china, up to 25 000 substrate type of sample culture pcr toxicity testing in mice vegetarian pâté 1 2 jars, 450 g (unopened) n/a n/a vegetarian pâté 2 1 jar, 200 g (unopened) n/a n/a vegetarian pâté 3 1 jar, 450 g (unopened) n/a n/a vegetarian pâté 4 1 jar, 200 g (used) + type b died, typical symptoms vegetarian pâté 5 1 jar, 200 g (used) + type b died, typical symptoms vegetarian pâté 6 1 jar (used) n/a n/a vegetarian pâté 7 1 jar (used) n/a n/a vegetarian pâté 8 1 jar (used) + type b died, typical symptoms gastric fluid n/a n/a gastric fluid n/a n/a gastric fluid n/a n/a faeces n/a n/a wpsar vol 13, no 1, 2022 | doi: 10.5365/wpsar.2022.13.1.887https://ojs.wpro.who.int/ 7 an outbreak of type b botulism in southern viet nam, 2020ho et al 6. wongwatcharapaiboon p, thaikrea l, ungchusak k, wattanasri s, sriprasert p, nanthavas s, et al. foodborne botulism associated with home-canned bamboo shoots – thailand, 1998. mmwr morb mortal wkly rep. 1999;48(21):437–9. pmid:11075968 7. swaddiwudhipong w, wongwatcharapaiboon p. foodborne botulism outbreaks following consumption of home-canned bamboo shoots in northern thailand. j med assoc thai. 2000;83(9):1021– 5. pmid:11075968 8. kongsaengdao s, samintarapanya k, rusmeechan s, wongsa a, pothirat c, permpikul c, et al. an outbreak of botulism in thailand: clinical manifestations and management of severe respiratory failure. clin infect dis. 2006;43(10):1247–56. doi:10.1086/508176 pmid:17051488 9. chou jh, hwang ph, malison md. an outbreak of type a foodborne botulism in taiwan due to commercially preserved peanuts. int j epidemiol. 1988;17(4):899–902. doi:10.1093/ije/17.4.899 pmid:3225100 10. tseng ck, tsai ch, tseng ch, tseng yc, lee fy, huang ws. an outbreak of foodborne botulism in taiwan. int j hyg environ health. 2009;212(1):82–6. doi:10.1016/j.ijheh.2008.01.002 pmid:18396100 11. feng l, chen x, liu s, zhou z, yang r. two-family outbreak of botulism associated with the consumption of smoked ribs in sichuan province, china. int j infect dis. 2015;30:74–7. doi:10.1016/j. ijid.2014.10.008 pmid:25448333 12. min m, bai l, peng x, guo l, wan k, qiu z. an outbreak of botulinum types a, b, and e associated with vacuum-packaged salted fish and ham. j emerg med. 2021;60(6):760–3. doi:10.1016/j. jemermed.2020.12.006 pmid:33518376 13. kim m, zahn m, reporter r, askar z, green n, needham m, et al. outbreak of foodborne botulism associated with prepackaged pouches of liquid herbal tea. open forum infect dis. 2019;6(2):ofz014. doi:10.1093/ofid/ofz014 pmid:30793007 14. ngan ntt, tho vna, khanh dtn, hien vtt, day jn, sang nn, et al. botulism outbreak after the consumption of vegetarian pâté in the south of viet nam. wellcome open res. 2020;5:257. doi:10.12688.welcomeopenres.16372.1 15. 17.7.1 aoac official method aoac 977.26 clostridium botulinum and its toxins in foods. microbiological method. gaithersburg (md): aoac international; 2020. available from: https://www. edgeanalytical.com/wp-content/uploads/food_aoac-977.26.pdf, accessed 1 october 2021. 16. solomon hm, lilly t jr. bam chapter 17: clostridium botulinum. in: bacteriological analytical manual (bam). rockville (md): food and drug adminitstration; 2001. available from: https://www.fda. gov/food/laboratory-methods-food/bam-chapter-17-clostridiumbotulinum, accessed 1 october 2021. 17. austin jw. clostridium: occurrence and detection of clostridium botulinum and botulinum neurotoxin. in: caballero b, finglas pm, toldrá f, editors. encyclopedia of food and health. oxford: academic press; 2016:155–9. 18. austin jw. clostridium: occurrence of clostridium botulinum. in: caballero b, editor. encyclopedia of food sciences and nutrition, second edition. oxford: academic press; 2003:1407–13. in conclusion, this outbreak highlights the risk of botulism from tinned foods, especially once they are opened. strengthening of regulation of the production of processed foods and public education on food safety at home are recommended to prevent future foodborne outbreaks. although botulism is rare, preparation of reagent kits for early detection of bonts and a standard response protocol to ensure prompt investigation and implementation of control measures should be considered. acknowledgements we would like to acknowledge cho ray hospital, the national hospital of tropical diseases and 115 people’s hospitals for collaboration in this investigation. we also acknowledge our colleagues in the department of nutrition and food safety and the southern regional testing centre for food safety at the institute of public health for their time and effort. conflicts of interest none funding none references 1. harris a. clostridium botulinum. in: caballero b, finglas pm, toldrá f, editors. encyclopedia of food and health. oxford: academic press; 2016:141–5. 2. pirazzini m, rossetto o, eleopra r, montecucco c. botulinum neurotoxins: biology, pharmacology, and toxicology. pharmacol rev. 2017;69(2):200–35. doi:10.1124/pr.116.012658 pmid:28356439 3. glass k, marshall k. clostridium botulinum. in: morris jg, potter me, editors. foodborne infections and intoxications, fourth edition, chapter 27. san diego (ca): academic press; 2013:371–87. 4. weber jt, hibbs rg jr, darwish a, mishu b, corwin al, rakha m, et al. a massive outbreak of type e botulism associated with traditional salted fish in cairo. j infect dis. 1993;167(2):451–4. doi:10.1093/infdis/167.2.451 pmid:8421179 5. korkeala h, stengel g, hyytiä e, vogelsang b, bohl a, wihlman h, et al. type e botulism associated with vacuum-packaged hot-smoked whitefish. int j food microbiol. 1998;43(1–2):1– 5. doi:10.1016/s0168-1605(98)00080-4 pmid:9761332 https://ojs.wpro.who.int/ 1wpsar vol 13, no 3, 2022 | doi: 10.5365/wpsar.2022.13.3.917 covid-19: lessons from the field problem by the end of 2020, the coronavirus disease 2019 (covid-19) pandemic had caused around 3.2 million excess deaths worldwide and continues to pose major challenges globally.1 in the philippines, there have been 474 064 confirmed covid-19 cases and 9244 deaths (as of the end of 2020),2 raising concerns that the pandemic may accelerate antimicrobial resistance (amr) in health-care facilities as a consequence of possible antibiotic overuse and misuse.3,4 the full effect of the covid-19 pandemic on amr will only be observed in the upcoming years through continued amr surveillance at all levels. during a pandemic, it is likely that routine surveillance for amr monitoring, if not prioritized, may contain gaps and missing data.5 this paper describes the challenges posed by the covid-19 pandemic to the operations of the antimicrobial resistance surveillance program (arsp) in the philippines, from january to december 2020. context arsp is a sentinel, laboratory-based surveillance network comprising 24 sentinel sites located in 16 of the philippines’ 17 regions, and a further two sites for gonococcal surveillance. data from both the regular and gonococcal sentinel sites are presented. the coordinating laboratory – the antimicrobial resistance surveillance reference laboratory (arsrl) – is based at the research institute for tropical medicine (ritm). case finding is based on specimens sent to sentinel sites’ clinical laboratories for diagnostic purposes. a antimicrobial resistance surveillance reference laboratory, research institute for tropical medicine, department of health, manila, philippines. * these authors contributed equally. published: 25 august 2022 doi: 10.5365/wpsar.2022.13.3.917 problem: operation of the philippine antimicrobial resistance surveillance program (arsp) has been affected by the coronavirus disease 2019 (covid-19) pandemic, during which time difficulties in maintaining laboratory functions, staffing levels and participation were reported. context: the covid-19 pandemic has increased pressure on most health systems and programmes in the philippines, including arsp. as arsp is the source of national data on antimicrobial resistance (amr) trends, there are concerns that the negative effects of the pandemic may have impacted the quality of data produced. action: we describe disruptions to laboratory operations, personnel availability and participation in arsp surveillance, and their impact on reported data for 2020. outcome: surveillance operations were challenged by reallocation of human, infrastructure and financial resources for pandemic response among both the sentinel sites and the coordinating laboratory, the antimicrobial resistance surveillance reference laboratory. there was a decrease in the amount of data submitted to the surveillance system, as well as in the number of isolates sent to the reference laboratory for confirmation of bacterial identification and antimicrobial susceptibility testing. nevertheless, overall performance scores of the sentinel sites for most parameters were comparable to 2019, the year prior to the pandemic. discussion: the impact of operational changes to arsp due to the pandemic needs to be considered when analysing amr surveillance data from 2020. automation of data submission, good working relationships between the coordinating laboratory and sentinel sites, and supply chain system strengthening were identified as key to maintaining amr surveillance during the covid-19 pandemic. operational challenges of the philippine antimicrobial resistance surveillance program during the covid-19 pandemic karis boehme,a,* sonia b sia,a,* ferissa ablola,a june gayetaa and ma cecilia aleaa correspondence to sonia b sia (email: sonia.sia@ritm.gov.ph) wpsar vol 13, no 3, 2022 | doi: 10.5365/wpsar.2022.13.3.917 https://ojs.wpro.who.int/2 boehme et alcovid-19 impact on philippine amr surveillance for 2019 (table 1). the set of indicators and targets had been jointly agreed upon by the sentinel sites and arsrl during previous annual meetings. information about how the covid-19 pandemic had affected sentinel site participation in arsp was gathered from the site status reports that were presented at the arsp pim, in particular, the responses to the following questions that sites had been asked to provide: 1) how has the covid-19 pandemic affected your laboratory operations? and 2) how has the covid-19 pandemic affected your participation in arsp? outcome laboratory operations all 26 sentinel sites reported experiencing operational challenges, which varied in type and extent. most (18/26, 69.2%) of the sentinel sites cited delays in the usual schedule of delivery of reagents and supplies due to transportation issues. another commonly reported supply challenge stemmed from the new requirement to use extra layers of ppe, which resulted in episodes of low or depleted supplies of ppe at nearly two thirds (17/26, 65.4%) of sites. in some areas, suspension of courier services had reportedly delayed the referral of bacterial isolates to ritm for confirmatory testing. half (13/26, 50%) of all sentinel sites reported a decrease in the number of specimens requiring routine culture and sensitivity testing. four reported periodic closure of their outpatient departments. sites also reported a low influx of patients, and the two nongovernment sentinel sites experienced a reduction in revenue for the laboratory. laboratory personnel the majority (14/26, 53.9%) of sentinel sites reported being designated as covid-19 referral hospitals during the pandemic and having to establish or expand their molecular biology facilities. even though this provided opportunities for acquisition of new equipment and increasing laboratory staff capacity for molecular detection of pathogens, it also meant temporary reallocation of space and human resources for rt-pcr testing for covid-19. the majority of sentinel sites also reported encountering various challenges relating to laboratory personnel. ritm has been at the forefront of the philippine covid-19 response for both patient care and laboratory testing. from january to june 2020, ritm served as the primary covid-19 testing centre for the philippines, responsible for more than 90% of all covid-19 tests conducted in the country. in march 2020, to accommodate the surge in demand for reverse transcription polymerase chain reaction (rt-pcr) testing for severe acute respiratory syndrome coronavirus 2 (sars-cov-2), arsrl, together with ritm’s other laboratories, was directed to assist the national testing effort by undertaking some of the procedures required, such as sample inactivation and dna extraction. this directive resulted in the reassignment of arsrl laboratory staff to the covid-19 testing team. facilities, workspaces, equipment and critical resources (reagents, supplies, consumables and personal protective equipment [ppe]) were also repurposed to meet the demand for covid-19 testing. directives were also made to postpone scheduled trainings, monitoring visits and face-to-face meetings – activities usually performed by the reference laboratory – until the end of june 2020. consequently, the number of laboratory technicians who underwent training for amr bacteriology procedures decreased from 27 to 6. by july 2020, sufficient additional staff had been recruited to cover the covid-19 response tasks, allowing existing reference laboratory staff to return to their routine amr surveillance work. however, until the end of 2020 about 20% of arsrl laboratory space remained allocated to the covid-19 response. the annual arsp program implementation meeting (arsp pim) was held virtually via zoom instead of the usual face-to-face format and the publication of the arsp 2019 annual surveillance report was delayed by 5 months. action the impacts of the above-mentioned institutional directives on the operations of ritm’s arsrl were reviewed. in addition, the challenges experienced by the surveillance sentinel sites participating in arsp during the course of 2020 were summarized. in order to assess the impact of the pandemic, arsp performance indicators (and corresponding targets for participation and number of isolates reported to the surveillance system) for 2020 were compared to those wpsar vol 13, no 3, 2022 | doi: 10.5365/wpsar.2022.13.3.917https://ojs.wpro.who.int/ 3 covid-19 impact on philippine amr surveillanceboehme et al to be at work. laboratory personnel from four sites in the national capital region (ncr) reported experiencing difficulties in getting to work due to travel restrictions and suspension of transport services. participation in arsp delays in transporting isolates to arsrl for confirmatory testing, typically because of the lack of courier services, was a common challenge among sentinel sites (9/26, 34.6%). moreover, the decrease in the number of samples requiring testing at sentinel sites also reduced the demand for confirmatory testing of isolates. although automated transmission of data from the sentinel sites to arsrl had already been established seventeen sites (65.4%) experienced a reduction in the number of active-duty staff over several periods due to reassignment to other hospital units for covid-19 sample processing and testing. furthermore, around one third (9/26, 34.6%) reported that on several occasions staff work schedules had to be reduced to a skeletal workforce to maintain physical distancing in the laboratory. staff in high-risk groups were ordered to work from home, further decreasing the number of staff available to work in bacteriology laboratories. eleven sentinel sites (42.3%) reported that they were provided with additional manpower to help overcome staffing challenges. the health status of frontline workers at arsp sites was also affected, with some infected with covid-19 and some experiencing anxiety because of the requirement table 1. performance scores of the philippine antimicrobial resistance surveillance program by sentinel site, 2019 and 2020 performance indicator description target (%) 2019 (%) 2020 (%) 1. on-time submission of regular data percentage of data sent on time to arsrl on a monthly basis 90 68 68 2. completeness of demographic data percentage of data with the minimum demographic data requirements for reporting 95 94 93 3. referral of isolates percentage of isolates referred according to the list agreed upon during the arsp annual meeting (includes pathogens of public health importance based on clsi and who recommendations) 90 48 52 4. concordance in identification percentage of referred isolates with correct bacterial identification confirmed by the arsrl (different targets are set for genus and species levels) 4.1 genus level concordance at the genus level 95 98 98 4.2 species level concordance at the species level 87 96 97 5. concordance in ast percentage of discordant antimicrobial susceptibility results from the sites compared with ast results from arsrl 5.1 critical deviations ast discordance for resistant and susceptible results only ≤5 3 3 5.2 total deviations ast discordance for resistant, susceptible and intermediate results ≤10 7 7 6. inclusion of working diagnosis percentage of data that includes a working diagnosis (disease indicated by physician’s examination that prompted the request for culture and sensitivity testing) 60 68 66 7. completeness of antibiotic panel percentage of amr surveillance data that follows the antibiotic panel agreed upon in the most recent arsp annual meeting 85 59 61 8. encoding of negative results percentage of negative culture results encoded in whonet 85 94 94 amr: antimicrobial resistance; arsp: antimicrobial resistance surveillance program; arsrl: antimicrobial resistance surveillance reference laboratory; ast: antimicrobial susceptibility testing; clsi: clinical laboratory standards institute. wpsar vol 13, no 3, 2022 | doi: 10.5365/wpsar.2022.13.3.917 https://ojs.wpro.who.int/4 boehme et alcovid-19 impact on philippine amr surveillance a gonococcal surveillance sites. table 2. number of isolates with antimicrobial susceptibility testing data submitted to the philippine arsp by sentinel sites in 2019 and 2020, and percentage change from 2019 arsp performance indicators of the 10 reported performance indicators, five were unchanged between 2019 and 2020 (table 1). these were: on-time submission of regular data (1), concordance in identification (genus level) (4.1), concordance in antimicrobial susceptibility testing (ast) (critical deviations) (5.1), concordance in ast (total deviations) (5.2), and encoding of negative results (8). there were decreases for completeness of demographic data (2) and inclusion of working diagnosis (6), but increases for referral of isolates (3), concordance in identification (species level) (4.2), and completeness of antibiotic panel (7). comparison of arsp data submission: 2019 versus 2020 across all sentinel sites, the number of ast data submissions dropped by 38.7%, from a total of 100 334 in 2019 to 61 527 in 2020 (table 2). all sentinel sites in the ncr recorded substantial decreases in reported data, with two sentinel sites unable to submit any ast data at all in 2020. relative to the ncr, sites in visayas had smaller decreases in test data submissions, with one site reporting a 5% increase. in mindanao, a decrease was observed in four out of the six sites (table 2). lessons learnt sentinel sites that submitted the same or increased volumes of amr surveillance data in 2020 were asked to explain how they were able to maintain their 2019 levels of performance despite the pandemic. at site 26, a gonococcal surveillance site, scheduled testing for sex workers continued despite the pandemic, resulting in an increase in submissions, a commendable achievement and one that highlights the importance of retaining amr surveillance for gonococcal infections. site 20’s increase in submitted data may have been due to the increase in the number of admissions due to covid-19 infections, which prompted an increase in requests for ast, especially for those admitted for respiratory symptoms. site 24 reported that they were able to mitigate challenges related to procurement of laboratory reagents and supplies by strengthening communications and coordination with suppliers regarding possible delays, changes and expiration dates of goods for delivery. prior to the pandemic, many sentinel sites still reported experiencing delays in encoding identification and susceptibility data to whonet due to decreased staff numbers in their bacteriology sections. region/sentinel site 2019 2020 % change luzon – national capital region site 1 548 0 –100.00 site 2 4358 0 –100.00 site 3 2371 1019 –57.02 site 4 13 895 6818 –50.93 site 5 507 255 –49.70 site 6 2722 1419 –47.87 site 7 4433 2713 –38.80 site 8 2375 2027 –14.65 luzon – outside national capital region site 9 90 13 –85.56 site 10 3633 1569 –56.81 site 11 2521 1176 –53.35 site 12 5234 2968 –43.29 site 13 4824 3248 –32.67 site 14 5668 3782 –33.27 site 15 4462 3581 –19.74 visayas site 16 2539 1425 –43.88 site 17 3957 2624 –33.69 site 18 10 286 6886 –33.05 site 19a 352 289 –17.90 site 20 3874 4056 +4.70 mindanao site 21 12 177 7412 –39.13 site 22 3181 2076 –34.74 site 23 1205 1115 –8.07 site 24 3409 3735 +9.56 site 25 1644 1192 –27.49 site 26a 69 129 +86.96 total 100 334 61 527 –38.68 wpsar vol 13, no 3, 2022 | doi: 10.5365/wpsar.2022.13.3.917https://ojs.wpro.who.int/ 5 covid-19 impact on philippine amr surveillanceboehme et al online and delaying the publication of the annual surveillance report. there was, however, a reduction in the amount of surveillance data submitted in 2020, a factor that must be considered when interpreting the overall amr rates reported by arsp for 2020. it is possible that the decrease in submitted data was due to the shift towards remote outpatient consultations (to lessen the risk of infection at the sentinel sites), a trend which could introduce bias in patient and testing denominators for the 2020 arsp surveillance data, and which should be considered in the analysis of amr data.6,7 the actions implemented by the participating sentinel sites alleviated much of the negative impact of the pandemic on laboratory operations and logistics. performance indicators revealed that despite the ongoing health crisis, sentinel sites were able to perform their tasks as the primary contributors to national amr data collection. it is imperative for arsrl to disseminate information and encourage other facilities to adopt the good practices observed at these sites. the success and continuity of arsp is contingent upon the collaborative efforts of the reference laboratory and the sentinel sites. the covid-19 pandemic has the potential to exacerbate the amr situation in the philippines and put stewardship efforts at risk. it is imperative therefore that efforts against the development of amr should not cease. further studies should be conducted to provide more information on the impact of the covid-19 pandemic on amr emergence and spread. moreover, the expanded molecular biology facilities established to meet the needs of the covid-19 response should be utilized to enhance national amr surveillance through genomic epidemiology. acknowledgements the authors would like to thank all the focal point persons from the sentinel sites of the philippine antimicrobial resistance surveillance program and the staff of the philippine antimicrobial resistance surveillance reference laboratory for their contributions and support for this paper. we give special thanks to ms. lea platon and ms. allysa marie barnuevo for their valuable assistance in consolidating the data used in this article. practices that proved useful in overcoming challenges caused by the covid-19 pandemic included prompt preparation of a procurement plan for reagents and supplies for covid-19 testing, which helped minimize the risk of depletion of supplies; establishment of a process for sharing laboratory supplies among the reference laboratory and sentinel sites; and use of logistics created for the covid-19 pandemic to support amr surveillance (i.e. some sentinel sites were able to send both isolates for ast and samples for covid-19 testing to ritm simultaneously). discussion the challenges to arsp laboratory operations, including staffing, experienced during the covid-19 pandemic did not appear to reduce overall participation of the sentinel sites in arsp. this could be due, at least in part, to the fact that all sentinel sites, having been involved in arsp for more than 5 years, have surveillance activities ingrained in their operations such that the disruptions of the covid-19 pandemic did not result in lessened participation in surveillance activities. however, we recognize the limitation that the activity reports provided by each site may not have included other relevant aspects of laboratory operations. estimated changes in the performance indicators reported here cannot therefore be conclusively attributed to the actions described by the sentinel sites in their activity reports. the good working relationships between ritm and sentinel site personnel, formed through partnerships that have been in place since 1988, may have been a contributory factor in maintaining high levels of participation in arsp. the practice of recognizing and incentivizing sites with top participation scores, which was established in 2012, may have also encouraged continued participation in arsp during the covid-19 pandemic. the process of automated data transfer, whereby whonet encoded data from the sentinel sites are automatically transmitted to the arsrl server, facilitated the data submission from sentinel sites throughout 2020. arsrl, as the coordinating laboratory, adapted to the challenges caused by the pandemic by adjusting staff schedules and activities, holding the annual pim wpsar vol 13, no 3, 2022 | doi: 10.5365/wpsar.2022.13.3.917 https://ojs.wpro.who.int/6 boehme et alcovid-19 impact on philippine amr surveillance 2. doh covid-19 case bulletin #292. manila: department of health philippines; 2020. available from: https://doh.gov.ph/covid19caseb ulletin292#expanded, accessed 28 february 2022. 3. founou rc, blocker aj, noubom m, tsayem c, choukem s, dongen m, et al. the covid-19 pandemic: a threat to antimicrobial resistance containment. future sci oa. 2021;7(8):fso736. doi:10.2144/fsoa-2021-0012 pmid:34290883 4. hsu j. how covid-19 is accelerating the threat of antimicrobial resistance. bmj. 2020;369:m1983. doi:10.1136/bmj.m1983 pmid:32423901 5. knight gm, glover r, mcquaid cf, olaru id, gllandat k, leclerc q, et al. antimicrobial resistance and covid-19 intersections and implications. elife. 2021;10:e64139. doi:10.7554/elife.64139 pmid:33588991 6. hirabayashi a, kajihara t, yahara k, shibayama k, sugai m. impact of the covid-19 pandemic on the surveillance of antimicrobial resistance. j hosp infect. 2021;117:147–56. doi:10.1016/j. jhin.2021.09.011 pmid:34562548 7. tomczyk s, taylor a, brown a, kraker m, el-saed a, alshamrani m, et al./who amr surveillance and quality assessment collaborating centres network. impact of the covid-19 pandemic on the surveillance, prevention and control of antimicrobial resistance: a global survey. j antimicrob chemother. 2021;76(11):3045–58. doi:10.1093/jac/dkab300 pmid:34473285 conflicts of interest the authors declare no conflicts of interest. ethics statement information included in this article is available in the public domain and is published on the official website of the philippine antimicrobial resistance surveillance reference laboratory. funding none. references 1. world health statistics 2021: monitoring health for the sdgs, sustainable development goals. geneva: world health organization; 2021. available from: https://apps.who.int/iris/handle/10665/342703, accessed 28 february 2022. https://ojs.wpro.who.int/ 1wpsar vol 13, no 3, 2022 | doi: 10.5365/wpsar.2022.13.3.925 original research t he emergence and rapid spread of severe acute respiratory syndrome coronavirus 2 (sarscov-2), the causal pathogen of the coronavirus disease (covid-19) pandemic, has presented health services with major challenges and has disrupted social and economic activities worldwide. as of 15 august 2022, the world health organization (who) had recorded over 587 million confirmed cases and over 6.4 million deaths due to covid-19 worldwide.1 in brunei darussalam, the first wave of the covid-19 pandemic started on 9 march 2020 and lasted until 6 may 2020, the date of the last documented case of community spread. after approximately 15 months of being at who level 2 transmission (low community incidence or a risk of community transmission beyond clusters),2 a second wave, confirmed to be due to the delta strain (sars-cov-2 variant b.1.617.2), started on 7 august 2021. compared with the original sars-cov-2 strain, the delta variant has a higher reproduction number (r0) and was the dominant variant circulating in brunei darussalam during 2021 when this study was conducted.3 differences in the clinical characteristics of cases due to the original and delta strains of the virus have been widely reported in the literature, although these studies have been restricted to patients needing hospital admission.4–8 to date, few studies have compared the first and second waves across the full spectrum of covid-19 disease severity, i.e. by including asymptomatic and symptomatic patients as a national isolation centre, tutong, brunei darussalam. b pengiran anak puteri rashidah sa’adatul bolkiah institute of health sciences, universiti brunei darussalam, bandar seri begawan, brunei darussalam. c department of public health, ministry of health, bandar seri begawan, brunei darussalam. published: 25 august 2022 doi: 10.5365/wpsar.2022.13.3.925 objective: differences in clinical manifestations between strains of severe acute respiratory syndrome coronavirus 2 (sarscov-2) have been reported. this retrospective descriptive study compares the clinical and demographic characteristics of all confirmed coronavirus disease (covid-19) cases admitted to the national isolation centre (nic) in the first wave and at the beginning of the second wave of the pandemic in brunei darussalam. methods: all covid-19 cases admitted to the nic between 9 march and 6 may 2020 (first wave) and 7–17 august 2021 (second wave) were included. data were obtained from nic databases and case characteristics compared using student’s t-tests and chi-squared tests, as appropriate. results: cases from the first wave were significantly older than those from the second wave (mean 37.2 vs 29.7 years, p<0.001), and a higher proportion reported comorbidities (30.5% vs 20.3%, p=0.019). cases from the second wave were more likely to be symptomatic at admission (77.7% vs 63.1%, p<0.001), with a higher proportion reporting cough, anosmia, sore throat and ageusia/dysgeusia; however, myalgia and nausea/vomiting were more common among symptomatic first wave cases (all p<0.05). there was no difference in the mean number of reported symptoms (2.6 vs 2.4, p=0.890). discussion: our study showed clear differences in the profile of covid-19 cases in brunei darussalam between the first and second waves, reflecting a shift in the predominating sars-cov-2 strain. awareness of changes in covid-19 disease manifestation can help guide adjustments to management policies such as duration of isolation, testing strategies, and criteria for admission and treatment. clinical and demographic characteristics of covid-19 cases in brunei darussalam: comparison between the first and second waves, 2020 and 2021 muhammad umer malik,a muhammad syafiq abdullah,a,b pui lin chong,a rosmonaliza asli,a babu ivan mani,a nooraffizan rahman,a natalie riamiza momin,a chin ann lim,a justin wong,c chee fui chonga and vui heng chonga,b correspondence to vui heng chong (email: chongvuih@yahoo.co.uk or vuiheng.chong@moh.gov.bn) wpsar vol 13, no 3, 2022 | doi: 10.5365/wpsar.2022.13.3.925 https://ojs.wpro.who.int/2 malik et alcharacteristics of patients with covid-19 in brunei darussalam patients. data collected included information on patient demographics, comorbidities, reported covid-19 symptoms, disease progression and outcomes. each patient was asked to complete a detailed symptom checklist on admission to the nic, which included questions about symptom onset. case definitions symptom category cases were categorized as (i) asymptomatic (no symptoms experienced during course of illness), (ii) pre-symptomatic (no symptoms at nic admission but developed symptoms later), (iii) symptomatic (symptoms at nic admission) and (iv) recovered (symptoms resolved before nic admission). patients were assigned to a symptom category according to their status at the time of their admission to the nic. disease category for the purposes of this study, four categories of disease were defined: (i) asymptomatic/mild (no symptoms or symptomatic without evidence of pneumonia on chest imaging), (ii) moderate (clinical or imaging evidence of pneumonia), (iii) severe (required oxygen supplementation) and (iv) critical (respiratory failure requiring mechanical ventilation with or without other organ failure). patients’ disease categories were assessed daily and reported to the ministry of health. patients were assigned to the highest category reached during the course of their illness. data analysis patient data were anonymized before analysis. clinical and demographic characteristics of patients from the two waves were compared; tests for statistical significance of differences between the two cohorts were performed as appropriate (student’s t-test for continuous variables and chi-squared test for categorical variables). p values of <0.05 were considered statistically significant. analyses were conducted using spss version 26.0. results during the first wave of the covid-19 pandemic, a total of 141 cases were admitted to the nic. during 7–17 august 2021, the period of the second wave included in this study, 359 cases were admitted. covid-19 cases from well as those with more severe disease. understanding differences between the two waves in disease presentation can help improve the management of patients. during the first wave in brunei darussalam, all confirmed covid-19 patients were admitted to the national isolation centre (nic) for isolation and treatment. during the second wave, community isolation centres (cics) with minimal medical facilities were used to care for asymptomatic or mild cases (i.e. symptomatic cases that did not need specific treatment). recovering patients admitted to the nic were also transferred to cics until they fulfilled criteria for discharge, and patients admitted to cics whose condition subsequently deteriorated were transferred to the nic. until the cics were opened on 18 august 2021, the nic remained the only designated isolation and treatment centre in brunei darussalam for all confirmed cases of covid-19. the objective of this study was to compare the differences between the first and second waves in the clinical and demographic characteristics of all confirmed covid-19 cases in brunei darussalam, including asymptomatic, mild and severe cases. methods study participants all cases admitted to the nic between 9 march and 6 may 2020 (the first wave) and between 7 and 17 august 2021 (the second wave) were included in the study. subjects admitted to the nic after 18 august were not included in this study, as from this date onwards asymptomatic and mild cases of covid-19 were instead admitted to cics. inclusion of subjects admitted to the nic after 18 august would have led to a second wave study population that was biased towards more severe cases and thus not representative of the complete spectrum of covid-19 disease severity. data collection case finding and contact tracing were conducted by the department of public health, and all confirmed covid-19 cases were registered and assigned a unique case identification number. data for all cases were retrieved from prospectively maintained excel databases, created by the various teams set up by the ministry of health’s national covid-19 committee to help with the management of wpsar vol 13, no 3, 2022 | doi: 10.5365/wpsar.2022.13.3.925https://ojs.wpro.who.int/ 3 characteristics of patients with covid-19 in brunei darussalammalik et al the whole 2-month period of the first wave. this was not unexpected given that the delta strain is more contagious than the original and has a higher r0.3,9 in this respect, brunei darussalam’s experience is similar to other countries, with larger second waves widely reported.10–12 for instance, a study in thailand reported a seven-fold increase in case numbers between its first and second waves and another seven-fold increase between its second and third waves.10 as well as the substantial increase in the number of cases, this study has demonstrated distinct differences in the demographic profile of cases between the two waves. cases in the second wave were significantly younger, with a lower proportion of cases occurring in people aged more than 50 years. one possible explanation for this shift to younger cases is the increase in case numbers among children following several outbreaks in schools in one of the country’s four districts at the start of the second wave. other countries have also reported proportionally higher case numbers in the younger population in their second or subsequent waves, which some have attributed to acquired immunity as a result of sars-cov-2 infection, either diagnosed or undiagnosed during previous waves.13,14 however, this is less likely to be true in the case of brunei darussalam as the first wave was quickly controlled and limited to just 141 confirmed cases when the last case of community spread was reported. while the possibility that undetected cases were circulating in the community cannot be ruled out, the numbers were likely to have been small. cases from the second wave were less likely to have comorbidities, which may simply be a reflection of the younger age of the second wave cohort.4–8 of the five specific comorbidities investigated, dyslipidaemia, cardiovascular disease, hypertension and respiratory disorders were more common among cases from the first wave, although the differences were only significant for dyslipidaemia and cardiovascular disease. studies from brazil, japan, spain and the united states of america have also reported similar differences between the first and second wave cases.4–8 as well as being younger and having fewer comorbidities, second wave cases were less severe – exhibiting lower hospitalization rates, shorter lengths of stay, lower requirement for invasive mechanical ventilation and lower in-hospital mortality.5 the first wave were significantly older and were more likely to have cardiovascular comorbidities compared with those in the second wave (table 1). there was no difference in the mean duration of symptoms before admission between first and second wave cases (3.9 ± 3.6 vs 3.6 ± 2.6 days, respectively, p=0.260). however, the mean time between specimen collection and admission to the nic was shorter in the second wave than in the first (0.2 ± 1.0 vs 2.6 ± 2.0 days, respectively, p<0.05). a significantly higher proportion of second wave cases reported symptoms at admission compared with the first wave (77.7% vs 63.1%, respectively, p<0.001). relative to the first wave, patients were significantly more likely to report cough, anosmia, sore throat and ageusia/ dysgeusia, but significantly less likely to report myalgia and nausea/vomiting (all p<0.05) (fig. 1). there was no difference in the number of symptoms reported between the first and the second waves (2.6 ± 1.4 vs 2.4 ± 1.2, respectively, p=0.890). the proportion of asymptomatic patients at admission was higher in the first wave (p<0.001; table 1). however, there was no significant difference between the two waves in terms of the distribution of cases by disease severity (p=0.148; table 1); in both waves, the majority of cases (>80%) were categorized as either asymptomatic or mild. during the first wave, none of the cases were vaccinated as vaccines against covid-19 had not yet become available. of the second wave cases, 13 (3.6%) were fully vaccinated (two doses), 41 (11.4%) were partially vaccinated (one dose) and 305 (85.0%) were unvaccinated. of the unvaccinated cases, 117 (32.6%) were under the age of 18 years and not eligible for vaccination at the time. most of the vaccinated cases had asymptomatic or mild disease, and there were more severe cases in the unvaccinated group (table 2). discussion brunei darussalam experienced a significant increase in the number of covid-19 cases in its second wave of the pandemic in 2021, with nearly three times as many cases recorded just in the first 11 days than in wpsar vol 13, no 3, 2022 | doi: 10.5365/wpsar.2022.13.3.925 https://ojs.wpro.who.int/4 malik et alcharacteristics of patients with covid-19 in brunei darussalam fig. 1. comparison of symptoms reported at admission among covid-19 cases in the first wave (n=141) and second wave (n=359), brunei darussalam, 2020–2021 other symptoms were as follows: fatigue, 39%; myalgia, 24%; dyspnoea, 24%; sore throat, 14%; headache, 14%; diarrhoea, 8%; rhinorrhoea, 7%; and nausea/vomiting, 6.5%.16 however, studies included in this meta-analysis were limited to patients that presented for medical treatment or were hospitalized. in contrast, our study included patients from across the whole spectrum of covid-19 disease severity, including mild and asymptomatic cases, and thus would be expected to yield a lower symptom rate. the proportion of patients who were asymptomatic accounted for almost a quarter of patients in the first wave and approximately 10% in the second wave. a further 12% had recovered by the time they were diagnosed and admitted for isolation, a proportion that remained largely unchanged between the first and second waves. despite the differences in symptom burden between the first and second waves, the majority of cases were categorized as asymptomatic or mild, and fortunately, the proportion of critical cases remained low (<5%). the timing of the roll-out of the vaccination programme in brunei darussalam17 meant that no first wave cases had been vaccinated, and by the end of the study in addition to demographic shifts, we also observed distinct differences in symptom burden. compared with the first wave, the proportion of cases who reported symptoms at admission was significantly higher in the second wave, despite a shorter duration between symptom onset and nic admission. however, there was no difference in the number of symptoms reported. cough, anosmia, sore throat and ageusia/dysgeusia were significantly more common in second wave cases, whereas myalgia and nausea/vomiting were more likely to be reported by first wave cases, albeit in small numbers. it is unlikely that patients would have underreported symptoms such as anosmia and ageusia considering how uncommon and distressing these symptoms can be for patients. other studies conducted in the earlier part of the pandemic have reported variable but generally higher rates of symptoms than we found in our study.15,16 a large meta-analysis which included data for over 60 000 patients reported that 87% of patients (95% confidence interval [ci]: 73–93, p<0.001) had at least one covid-19-related symptom.16 cough was reported by 68% of patients (95% ci: 56–74, p<0.001); rates for first wavep < 0.001 p < 0.001 p = 0.030 p = 0.006 p = 0.001 p = 0.001 70 60 50 40 30 20 10 0 p er ce n ta g e symptoms fe ve r c o u g h r h in o rr h o ea d ia rr h o ea a n o sm ia m ya lg ia so re t h ro at h ea d ac h e n au se a/ vo m it in g d ys p n o ea a g eu si a/ d ys g eu si a second wave wpsar vol 13, no 3, 2022 | doi: 10.5365/wpsar.2022.13.3.925https://ojs.wpro.who.int/ 5 characteristics of patients with covid-19 in brunei darussalammalik et al nic: national isolation centre; sd: standard deviation. numbers in parentheses are percentages. table 1. demographic and clinical characteristics of covid-19 cases in the first and second wave, brunei darussalam, 2020–2021 severe/critical cases in the second wave occurred in the unvaccinated group. cases among children and adolescents, a group that was ineligible for vaccination during the period of our study, were all mild. this is consistent with other studies which also report that children and younger persons are more likely to have mild disease and are at low risk for mortality.18,19 period of the second wave, only 13 (3.6%) patients had been fully vaccinated (two doses). despite the small sample size, our study provides some evidence that two doses of a covid-19 vaccine conferred a benefit. among the fully vaccinated group, over 90% of those who contracted covid-19 had mild disease and there were no cases of severe/critical disease, whereas 23 of the 24 characteristic first wave (n = 141) second wave (n = 359) p age (years; mean ± sd) 37.2 ± 17.4 29.7 ± 16.6 <0.001 age group (years) <13 12 (8.5) 47 (13.1) <0.001 13–18 9 (6.4) 70 (19.5) 19–29 28 (19.9) 76 (21.2) 30–39 30 (21.3) 57 (15.9) 40–49 20 (14.2) 62 (17.3) 50–59 25 (17.7) 29 (8.1) ≥60 17 (12.1) 18 (5.0) sex male 85 (60.3) 190 (52.9) 0.137 female 56 (39.7) 169 (47.1) pregnant patients 2 (1.4) 8 (2.2) 0.560 comorbidity (at least one) 43 (30.5) 73 (20.3) 0.015 diabetes mellitus 8 (5.7) 24 (6.7) 0.678 dyslipidaemia 22 (15.6) 19 (5.3) <0.001 hypertension 22 (15.6) 38 (10.6) 0.120 respiratory disease 8 (5.7) 17 (4.7) 0.665 cardiovascular disease 7 (5.0) 5 (1.4) 0.019 symptom category (at time of nic admission) asymptomatic 33 (23.4) 34 (9.5) <0.001 pre-symptomatic 1 (0.7) 9 (2.5) symptomatic 89 (63.1) 279 (77.7) recovered 18 (12.8) 37 (10.3) disease severity asymptomatic/mild 116 (82.3) 301 (83.8) 0.148 moderate 17 (12.1) 34 (9.5) severe 3 (2.1) 19 (5.3) critical 5 (3.5) 5 (1.4) outcome survival 138 (97.9) 354 (98.6) 0.556 death 3 (2.1) 5 (1.4) wpsar vol 13, no 3, 2022 | doi: 10.5365/wpsar.2022.13.3.925 https://ojs.wpro.who.int/6 malik et alcharacteristics of patients with covid-19 in brunei darussalam table 2. covid-19 cases in the second wave (admitted to the national isolation centre during 7–17 august 2021) by vaccination status and disease severity, brunei darussalam, 2021a a covid-19 vaccination was not available during the first wave and therefore data are not presented for this group. numbers in parentheses are percentages. ethics statement this study used anonymized data and was conducted in accordance with the declaration of helsinki. funding none. references 1. who coronavirus (covid-19) dashboard. geneva: world health organization; 2020. available from: https://covid19.who.int/, accessed 16 august 2022. 2. coronavirus disease 2019 (covid-19): situation report, 72. geneva: world health organization; 2020. available from: https:// apps.who.int/iris/handle/10665/331685, accessed 10 october 2021. 3. liu y, rocklöv j. the reproductive number of the delta variant of sars-cov-2 is far higher compared to the ancestral sars-cov-2 virus. j travel med. 2021;28(7):taab124. doi:10.1093/jtm/taab124 pmid:34369565 4. freitas arr, beckedorff oa, cavalcanti lpg, siqueira am, castro db, costa cfd, et al. the emergence of novel sars-cov-2 variant p.1 in amazonas (brazil) was temporally associated with a change in the age and sex profile of covid-19 mortality: a population based ecological study. lancet reg health am. 2021;1:100021. doi:10.1016/j.lana.2021.100021 pmid:34514463 5. hoogenboom ws, pham a, anand h, fleysher r, buczek a, soby s, et al. clinical characteristics of the first and second covid-19 waves in the bronx, new york: a retrospective cohort study. lancet reg health am. 2021;3:100041. doi:10.1016/j.lana.2021.100041 pmid:34423331 6. saito s, asai y, matsunaga n, hayakawa k, terada m, ohtsu h, et al. first and second covid-19 waves in japan: a comparison of disease severity and characteristics. j infect. 2021;82(4):84–123. doi:10.1016/j.jinf.2020.10.033 pmid:33152376 7. iftimie s, lópez-azcona af, vallverdú i, hernández-flix s, de febrer g, et al. first and second waves of coronavirus disease-19: a comparative study in hospitalized patients in reus, spain. plos one. 2021;16(3):e0248029. doi:10.1371/journal.pone.0248029 pmid:33788866 to our knowledge this study is unique in that, due to our management policy which required all confirmed cases, including asymptomatic and mild cases, to be isolated (at least at the start of the second wave), we were able to compare the characteristics of two cohorts of covid-19 cases, one from the first wave and the other from the second wave, both of which comprised cases across the spectrum of disease severity. had we included patients admitted to the nic after 18 august, we would have artificially shifted the profile of our second wave study cohort towards moderate, severe and critical cases. since more severe cases are typically associated with older age and higher prevalence of comorbidities, as well as a greater frequency of co-infections,20 this would have invalidated our comparisons. however, only including patients from the start of the second wave can itself be a limitation as any clinical and demographic shifts that occurred as the second wave progressed would not have been captured. in conclusion, our study showed a distinct shift in the clinical and demographic characteristics of covid-19 cases in terms of age, comorbidities and symptom burden between the first and second waves in brunei darussalam. this is similar to what has been reported in other countries. knowledge of the changes in disease manifestations can help guide changes in management strategies, such as duration of isolation, testing strategies, and criteria for admission and treatment. further studies will be required to assess if further shifts have occurred as the pandemic progressed. conflicts of interest the authors have no conflicts of interest to declare. vaccination status all cases (n = 359) asymptomatic/mild (n = 301) moderate (n = 34) severe/critical (n = 24) vaccinated 13 12 (92.3) 1 (7.7) 0 (0) partially vaccinated 41 35 (85.4) 5 (12.2) 1 (2.4) unvaccinated 188 137 (72.9) 28 (14.9) 23 (12.2) ineligible 117 117 (100) 0 (0) 0 (0) wpsar vol 13, no 3, 2022 | doi: 10.5365/wpsar.2022.13.3.925https://ojs.wpro.who.int/ 7 characteristics of patients with covid-19 in brunei darussalammalik et al 15. rodriguez-morales aj, cardona-ospina ja, gutiérrez-ocampo e, villamizar-peña r, holguin-rivera y, escalera-antezana jp, et al; latin american network of coronavirus disease 2019-covid-19 research (lancovid-19). clinical, laboratory and imaging features of covid-19: a systematic review and meta-analysis. travel med infect dis. 2020;34:101623. doi:10.1016/j.tmaid.2020.101623 pmid:32179124 16. pormohammad a, ghorbani s, baradaran b, khatami a, j turner r, mansournia ma, et al. clinical characteristics, laboratory findings, radiographic signs and outcomes of 61,742 patients with confirmed covid-19 infection: a systematic review and meta-analysis. microb pathog. 2020;147:104390. doi:10.1016/j.micpath.2020.104390 pmid:32681968 17. media statement on the current situation of covid-19 in brunei darussalam. bandar seri begawan: ministry of health brunei darussalam; 2021. available from: https://www.moh.gov.bn/lists/ latest%20news/newdispform.aspx?id=1089, accessed 10 february 2022. 18. zhang l, peres tg, silva mvf, camargos p. what we know so far about coronavirus disease 2019 in children: a meta-analysis of 551 laboratory-confirmed cases. pediatr pulmonol. 2020;55(8):2115– 27. doi:10.1002/ppul.24869 pmid:32519809 19. bhopal ss, bagaria j, olabi b, bhopal r. children and young people remain at low risk of covid-19 mortality. lancet child adolesc health. 2021;5:e12–3. doi:10.1016/s2352-4642(21)00066-3 pmid:33713603 20. bashir a, abdullah ms, momin nr, chong pl, asli r, ivan bm, et al. prevalence of primary bacterial co-infections among patients with covid-19 in brunei darussalam. western pac surveill response j. 2021;12(3):65–70. doi:10.5365/wpsar.2021.12.3.856 pmid:34703637 8. vahidy fs, drews al, masud fn, schwartz rl, askary bb, boom ml, et al. characteristics and outcomes of covid-19 patients during initial peak and resurgence in the houston metropolitan area. jama. 2020;324(10):998–1000. doi:10.1001/jama.2020.15301 pmid:32789492 9. nyberg t, twohig ka, harris rj, seaman sr, flannagan j, allen h, et al. risk of hospital admission for patients with sars-cov-2 variant b.1.1.7: cohort analysis. bmj. 2021;373:n1412. doi:10.1136/ bmj.n1412 pmid:34130987 10. kunno j, suppawattanabodee b, sumanasrethakul c, wiriyasivaj b, kuratong s, kawchandee c. comparison of different waves during the covid-19 pandemic: retrospective descriptive study in thailand. adv prev med. 2021;2021:5807056. doi:10.1155/2021/5807056 pmid:34659835 11. salyer sj, maeda j, sembuche s, kebede y, tshangela a, moussif m, et al. the first and second waves of the covid-19 pandemic in africa: a cross-sectional study. lancet. 2021;397(10281):1265– 75. doi:10.1016/s0140-6736(21)00632-2 pmid:33773118 12. kar sk, ransing r, arafat smy, menon v. second wave of covid-19 pandemic in india: barriers to effective governmental response. eclinicalmedicine. 2021;36:100915. doi:10.1016/j. eclinm.2021.100915 pmid:34095794 13. marcotte h, piralla a, zuo f, du l, cassaniti i, wan h, et al. immunity to sars-cov-2 up to 15 months after infection. iscience. 2022;25(2):103743. doi:10.1016/j.isci.2022.103743 pmid:35018336 14. hanrath at, payne bai, duncan cja. prior sars-cov-2 infection is associated with protection against symptomatic reinfection. j infect. 2021;82(4):e29–30. doi:10.1016/j.jinf.2020.12.023 pmid:33373652 https://ojs.wpro.who.int/ 1wpsar vol 13, no 4, 2022 | doi: 10.5365/wpsar.2022.13.4.981 lessons from the field problem the international health regulations (2005) require member states to be prepared to detect and respond to public health threats and emergencies.1 core to fulfilling this requirement are public health rapid response teams (rrts), groups of trained professionals from different disciplines with the capacity to rapidly deploy to such events.2 according to the world health organization’s (who’s) asia pacific strategy for emerging diseases and public health emergencies (apsed iii): advancing implementation of the international health regulations (2005),3 rrts are integral to systems designed to rapidly detect and contain public health threats. under apsed iii, the key focus areas of surveillance, risk assessment and response, and therefore public health systems overall, are strengthened through the establishment of rrts and field epidemiology training programmes (fetps).4 there is limited published evidence on the effectiveness of well-functioning rrts during the early investigation and containment of infectious disease outbreaks and clusters. rrts established at the local, national and international levels for west africa during the ebola virus a university of newcastle, newcastle, new south wales, australia. b global outbreak alert and response network, world health organization, geneva, switzerland. c world health organization regional office for the western pacific, manila, philippines. d australian national university, acton, australian capital territory, australia. e hunter new england health, new lambton, new south wales, australia. f surveillance and emergency response unit, national department of health, port moresby, papua new guinea. g world health organization bangladesh country office, dhaka, bangladesh. published: 21 december 2022 doi: 10.5365/wpsar.2022.13.4.981 problem: rapid response teams (rrts) are critical for effective responses to acute public health events. while validated training packages and guidance on rolling out training for rrts are available, they lack country-specific adaptations. documentation is limited on rrt programming experiences in various contexts. context: in papua new guinea, there remain gaps in implementing standardized, rapid mobilization of multidisciplinary rrts at the national, provincial and district levels to investigate public health alerts. action: the human resources needed to respond to the coronavirus disease (covid-19) pandemic forced a review of the rrt training programme and its delivery. the training model was contextualized and adapted for implementation using a staged approach, with the initiation training phase designed to ensure rrt readiness to deploy immediately in response to covid-19 and other public health events. lessons learned: selecting appropriate trainees and using a phased training approach, incorporating after-training reviews, and between-phase support from the national programme team were found to be important for programme design in papua new guinea. using participatory training methods based on principles of adult learning, in which trainees draw on their own experiences, was integral to building confidence among team members in conducting outbreak investigations. discussion: the rrt training experience in papua new guinea has highlighted the importance of codeveloping and delivering a context-specific training programme to meet a country’s unique needs. a staged training approach that builds on knowledge and skills over time, used together with ongoing follow-up and support in the provinces, has been critical in operationalizing ready-to-respond rrts. ready to respond: adapting rapid response team training in papua new guinea during the covid-19 pandemic celeste marsh,a,b sharon salmon,b,c tambri housen,a,b,d james flint,a,b,e joanne taylor,a,e emmanuel hapolo,f maria trinidad velasco ortuzar,a bernnedine sissai smaghi,f anthony eshofoniec,g and berry ropaf correspondence to sharon salmon (email: salmons@who.int) wpsar vol 13, no 4, 2022 | doi: 10.5365/wpsar.2022.13.4.981 https://ojs.wpro.who.int/2 marsh et altraining for impact field epidemiology training in papua new guinea country.12 fetp papua new guinea (fetpng) graduates often take lead roles in outbreak responses and surveillance initiatives. however, there remain gaps at the national, provincial and district levels in the standardized, rapid mobilization of multidisciplinary teams to investigate public health alerts. in recognition of these gaps, the rrt training programme for multidisciplinary rrts within provincial health authorities was conceived and initiated by national leaders in field epidemiology. the vision was for rrts to be operationalized through national and provincial emergency operation centres (eocs) under the leadership of an appointed incident manager (fig. 1). eocs were first established to support the response to the polio outbreak in three provinces (the eastern highlands, madang and morobe), and they were subsequently set up in other provinces. action in november 2019, on request from the national department of health, the who regional office for the western pacific led an rrt training for the national capital district provincial health authority using the who all-hazards approach package.9 with the arrival of the covid-19 pandemic in march 2020, the need to establish functional rrts in other provinces became urgent. an rrt programme team – composed of representatives from the national department of health; fetpng; field epidemiology in action, from the university of newcastle, australia, and hunter new england health, australia; and the who representative office for papua new guinea – collaborated to accelerate the roll out of training across the country. this began with an aftertraining review with the national capital district rrt in may 2020 that highlighted key limitations of the initial training and the need to codevelop a training package tailored to the papua new guinea context. human resources limitations in the context of the pandemic meant that it was not feasible to remove teams from ongoing response operations for 5 days of training. therefore, the training was converted to a 2-day initiation training that covered the basic principles and structure of an rrt to assist provinces in quickly mobilizing teams to respond to both covid-19 and other public health events. initiation training was aimed at incident managers, disease control officers, clinicians, surveillance officers, laboratory scientists, environmental health officers, logisticians, finance administrators, risk communication specialists and health promotion officers. graduates of disease epidemic in 2014–2016 have been credited with containing an outbreak of neisseria meningitidis in liberia in 20175 and another ebola virus disease outbreak in the democratic republic of the congo in 2017.6,7 across the who western pacific region – where infectious disease outbreaks, emerging infectious disease threats and environmental challenges such as unsafe water and natural disasters frequently occur3 – national rrts exist in various forms and at different stages of development. a 2015 evaluation of progress towards goals under apsed iii reported that substantial gains had been made in the effectiveness of the region’s rrts. however, countries also ranked rrts high on their priority lists for improvement.8 to assist countries in building a trained rrt workforce, who’s health emergencies programme produced a validated and standardized all-hazards approach training package in 2015.9 in 2021, a condensed version, aimed at those working on the coronavirus disease (covid-19) response, was developed in conjunction with the government of india and the u.s. centers for disease control and prevention.10 although these are valuable resources, it is essential that such packages, including their mode of delivery, are adapted to local contexts within the region. to support the establishment and capability of rrts, experiences with training and the lessons identified should be documented. we present a model of rrt training and capacity strengthening being piloted in provinces across papua new guinea. context in papua new guinea, public health threats are compounded by a population of 8.8 million that is widely spread across extremely diverse terrain, with 80–85% of people living in rural or geographically isolated settings.11 in recent years, papua new guinea has faced many major public health events, including outbreaks of measles (2017) and cholera (2019), the re-emergence of vaccine-derived poliovirus (2018) and the current covid-19 pandemic. these outbreaks occur in addition to a high baseline burden of endemic diseases and natural disasters that have public health impacts. papua new guinea has an established fetp that has trained 96 field epidemiologists between 2013 and june 2022. the programme has strengthened prevention, detection and response capabilities throughout the wpsar vol 13, no 4, 2022 | doi: 10.5365/wpsar.2022.13.4.981https://ojs.wpro.who.int/ 3 training for impact field epidemiology training in papua new guinea marsh et al and refine rrt operationalization in different emergency contexts. additionally, during phase 5, neighbouring provincial teams come together to strengthen people-topeople links, collaboration and the regional community of practice. in april 2021, to facilitate the development of a national rrt community of practice, the national department of health’s rrt coordinator set up a group channel on the encrypted messaging service whatsapp. this platform has enabled members to seek out information and share ideas about potential clusters or outbreaks. in june 2022, the platform was used to discuss a possible multiprovincial pertussis outbreak. rrt e-learning modules are being designed to complement the various phases of the training programme. these provide an introduction for rrt members who are unable to attend in-person trainings and act as refreshers for those who have attended. although these e-learning fetpng filled one or more of these roles and were the primary provincial contact points for coordinating the training. graduates working at the national department of health served as trainers. building on the initiation training, the rrt programme team codeveloped a phased delivery approach that provided an iterative and sequential pathway to establishing and strengthening rrts over five phases (fig. 2). initiation training (phase 1) facilitates the establishment of an rrt and is the first phase towards rrt accreditation. after-training reviews (phases 2 and 4) support reflections by rrts on their prior training and post-training implementation, and the development of action plans for improving operationalization of the teams. competency-based training (phase 3) focuses on extending multidisciplinary skills and knowledge. ongoing scenario-based training (phase 5) provides the opportunities for rrts to keep current their early detection and response skills, continue to practice after-action reviews fig. 1. infographic of the rapid response team training process distributed to provincial health authorities across papua new guinea, february 2022 wpsar vol 13, no 4, 2022 | doi: 10.5365/wpsar.2022.13.4.981 https://ojs.wpro.who.int/4 marsh et altraining for impact field epidemiology training in papua new guinea fig. 2. rapid response team training model, papua new guinea, may 2022 training in all 22 provinces by the end of 2022, with content and delivery continuing to be adapted based on ongoing monitoring and evaluation activities. where initiation training conducted in 2020–2021 took a justin-time training approach in response to the pandemic and included specific material related to covid-19, training in 2022 has pivoted to focus on roles and responsibilities within rrts. initiation training has been well received. evaluations from training in the first six provinces showed most participants agreed that the rrt outbreak manual was useful (94%, 49/52), the content was relevant to their work (84%, 59/70) and the training was interactive (81%, 55/68). the most common reaction to training by participants – particularly the provincial surveillance and disease control officers, who often felt they carried the rapid response burden alone – was relief that a multidisciplinary team was being formalized and trained. modules reflect the context in papua new guinea, the training has been made available globally to support rrts in similar contexts (e.g. on the field epidemiology in action website at https://www.fieldepiinaction.com and the global outbreak alert and response network training site at https://extranet.who.int/goarn). rrt programme activities are led and coordinated by national fetpng faculty with the support of field epidemiology in action, the who global outbreak alert and response network and the who representative office for papua new guinea. the programme is funded by the indo-pacific centre for health security, department of foreign affairs and trade, australia, and who. lessons learned as of june 2022, rrt initiation training (phase 1) had been conducted in 11 provinces, training 190 rrt members. the programme aims to complete initiation https://www.fieldepiinaction.com https://extranet.who.int/goarn wpsar vol 13, no 4, 2022 | doi: 10.5365/wpsar.2022.13.4.981https://ojs.wpro.who.int/ 5 training for impact field epidemiology training in papua new guinea marsh et al discussion provincial public health rrts are a critical component of papua new guinea’s public health emergency response architecture and are key to strengthening health security in a context where epidemic and endemic diseases continually challenge the country’s fragile public health system. while validated training packages9 and guidance on rolling out training and managing rrts2 are available, experiences in rrt programming in various contexts should be documented. the experience in papua new guinea has highlighted the importance of developing a training programme that meets the needs of a country and its provinces and shifts away from a tick-the-box training model towards a comprehensive, staged training approach that builds knowledge and skills over time. the staged training approach, which includes multiple after-training reviews and ongoing scenario-based training, reflects the u.s. centers for disease control and prevention’s recommendation that individuals involved in rrt undergo “regular, continual training throughout their membership on the rrt”.14 the planned, intermittent, scenario-based training aligns with one of the priorities set for the western pacific region in apsed iii that advises member states to “conduct after-action reviews or simulation exercises that test the readiness of the national surveillance and response system as a whole to respond to outbreaks and other acute public health events”.3 the application of adult learning principles to the design and delivery of training allows rrt members to share their lived experience of the principles being taught and ensures the training is relevant to the local context in which it is delivered. in papua new guinea, the training programme continues to evolve based on findings from the after-training reviews, which have been essential to understanding the contextual challenges in establishing and implementing functional rrts. an evaluation of rrts conducted across 21 countries between 2016 and 2018 found that they faced common challenges in establishing and managing the teams, including developing rosters for rrts, ensuring that rrt members are trained, and that adequate standard operating procedures are lacking.14 that these factors were five after-training reviews were conducted prior to june 2022. factors that had reportedly worked well since initiation training included applying knowledge in the field: the steps of an outbreak investigation, predeployment preparation, the use of checklists and, in one province, the use of psychological first aid in a response to a landslide. reported challenges included developing the rrt manual for the province, ensuring the most appropriate people were selected for training, assigning rrt roles and responsibilities, and accessing timely financial and logistical support for deployment. through root cause analysis, rrts found that progress had been hindered by factors such as team diversion to the covid-19 response, lack of engagement by management, and human resources constraints, which led to many members straddling multiple roles. aftertraining reviews have identified critical challenges and best practices to help rrts develop their own action plans. the commitment of senior leadership to the operationalization of provincial rrts was found to be essential to establish functional teams. senior provincial leaders were invited to the trainings, but their presence varied across provinces. greater effort is needed to communicate early with provincial leaders about the purpose and significance of their presence at the training. the importance of equipping rrt trainers with skills and knowledge about teaching adults was recognized early in the roll out of initiation training. in may 2022, rrt trainers and fetpng faculty attended a train-the-trainers workshop focused on revising training materials and methods of delivery to facilitate adult learning based on kolb’s learning theory.13 lessons learned from this training have been applied to amend the 2-day initiation training and will be applied to the development of phases 3–5. in may 2022, a new position within fetpng was created for a national rrt coordinator, and this has been of significant value to the programme. the role includes conducting ongoing post-training follow-up with provincial rrts; coordinating training activities, monitoring and evaluation; and following up on alerts received through rrt social networks. wpsar vol 13, no 4, 2022 | doi: 10.5365/wpsar.2022.13.4.981 https://ojs.wpro.who.int/6 marsh et altraining for impact field epidemiology training in papua new guinea funding the rapid response team training is funded by the world health organization representative office for papua new guinea, field epidemiology in action (university of newcastle and hunter new england health, australia) and the indo-pacific centre for health security (australian department of foreign affairs and trade). references 1. international health regulations (2005), third edition. geneva: world health organization; 2016. available from: https://www. who.int/publications/i/item/9789241580496, accessed 5 june 2022. 2. greiner a, stehling-ariza t, hoffman a. guidance for u.s. centers for disease control and prevention staff for the establishment and management of public health rapid response teams for disease outbreaks. atlanta (ga): centers for disease control and prevention; 2020. available from: https://www.cdc.gov/coronavirus/2019ncov/downloads/global-covid-19/rrtmanagementguidance-508. pdf, accessed 5 june 2022. 3. asia pacific strategy for emerging diseases and public health emergencies (apsed iii): advancing implementation of the international health regulations (2005). manila: who regional office for the western pacific; 2017. available from: https:// apps.who.int/iris/handle/10665/259094, accessed 13 may 2022. 4. asia pacific strategy for emerging diseases. new delhi: who regional office for south-east asia; 2005. available from: https:// apps.who.int/iris/handle/10665/204797, accessed 13 may 2022. 5. doedeh j, frimpong ja, yealue kd. rapid field response to a cluster of illnesses and deaths—sinoe county, liberia, april– may, 2017. mmwr morb mortal wkly rep. 2017;66(42):1140. doi:10.15585/mmwr.mm6642a4 pmid:29072886 6. owens md, rice j. the angolan pandemic rapid response team: an assessment, improvement, and development analysis of the first self-sufficient african national response team curriculum. disaster med public health prep. 2019;13(3):577–81. doi:10.1017/dmp.2018.122 pmid:30479245 7. who declares an end to the ebola outbreak in the democratic republic of the congo. brazzaville: who regional office for africa; 2017. available from: https://www.afro.who.int/news/ who-declares-end-ebola-outbreak-democratic-republic-congo, accessed 14 june 2022. 8. asia pacific strategy for emerging diseases: evaluation report 2005–2015. manila: who regional office for the western pacific; 2018. available from: https://apps.who.int/iris/ handle/10665/272252, accessed 13 may 2022. also common challenges in the provinces of papua new guinea, where after-training reviews were conducted, emphasizes the importance of ensuring ongoing support from the national programme team throughout the programme cycle and beyond. conclusions papua new guinea has one of the world’s most rural and remote populations, so it is challenging to rapidly mobilize response teams. the development of a highly contextualized training programme built on adult learning theory and delivered in a phased approach is an important part of strengthening papua new guinea’s health security. important lessons have been and will continue to be learned as the roll out of the rrt programme progresses. we hope the approach taken in papua new guinea and the lessons learned will be of benefit to rrt training programmes in similar contexts. acknowledgements the authors acknowledge the technical expertise of and coordination support from the world health organization in papua new guinea, the global outbreak alert and response network, the papua new guinea national department of health, the field epidemiology training programme of papua new guinea and the provincial public health authorities in papua new guinea. conflicts of interest the authors have no conflicts of interest to declare. ethics statement formal ethical approval was not sought as research was not undertaken. approval and permission to publish was received through the papua new guinea national department of health before the paper was submitted for publication. https://www.who.int/publications/i/item/9789241580496 https://www.who.int/publications/i/item/9789241580496 https://www.cdc.gov/coronavirus/2019-ncov/downloads/global-covid-19/rrtmanagementguidance-508.pdf https://www.cdc.gov/coronavirus/2019-ncov/downloads/global-covid-19/rrtmanagementguidance-508.pdf https://www.cdc.gov/coronavirus/2019-ncov/downloads/global-covid-19/rrtmanagementguidance-508.pdf https://apps.who.int/iris/handle/10665/259094 https://apps.who.int/iris/handle/10665/259094 https://apps.who.int/iris/handle/10665/204797 https://apps.who.int/iris/handle/10665/204797 https://www.afro.who.int/news/who-declares-end-ebola-outbreak-democratic-republic-congo https://www.afro.who.int/news/who-declares-end-ebola-outbreak-democratic-republic-congo https://apps.who.int/iris/handle/10665/272252 https://apps.who.int/iris/handle/10665/272252 wpsar vol 13, no 4, 2022 | doi: 10.5365/wpsar.2022.13.4.981https://ojs.wpro.who.int/ 7 training for impact field epidemiology training in papua new guinea marsh et al 12. ropa b, flint j, o’reilly m, pavlin bi, dagina r, peni b, et al. lessons from the first 6 years of an intervention-based field epidemiology training programme in papua new guinea, 2013– 2018. bmj glob health. 2019;4(6):e001969. doi:10.1136/ bmjgh-2019-001969 pmid:31908873 13. kolb da. experiential learning: experience as the source of learning and development. upper saddle river (nj): prentice hall; 1984. 14. greiner al, stehling-ariza t, bugli d, hoffman a, giese c, moorhouse l, et al. challenges in public health rapid response team management. health secur. 2020;18(suppl. 1):s8–13. doi:10.1089/hs.2019.0060 pmid:32004121 9. rapid response teams training implementation package for member states: block 4 – rrt advanced training package [health security learning platform]. geneva: world health organization health emergencies programme; 2021. available from: https:// extranet.who.int/hslp/content/all-hazard-rrt-training-packageversion-20, accessed 2 june 2022. 10. covid-19 national rapid response teams online learning package. geneva: world health organization; 2021. available from: https://extranet.who.int/hslp/training/course/index. php?categoryid=62, accessed 16 june 2022. 11. papua new guinea country brief. canberra: australian government, department of foreign affairs and trade; 2022. available from: https://www.dfat.gov.au/geo/papua-new-guinea/ papua-new-guinea-country-brief, accessed 5 june 2022. https://extranet.who.int/hslp/content/all-hazard-rrt-training-package-version-20 https://extranet.who.int/hslp/content/all-hazard-rrt-training-package-version-20 https://extranet.who.int/hslp/content/all-hazard-rrt-training-package-version-20 https://extranet.who.int/hslp/training/course/index.php?categoryid=62 https://extranet.who.int/hslp/training/course/index.php?categoryid=62 https://www.dfat.gov.au/geo/papua-new-guinea/papua-new-guinea-country-brief https://www.dfat.gov.au/geo/papua-new-guinea/papua-new-guinea-country-brief https://ojs.wpro.who.int/ 1wpsar vol 13, no 3, 2022 | doi: 10.5365/wpsar.2022.13.3.959 surveillance system implementation/evaluation t he tokyo 2020 olympic and paralympic games (the games) were postponed for a year due to the coronavirus disease (covid-19) pandemic. they were finally held from late july to early september 2021. approximately 83 000 athletes, staff, press and sponsors from over 200 countries and areas attended the event and were hosted across japan’s 47 prefectures. mass gatherings can pose a risk of public health emergencies, and event-based surveillance (ebs) for these events is highly recommended.1 ebs is the organized collection and triage of public health signals that are systematically verified and assessed based on their risk to public health.2 it is used to detect public health signals in countries where mass gatherings occur, as well as public health threats from participating countries.1 during the london 2012 olympic and paralympic games, the health protection agency (currently public health england) implemented ebs to provide timely and reliable national epidemic intelligence. ebs sourced events by screening local health authority reports and electronic applications.3 public health and social measures were in place to respond to covid-19 during the games. however, the threat of importation of non-covid-19 infectious diseases and their subsequent spread in the community remained. early detection of acute public health events occurring outside of japan could have triggered the early response and mitigation of these public health incidents occurring during the games. a world health organization regional office for the western pacific, manila, philippines. b national institute of infectious diseases, tokyo, japan. * these authors contributed equally. published: 15 september 2022 doi: 10.5365/wpsar.2022.13.3.959 the establishment of enhanced surveillance systems for mass gatherings to detect infectious diseases that may be imported during an event is recommended. the world health organization regional office for the western pacific contributed to enhanced event-based surveillance for the tokyo 2020 olympic and paralympic games (the games) by using epidemic intelligence from open sources (eios) to detect potential imported diseases and report them to the national institute of infectious diseases (niid), japan. daily screening of media articles on global infectious diseases was conducted using eios, which were systematically assessed to determine the likelihood of disease importation, spread and significant impact to japan during the games. over 81 days of surveillance, 103 830 articles were screened by eios, of which 5441 (5.2%) met the selection criteria for initial assessment, with 587 (0.6%) assessed as signals and reported to niid. none of the signals were considered to pose a significant risk to the games based on three risk assessment criteria. while eios successfully captured media articles on infectious diseases with a likelihood of importation to and spread in japan, a significant manual effort was required to assess the articles for duplicates and against the risk assessment criteria. continued improvement of artificial intelligence is recommended to reduce this effort. use of epidemic intelligence from open sources for global event-based surveillance of infectious diseases for the tokyo 2020 olympic and paralympic games manami yanagawa,a,* john carlo lorenzo,a,* munehisa fukusumi,b tomoe shimada,b ayu kasamatsu,b masayuki ota,b manami nakashita,b miho kobayashi,b takuya yamagishi,b anita samuel,b tomohiko ukai,b katsuki kurosawa,b miho urakawa,b kensuke takahashi,b keiko tsukada,b akane futami,b hideya inoue,b shun omori,b hiroko komiya,b takahisa shimada,b sakiko tabata,b yuichiro yahata,b hajime kamiya,b tomimasa sunagawa,b tomoya saito,b viema biaukula,a tatiana metcalf,a dina saulo,a tamano matsuia and babatunde olowokurea correspondence to tamano matsui (email: matsuit@who.int) wpsar vol 13, no 3, 2022 | doi: 10.5365/wpsar.2022.13.3.959 https://ojs.wpro.who.int/2 yanagawa et alusability of eios for mass gathering data collection using epidemic intelligence from open sources eios was identified as a suitable tool to use for screening publicly available online media articles and sources for unverified reports referencing infectious diseases. with support from the information systems and data management team at who headquarters, the tokyo 2020 eios dashboard was developed by late june 2021 using the agreed sets of countries, infectious diseases and other public health threats to be screened using eios (fig. 2). the selection of 69 countries and areas (box 1) from africa, the americas, asia, europe and oceania was made based on the number of participants and delegations to the two previously held games.1 further, the selection of infectious diseases of interest (box 2) was determined by the prevalence of these diseases among the selected countries. signals about the risk of bioterrorism and outbreaks of unknown origin were also captured. data collection process an automated exclusion process was conducted by eios to filter out the diseases and countries not included in the pre-identified categories of countries and infectious diseases. during manual screening by a who regional office staff member, duplicates and irrelevant articles were discarded. for screened media articles requiring further verification, epidemiological data on the infectious disease of interest were collected manually from the reporting country. media articles that were considered to indicate public health risks were regarded as signals and were then compiled in a daily media screening report. this report includes the category of the disease of interest in each media signal, a summary of the available information on the situation, and the continent and country where the signal was reported. when available, details on the action and response taken by the local health authorities were included to support the risk assessment. the japanese national institute of infectious diseases (niid) conducted enhanced ebs to capture infectious diseases occurring overseas during the games,1 which comprised their pre-existing ebs system plus external systems. the epidemic intelligence from open sources (eios) system, operated by the world health organization (who) regional office for the western pacific, was one of the external systems used. eios was built to assist in the early detection, verification, assessment and communication of public health signals and events4 by capturing and aggregating publicly available information, categorizing the information with keywords and providing the results in a secure dashboard. eios enables users to monitor media articles of interest on the dashboard by filtering pre-identified keywords, such as the names of countries and diseases.5 eios was the main surveillance tool used for the games to capture articles on infectious diseases and other public health threats occurring outside of japan. we describe the experiences and lessons learned from using eios for enhanced ebs and risk assessment during the games. we focused on the screened and assessed media articles on infectious diseases, the continued improvement of artificial intelligence in advancing the use of eios as a surveillance tool in mass-gathering events, and collaboration and information sharing between niid and the who regional office. methods design and planning the planning of routine and ad hoc surveillance activities, as well as the information-sharing mechanisms included in the enhanced ebs using eios (fig. 1), were jointly determined by niid and the who regional office before the start of ebs operations. enhanced ebs and risk assessment for the games was conducted from 1 july to 19 september 2021, covering the period prior to and after both the olympic and paralympic games, which were held from 23 july to 8 august 2021 and from 24 august to 5 september 2021, respectively. wpsar vol 13, no 3, 2022 | doi: 10.5365/wpsar.2022.13.3.959https://ojs.wpro.who.int/ 3 usability of eios for mass gatheringyanagawa et al fig 1. flow chart of eios use during the tokyo 2020 olympic and paralympic games for event-based surveillance and risk assessment eios: epidemic intelligence from open sources; niid: national institute of infectious diseases, tokyo, japan. eios: epidemic intelligence from open sources. source: eios [online database]. berlin: who hub for pandemic and epidemic intelligence; 2021. fig. 2. example of how the eios dashboard was used for the tokyo 2020 olympic and paralympic games 1a. eios detects raw media information based on criteria (automated) 1b. manual selection of signals 1c. exclusion of duplicates and irrelevant signals 4. feedback 2. manual risk assessment based on three criteria 3. information sharing with niid risk assessment each selected media signal was assessed using the following criteria: • criterion 1: does the condition have the likelihood of importation of infectious disease? (yes/no) • criterion 2: does the condition have the likelihood of transmission among games personnel and the community? (yes/no) • criterion 3: does the condition have the likelihood of having a significant impact on society? (yes/ no) if criterion 1 was marked “no”, criteria 2 and 3 were not assessed. criterion 3 focused on bioterrorism signals as they can have a significant impact on society. additional information on the disease, including seasonality, trends, recent outbreaks and other epidemiological data, were collected and shared with niid to increase confidence in the assessment for each criterion. information sharing and feedback the assessed signals compiled in the daily media screening reports by the who regional office were shared wpsar vol 13, no 3, 2022 | doi: 10.5365/wpsar.2022.13.3.959 https://ojs.wpro.who.int/4 yanagawa et alusability of eios for mass gathering box 1. initial eios criteria for screening targeted countries and areas during the tokyo 2020 olympic and paralympic games box 2. initial eios criteria for screening targeted infectious diseases and events during the tokyo 2020 olympic and paralympic games i. africa: egypt, kenya, morocco, nigeria, south africa, tunisia. ii. americas: argentina, brazil, canada, colombia, cuba, jamaica, mexico, peru, united states of america, venezuela. iii. asia: afghanistan, bangladesh, cambodia, china, hong kong sar (china), india, indonesia, islamic republic of iran, kazakhstan, malaysia, mongolia, myanmar, nepal, pakistan, philippines, republic of korea, singapore, sri lanka, taiwan (china), thailand, uzbekistan, viet nam. iv. europe: austria, belarus, belgium, bulgaria, croatia, czech republic, denmark, finland, france, germany, greece, hungary, ireland, italy, lithuania, netherlands, norway, poland, portugal, romania, russian federation, serbia, slovenia, spain, sweden, switzerland, turkey, ukraine, united kingdom of great britain and northern ireland. v. oceania: australia, new zealand. source: eios [online database]. berlin: who hub for pandemic and epidemic intelligence; 2021. i. human-to-human: acute gastroenteritis, bacterial meningitis, diphtheria, hepatitis b, influenza, measles, meningococcal infection, middle east respiratory syndrome, mumps, pertussis, polio, rubella, sexually transmitted infections (chlamydia infection, gonococcal infection, hiv, syphilis), tuberculosis, varicella. ii. foodborne: amoebiasis, botulism, cholera, cryptosporidiosis, enterohaemorrhagic escherichia coli, giardiasis, hepatitis a, hepatitis e, listeriosis, shigellosis, typhoid/paratyphoid. iii. soil/waterborne: coccidiosis, cryptococcus gattii infection, histoplasmosis legionellosis, leptospirosis, melioidosis, strongyloidiasis, tetanus. iv. zoonosis: anthrax, avian influenza, brucellosis, hantavirus infection, hendra virus infection, lassa fever, monkeypox, q fever, rabies, rift valley fever, rissa virus infection, south american haemorrhagic fever, tularaemia. v. mosquito-borne: barmah forest virus infection, chikungunya, dengue, east equine encephalitis, japanese encephalitis, la crosse encephalitis, malaria, oropouche fever, ross river virus infection, saint louis encephalitis, west equine encephalitis, west nile fever, yellow fever, zika virus disease. vi. tick-borne: african spotted fever, anaplasmosis, crimean-congo haemorrhagic fever, colorado tick fever, ehrlichiosis, kyasanur forest fever, lyme disease, omsk haemorrhagic fever, powassan encephalitis, queensland tick typhus, recurrent fever, severe fever with thrombocytopenia syndrome, spotted fever (mediterranean spotted fever, rocky mountain spotted fever and other spotted fever groups), tick-borne encephalitis. vii. other arthropod-borne: chagas disease, leishmaniasis, plague, scrub typhus. viii. potential risk of bioterrorism: white powder, attack. ix. disease outbreaks with unknown etiology: symptoms (coma, respiratory, diarrhoea, haemorrhage, fever). source: eios [online database]. berlin: who hub for pandemic and epidemic intelligence; 2021. wpsar vol 13, no 3, 2022 | doi: 10.5365/wpsar.2022.13.3.959https://ojs.wpro.who.int/ 5 usability of eios for mass gatheringyanagawa et al with niid on a daily basis for their assessment against the playbooks, which were a set of guidelines prepared by the tokyo organizing committee of the olympic and paralympic games that outlined the responsibilities and rules of all the games participants and games-related personnel. they were also compiled by niid in the daily situational report, together with data on priority notifiable infectious diseases in japan and covid-19 information relevant to the games. the daily situational report was disseminated to japan’s local health authorities and to who through the international health regulations (ihr) communication mechanism. results between 1 july and 19 september 2021, a total of 103 830 media articles appeared on the tokyo 2020 eios dashboard. of these, 5441 (5.2%) were deemed relevant to public health threats and manually screened, out of which 587 (0.6%) were regarded as signals and were reported to niid (table 1). table 1. number and proportion of signals detected through the eios dashboard for the tokyo 2020 olympic and paralympic games, assessment outcomes and reported diseases that met criteria 1 and 2, 1 july to 19 september 2021 eios: epidemic intelligence from open sources. a criterion 1: does the condition have the likelihood of importation of infectious disease? b criterion 2: does the condition have the likelihood of transmission among tokyo 2020 personnel and the community? c criterion 3: does the condition have the likelihood of having a significant impact on society? among the 587 signals, 211 (35.9%) had “yes” for both criteria 1 and 2, emphasizing the likelihood of their importation into japan through the games and spread to the local community. about 82% (173 of 211 with “yes” for criteria 1 and 2) were mosquito-borne diseases such as dengue, chikungunya and zika virus disease. of these 173 mosquito-borne disease signals, dengue accounted for 139 (80.3%). the who south-east asia region and the who region of the americas reported the most dengue signals with 78 (56.1%) and 39 (28.1%) signals, respectively. sexually transmitted infections were the next most common at 13.7% (29/211), and diseases with unspecified causative agents accounted for the remaining 2.8% (6/211) of signals. of all reported signals, 0.3% (2/587) had “yes” for criterion 3, implicating the likelihood of having a significant impact on society. none of the signals detected were assessed as having the likelihood of a significant impact on the games. signals number of articles (%) detected through eios (n=103 830) not screened (did not meet selection criteria) 98 389 (94.7) screened and discarded 4854 (4.7) screened and reported as signals 587 (0.6) assessment of signals (n=587) “no” for criterion 1a 329 (56.0) “yes” for criterion 1 258 (44.0) “yes” for criteria 1 and 2b 211 (35.9) “yes” for criterion 3c 2 (0.3) reported diseases of signals that met criteria 1 and 2 (n=211) mosquito-borne diseases 173 (82.0) sexually transmitted infections 29 (13.8) unknown diseases 6 (2.8) others 3 (1.4) wpsar vol 13, no 3, 2022 | doi: 10.5365/wpsar.2022.13.3.959 https://ojs.wpro.who.int/6 yanagawa et alusability of eios for mass gathering screening the results as duplicated content would only appear once. it would also show if a signal has high media attention without omitting valuable information from other media articles. moreover, inclusion and exclusion features of a specific category based on international political and social conditions would be effective in reducing irrelevant articles and minimizing the clamour from incidents with high international media attention. an additional function able to search articles from an official information source may also contribute to increasing specificity and reducing the time spent manually screening eios articles. the major advantage of using eios during the games was the timely and consistent identification of global epidemiological information, which complemented niid’s other ebs activities and supported the conduct of appropriate risk assessment.1 this timely detection and quality-assured risk assessment enabled the japanese ministry of health, labour and welfare (mhlw) and the who regional office to consider whether facilitating ihr communication for further verification was necessary. through collaboration and information sharing, and having eios managed externally, mhlw and niid were able to receive relevant information on potential public health events that could have resulted in imported disease during the games. eios was a successful component of the enhanced surveillance system for infectious diseases and public health threats that could have impacted the games. conflicts of interest the authors have no conflicts of interest to declare. ethics approval ethics approval was not required. information collected using eios regarding infectious disease outbreaks and situations in different countries was collected from open sources that are readily available to the public through their respective websites. funding none. further, none of the signals required the activation of the ihr communication mechanism. discussion eios provided an enhanced surveillance system with quality-assured risk assessment for the games. none of the 587 signals reported had a potentially significant impact on the games. one of the possible reasons may be the significant decrease in infectious disease activity due to public health and social measures for covid-19 globally. population mobility restrictions, international and domestic travel measures, and school closures resulted in the decline of several infectious diseases, especially vaccine-preventable diseases.6–8 decreases were also observed for respiratory infectious diseases globally, during and after the implementation of community control strategies for covid-19.9–11 however, some decrease in cases of infectious diseases might be caused by potential under-detection due to less opportunity for testing and/or delays in final diagnosis as a consequence of overwhelmed health-care systems and the fear of being treated as a suspected covid-19 case.12,13 even though none of the detected signals were considered significant, the detection, monitoring and information-sharing processes pertaining to acute public health events occurring outside japan were valuable. as eios displays publicly available articles from multiple sources tagged by pre-identified categories, it was considered a good tool to capture information on infectious diseases occurring globally. however, eios displays multiple replicated articles, revealing duplication of effort in conducting ebs screening activities. due to its sensitivity, eios also displays irrelevant articles which significantly increases the number of articles tagged for events with high media attention. so as to improve the use of eios as a mass gathering surveillance tool, continued use and improvement of artificial intelligence that selects and clusters articles with duplicate content before being displayed on the eios dashboard should be considered. clustering similar media signals would lessen the time spent manually wpsar vol 13, no 3, 2022 | doi: 10.5365/wpsar.2022.13.3.959https://ojs.wpro.who.int/ 7 usability of eios for mass gatheringyanagawa et al references 1. kasamatsu a, ota m, shimada t, fukusumi m, yamagishi t, samuel a, et al. enhanced event-based surveillance for imported diseases during the tokyo 2020 olympic and paralympic games. western pac surveill response j. 2021;12(4):1–7. doi:10.5365/ wpsar.2021.12.4.903 pmid:35251745 2. public health for mass gatherings: key considerations. geneva: world health organization; 2015. available from: https://www. who.int/publications/i/item/public-health-for-mass-gatherings-keyconsiderations, accessed 22 september 2021. 3. severi e, kitching a, crook p. evaluation of the health protection event-based surveillance for the london 2012 olympic and paralympic games. euro surveill. 2014;19(24):20832. doi:10.2807/15607917.es2014.19.24.20832 pmid:24970374 4. a guide to establishing event-based surveillance. manila: who regional office for the western pacific; 2008. available from: https:// apps.who.int/iris/handle/10665/207737, accessed 29 october 2021. 5. epidemic intelligence from open sources initiative (eios). geneva: world health organization; 2019. available from: https://www.who. int/initiatives/eios, accessed 22 september 2021. 6. kitano t. the estimated burden of 15 vaccine-preventable diseases from 2008 to 2020 in japan: a transition by the covid-19 pandemic. j infect chemother. 2021;27(10):1482–8. doi:10.1016/j. jiac.2021.06.021 pmid:34244054 7. middeldorp m, van lier a, van der maas n, veldhuijzen i, freudenburg w, van sorge nm, et al. short term impact of the covid-19 pandemic on incidence of vaccine preventable diseases and participation in routine infant vaccinations in the netherlands in the period march-september 2020. vaccine. 2021;39(7):1039– 43. doi:10.1016/j.vaccine.2020.12.080 pmid:33478793 8. adegbija o, walker j, smoll n, khan a, graham j, khandaker g. notifiable diseases after implementation of covid-19 public health prevention measures in central queensland, australia. commun dis intell. 2021;45. doi:10.33321/cdi.2021.45.11 pmid:33632091 9. huh k, jung j, hong j, kim m, ahn jg, kim jh, et al. impact of nonpharmaceutical interventions on the incidence of respiratory infections during the coronavirus disease 2019 (covid-19) outbreak in korea: a nationwide surveillance study. clin infect dis. 2021;72(7):e184–91. doi:10.1093/cid/ciaa1682 pmid:33150393 10. rotulo ga, percivale b, molteni m, naim a, brisca g, piccotti e, et al. the impact of covid-19 lockdown on infectious diseases epidemiology: the experience of a tertiary italian pediatric emergency department. am j emerg med. 2021;43:115–7. doi:10.1016/j. ajem.2021.01.065 pmid:33556796 11. sullivan sg, carlson s, cheng ac, chilver mb, dwyer de, irwin m, et al. where has all the influenza gone? the impact of covid-19 on the circulation of influenza and other respiratory viruses, australia, march to september 2020. euro surveill. 2020;25(47):2001847. d o i :10 . 2 8 0 7/ 1 5 6 0 -7 9 17. e s . 2 0 2 0 . 2 5 . 4 7. 2 0 0 1 8 4 7 pmid:33243355 12. steffen r, lautenschlager s, fehr j. travel restrictions and lockdown during the covid-19 pandemic—impact on notified infectious diseases in switzerland. j travel med. 2020;27(8):taaa180. doi:10.1093/jtm/taaa180 pmid:33152761 13. saah fi, amu h, seidu aa, bain le. health knowledge and care seeking behaviour in resource-limited settings amidst the covid-19 pandemic: a qualitative study in ghana. plos one. 2021;16(5):e0250940. doi:10.1371/journal.pone.0250940 pmid:33951063 https://ojs.wpro.who.int/ 1wpsar vol 14, no 1, 2023 | doi: 10.5365/wpsar.2023.14.1.931 surveillance report i n 2021, there were an estimated 10.6 million cases and 1.4 million deaths from tuberculosis (tb) globally, with 14% of cases in the western pacific region.1 the first national tb prevalence survey in mongolia was conducted in 2014–2015; it estimated the pulmonary tb prevalence to be 441 per 100 000 population, and the prevalence of all forms of tb to be 757 per 100 000 population.2 based on the newly available data, tb incidence was re-estimated by the world health organization (who) to be 437 (uncertainty range: 224–719) per 100 000 population,3 ranking mongolia among the 30 countries with the highest tb incidence in the world.1 mongolia’s national tuberculosis programme (ntp) surveillance system is a combination of a paper-based aggregated system and a digital case-based system that covers tb cases from screening through to completion of treatment. subnational analysis of key tb indicators and trends over time is useful for programmatic decisionmaking and helps to increase programmatic impact where interventions can be tailored to local dynamics.4,5 through analysis of routine surveillance data, we report tb epidemiology and key programmatic indicators at the national and subnational levels for 2015–2019. methods description of the surveillance system in mongolia, tb cases can be detected through passive case detection, in which symptomatic individuals attending primary care facilities are screened for tb. those who present with a persistent cough are referred to a tb dispensary for a diagnostic evaluation by sputum smear microscopy. if smear-positive, the patient is registered as a confirmed tb case and is started on treatment; if smear-negative, a chest x-ray is conducted. since 2017, the xpert mtb/rif test is also conducted where possible. a national tuberculosis programme, ministry of health, ulaanbaatar, mongolia. b instituto de medicina tropical alexander von humboldt, universidad peruana cayetano heredia, lima, peru. c world health organization regional office for the western pacific, manila, philippines. d world health organization representative office for mongolia, ulaanbaatar, mongolia. published: 24 march 2023 doi: 10.5365/wpsar.2023.14.1.931 mongolia has a high tuberculosis (tb) burden. data from routine paper-based surveillance were used to describe the epidemiology of tb in mongolia; the data included testing presumptive tb cases, tb notifications, drug-resistant cases, treatment outcomes and notifications in prisoners. the proportion of the population tested for tb increased between 2015 and 2019. the number and rate per 100 000 population of tb notifications decreased between 2015 and 2018 and then increased in 2019. most tb notifications in 2019 were in the capital, ulaanbaatar (59.3%), followed by the central (16.8%), khangai (10.4%), east (8.5%) and west (5.0%) regions. about half of tb notifications nationally were bacteriologically confirmed (45.4% in 2015, 48.1% in 2019), with the proportion of bacteriologically confirmed tb per province or district varying from 0% to 66%. high tb notification rates were observed in 2019 for males aged 15–54 years (202 per 100 000 population) and females aged 15–34 years (190 per 100 000 population). treatment success for all forms of tb was 90% in 2019 but was below the 90% target for bacteriologically confirmed cases. between 2015 and 2019, the number of rr/mdr-tb notifications ranged from 265 to 211. the mongolian national tuberculosis programme needs to continue its efforts in tb control, to further increase the programmatic impact and reduce the tb burden. it is recommended that mongolia continue to increase tb screening, the use of xpert testing, contact investigations and preventive treatments, and targeting interventions to the high-burden areas identified in this subnational analysis. epidemiology of tuberculosis in mongolia: analysis of surveillance data, 2015–2019 tsolmon boldoo,a larissa otero,b,c borgil uranchimeg,a anuzaya purevdagva,d temuulen enebish,a oyunchimeg erdenee,a tauhid islamc and fukushi morishitac correspondence to larissa otero (email: larissaotero@gmail.com) wpsar vol 14, no 1, 2023 | doi: 10.5365/wpsar.2023.14.1.931 https://ojs.wpro.who.int/2 boldoo et altuberculosis epidemiology in mongolia corp, 16.0, college station, tx, united states of america) was used for analysis. rr/mdr-tb treatment outcomes were analysed for the 2017 cohort only because in most cases treatment duration is 24 months. results testing of presumptive tb cases the proportion of the population tested for tb increased from 2015 to 2019, as did the proportion of the population tested by x-ray (fig. 1). in 2019, 85.7% (n = 4664/5422) of registered tb contacts were tested, with 4.0% (n = 185) diagnosed with tb. these were slight increases compared with 2015 (81% and 3.3%, respectively). the proportion of child contacts (aged 0–14 years) who were tst-positive was 20.2% (n = 424/2102) in 2019, an increase from 16.7% (n = 324/1936) in 2015. the proportion of tst-positive child contacts who started on tb-preventive treatment was 71.2% (n = 302/424) in 2019, an increase from 46.0% (n = 149/324) in 2015. the smear positivity rate was 8% (n = 2376/28 753) in 2019, a decrease from 12% (n = 2812/23 703) in 2015. this varied subnationally, from 5% (n = 570/14 301) in 21 provinces to 10% (n = 3565/36 714) in ulaanbaatar. of the 17 854 xpert mtb/rif tests done in 2019, 3070 (17.2%) were mtb-positive, of which 261 (8.5%) were rr-tb. case notifications by patient type the number and rate of notified tb cases decreased between 2015 and 2018, and then increased in 2019 (fig. 2a). the increase in 2019 was observed for bacteriologically confirmed tb, extra-pulmonary tb and clinically diagnosed tb (fig. 2b). in 2019, there were 133 per 100 000 population new and relapse tb cases notified, representing 31% of the who-estimated incident cases (n = 14 000).7 of all tb notifications in 2019, 85.4% (n = 3624) were new cases, 11.0% (n = 465) were relapse cases, 3.4% (n = 146) were cases requiring retreatment after treatment failure or ltfu and 0.2% (n = 9) had unknown tb treatment history. cases can also be detected through screening of close contacts of tb cases or through active case finding in high-risk groups (e.g. people living with hiv, miners and prisoners). contacts and high-risk groups are tested through symptom screening and chest x-ray, and the tuberculin skin test (tst) is also used for child contacts. contacts and those from high-risk groups who are positive on screening are referred for diagnostic evaluation to tb dispensaries. all cases are registered on paper forms at the tb dispensaries; staff then compile aggregate monthly reports of notifications and treatment outcomes and send them to the provincial level, where they are aggregated each quarter and sent to the national level, where they are collated and reviewed for timeliness, completeness and accuracy by an ntp statistician. the system uses standardized tb collection forms updated with the latest who reporting framework for tb case detection and treatment outcomes.6 from 2018, the digital case-based system, tubis, has been used to collect individual case data, capturing 90% of the data from the paper-based system. data analysis national tb surveillance data for 2015–2019 were retrospectively analysed, using data sourced from the aggregated paper-based system. rates were calculated using population projections from the national statistical office of mongolia, and vital and civil registration from the 2010 census for the denominator. analysis included testing of presumptive tb cases and number of notifications by age, sex, patient type and location, drug-resistant cases, treatment outcomes and notifications in prisoners. patient type was classified into bacteriologically confirmed tb, extra-pulmonary tb, clinically diagnosed tb and other previously treated tb. subnational analysis was conducted for the east, central, khangai and west regions, plus the capital ulaanbaatar. regions were further analysed by their provinces, and ulaanbaatar by its districts. drug resistance categories included cases with mono-drug and poly-drug resistance, and cases with rifampicin resistance or multidrug resistance (rr/mdr). treatment outcomes for bacteriologically confirmed tb cases included treatment success, treatment failure, death and loss to follow-up (ltfu). stata software (stata wpsar vol 14, no 1, 2023 | doi: 10.5365/wpsar.2023.14.1.931https://ojs.wpro.who.int/ 3 tuberculosis epidemiology in mongoliaboldoo et al case notifications by sex and age in 2019 the highest numbers of case notifications in 2019 were seen in males aged 15–54 years and females aged 15–34 years (fig. 6). this distribution varied by tb type: 57.2% of new cases were male, with a mean (± standard deviation [sd]) age of 33 (± 17.3) years, whereas 66.9% of relapse cases were male, with a mean age of 40 (± 13.9) years. in 2019, 9.1% (n = 415) of tb notifications were aged under 15 years and 2.7% (n = 121) were aged under 5 years. subnational analysis showed large variations in the proportion of cases by age group and among children, with some provinces having no paediatric tb notifications or only small numbers of such notifications (fig. 7). drug-resistant tb between 2015 and 2019, the number of rr/mdr-tb notifications ranged from 265 to 211 (fig. 8). in 2019, 211 rr/mdr-tb cases were diagnosed; of these, 92% (n = 193) were enrolled in second-line tb treatment, an increase from 85% of the 265 cases in 2015. seven extensively drug-resistant tb (xdr-tb) cases were diagnosed in 2019. of the 211 rr/mdr-tb cases, 46.9% (n = 99) were new cases and 41.7% (n = 88) were relapse and the combined proportion of cases requiring retreatment and relapse cases increased from 13.2% (n = 652/4935) in 2015 to 14.4% (n = 611/4244) in 2019. the proportion of extra-pulmonary tb cases decreased from 41.9% (n = 2068/4935) in 2015 to 35.7% (n = 1513/4244) in 2019. bacteriologically confirmed tb cases comprised about half of all tb cases (45.5% [n = 2244/4935] in 2015 and 48.1% [n = 2041/49244] in 2019). of the pulmonary cases, 74.8% (n = 2043/2731) were bacteriologically confirmed in 2019. subnational case notifications most notifications in 2019 occurred in ulaanbaatar, followed by the central (excluding ulaanbaatar), khangai, east and west regions (table 1). the notification rate increased in the east region from 2017, and in the other four regions from 2018 (fig. 3a). the proportion of cases that were bacteriologically confirmed increased from 2016 in ulaanbaatar and khangai, from 2017 in central and from 2018 in the west region (fig. 3b). notification rates per 100 000 varied substantially across provinces in 2019, ranging from 37 to 172 (fig. 4). in 2019, the proportion of bacteriologically confirmed tb per province or district within each region varied substantially (ulaanbaatar: 0–51%, east: 34–60%, central: 43–66%, khangai: 38–57% and west: 39–58%) (fig. 5). fig. 1. proportion of the population examined for tb by test, mongolia, 2015–2019 9.6 9.4 13.6 14.1 15.2 5.6 5.8 8.3 8.7 8.2 1.1 1.1 1.2 1.2 1.2 0.1 0.1 0.1 0.1 0.2 0.0 2.0 4.0 6.0 8.0 10.0 12.0 14.0 16.0 2015 2016 2017 2018 2019 pr op or tio n of th e po pu la tio n year examined by any method screened by x-ray tested by smear tested by culture or xpert wpsar vol 14, no 1, 2023 | doi: 10.5365/wpsar.2023.14.1.931 https://ojs.wpro.who.int/4 boldoo et altuberculosis epidemiology in mongolia treatment outcomes the proportion of tb notifications with treatment success increased from 88.8% in 2015 to 90.0% in 2019. the proportion of deaths decreased from 4.6% in 2015 to 2.5% in 2019. the proportion of cases that were ltfu was stable (4.6% in 2018), as was the proportion other previously treated cases. of new rr/mdr-tb cases, 40.4% were female, similar to the proportion seen in all tb notifications. the mean age for new rr/ mdr-tb cases was 34.9 (± 18.4) years, similar to the proportion seen in all tb notifications (33 ± 17.3). the mean age for relapse and other previously treated rr/ mdr cases was 41 (± 14.3). fig. 2. (a) number and rate per 100 000 population of tb notifications, and (b) tb notification rates per 100 000 population by type of tb, mongolia, 2015–2019 eptb: extra-pulmonary tuberculosis. 58.4 45.8 20.9 4.7 0 10 20 30 40 50 60 70 80 2015 2016 2017 2018 2019 tb n ot if ic at io n ra te p er 1 00 0 00 p op ul at io n bacteriologially confirmed, new and relapse eptb, new and relapse clinically diagnosed, new and relapse other previously treated 4843 4596 4356 3999 4190 160 149 138 125 128 0 20 40 60 80 100 120 140 160 180 3800 4000 4200 4400 4600 4800 5000 2015 2016 2017 2018 2019 tb n ot if ic at io n ra te p er 1 00 0 00 p op ul at io n n um be r of t b n ot if ic at io ns notifications rates 58.4 45.8 20.9 4.7 0 10 20 30 40 50 60 70 80 2015 2016 2017 2018 2019 tb n ot if ic at io n ra te p er 1 00 0 00 p op ul at io n bacteriologially confirmed, new and relapse eptb, new and relapse clinically diagnosed, new and relapse other previously treated 4843 4596 4356 3999 4190 160 149 138 125 128 0 20 40 60 80 100 120 140 160 180 3800 4000 4200 4400 4600 4800 5000 2015 2016 2017 2018 2019 tb n ot if ic at io n ra te p er 1 00 0 00 p op ul at io n n um be r of t b n ot if ic at io ns notifications ratesa b wpsar vol 14, no 1, 2023 | doi: 10.5365/wpsar.2023.14.1.931https://ojs.wpro.who.int/ 5 tuberculosis epidemiology in mongoliaboldoo et al table 1. number and rate per 100 000 population of tb notifications by treatment history and proportion of retreatment and extra-pulmonary tb by province or district, mongolia, 2019 region and provinces or districts population notifications (n) rates per 100 000 population percentage (%) new and relapse previously treated new and relapse previously treated retreatment extra pulmonary tb ulaanbaatar 1 515 593 2359 127 156 8 5.1 37.1 baganuur 28 570 25 0 88 0 0 28.0 bayangol 225 840 318 7 141 3 2.2 48.0 bayanzurkh 361 689 638 52 176 14 7.5 48.0 nalaih 37 659 40 5 106 13 11.1 37.8 songinokhairkhan 327 580 581 30 177 9 4.9 38.3 sukhbaatar 144 409 154 0 107 0 0 35.7 khan-uul 187 278 246 10 131 5 3.9 25.8 chingeltei 148 977 304 16 204 11 5.0 38.4 bagakhangai 4123 0 0 0 0 0 0 east 221 764 348 7 157 3 2 30.7 khentii 77 493 139 1 179 1 0.7 40.0 dornod 81 519 112 5 137 6 4.3 20.5 sukhbaatar 62 752 97 1 155 2 1.0 29.6 central 515 025 696 7 135 1 1 31.0 selenge 110 757 174 2 157 2 1.1 25.0 umnugovi 67 955 36 0 53 0 0 44.4 tuv 94 956 173 2 182 2 1.1 36.6 darkhan-uul 106 470 172 2 162 2 1.1 29.3 govisumber 17 862 18 0 101 0 0 27.8 dundgov 46 866 31 0 66 0 0 51.6 dornogovi 70 159 92 1 131 1 1.1 23.7 khangai 604 784 427 7 71 1 2 50.5 orkhon 106 810 90 4 84 4 4.3 52.2 uvurkhangai 116 922 61 0 52 0 0 58.8 bayankhongor 88 514 59 0 67 0 0 51.3 arkhangai 95 857 58 0 61 0 0 58.0 khuvsgul 134 530 111 3 83 2 2.6 44.7 bulgan 62 151 48 0 77 0 0 40.0 west 410 507 209 3 51 1 1 39.2 uvs 83 766 46 1 55 1 2.1 23.4 bayan-ulgii 106 810 44 0 41 0 0 52.3 zavkhan 72 801 36 2 49 3 5.3 52.6 khovd 89 021 50 0 56 0 0 36.0 gobi-altai 58 109 33 0 57 0 0 33.3 wpsar vol 14, no 1, 2023 | doi: 10.5365/wpsar.2023.14.1.931 https://ojs.wpro.who.int/6 boldoo et altuberculosis epidemiology in mongolia fig. 3. (a) tb notification rates per 100 000 population by region, and (b) proportion of tb cases that were bacteriologically confirmed by region, mongolia, 2015–2019 a b 164 160 161 72 52 0 50 100 150 200 250 2015 2016 2017 2018 2019 n ot if ic at io n ra te p er 1 00 0 00 p op ul at io n year ulaanbaatar east central khangai west 55 45 0 10 20 30 40 50 60 70 2015 2016 2017 2018 2019 pr op or ti on o f ba ct er io lo gi ca lly c on fi rm ed c as es year ulaanbaatar east central khangai west 164 160 161 72 52 0 50 100 150 200 250 2015 2016 2017 2018 2019 n ot if ic at io n ra te p er 1 00 0 00 p op ul at io n year ulaanbaatar east central khangai west 55 45 0 10 20 30 40 50 60 70 2015 2016 2017 2018 2019 pr op or ti on o f ba ct er io lo gi ca lly c on fi rm ed c as es year ulaanbaatar east central khangai west fig. 4. map of tb notification rates per 100 000 population by province, mongolia, 2019 ! 37–45 46–62 63–90 91–139 140–172 wpsar vol 14, no 1, 2023 | doi: 10.5365/wpsar.2023.14.1.931https://ojs.wpro.who.int/ 7 tuberculosis epidemiology in mongoliaboldoo et al fig. 5. proportion of tb cases that were bacteriologically confirmed by district in ulaanbaatar (a) and by province in the east (b), central (c), khangai (d) and west (e) regions, mongolia, 2015–2019 51 0 0 10 20 30 40 50 60 70 80 2015 2016 2017 2018 2019 pr op or ti on o f ba ct er io lo gi ca lly c on fi rm ed c as es baganuur bayangol bayanzürkh nalaih songinokhair khan sukhbaatar district khan uul chingeltei bagakhangai 51 0 0 10 20 30 40 50 60 70 80 2015 2016 2017 2018 2019 pr op or ti on o f ba ct er io lo gi ca lly c on fi rm ed c as es baganuur bayangol bayanzürkh nalaih songinokhair khan sukhbaatar district khan uul chingeltei bagakhangai 60 34 0 10 20 30 40 50 60 70 80 2015 2016 2017 2018 2019 pr oo po rt io n of b ac te ri ol og ic al ly c on fi rm ed c as es sukhbaatar dornod khentii 66 43 0 10 20 30 40 50 60 70 80 2015 2016 2017 2018 2019 pr op or ti on o f ba ct er io lo gi ca lly c on fi rm ed c as es govisumber darkhan-uul dornogovi dundgov umnugovi selenge tuv ulaanbaatar 38 57 0 10 20 30 40 50 60 70 80 2015 2016 2017 2018 2019 pr op or ti on o f ba ct er io lo gi ca lly c on fi rm ed c as es arkhangai bayankhongor bulgan orkhon uvurkhangai khuvsgul 39 58 0 10 20 30 40 50 60 70 80 2015 2016 2017 2018 2019 pr op or ti on o f ba ct er io lo gi ca lly c on fi rm ed c as es bayan ulgii gobi altai zavkhan uvs khovd a c e b d wpsar vol 14, no 1, 2023 | doi: 10.5365/wpsar.2023.14.1.931 https://ojs.wpro.who.int/8 boldoo et altuberculosis epidemiology in mongolia treated, one (14.3%) failed, three (42.9%) died and one (14.3%) was ltfu. tb in prisoners tb notifications in prisoners decreased from 92 (1.9%) in 2015 to 54 (1.3%) in 2019. a higher proportion of bacteriologically confirmed cases (64.3%) and relapse cases (25.9%) were notified than from the national data (58.5% and 11%, respectively). discussion the results of this tb surveillance analysis demonstrate the progress of the ntp in mongolia, with increases in the proportion of the population screened for tb, bacteriological confirmation, treatment success and tb-preventive treatment in children. intensification of case-finding activities through the expansion of xpert of those not evaluated (0.4% in 2019). since 2016, the treatment success rate has been above 90% for all types of tb except for bacteriologically confirmed tb cases (85.4%). the death rate was highest among relapse cases (4.8%). in 2019, the treatment success rate for bacteriologically confirmed cases was less than 90% in three provinces (dornogovi, khovd and orkhon) and ulaanbaatar (fig. 9). ulaanbaatar reported relatively poor treatment outcomes compared with other provinces; 8% of bacteriologically confirmed cases were ltfu, 5% failed and 4% died. in 2017, 56% (n = 122/216) of rr/mdr-tb patients enrolled in treatment were successfully treated, a slight decrease from 60% in 2015–2016. the ltfu rate among rr/mdr-tb cases increased from 16% in 2016 to 26% in 2017. of seven xdr-tb cases in the 2017 patient cohort, two (28.6%) were successfully fig. 6. number and rate per 100 000 population of tb notifications by sex and age group, mongolia, 2019 0 50 100 150 200 250 300 0 100 200 300 400 500 600 0–4 5–14 15–24 25–34 35–44 45–54 55–64 ≥65 n ot ifi ca ti on ra te p er 1 00 0 00 p op ul at io n n um be r of n ot ifi ca ti on s age group female male female rate male rate wpsar vol 14, no 1, 2023 | doi: 10.5365/wpsar.2023.14.1.931https://ojs.wpro.who.int/ 9 tuberculosis epidemiology in mongoliaboldoo et al fig. 7. proportion of tb notifications by age group and province, mongolia, 2019 21.0 8.0 5.0 2.0 13.0 5.0 5.0 4.2 3.0 20.0 7.0 7.0 5.0 5.0 3.0 2.0 7.0 6.0 4.0 11.0 21.2 30.6 29.7 31.9 14.3 18.3 26.2 17.7 22.9 12.9 20.3 25.7 29.0 23.3 38.1 14.0 27.0 22.7 25.9 22.1 26.2 23.2 21.2 10.2 13.5 23.4 38.1 28.7 19.7 21.0 12.5 26.7 23.7 18.3 22.6 20.6 4.8 31.0 24.3 20.5 19.4 22.1 21.3 24.2 9.6 28.6 16.2 21.3 26.2 11.3 13.1 19.4 20.8 19.8 16.9 12.6 16.1 17.5 19.0 14.0 14.6 11.4 20.4 15.0 17.7 15.9 13.5 6.1 13.5 6.4 11.9 13.9 19.7 19.4 18.8 15.8 23.7 11.4 19.4 20.1 28.6 19.0 14.6 15.9 13.9 20.0 16.3 13.3 9.6 16.3 18.9 6.4 4.8 11.3 13.1 8.1 14.6 13.9 6.8 7.4 6.5 5.8 4.8 6.0 10.8 18.2 10.2 11.4 10.6 8.0 4.4 2.7 8.5 3.5 3.3 9.7 6.3 7.9 8.5 4.6 5.8 11.0 5.4 9.1 2.8 2.9 3.5 4.7 0 10 20 30 40 50 60 70 80 90 100 khovd uvs gobi-altai bayan-ulgii zavkhan khuvsgul arkhangai uvurkhangai bulgan orkhon bayankhongor tuv dundgovi selenge govisumber dornogovi darkhan-uul umnugovi sükhbaatar dornod khentii ulaanbaatar w es t kh an ga i ce nt ra l ea st percentage 0–14 15–24 25–34 35–44 45–54 55–64 ≥65 fig. 8. number of tb notifications and notification rate per 100 000 population by drug-resistant tb categories, mongolia, 2015–2019 0 2 4 6 8 10 12 14 16 0 50 100 150 200 250 300 350 400 450 2015 2016 2017 2018 2019 n ot ifi ca tio n ra te p er 1 00 0 00 p op ul at io n n um be r of n ot ifi ca tio ns year rr/mdr notifications monoand poly-dr notifications rr/mdr notification r ate monoand poly-dr notification r ate 0 2 4 6 8 10 12 14 16 0 50 100 150 200 250 300 350 400 450 2015 2016 2017 2018 2019 n ot ifi ca tio n ra te p er 1 00 0 00 p op ul at io n n um be r of n ot ifi ca tio ns year rr/mdr notifications monoand poly-dr notifications rr/mdr notification r ate monoand poly-dr notification r ate dr: drug resistance; rr/mdr: rifampicin resistance or multidrug resistance. wpsar vol 14, no 1, 2023 | doi: 10.5365/wpsar.2023.14.1.931 https://ojs.wpro.who.int/10 boldoo et altuberculosis epidemiology in mongolia the who-estimated incidence of rr/mdr-tb for mongolia was one of the highest among countries in the western pacific region.1 however, the number of rr/ mdr-tb notifications did not increase during the study period, highlighting a case-detection gap that is also found in other countries.4 to respond to the burden of dr-tb, there is an urgent need to increase the coverage of xpert as an initial diagnostic test and reduce diagnostic delays. the high caseload in younger age groups suggests recent transmission, emphasizing the need to expand and accelerate case detection. exposure to tobacco and solid fuels for heating has been significantly associated with bacteriological tb,8 which may contribute to the higher rates in these age groups. the proportion of tb in children varied widely across provinces. as in many settings testing and sustaining treatment success, particularly in ulaanbaatar, will probably increase the impact of the ntp and reduce the national tb burden. the number and rate of tb notifications decreased in 2015–2018 and increased in 2019, despite increases in screening. similar trends have also been observed in other high-burden countries such as cambodia, where estimated tb incidence is declining.4,5 the expansion of x-ray and xpert testing and the strengthening of the specimen transportation system may have resulted in an increase in notifications and an increased proportion of bacteriological confirmation in 2019. however, who estimates that the tb notification system is detecting only 31% of tb cases in the country.1 to fill this gap, the ntp needs to intensify its efforts in screening high-risk populations.7 fig. 9. proportion of bacteriologically confirmed tb notifications by treatment outcomes and province, mongolia, 2019 100.0 100.0 100.0 93.8 85.7 100.0 95.8 95.1 94.4 92.3 73.3 100.0 100.0 100.0 95.8 94.7 90.9 84.7 91.7 91.7 91.4 80.7 3.0 8.0 13.0 2.0 6.0 2.0 4.0 6.0 5.0 6.3 14.3 5.6 6.7 1.4 1.8 6.8 4.2 2.8 2.9 3.6 4.2 6.7 3.5 2.3 6.8 5.6 7.6 2.1 1.0 1.1 2.9 50 55 60 65 70 75 80 85 90 95 100 zavkhan gobi-altai bayan-ulgii uvs khovd bulgan arkhangai khuvsgul bayankhongor uvurkhang ai orkhon umnug ovi govisumber dundgovi selenge darkhan-uul tuv dornogovi sukhbaatar khentii dornod ulaanbaatar w es t kh an ga i ce nt ra l ea st percentage success failed died ltfu not evaluated the black line indicates the who 90% target for tb treatment success. ltfu: loss to follow-up. wpsar vol 14, no 1, 2023 | doi: 10.5365/wpsar.2023.14.1.931https://ojs.wpro.who.int/ 11 tuberculosis epidemiology in mongoliaboldoo et al comparative epidemiological trends and programmatic performance. national and subnational tb programmes can tailor and target interventions addressing local-level issues identified in routine analysis, contributing to ending tb by 2030. acknowledgements the authors wish to thank all health-care workers at the front lines of tb service delivery in mongolia. the authors extend their thanks to all staff of the national and subnational tb programmes and collaborators, and especially to the who representative office for mongolia for their continuous support. conflicts of interest the authors have no conflicts of interest to declare. ethics statement ethical clearance was not required because the analysis was based on routine data with no identifiable information. funding this study was funded by the world health organization regional office for the western pacific. references 1. global tuberculosis report 2022. geneva: world health organization; 2022. available from: https://apps.who.int/iris/handle/10665/363752, accessed 13 november 2022. 2. report of the first national tuberculosis prevalence survey in mongolia (2014–2015). ulaanbaatar: ministry of health; 2016. 3. global tuberculosis programme. tb country, regional and global profiles. geneva: world health organization; 2021. available from: https://worldhealthorg.shinyapps.io/tb_profiles/?_inputs_&entity_ty pe=%22country%22&lan=%22en%22&iso2=%22mn%22, accessed 21 september 2022. 4. morishita f, viney k, lowbridge c, elsayed h, oh kh, rahevar k, et al. epidemiology of tuberculosis in the western pacific region: progress towards the 2020 milestones of the end tb strategy. western pac surveill response j. 2020;11(4):10–23. doi:10.5365/ wpsar.2020.11.3.002 pmid:34046237 5. rahevar k, fujiwara pi, ahmadova s, morishita f, reichman lb. implementing the end tb strategy in the western pacific region: translating vision into reality. respirology. 2018;23(8):735–42. doi:10.1111/resp.13308 pmid:29648691 6. definitions and reporting framework for tuberculosis – 2013 revision: updated december 2014 and january 2020. geneva: world health organization; 2013. available from: https://apps.who.int/ iris/handle/10665/79199, accessed 16 june 2022. globally, there is a need to strengthen the capacities of physicians in diagnosing paediatric tb and expand xpert testing in children to increase correct and timely diagnoses.1,9 tb among prisoners decreased during the study period, as it did in the previous decade.10 furthermore, the proportion of relapse cases among prisoners was more than double that of the general population. a decrease in the proportion of deaths of tb cases has improved overall treatment outcomes, but because of persistently high rates of ltfu, bacteriologically confirmed tb treatment success rates remain below 90%. addressing physical barriers to tb services for mobile populations (including nomads) and reducing financial barriers may improve health access for vulnerable patients. the low treatment success rate among dr-tb cases needs attention, especially considering the increase in the notification rate of mdr-tb found in the national drug resistance survey in 2017, compared with that in 2007.11 the use of xpert as a front-line test and the implementation of a shorter all-oral regimen for mdr-tb treatment should be prioritized.12 our analysis is limited to tb cases diagnosed and reported to the ntp; thus, it does not represent all estimated cases of tb in mongolia. the 70% casedetection gap estimated at the national level1 is likely to vary between provinces and this was not detected by our analysis. a full transition to the digital case-based system and discontinuing the paper-based system would bolster routine data analysis because individual case data provide more detail than the aggregate data. the mongolian ntp needs to continue its efforts in tb control to achieve further progress. expanding and accelerating case detection with xpert and ensuring the treatment success of bacteriologically confirmed tb would probably reduce the tb burden. other priorities are addressing transmission in men and young adults, and strengthening paediatric tb diagnosis. the focus should be on ulaanbaatar because it has higher notification rates and suboptimal treatment outcomes, and overcrowding and pollution that increase the risk of transmission. advancing a multisectoral response is critical to addressing social determinants of tb such as indoor air pollution. tb surveillance data provide an opportunity to conduct subnational analyses, to inform districts of their wpsar vol 14, no 1, 2023 | doi: 10.5365/wpsar.2023.14.1.931 https://ojs.wpro.who.int/12 boldoo et altuberculosis epidemiology in mongolia 10. yanjindulam p, oyuntsetseg p, sarantsetseg b, ganzaya s, amgalan b, narantuya j, et al. reduction of tuberculosis burden among prisoners in mongolia: review of case notification, 2001– 2010. int j tuberc lung dis. 2012;16(3):327–9. doi:10.5588/ ijtld.11.0251 pmid:22640445 11. third antituberculosis drug resistance survey report (2016–2017). ulaanbaatar: national center for communicable diseases, ministry of health; 2017. 12. who consolidated guidelines on tuberculosis: module 4: treatment: drug-resistant tuberculosis treatment. geneva: world health organization; 2020. available from: https://apps.who.int/iris/handle/10665/332397, accessed 16 june 2022. 7. who consolidated guidelines on tuberculosis: module 2: screening: systematic screening for tuberculosis disease. geneva: world health organization; 2021. available from: https://apps.who.int/ iris/handle/10665/340255, accessed 16 june 2022. 8. dorjravdan m, kouda k, boldoo t, dambaa n, sovd t, nakama c, et al. association between household solid fuel use and tuberculosis: cross-sectional data from the mongolian national tuberculosis prevalence survey. environ health prev med. 2021;26(1):87. doi:10.1186/s12199-021-00996-4 pmid:34372757 9. rapid communication on updated guidance on the management of tuberculosis in children and adolescents. geneva: world health organization; 2021. available from: https://apps.who.int/iris/handle/10665/344382, accessed 16 june 2022. https://ojs.wpro.who.int/ 1wpsar vol 13, no 3, 2022 | doi: 10.5365/wpsar.2022.13.3.911 original research t he world health organization (who) estimates that annual epidemics of influenza cause 3–5 million cases of severe illness worldwide.1 the epidemiology of influenza changes markedly each year and varies in different locations.2 in general, approximately 80% of influenza cases are caused by influenza type a, whereas influenza type b accounts for approximately 20% of total global cases.3 schoolchildren are the primary vulnerable population for influenza because they have the highest rates of influenza transmission and infection among infected populations.4 in the asia-pacific region, influenza type b appeared to cause more illness in children between the ages of 1–10 years than in other age groups.5 although influenza surveillance data have been reported in various forms for populations across japan,6–8 few studies have investigated seasonal influenza among schoolchildren in and around tokyo, the capital city of japan and the most populous metropolitan area of the country. owing to the various thresholds for influenza epidemics,9–12 who has proposed global standards for the collection, reporting and analysis of seasonal influenza epidemiological surveillance data.9 the who further recommends obtaining average epidemic curves plus seasonal and alert thresholds as established tools to help control annual influenza epidemics.9 the thresholds using the who methods are simple to implement and can be adapted easily for any influenza surveillance system with adequate historical data.13 in some countries, the who method is used to inform key decision-makers for influenza outbreak management and public health action.14–16 a center for public health informatics, national institute of public health, saitama, japan. b department of hygiene and public health, teikyo university school of medicine, tokyo, japan. c tohoku institute for management of blood pressure, sendai, japan. d studies coordinating centre, research unit, hypertension and cardiovascular epidemiology, ku leuven department of cardiovascular sciences, university of leuven, leuven, belgium. e tohoku medical megabank organization, tohoku university, sendai, japan. f warabi-toda medical association, toda, japan. published: 25 august 2022 doi: 10.5365/wpsar.2022.13.3.911 objective: we described the characteristics of children reported as having influenza across five consecutive influenza seasons and investigated the usefulness of setting influenza thresholds in two satellite cities of tokyo, japan. methods: an annual survey was conducted among parents of children at preschools (kindergartens and nursery schools), elementary schools and junior high schools in toda and warabi cities, saitama prefecture, at the end of the 2014–2018 influenza seasons. using the world health organization method, we established seasonal, high and alert thresholds. results: there were 64 586 children included in the analysis. over the five seasons, between 19.1% and 22% of children annually were reported as having tested positive for influenza. influenza type a was reported as the dominant type, although type b was also reported in more than 40% of cases in the 2015 and 2017 seasons. the median period of the seasonal peak was 3 weeks in mid-january, regardless of school level. of the five surveyed seasons, the high threshold was reached in 2014 and 2018, with no season exceeding the alert threshold. discussion: this study provides insights into the circulation of influenza in children in the study areas of toda and warabi, japan, from 2014 to 2018. although we were able to utilize these annual surveys to calculate influenza thresholds from five consecutive seasons, the prospective usefulness of these thresholds is limited as the survey is conducted at the end of the influenza season. epidemiological survey to establish thresholds for influenza among children in satellite cities of tokyo, japan, 2014–2018 ayako matsuda,a kei asayama,b,c,d taku obara,e naoto yagif and takayoshi ohkubob,c correspondence to ayako matsuda (email: matsuda.a.yk@niph.go.jp) wpsar vol 13, no 3, 2022 | doi: 10.5365/wpsar.2022.13.3.911 https://ojs.wpro.who.int/2 matsuda et alinfluenza survey of children near tokyo, japan, 2014–2018 influenza. the data were also analysed by school level (preschool, elementary school and junior high school; in japan, there is no system for these schoolchildren to repeat the school year). comparisons between those with and without reported influenza infection were compared using the chi-squared test. each influenza season was defined as beginning in october and ending in march of the following year; for example, the 2014 season began in october 2014 and ended in march 2015. the epidemic peak was defined for each influenza type as the week with the highest number of reported influenza cases. data were extracted from the pooled survey responses of the five consecutive influenza seasons. in accordance with the who protocol,9 we calculated the average and upper limit of the 90% confidence interval (ci) curves and the seasonal, high, and alert thresholds based on the number of children reported as having influenza each week throughout the five seasons. the average curves denoted the peak weekly mean, and the 90% upper curve was for the upper limits of the 90% ci of the peak weekly mean.9,13 for these curves, the who protocol suggests using the normal distribution to assign thresholds based on the mean and standard deviation of the aligned data for weekly counts.9 the seasonal threshold was defined as the annual median amplitude of the number of children reported with influenza per week throughout the study period. therefore, half of the study weeks are necessarily above the seasonal threshold, and these correspond to the seasonality in the influenza epidemic (e.g. from week 40 of 2014 to week 13 of 2015). the high threshold was defined as the number of children with influenza higher than the average peak for each of the five seasons, that is, the peak number of children with influenza of the average epidemic curves.15 theoretically, we can expect that seasonal peaks can be higher than the high threshold in two or three of the five seasons, whereas the seasonal peaks will be lower in other seasons. finally, we defined the alert threshold as being higher than the upper limits of the 90% ci of the high threshold as defined earlier.9,13,15 the data for the total number of children studied and for each school level from week 40 of 2014 to week 13 of 2019 were plotted against the calculated seasonal, high and alert thresholds. we analysed the data using stata version 16.0 (stata corp., college station, tx, united states of america). we conducted a survey of children (from preschool to junior high school) during five consecutive influenza seasons in two satellite cities of tokyo, japan. using these data, we described the characteristics of circulating influenza and investigated the usefulness of establishing thresholds for the influenza epidemic with the who method. to our knowledge, this is one of the first documented assessments using the who method to set thresholds for children in cities near tokyo, japan, based on survey data. methods study area the study area comprised two cities, toda and warabi, which are located in saitama prefecture to the north of tokyo. the study region was 23.3 km2 (toda: 18.2 km2; warabi: 5.1 km2) and had a population of 208 410 (toda: 136 150; warabi: 72 260), including a population of 28 056 aged 0–14 years (toda: 20 252; warabi: 7804) according to the 2015 census.17 study procedure throughout five consecutive influenza seasons, from 2014 to 2018 (ending march 2019), an annual survey was conducted among parents of children who were attending preschool (kindergarten or nursery school, 0–6 years old), elementary school (7–12 years old) or junior high school (13–15 years old) in the toda and warabi regions. a questionnaire was mailed to parents asking for the following information regarding their children: school level, sex, siblings, underlying medical condition, vaccination status, and incidence of influenza infection, influenza type and date of illness (supplementary table 1). in clinical practice in japan, the influenza type (type a or b) is typically diagnosed by the children’s local physician or an emergency outpatient health-care provider, who administers an influenza antigen rapid test covered by health insurance. the survey was conducted every june, and the responses pertained to the preceding season. completed questionnaires were collected by schoolteachers. statistical analysis we determined the number of children, percentage of influenza cases by type and week for each influenza season, and the seasonal, high and alert thresholds for wpsar vol 13, no 3, 2022 | doi: 10.5365/wpsar.2022.13.3.911https://ojs.wpro.who.int/ 3 influenza survey of children near tokyo, japan, 2014–2018matsuda et al of the season was between weeks 8 and 13 (late february and late march). the median peak in the number of children with influenza was similar to the corresponding mean peak (table 3). the median week of the peak was week 3 (mid-january; table 3). the plotted curve of the number of children with influenza crossed the seasonal threshold multiple times over the five seasons. the peak in seasonal influenza activity in 2015, 2016 and 2017 did not reach the high threshold (fig. 2a). the peak in seasonal influenza activity varied when the children with influenza were stratified by school level (fig. 2b–d). in none of the five seasons did the plotted curve of the prevalence of children with influenza cross the alert threshold. the results were almost confirmatory when classified by school level, except for junior high school during the 2014 season, where the number of children with influenza was close to the alert threshold (fig. 2d). discussion we present data on the circulation of influenza in children who were attending preschool, elementary school or junior high school in toda and warabi, japan, during five consecutive influenza seasons from 2014 to 2018. over the five seasons, between 19.1% and 22% of children annually were reported as having tested positive for influenza. over the whole period, there was a higher proportion of elementary school children reporting influenza infection (23.4%) compared to preschool and junior high school children (18.9% and 18.7%, respectively). having siblings was associated with reported cases of influenza in preschool and elementary school children. moreover, we successfully established seasonal, high and alert thresholds based on survey data from five consecutive seasons of influenza using the who method. in japan, the ministry of health, labour and welfare, in collaboration with the national institute of infectious diseases (niid), provides a weekly influenza outbreak report.19 this report is based on a school survey in which the absence of children and temporary closure of schools are recorded. the total number of temporary school closures was highest in 2017, which supports our finding that the highest number of reported influenza cases also occurred in 2017. our survey differed from this national report19 for junior high school children, as the highest number of influenza cases was reported in 2016 for this group. results a total of 76 753 responses (response rate 70.8%) were collected from the 108 362 surveys sent to parents of children attending preschool, elementary school or junior high school during the 2014–2018 seasons. we excluded responses that did not include basic information (n = 4445) and those that reported influenza vaccination before 30 september or influenza infection after 1 april for each season (n = 7722).18 this analysis, therefore, consisted of 64 586 responses (fig. 1). of the included children, 49.6% were male, 78.6% had siblings and 8.3% had an underlying medical condition (table 1). among preschool children, having siblings and the presence of underlying medical conditions were associated with influenza infection (p < 0.001). in elementary school children, sex and having siblings were associated with influenza infection (p < 0.001 and = 0.026, respectively). conversely, sex, having siblings and the presence of underlying medical conditions were not associated with influenza infection in junior high school children (p = 0.103, 0.713 and 0.405, respectively) (table 1). children with influenza and their distribution by influenza type the total number of children who were reported to have been infected with influenza was 13 754 (21.3% of analysed responses). with respect to the dominant influenza type in each season, type a dominated in 2014, 2016 and 2018, while type b dominated in 2017 and the two were nearly equal in 2015. these patterns mostly held when divided by school level (table 2). week of epidemic peak by influenza type the epidemic peaks occurred earlier in 2014 and 2016 (week 51) than in 2015 (week 6), 2017 (week 3) and 2019 (week 3) (table 2). the epidemic peaks of influenza type b occurred later than type a in 2015, 2016 and 2017. by school level, the epidemic peaks in preschool occurred later than the other levels in 2014, 2016 and 2017 (table 2). curves and thresholds by the who method the start of the influenza season was between weeks 43 and 1 (late october and early january), and the end wpsar vol 13, no 3, 2022 | doi: 10.5365/wpsar.2022.13.3.911 https://ojs.wpro.who.int/4 matsuda et alinfluenza survey of children near tokyo, japan, 2014–2018 fig. 1. selection of the study population for consecutive annual surveys of schoolchildren in toda and warabi, japan, during the 2014–2018 influenza seasons surveys sent via postal mail after each influenza season (n=108 362) 2014–2015: 21 971 2015–2016: 21 024 2016–2017: 22 088 2017–2018: 22 065 2018–2019: 21 214 responses collected (n=76 753) 2014–2015: 15 119 2015–2016: 14 652 2016–2017: 15 636 2017–2018: 15 538 2018–2019: 15 808 excluded: • 4445 responses missing basic information (school level, sex, residence, siblings, underlying diseases, date of vaccination and incidence of influenza) • 7722 responses reporting vaccination before 30 september or influenza infection after 1 april responses analysed (n=64 586) 2014–2015: 13 961 2015–2016: 12 020 2016–2017: 12 616 2017–2018: 12 783 2018–2019: 13 206 week of temporary school closures. there may also be regional characteristics that contribute to differences in the national patterns. the increase in reported influenza type b cases in the national data occurred later than type a in our survey. the epidemic order is in accordance with that observed in other influenza seasons in the northern hemisphere.20 understanding the geographical and temporal patterns of seasonal influenza could help strengthen influenza surveillance for the early detection of epidemics.21 as mosnier et al. reported,22 timely data on the circulation of influenza collected by influenza surveillance systems are essential for optimizing influenza prevention and control strategies.21,22 in accordance with the who method, we developed three thresholds (seasonal, high and alert thresholds) for children at each school level in two satellite cities of in our survey, approximately 40% of influenza cases in 2015 and 2017 were type b. these results are similar to those reported in niid’s influenza outbreak summaries for each season,19 although their proportion of type b reported among children in junior high school was higher, at >50% in 2015. characteristics of outbreaks can differ by region, even within a single country, warranting local-level surveys. in the national report,19 the peak week for temporary school closures occurred in weeks 4, 7, 4, 5 and 4 in the 2014, 2015, 2016, 2017 and 2018 seasons, respectively. the week of the influenza epidemic peak in our survey occurred consistently earlier than that in the national report, although the overall tendency was similar. this may be because the national report used the dates of school absence due to influenza,19 whereas our survey showed the week with the highest number of detected influenza cases which is likely to precede the wpsar vol 13, no 3, 2022 | doi: 10.5365/wpsar.2022.13.3.911https://ojs.wpro.who.int/ 5 influenza survey of children near tokyo, japan, 2014–2018matsuda et al a data from influenza infection (yes) and influenza infection (no) were compared using the chi-squared test. table 1. comparison of characteristics of schoolchildren included in consecutive annual influenza surveys in toda and warabi, japan, during the 2014–2018 influenza seasons characteristic total influenza infection reported, n (%) payes no n = 64 586 n = 13 754 n = 50 832 school preschool (0–6 years) 17 260 3262 (18.9) 13 998 (81.1) < 0.001elementary school (7–12 years) 34 966 8186 (23.4) 26 780 (76.6) junior high school (13–15 years) 12 360 2306 (18.7) 10 054 (81.3) sex male 32 039 7037 (51.2) 25 002 (49.2) < 0.001 female 32 547 6717 (48.8) 25 830 (50.8) siblings (yes) 50 756 10 888 (79.2) 39 868 (78.4) 0.064 underlying medical condition (yes) 5347 1220 (8.9) 4127 (8.1) 0.005 preschool children (0–6 years) sex (male) 8611 1663 (51.0) 6948 (49.6) 0.166 siblings (yes) 12 020 2386 (73.2) 9634 (68.8) < 0.001 underlying medical condition (yes) 1397 319 (9.8) 1078 (7.7) < 0.001 elementary school children (7–12 years) sex (male) 17 378 4210 (51.4) 13 168 (49.2) < 0.001 siblings (yes) 28 392 6578 (80.4) 21 814 (81.5) 0.026 underlying medical condition (yes) 2987 731 (8.9) 2256 (8.4) 0.152 junior high school children (13–15 years) sex (male) 6050 1164 (50.5) 4886 (48.6) 0.103 siblings (yes) 10 344 1924 (83.4) 8420 (83.8) 0.713 underlying medical condition (yes) 963 170 (7.4) 793 (7.9) 0.405 survey is cost-effective and feasible and can provide a retrospective assessment of an influenza season in a subgroup of the population. furthermore, the established thresholds can be used to guide public health decision-making and risk communication for children, for example by planning national and municipal budgets and long-term staffing as well as preparing for periods and intensive education for children when epidemics are expected. the thresholds can also be helpful in establishing an early warning system for influenza epidemics customized to each region when a near real-time report such as the aforementioned niid report in japan19 is feasible and can facilitate collaboration. our study has several limitations. first, preschoolaged children who were not attending kindergarten or nursery school, and children who were attending school out of town, were excluded from the analysis. tokyo, based on survey data from the same region. the who method is a simple protocol to establish influenza thresholds. epidemic peaks for each season occurred at week 51 or later, particularly at week 2 or later among preschool children. two of the five seasons, 2014 and 2018, reached the high threshold; none of the seasons reached the alert threshold. the data used in this study were not collected in a near real-time manner and are not surveillance data for which the threshold calculations are best suited. therefore, the calculated thresholds cannot be used to establish an outbreak warning system; they can only be used to assess an influenza season after its completion. this is in contrast to the influenza surveillance system in japan which provides alerts throughout the influenza season when the reported number of cases exceeds the threshold in any given week.23 however, the annual wpsar vol 13, no 3, 2022 | doi: 10.5365/wpsar.2022.13.3.911 https://ojs.wpro.who.int/6 matsuda et alinfluenza survey of children near tokyo, japan, 2014–2018 table 2. number of children reported with influenza and week of the epidemic peak in consecutive annual surveys of schoolchildren in toda and warabi, japan, during the 2014–2018 influenza seasons n/a: not available. the influenza season begins in october and ends in march of the following year; for example, the 2014 season was from october 2014 to march 2015. season cases (%) / total no. of children influenza type reported (%) week of epidemic peaks type a type b unknown all type a type b all children 2014 2793 (20.0) / 13 961 80.2 11.6 8.2 51 51 51 2015 2594 (21.6) / 12 020 45.7 43.7 10.6 6 5 9 2016 2770 (22.0) / 12 616 71.6 17.9 10.5 51 51 12 2017 3070 (24.0) / 12 783 28.7 45.9 25.4 3 3 5 2018 2527 (19.1) / 13 206 84.3 6.6 9.1 3 3 3 total 13 754 (21.3) / 64 586 61.2 25.7 13.1 n/a n/a n/a preschool (0–6 years) 2014 659 (17.3) / 3809 79.2 11.1 9.7 2 2 7 2015 614 (18.5) / 3321 48.4 41.0 10.6 5 5 7 2016 688 (20.5) / 3348 70.8 17.3 11.9 3 5 12 2017 701 (20.2) / 3472 37.8 42.9 19.3 5 2 5 2018 600 (18.1) / 3310 85.3 7.0 7.7 2 2 3 subtotal 3262 (18.9) / 17 260 63.9 24.1 12.0 n/a n/a n/a elementary school (7–12 years) 2014 1567 (21.6) / 7269 80.6 11.5 7.9 51 51 51 2015 1672 (25.9) / 6445 45.9 42.6 11.5 6 6 9 2016 1503 (22.1) / 6793 71.1 19.0 9.8 3 51 12 2017 1905 (28.0) / 6807 28.7 49.0 22.3 3 51 5 2018 1539 (20.1) / 7652 83.6 6.4 10.0 3 3 3 subtotal 8186 (23.4) / 34 966 60.2 27.0 12.8 n/a n/a n/a junior high school (13–15 years) 2014 567 (19.7) / 2883 80.4 12.5 7.1 51 51 51 2015 308 (13.7) / 2254 39.3 55.2 5.5 7 5 10 2016 579 (23.4) / 2475 73.6 15.7 10.7 51 51 12 2017 464 (18.5) / 2504 15.1 37.5 47.4 3 51 52 2018 388 (17.3) / 2244 85.6 6.7 7.7 3 3 3 subtotal 2306 (18.7) / 12 360 60.9 23.1 16.0 n/a n/a n/a as the last survey was completed in march 2019, the data were not affected by the covid-19 pandemic and related confounding circumstances. whether the current estimates regarding the influenza epidemic will be applicable after the covid-19 pandemic has subsided remains unknown; this is the same issue for the epidemiology of most infectious diseases. this study provides insights into the circulation of influenza in children in the study areas of toda and warabi. the calculated thresholds provide some assessment of the influenza seasons from 2014 to 2018 in in the study area (toda and warabi), the total number of children aged ≤15 years was 27 562 according to the 2015 census. as only 60% of mailed surveys were returned and qualified for analysis, we cannot guarantee that the present findings accurately represent the epidemiology of children in the general population. second, as the questionnaires were answered by the parents of the targeted children, influenza diagnosis was based on self-reporting. detailed medical information was not requested, so the proportion reported with influenza might not be accurate. third, not all participants completed all five surveys that were conducted for this report. wpsar vol 13, no 3, 2022 | doi: 10.5365/wpsar.2022.13.3.911https://ojs.wpro.who.int/ 7 influenza survey of children near tokyo, japan, 2014–2018matsuda et al table 3. epidemic curve characteristics and thresholds in consecutive annual surveys of schoolchildren in toda and warabi, japan, during the 2014–2018 influenza seasons the influenza season begins in october and ends in march of the following year; for example, the 2014 season was from october 2014 to march 2015. total school level preschool elementary school junior high school median week of peak 3 3 3 3 median peak in influenza cases 460 107 299 97 mean peak in influenza cases 468.2 103.2 279.4 98.4 standard deviation 84.2 21.9 63.9 45.5 upper 90% confidence interval 606.7 139.2 384.5 173.2 upper 95% confidence interval 633.2 146.1 404.6 187.6 threshold level – – – – seasonal threshold 38 9 21 6 high threshold 468 103 279 98 alert threshold 606 139 384 173 b c d fig. 2. number of reported influenza cases from consecutive annual surveys of schoolchildren in toda and warabi, japan, during the 2014–2018 influenza seasons plotted against the calculated who thresholds (a) overall, and for (b) preschool, (c) elementary and (d) junior high school children a b wpsar vol 13, no 3, 2022 | doi: 10.5365/wpsar.2022.13.3.911 https://ojs.wpro.who.int/8 matsuda et alinfluenza survey of children near tokyo, japan, 2014–2018 3. caini s, huang qs, ciblak ma, kusznierz g, owen r, wangchuk s, et al. epidemiological and virological characteristics of influenza b: results of the global influenza b study. influenza other respir viruses. 2015;9(suppl 1):3–12. doi:10.1111/irv.12319 pmid:26256290 4. halloran me, longini im jr. public health. community studies for vaccinating schoolchildren against influenza. science. 2006;311(5761):615–6. doi:10.1126/science.1122143 pmid:16456066 5. jennings l, huang qs, barr i, lee pi, kim wj, buchy p, et al. literature review of the epidemiology of influenza b disease in 15 countries in the asia-pacific region. influenza other respir viruses. 2018;12(3):383–411. doi:10.1111/irv.12522 pmid:29127742 6. hampson aw. epidemiological data on influenza in asian countries. vaccine. 1999;17(suppl 1):s19–23. doi:10.1016/s0264410x(99)00100-0 pmid:10471175 7. kikuchi m, yamamoto m, yoshida y, miyashita t, fujita k. epidemics of influenza from winter to summer in the 2005/6 season in sapporo, japan. jpn j infect dis. 2007;60(2–3):152–3. pmid:17515659 8. iha y, kinjo t, parrott g, higa f, mori h, fujita j. comparative epidemiology of influenza a and b viral infection in a subtropical region: a 7-year surveillance in okinawa, japan. bmc infect dis. 2016;16(1):650. doi:10.1186/s12879-016-1978-0 pmid:27821090 9. global epidemiological surveillance standards for influenza. geneva: world health organization; 2013. available from: https://apps.who. int/iris/handle/10665/311268 10. watts cg, andrews rm, druce jd, kelly ha. establishing thresholds for influenza surveillance in victoria. aust n z j public health. 2003;27(4):409–12. doi:10.1111/j.1467-842x.2003.tb00418.x pmid:14705303 11. vega t, lozano je, meerhoff t, snacken r, beauté j, jorgensen p, et al. influenza surveillance in europe: comparing intensity levels calculated using the moving epidemic method. influenza other respir viruses. 2015;9(5):234–46. doi:10.1111/irv.12330 pmid:26031655 12. o’brien sj, christie p. do cusums have a role in routine communicable disease surveillance? public health. 1997;111(4):255–8. doi:10.1016/s0033-3506(97)00044-9 pmid:9242040 13. tay el, grant k, kirk m, mounts a, kelly h. exploring a proposed who method to determine thresholds for seasonal influenza surveillance. plos one. 2013;8(10):e77244. doi:10.1371/journal. pone.0077244 pmid:24146973 14. lucero mg, inobaya mt, nillos lt, tan ag, arguelles vl, dureza cj, et al. national influenza surveillance in the philippines from 2006 to 2012: seasonality and circulating strains. bmc infect dis. 2016;16(1):762. doi:10.1186/s12879-016-2087-9 pmid:27993136 15. ly s, arashiro t, ieng v, tsuyuoka r, parry a, horwood p, et al. establishing seasonal and alert influenza thresholds in cambodia using the who method: implications for effective utilization of influenza surveillance in the tropics and subtropics. western pac surveill response j. 2017;8(1):22–32. doi:10.5365/wpsar.2017.8.1.002 pmid:28409056 16. rguig a, cherkaoui i, mccarron m, oumzil h, triki s, elmbarki h, et al. establishing seasonal and alert influenza thresholds in morocco. bmc public health. 2020;20(1):1029. doi:10.1186/s12889-02009145-y pmid:32600376 this group and the epidemic curve information may help prepare for the health care of children as the influenza season starts. if this survey data could be collected routinely during the influenza season, then the thresholds may contribute to an early warning system; currently, they can only be used to assess influenza seasons after they have occurred. our findings based on an influenza survey of children are useful for general practitioners, health policy-makers and disease control planners who are concerned with the prevention and control of influenza in this local area. acknowledgements we thank the school staff in the warabi-toda area for their support in this study. conflicts of interest the authors have no conflicts of interest to declare. ethics statement ethical approval for this study was obtained from the institutional review board of todachuo general hospital (no. 0436). informed consent was obtained from the participating parents and/or legal guardians of children in toda and warabi schools, and their information was anonymized for use in the present study. all methods were performed in accordance with relevant guidelines and regulations and were approved by the institutional review board of todachuo general hospital. funding this study was supported by a grant-in-aid for health research from the warabi-toda medical association, the japan foundation for pediatric research (grant no. 13-009) and acro incubation grants from teikyo university. references 1. influenza (seasonal). geneva: world health organization; 2018. available from: https://www.who.int/news-room/fact-sheets/detail/ influenza-(seasonal), accessed 19 march 2021. 2. cowling bj, caini s, chotpitayasunondh t, djauzi s, gatchalian sr, huang qs, et al. influenza in the asia-pacific region: findings and recommendations from the global influenza initiative. vaccine. 2017;35:856–64. doi:10.1016/j.vaccine.2016.12.064 pmid:28081970 https://apps.who.int/iris/handle/10665/311268 https://apps.who.int/iris/handle/10665/311268 wpsar vol 13, no 3, 2022 | doi: 10.5365/wpsar.2022.13.3.911https://ojs.wpro.who.int/ 9 influenza survey of children near tokyo, japan, 2014–2018matsuda et al 20. flunet. influenza virus detections [online database]. available from: https://www.who.int/tools/flunet, accessed 2 may 2022. 21. dave k, lee pc. global geographical and temporal patterns of seasonal influenza and associated climatic factors. epidemiol rev. 2019;41(1):51– 68. doi:10.1093/epirev/mxz008 pmid:31565734 22. mosnier a, caini s, daviaud i, bensoussan jl, stoll-keller f, bui tt, et al. ten influenza seasons in france: distribution and timing of influenza a and b circulation, 2003–2013. bmc infect dis. 2015;15:357. doi:10.1186/s12879-015-1056-z pmid:26289794 23. influenza outbreak level map [in japanese]. tokyo: national institute of infectious diseases; 2021. available from: https://nesid4g.mhlw.go.jp/ hasseidoko/levelmap/flu/guide.html, accessed 17 march 2021. 17. national statistics center. e-stat [online database]. tokyo: ministry of internal affairs and communications; 2022. available from: https://www.e-stat.go.jp/en, accessed 17 march 2021. 18. el guerche-séblain c, caini s, paget j, vanhems p, schellevis f. epidemiology and timing of seasonal influenza epidemics in the asia-pacific region, 2010–2017: implications for influenza vaccination programs. bmc public health. 2019;19(1):331. doi:10.1186/ s12889-019-6647-y pmid:30898100 19. epidemiological information: summaries of influenza outbreak trends in each winter season [in japanese]. tokyo: national institute of infectious diseases; 2021. available from: https:// www.niid.go.jp/niid/ja/diseases/a/flu.html, accessed 17 march 2021. event-based surveillance in papua new guinea: strengthening an international health regulations (2005) core capacity surveillance report rosheila dagina,a manoj murhekar,b alex rosewellbc and boris pavlinb a national department of health, waigani, papua new guinea. b world health organization papua new guinea, port moresby, papua new guinea c school of public health and community medicine, faculty of medicine, university of new south wales, sydney, new south wales, australia. correspondence to boris pavlin (e-mail: pavlinb@wpro.who.int). to cite this article: dagina r et al. event-based surveillance in papua new guinea: strengthening an international health regulations (2005) core capacity. western pacific surveillance and response journal, 2013, 4 (3):19–25. doi:10.5365/wpsar.2013.4.2.001 abstract under the international health regulations (2005), member states are required to develop capacity in event-based surveillance (ebs). the papua new guinea national department of health established an ebs system during the influenza pandemic in august 2009. we review its performance from august 2009 to november 2012, sharing lessons that may be useful to other low-resource public health practitioners working in surveillance. we examined the ebs system’s event reporting, event verification and response. characteristics examined included type of event, source of information, timeliness, nature of response and outcome. sixty-one records were identified. the median delay between onset of the event and date of reporting was 10 days. the largest proportion of reports (39%) came from provincial health offices, followed by direct reports from clinical staff (25%) and reports in the media (11%). most (84%) of the events were substantiated to be true public health events, and 56% were investigated by the provincial health office alone. a confirmed or probable etiology could not be determined in 69% of true events. ebs is a simple strategy that forms a cornerstone of public health surveillance and response particularly in low-resource settings such as papua new guinea. there is a need to reinforce reporting pathways, improve timeliness of reporting, expand sources of information, improve feedback and improve diagnostic support capacity. for it to be successful, ebs should be closely tied to response. introduction event-based surveillance (ebs) is defined as “the organized and rapid capture of information about events that are a potential risk to public health.”1 rumours or other ad hoc reports are transmitted through formal and informal channels such as media, health workers, community leaders and nongovernmental organizations, and assessments on the risk these events pose to public health enable a timely, effective and measured response. under the asia pacific strategy for emerging diseases,2 and to meet requirements of the international health regulations or ihr (2005),3 the papua new guinea national department of health (ndoh) established an ebs system in august 2009 during the influenza a(h1n1) pandemic. one surveillance and one administrative officer received reports about potential public health events from community members, health workers, embassies and daily media. the ebs system was established to complement the existing indicator-based surveillance systems operating in provincial hospitals, which, due to poor timeliness, were inappropriate for the early detection of public health events. this paper reviews the performance of the ebs system from 2009 to 2012, sharing lessons that may be useful to other low-resource public countries in initiating or improving their surveillance systems. structure of the ebs system basic structure a simple microsoft excel database captures the nature of events (e.g. chemical, infectious, food safety); location; dates of events, reports and follow-ups; sources of reporting; verification status; and responses. the database is maintained by an ebs coordinator within the command centre of the communicable diseases surveillance and emergency response (cds&er) unit of ndoh. reporting mechanisms the system receives ad hoc reports from any source, including health workers, nongovernmental organizations, embassies, media and the general public. reports are received at cds&er or the world health organization (who) and are channelled to the ebs coordinator. active surveillance through review of the two major national newspapers is also conducted. however, by routing data directly from the ground level to the national level, the system bypasses established reporting channels, i.e. from local/district to provincial to national levels. verification and assessment using a structured questionnaire (figure 1), the ebs coordinator verifies events reported from non-health sources by contacting the nearest health authorities or provincial health offices (phos) who are responsible for disease surveillance and control. information about the presenting syndrome, place and date of occurrence and number of cases and deaths due to the syndrome are collected. the ebs coordinator also provides guidance to provincial health authorities about investigation and response measures. a log of all verification, assessment and follow-up activities is maintained in the ebs database. figure 1. papua new guinea outbreak/event report and assessment form click to download figure 1. jpg, 902kb response the legal mandate for outbreak investigation and response lies primarily with pho. in specific circumstances (e.g. events associated with a particular health facility or mining enterprise), investigations may be initiated directly by affected parties. support from higher levels (e.g. ndoh, who and/or other partners) occurs only upon request from local authorities. the ebs coordinator follows up periodically with the relevant pho to obtain reports about the local response. all events investigated through the ebs system are reported back to stakeholders (e.g. provincial health authorities, hospital management) through a weekly national surveillance bulletin. methods we conducted a descriptive analysis of the line-list of events captured by ebs from august 2009 to november 2012; calculated the proportion of events that were verified, responded to and laboratory confirmed; and assessed the timeliness of the system by calculating the interval between occurrence and reporting to the system and between reporting and verification of events. results there were 61 unique records in the ebs system. from august to december 2009, 10 events were recorded; 22 events were recorded in 2010; five in 2011; and 17 in 2012 (table 1). additionally, there were seven events recorded for which no dates were available. there was no clear pattern to the time of event reporting (data not shown). table 1. summary of health events captured in the papua new guinea event-based surveillance system, 2009 to 2012 click to download table 1 a. jpg, 725kb hcw – health care worker; imr – papua new guinea institute of medical research; ndoh – national department of health; ngo – nongovernmental organization; pho – provincial health office; who – world health organization. * investigation and response includes both remote verification/advice and onsite field investigation. the most common reports (n = 16) were of acute watery diarrhoea, followed by bloody diarrhoea (n = 9), influenza-like illness (n = 8), acute gastrointestinal syndromes (n = 7) and acute fever and rash (n = 6). other events included neurological syndrome (n = 5), unspecified acute febrile illness (n = 3), acute respiratory illness not classified as influenza-like illness (n = 3), a haemorrhagic syndrome, an animal die-off and an unknown cause of death. among 36 events for which both data were available, the median delay between event onset and date of reporting was 10 days (range= 0–109 days). ten events (28%) took more than 30 days to report. fourteen of the 23 reports not coming from health care workers or public health authorities had both dates listed; of these, all but one were verified with the relevant local health authorities on the same day they were received. the largest number of reports (n = 24) came from phos followed by direct reports from clinical health care workers (n = 15), media (n = 7), other sources (n = 6), nongovernmental organizations (n = 4) and the community (n = 4). the reports were widely geographically distributed (data not shown). most events (n = 34) were investigated directly by the pho. a minority involved either onsite or remote assistance from ndoh, with or without support from who in papua new guinea and/or the regional office in manila, philippines or other development partners. a few events involved investigations conducted solely by a third party (e.g. the reporting hospital or a mining company). most events (n = 51) were substantiated to be true public health events. only three events were discarded as false reports; an additional six could not be verified, and one record did not report final outcome. among the true events, confirmed or probable etiologies were identified in 16, and in the remaining 35, the etiology could not be determined. discussion ebs is a simple-to-use strategy that forms a cornerstone of public health surveillance and response, particularly in low-resource settings such as papua new guinea. it is adaptable to a wide variety of public health events and settings, especially rare events and those occurring in populations that do not access the formal health care system (e.g large segments of the 87% rural population in papua new guinea).4 for it to be successful, ebs should be closely tied to response; formalization of ebs through the use of assessment tools and response tracking, as described in who’s guide to establishing event-based surveillance,1 facilitates this response. the single largest source of reports to the ebs system was the pho, which is expected given the requirement for phos to report serious public health events to the national government. however, that the majority of reports were received through other sources, such as health care workers and the media, points to a need to reinforce to partners that their first point of contact should be the pho, in line with their authority to implement public health measures. positive system attributes the ebs system is fully flexible for any type of public health event; the system successfully identified a chemical event and a nutritional emergency. the incorporation of new reporting sources is relatively easily accomplished, although feedback to distant sites may be a challenge. the cost of the system, although not formally evaluated, appears exceptionally low, requiring two part-time staff members, and incurring little more cost than that of the phone calls and electricity involved. the great cost, of course, comes later in the need to respond to the many true outbreaks that are detected by the system. one logistical barrier is the frequent lack of phone credit on the part of informants (even provincial disease control officers who are directly responsible for outbreak investigations), which could be remedied by employing a toll-free reporting number; this would likely improve sensitivity and acceptability, as it would obviate the need for reporters to incur individual costs by reporting, although it would increase the cost of the system at the national level. formalizing the system beyond simply receiving rumour reports (i.e. by using standardized forms and logging all reports) has several benefits. these include improved accountability, since, once a report is logged, it must be pursued until it is investigated or dismissed; a more consistent approach to assessing reports; the ability to evaluate the relative contribution of disparate reporting sources; and others. in our opinion, these benefits far outweigh the additional burden of collecting ebs data systematically. it is equally crucial to regularly disseminate ebs performance characteristics and findings back to reporters and other stakeholders. this is currently done through a weekly national surveillance bulletin, although its reach is currently limited to those stakeholders who can receive e-mail. increasing the reach of the bulletins, including through broadcasting findings over the well-established radio network for health posts, is being explored. challenges and opportunities for improvement reporting pathway one of the challenges of the current system is the bypassing of provincial authorities of reports made directly from nongovernmental organizations or the public to the national government. this has required awareness-raising/training of provincial authorities on the benefits of an additional source of surveillance information. delay in notification the objective of ebs is to identify events early to enable rapid verification and response if the event poses a risk to public health. in papua new guinea, there is certainly room for improvement as public health events were identified after a median delay of 10 days. nevertheless, given that indicator-based data are often subject to a delay of three months or more, ebs is timelier. far more concerning is the fact that 28% of ebs events took more than 30 days to be investigated. after such a delay the opportunity for control is largely lost, and limited resources are wasted on mounting largely fruitless responses. reach of the system another challenge of the system is in reaching the majority rural population, who, by virtue of their remoteness, may not be aware of benefits and mechanisms of reporting events or who simply cannot do so. for this reason it may be useful to consider strengthening ebs in high-risk settings first. this may include raising awareness of ebs among large employers in remote settings with a high degree of international mobility, such as those in the extractive industries or logging workers who are at the interface of potential sylvatic zoonotic disease transmission events. the ebs system in papua new guinea could further be improved by systematically collecting information from media sources, both traditional and social; by being more responsive to the media, for example by publishing articles in response to media stories; and proactively reaching out to health reporters to improve story accuracy. while ebs is more sensitive than the routine indicator-based surveillance system, given the high specificity of the ebs reports (only 5% of reports are discarded as non-events), there is room to improve the sensitivity of the system by casting a wider net. lack of resources for response it is reassuring that most responses were initiated by the pho in the respective province, especially as most phos are quite limited in the extent to which they can conduct field investigations. for example, most provincial disease control officers do not have reliable access to a computer or a vehicle, and most have never formally been trained in epidemiologic principles. there is an urgent need to train these individuals for them to fulfil their mandates. therefore, ndoh and who are now incorporating ebs training into all surveillance training and resource materials such as the papua new guinea field epidemiology training programme and the recently updated papua new guinea outbreak manual. lack of diagnostic capacity as evidenced by the huge proportion of events for which an etiology could not be determined, improvements in diagnostic capacity are urgently needed. this is primarily an issue of sample collection and transport, rather than an issue of actual analysis, as described for the 2010 national cholera outbreak.5 conclusion ebs is a critical asset for papua new guinea’s public health surveillance. through this system, papua new guinea has successfully met virtually all of the ihr requirements related to ebs; the only area requiring further work is direct outreach to communities to increase reporting. the ebs system has effectively identified a large number of urgent public health events and instigated prompt responses to those events. elements of the system such as feedback and the link to laboratory confirmation need to be strengthened for the system to function to its full potential. conflicts of interest none declared. funding none. references: a guide to establishing event-based surveillance. manila, world health organization regional office for the western pacific, 2008. available from: http://www.wpro.who.int/emerging_diseases/documents/eventbasedsurv/en [accessed 25 april 2013]. asia pacific strategy for emerging diseases (2010). manila, world health organization regional office for the western pacific, 2011. available from: http://www.wpro.who.int/entity/emerging_diseases/documents/docs/asped_2010.pdf [accessed 25 april 2013]. international health regulations (2005), 2nd edition. manila, world health organization regional office for the western pacific, 2008. available from: http://whqlibdoc.who.int/publications/2008/9789241580410_eng.pdf [accessed 25 april 2013]. national health plan 2011–2020: volume 1 policies and strategies. government of papua new guinea, 2010. available from: http://www.wpro.who.int/health_services/ papua_new_guinea_nationalhealthplan.pdf [accessed 25 april 2013]. greenhill a et al. improved laboratory capacity is required to respond better to future cholera outbreaks in papua new guinea. western pacific surveillance and response journal, 2012, 3(2):30–32. doi:10.5365/wpsar.2011.2.4.016 pmid:23908909 https://ojs.wpro.who.int/ 1wpsar vol 14, no 1, 2023 | doi: 10.5365/wpsar.2023.14.1.965 original research i n terms of vulnerabilities to infectious disease epidemics, the pacific island countries and areas (pics) have some unique advantages and disadvantages. their remote location facilitates application of border control measures, and their low populations are often below the required threshold for the establishment of many epidemic-prone diseases. on the other hand, once an infectious disease is introduced, the populace is prone to explosive outbreaks and responses are often hampered by limited availability of healthcare personnel and facilities, as well as supply chain constraints. moreover, the islands – especially those with a high level of dependency on tourism income like the commonwealth of the northern mariana islands (cnmi) – can only remain closed off for so long without incurring a negative economic impact. given that a number of pics were able to effectively protect their population from the 1918–1919 influenza outbreak by introducing strict quarantine measures,1 it is not surprising that this strategy was adopted by many at the start of the novel coronavirus disease (covid-19) pandemic. success among the pics, however, has been variable.2,3 cnmi is a commonwealth in political union with the united states of america (usa) in the western pacific ocean, consisting of 14 tropical islands stretching over a commonwealth healthcare corporation, saipan, commonwealth of the northern mariana islands, united states of america. b pacific island health officers association, honolulu, hi, united states of america. c university of california san francisco, san francisco, ca, united states of america. d college of public health, university of nebraska medical center, omaha, ne, united states of america. e world health organization regional office for the western pacific, manila, philippines. f school of population health, university of new south wales, sydney, new south wales, australia. published: 25 january 2023 doi: 10.5365/wpsar.2023.14.1.965 objective: the commonwealth of the northern mariana islands (cnmi) is a remote pacific island territory with a population of 47 329 that successfully prevented the significant introduction of coronavirus disease (covid-19) until late 2021. this study documents how the response to the introduction of covid-19 in cnmi in 2021 was conducted with limited resources without overwhelming local clinical capacity or compromising health service delivery for the population. methods: data from covid-19 case investigations, contact tracing, the commonwealth’s immunization registry and whole genome sequencing were collated and analysed as part of this study. results: between 26 march 2020 and 31 december 2021, 3281 cases and 14 deaths due to covid-19 were reported in cnmi (case fatality rate, 0.4%). while notification rates were highest among younger age groups, hospitalization and mortality rates were disproportionately greater among those aged >50 years and among the unvaccinated. the first widespread community transmission in cnmi was detected in october 2021, with genomic epidemiology and contact tracing data indicating a single introduction event involving the ay.25 lineage and subsequent rapid community spread. vaccination coverage was high before widespread transmission occurred in october 2021 and increased further over the study period. discussion: robust preparedness and strong leadership generated resilience within the public health sector such that covid-19 did not overwhelm cnmi’s health system as it did in other jurisdictions and countries around the world. at no point was hospital capacity exceeded, and all patients received adequate care without the need for health-care rationing. how the commonwealth of the northern mariana islands stalled covid-19 for 22 months and managed its first significant community transmission dwayne davis,a stephanie kern-allely,b lily muldoon,a,c john m tudela,a jesse tudela,a renea raho,a heather s pangelinan,a halina palacios,a john tabaguel,a alan hinson,a guillermo lifoifoi,a warren villagomez,a joseph r fauver,d haley l cash,b esther muña,a sean t caseye,f and ali s khand,e correspondence to sean casey (email: scasey@who.int) wpsar vol 14, no 1, 2023 | doi: 10.5365/wpsar.2023.14.1.965 https://ojs.wpro.who.int/2 davis et alhow cnmi stalled covid-19; managed first outbreaks tracing and additional monitoring activities. persons under investigation (pui) were individuals with suspected covid-19 based on clinical presentation. covid-19 vaccination data were recorded by the commonwealth’s immunization tracking system, webiz.6 age-group population estimates (denominators for vaccine coverage calculations) were extrapolated from the us census bureau’s international database (idb) 2020 age pyramid using the 2020 total census population of 47 329.7,8 racial and ethnic proportions of the population were sourced from the 2010 us census.9 public health response the chcc led the public health response. in accordance with public law 13-63, the territorial health official coordinated territorial leadership, with the support of the governor and his covid-19 task force, chaired by the director of hospital and public health preparedness.10 community and hospital-based testing community-based testing evolved during the pandemic, especially after the start of the larger covid-19 outbreak in october 2021. by late 2021, daily nucleic acid amplification tests (naats) were conducted by appointment, while antigen-based surveillance testing was performed on an as-needed basis at fire stations and quarterly in schools. diagnostic testing was conducted for puis or symptomatic persons in quarantine at a community covid-19 site using us food and drug administration (fda)-approved rapid antigen tests. all patients presenting to hospital with symptoms (or close contacts of positive cases) were tested using naats. also, all health-care workers at chcc were offered naats weekly. contact tracing, isolation and quarantine for the first 3 months of the october 2021 outbreak, all laboratory-confirmed cases were questioned about their recent contacts (during the 3 days before their symptom onset or positive test result). isolation and quarantine periods followed contemporaneous us centers for disease control and prevention (cdc) guidelines. all cases and contacts were housed in government facilities – three contracted hotels – until this became logistically and financially untenable in november 2021 due to the high volume of cases. from then onwards, only symptomatic cases, those at higher risk of severe 400 nautical miles (740 km). more than 90% of the commonwealth’s population lives on the island capital of saipan (area, 46.5 square miles or 115 km2). of the 13 other islands, only rota and tinian have a significant population. in saipan, there is a single 86-bed hospital with four intensive care beds, five private clinics, and approximately 200 licensed physicians and advanced practice providers. cnmi has a shortage of health-care professionals, with the nurse-to-patient ratio in the hospital sometimes reaching levels of 1:7.4 the semiautonomous commonwealth healthcare corporation (chcc), an integrated health-care and public health system, serves as the department of health. in response to reports of a novel coronavirus disease spreading in china, cnmi adopted a strict border policy in february 2020, which facilitated the identification and isolation of travel-associated cases.5 the first community cases were identified on 26 march 2020 with limited further transmission. after eliminating local transmission in 2020, cnmi experienced its next community outbreak, again comprising only a small cluster of cases, in march 2021. a larger, more prolonged outbreak occurred at the end of 2021, extending into 2022. before this large outbreak, cnmi’s leadership had time to obtain adequate resources, train personnel and deliver a community-based vaccination campaign. thus, by the time of the first significant community spread, cnmi was uniquely protected; the case fatality rate was low and there was sufficient capacity within the health-care system to cope with increased case numbers as a result of the importation of both the delta and omicron variants of concern (vocs). the objective of this study is to describe cnmi’s adaptive public health response, which included strong border measures, contact tracing and a successful vaccination campaign, and its impact on covid-19 transmission, morbidity and mortality. we also describe the characteristics and genomic epidemiology of covid-19 cases in cnmi. methods data sources and case definitions laboratory-confirmed cases were reported to the covid-19 communicable disease investigation team who then conducted detailed case investigations, contact wpsar vol 14, no 1, 2023 | doi: 10.5365/wpsar.2023.14.1.965https://ojs.wpro.who.int/ 3 how cnmi stalled covid-19; managed first outbreaks davis et al 2021, a 25-bed alternative care site (acs) was established at a local hotel to expand bed capacity for less severely ill covid-19 patients and as a step-down unit for those hospitalized in the main hospital. the acs also supplied specialized services (e.g. haemodialysis) for patients in isolation. all covid-19 patients were assessed for risk factors for severe disease and offered monoclonal antibody treatment at the acs. during the october 2021 outbreak, in order to overcome difficulties in sharing information with patients without access to phones and wi-fi, the covid-19 task force established a physical community centre where patients could be tested, treated, and receive their test results and health advice. community-based vaccination from december 2020, all adults in cnmi were offered covid-19 vaccines in line with the contemporaneous us cdc guidelines; as vaccines were authorized for use in children, vaccination was extended to those aged >5 years. a community-based approach was used to maximize vaccine uptake, supplemented by a government mandate for all health-care workers and government employees. a directed “house-to-house” outreach campaign for vaccination and boosters targeting high-risk and low-turnout communities proved highly effective. other initiatives included the “road to 80” campaign, the aim of which was to fully vaccinate 80% of the population against covid-19. the campaign ran from july to september 2021 and offered raffle prizes to any cnmi resident who had received the first dose of any available vaccine. vaccine supply, technical assistance and logistics were provided by the us cdc. diagnostics samples for laboratory diagnostics comprised either nasopharyngeal swabs placed in universal transport media for naats (except for id now [abbott laboratories, abbott park, il, usa] which uses a disposable dry swab) or nasal swabs for antigen detection assays. initially, testing was performed at guam public health laboratory. from mid-april 2020 onwards, once fda authorization had been obtained, naat was conducted locally in cnmi using the diaplexq novel coronavirus detection kit (solgent co., ltd., daejeon, republic of korea). travellers, puis presenting to the hospital and individuals testing positive with the diaplexq assay were tested by naat with either covid-19 outcomes or those whose household was not completely vaccinated were required to complete isolation in government-managed facilities, while other cases completed isolation at home. all quarantined contacts were tested twice: once when identified as a contact and then again after completion of quarantine. point-of-entry screening point-of-entry (poe) screening evolved during the pandemic as the science behind adequate quarantine and testing strategies progressed, additional testing became available and vaccination rates increased. revisions to poe protocols were aligned with external recommendations and us cdc guidelines. beginning in march 2020, all arriving travellers were quarantined in a government-contracted quarantine hotel for 14 days and then tested before their release. from may 2020 onwards, all travellers were additionally tested on arrival. by july 2020, all visitors were required to complete an online travel registration form 72 hours before their entry into cnmi, quarantine at a government facility for 5 days (or at home for residents) and test negative for covid-19 before release. for visitors who refused to be tested, the quarantine period was extended to 14 days. in august 2020, in a reaction to rising covid-19 case numbers in the usa and nearby guam, all travellers had to quarantine in a government facility for 5–7 days, depending on their vaccination status. by june 2021, rapid antigen testing was made available at poes for arrival testing. after the identification of community cases in late october 2021, the quarantine period for all travellers was changed to 5–10 days, depending on vaccination status. protocols were again adjusted in november 2021, allowing fully vaccinated travellers to complete quarantine under active surveillance outside of a government facility. however, travellers were required to take a naat on day 5 for clearance from self-quarantine. throughout the acute period of the pandemic, qualified essential workers were granted modifications to entry requirements but only after submitting to a rigorous chcc approval process. health facility preparedness seventeen hospital rooms were upgraded to covid-19 isolation rooms and fitted with air scrubbers and ultraviolet lights (one for labour and delivery, two for obstetrics, two for paediatrics and 12 for medical cases). in early wpsar vol 14, no 1, 2023 | doi: 10.5365/wpsar.2023.14.1.965 https://ojs.wpro.who.int/4 davis et alhow cnmi stalled covid-19; managed first outbreaks were performed using r version 4.1.1. results descriptive epidemiology from 26 march 2020 to 31 december 2021, 3281 cases of covid-19 were recorded in cnmi (fig. 1). there were 87 hospitalized cases (2.6%) and 14 deaths listing covid-19 as either a cause of death or a contributing condition (case fatality rate, 0.4%; 30 deaths per 100 000 population). nearly one third of cases (30.8%; n = 1009) reported symptoms characteristic of covid-19 (e.g. fever, cough, shortness of breath, anosmia, ageusia). by december 2021, approximately 7% of cnmi’s population had been infected with covid-19. virtually all cases were identified on saipan; just nine cases (0.3%) were identified among residents of tinian. between march 2020 and october 2021, the period between the first case notification and the start of the larger community outbreak, cnmi recorded just 291 cases (fig. 1): 250 were identified from travel quarantine, 26 from contact tracing (primarily in recent travellers), 8 from hospital testing and 7 from communitybased testing. after the introduction of covid-19 in march 2020 and subsequent elimination of community transmission by april 2020, the next community outbreak of covid-19 comprised 11 cases, the first of which was identified on 12 march 2021 through outbound travel testing and the last on 17 march 2021. the much larger community outbreak started on 28 october 2021, with the first cases identified through school-based testing. at the time of writing (early 2022), this outbreak was still ongoing, albeit at lower levels. the mean age of all covid-19 cases was 31 years (range: 0–95 years) and 53.9% were in men. notification rates during the study period were highest in those aged 20–49 years (963.4 cases per 10 000 persons; n = 1621), followed by those aged 0–4 years (680.9 cases per 10 000 persons; n = 233) and those aged 5–19 years (622.8 cases per 10 000 persons; n = 790). the lowest rates were seen in the oldest age group, those aged ≥65 years (399.8 cases per 10 000 persons; n = 137), and the next oldest group, those aged 50–64 id now or genexpert; all positives were considered laboratory-confirmed cases. puis and symptomatic persons from the community in quarantine were tested using binaxnow (abbott laboratories) rapid antigen test and considered laboratory-confirmed cases if their test was positive. the covichek antigen kit (wizchem co., ltd., kangwon, republic of korea) was used for communitybased surveillance, but all positive test results were confirmed by naat or binaxnow assay. genomic and phylogenetic analysis specimens positive for severe acute respiratory syndrome coronavirus 2 (sars-cov-2) were sent to the us cdc division of viral diseases for whole genome sequencing. samples were sequenced using illumina (san diego, ca, usa) platforms and consensus sequence genomes were uploaded to gisaid. nextstrain11 was used to conduct all phylogenetic analyses. between december 2019 and july 2022, 13 090 phylogenetic analyses were conducted: 2945 genomes from cnmi and 10 145 contextual genomes, with preference given to specimens from countries with geographical proximity to cnmi, including guam, indonesia, japan, malaysia, papua new guinea, the philippines, the republic of korea and the usa. following the standard nextstrain augur12 pipeline, nucleotide alignment was conducted with mafft,13 maximum-likelihood phylogenetic trees were created with iq-tree2,14 time-resolved phylogenetic trees were created with treetime15 and results were visualized using auspice. nodes on the phylogenetic tree were annotated to indicate how the cases were identified (i.e. through travel screening, hospitalization, community testing or contact tracing) and inferred dates estimated. the inferred date is the date when a specific sars-cov-2 genotype arose, which may not necessarily be the date it was introduced. this date, by definition, must be earlier than when the first case attributable to a given genotype was detected. statistical analysis frequencies for categorical variables were tabulated. crude event rates were calculated by dividing the number of infections, hospitalizations or deaths by the total population (or vaccination status subgroup). risk ratios were calculated for the risk of hospitalization by vaccination status and were adjusted for age and sex. all analyses wpsar vol 14, no 1, 2023 | doi: 10.5365/wpsar.2023.14.1.965https://ojs.wpro.who.int/ 5 how cnmi stalled covid-19; managed first outbreaks davis et al tion estimates, carolinian, chamorro and other pacific islanders were overrepresented in the deaths (fig. 3). of the 14 deaths, nine (64.3%) were in unvaccinated individuals. two thirds of cases had received at least one dose of a covid-19 vaccine; 60.2% (n = 1975) were fully vaccinated and 5.7% (n = 188) were partially vaccinated. of the remainder, 25.7% (n = 845) were unvaccinated and 8.3% (n = 273) were ineligible for covid-19 vaccination. cases who were unvaccinated had a risk of hospitalization 2.64 times (95% confidence interval [ci]: 1.71–4.07) higher and a risk of death 3.63 times (95% ci: 1.14–11.55) higher than those who were fully vaccinated. almost half of all reported cases (46.4%; n = 1524) were identified through contact tracing. nearly another third were identified from community-based testing (27.8%; n = 912), with the remainder of cases coming from hospital testing (16.3%; n = 535) and incoming travellers (9.6%; n = 314). a total of 14 672 contacts were actively monitored by public health staff, with an average of 4.5 contacts monitored per case (range: 0–48). years (455.7 cases per 10 000 persons; n = 400). weekly notification rates increased especially rapidly in people aged <50 years from the week of 20 november to the week of 11 december 2021; rates in those aged >50 years increased more gradually over the same time frame (fig. 2). the mean age of hospitalized cases was 49 years (range: 0–95 years). hospitalization rates were highest among those aged ≥65 years (61.3 hospitalizations per 10 000 persons; n = 21), followed by those aged 50–64 years (24.6 per 10 000 persons; n = 27) and those aged 20–49 years (19.6 per 10 000 persons; n = 33). hospitalization rates were low in children, with 8.8 per 10 000 persons (n = 8) among those <5 years and 2.4 per 10 000 persons (n = 3) in those aged 5–19 years. over two fifths of hospitalized cases (43.7%) were admitted through the emergency department (n = 38). after a medical assessment, 378 (11.5%) patients received monoclonal antibodies. all but one of the 14 covid-19-related deaths occurred in people aged >50 years; there was one death in a 44-year-old. relative to the 2010 us census populafig. 1. daily number of laboratory-confirmed covid-19 cases, commonwealth of the northern mariana islands, 26 march 2020–31 december 2021 (n = 3281) � �� �� �� �� ��� ��� ��� ��� ��� ��� �� �� ��� �� �� �� ��� ��� �� � �� �� �� ��� �� �� ��� ��� �� � �� ��� ��� �� � �� ��� ��� �� � �� � � ��� �� � �� �� � �� �� �� �� �� ��� �� �� ��� �� �� � �� ��� ��� �� � �� ��� ��� �� � �� �� ��� �� �� �� ��� ��� �� � �� �� �� ��� �� �� ��� ��� �� � �� ��� ��� �� � �� ��� ��� �� � �� � � ��� �� � �� �� � �� �� �� �� �� ��� �� �� ��� �� �� � � �� �� ��� �� �� �������������� wpsar vol 14, no 1, 2023 | doi: 10.5365/wpsar.2023.14.1.965 https://ojs.wpro.who.int/6 davis et alhow cnmi stalled covid-19; managed first outbreaks fig. 2. weekly notification rates of covid-19 by age group, commonwealth of the northern mariana islands, 29 october–31 december 2021 � � �� �� �� �� ��� ��� ��� ��� ��� ����������� ���������� ����������� ����������� ����������� ���������� ����������� ����������� ����������� ����������� �� �� � �� �� �� �� �� � ��� �� �� �� � � ��� � ��������� ���������� ��������� ���������� ����������� ����������� ��������� fig. 3. covid-19-related deaths by race/ethnicity compared to 2010 census population, commonwealth of the northern mariana islands, march 2020–december 2021 (n = 14) ��� ��� �� ��� ��� �� �� ��� �� �� ��� ��� �� ��� ��� ��� ��� ��� ��� ��� ��� ��� ���� ���������� � ������ � ��� � � ������������ ������ �������� � �� ������ ������������������� ������������������������� � wpsar vol 14, no 1, 2023 | doi: 10.5365/wpsar.2023.14.1.965https://ojs.wpro.who.int/ 7 how cnmi stalled covid-19; managed first outbreaks davis et al the vaccine-eligible population (i.e. those aged >5 years); 32.2% of those eligible (n = 14 140) were up to date with boosters (fig. 5). of note, the vaccine coverage rate among adults aged ≥65 years was >99%. discussion cnmi demonstrated a well-coordinated public health response to the covid-19 pandemic. initial efforts stalled major community transmission of covid-19 for 22 months and provided a window of opportunity to prepare for the eventual community introduction of covid-19 by implementing a vaccination campaign as well as measures to ensure preparedness and efficient use of federal and partner emergency health system resources. in common with other pics, cnmi’s initial response to covid-19 relied on strict border controls; however, these were inadequate to identify and isolate all cases with poe screening. nevertheless, the rapid containment of the small community outbreak of covid-19 in march 2021, which was limited to just 11 cases, showed the ability of cnmi to successfully implement an elimination model of disease transmission for breakthrough cases. as the pandemic progressed, and given the reality of increased border crossings, lapses in quarantine processes or testing, and shorter quarantine times as pics titrated efforts to maintain tourism and protect their economies, most pics had to face the inevitability of community transmission of covid-19. indeed, in cnmi, the large community outbreak in october 2021 was traced to close contact with an essential worker and the bypassing of the rigid quarantine system that had helped to prevent widespread disease introduction for almost 22 months. the epidemiology of covid-19 in cnmi mirrors that observed in other jurisdictions around the world, with case rates highest among younger age groups and rates of severe disease, hospitalizations and deaths highest in those aged >50 years.17 given the high transmissibility of the delta voc18 and the chcc’s limited capacity to monitor a large number of cases, cnmi’s leadership when formulating its response to the october 2021 outbreak made the decision to scale back its resourceintensive contact tracing, quarantine and isolation measures. by this time, the vaccination programme had fully genomic epidemiology of the 3281 covid-19 cases, genomes were sequenced from 2945 (89.8%). ten of the 11 cases from the march 2021 community outbreak were sequenced, revealing that this cluster not only comprised viruses in the b.1.2 pango lineage16 but was also a monophyletic cluster of largely identical genomes. genomes from this cluster were direct descendants of two cases identified through travel screening on 2 february 2021. genome sequencing of cases from the larger october 2021 community outbreak also revealed a large monophyletic cluster of a virus from the ay.25 (delta variant) pango lineage (fig. 4), suggestive of a single introduction event. many of the samples from the early cases fell into a large polytomy of identical genomes with subsequent branches coming from the polytomy, consistent with rapid spread following the introduction. three mutations separate the internal cnmi cluster, and this branch has an estimated inferred date of 27 july 2021 (ci: 4 june–5 august 2021). phylogenetic analysis further showed that the monophyletic cluster of cnmi genomes were direct descendants of genomes sequenced from guam earlier in 2021 (fig. 4). genomes collected from guam in late july–early august 2021 were the most recent common ancestor of the cnmi cluster. this suggests that the large outbreak in cnmi was caused by an introduction of a single genotype in the ay.25 lineage, most likely from guam. supporting evidence comes from contact tracing data, which dated the earliest symptom onset in a community case to early october 2021. this individual reported recent contact with a traveller with “essential worker” status from guam prior to their symptom onset. vaccination coverage by 31 december 2021, 96 745 vaccine doses had been administered in cnmi – 82 145 doses of pfizerbiontech, 13 348 doses of moderna, 1245 doses of johnson & johnson/janssen and seven unknowns. before the october 2021 outbreak, vaccine coverage was 73.4% (n = 34 745) in the overall population and 90.4% of the vaccine-eligible population (i.e. those aged >12 years). by 31 december 2021, vaccine coverage reached 84.8% in the overall population (n = 40 121) and 91.4% among wpsar vol 14, no 1, 2023 | doi: 10.5365/wpsar.2023.14.1.965 https://ojs.wpro.who.int/8 davis et alhow cnmi stalled covid-19; managed first outbreaks fig. 4. phylogenetic tree of the large covid-19 outbreak of delta lineage ay.25, commonwealth of the northern mariana islands, july 2021–january 2022 fig. 5. timeline of the covid-19 vaccination programme, commonwealth of the northern mariana islands, 19 december 2020–2 january 2022 branch lengths are representative of single nucleotide polymorphisms. nodes are coloured by the location of sampling. wpsar vol 14, no 1, 2023 | doi: 10.5365/wpsar.2023.14.1.965https://ojs.wpro.who.int/ 9 how cnmi stalled covid-19; managed first outbreaks davis et al ethics statement the collection and analysis of the surveillance data in this study was part of an emergency response. the public reporting activity was determined to be routine public health practice by the territorial health officer. no animals or small children were harmed in the writing of this paper. funding none. references 1. shanks gd, brundage jf. pacific islands which escaped the 1918–1919 influenza pandemic and their subsequent mortality experiences. epidemiol infect. 2013;141(2):353–6. doi:10.1017/ s0950268812000866 pmid:22564320 2. bell l, van gemert c, merilles oe jr, cash hl, stoové m, hellard m. the impact of covid-19 on public health systems in the pacific island countries and territories. lancet reg health west pac. 2022;25:100498. doi:10.1016/j.lanwpc.2022.100498 pmid:35785109 3. li z, jones c, ejigu gs, george n, geller al, chang gc, et al. countries with delayed covid-19 introduction – characteristics, drivers, gaps, and opportunities. global health. 2021;17(1):28. doi:10.1186/s12992-021-00678-4 pmid:33731178 4. hpsa find. bethesda, md: health resources and services administration. available from: https://data.hrsa.gov/tools/shortage-area/ hpsa-find, accessed 30 august 2022. 5. zhu n, zhang d, wang w, li x, yang b, song j, et al. a novel coronavirus from patients with pneumonia in china, 2019. n engl j med. 2020;382(8):727–33. doi:10.1056/nejmoa2001017 pmid:31978945 6. commonwealth of the northern mariana islands – interim covid-19 vaccination plan. atlanta, ga: united states centers for disease control and prevention; 2020. available from: https://www.cdc.gov/ vaccines/covid-19/downloads/northern-mariana-islands-jurisdictionexecutive-summary.pdf, accessed 30 august 2022. 7. international database (idb). washington, dc: united states census bureau; 1997. available from: https://www.census.gov/ data-tools/demo/idb, accessed 30 august 2022. 8. census bureau releases 2020 census population and housing unit counts for the commonwealth of the northern mariana islands. washington, dc: united states census bureau; 2021. available from: https://www.census.gov/newsroom/press-releases/2021/2020census-cnmi.html, accessed 30 august 2022. 9. 2010 island areas commonwealth of the northern mariana islands dataset. washington, dc: united states census bureau; 2010. available from: https://www.census.gov/data/datasets/2010/ dec/cnmi.html, accessed 30 august 2022. 10. cnmi emergency health powers act of 2003. public law no. 1363. available from: https://www.cnmilaw.org/pdf/public_laws/13/ pl13-63.pdf, accessed 30 august 2022. 11. hadfield j, megill c, bell sm, huddleston j, potter b, callender c, et al. nextstrain: real-time tracking of pathogen evolution. bioinformatics. 2018;34(23):4121–3. doi:10.1093/bioinformatics/bty407 pmid:29790939 vaccinated 73.5% of the eligible population in cnmi, helping to keep hospitalization and mortality rates low and preventing the health-care system from being overwhelmed. lessons learned from the success of the delta response have since been used to inform the response to the omicron variant which – unlike the situation in other countries where there was a gap between the delta and omicron waves – was also circulating in the community by december 2021. in cnmi, unique challenges such as limited health-care facility capacity and delayed access to surge personnel and supplies served as drivers for aggressive preparedness and response actions. strict poe protocols prevented widespread community transmission initially and delayed the worst of the impacts of covid-19 while local efforts focused on learning, assembling and vaccinating. however, as poe restrictions were relaxed and more transmissible variants (delta and later omicron) overwhelmed contact tracing efforts, widespread community transmission ultimately occurred, and resources were redirected to other critical response efforts. nonetheless, the alignment of political and health leadership with a community-based approach tempered many of the challenges faced on the us mainland, including overstretched hospitals and high mortality rates. the high vaccination rate, achieved in a multi-ethnic, multi-racial community despite the spread of misinformation, was also a major contributor to the success of the response. cnmi has had relatively mild morbidity and mortality from this pandemic thanks to its model health response. acknowledgements we thank the people of our cnmi community who came together to help protect their families and communities from the covid-19 pandemic, the contact tracers who were heralded as “person of 2021” by the saipan tribune, the health-care staff who selflessly sacrificed time with their families and friends to take care of the sick, and the following colleagues: subroto banerji, richard brostrom, janet camacho, emi chutaro, clint fowler, emily haanschoten, w thane hancock, melissa jenssen, peter judicpa, doug kindt, justin lee, melody mount, kazuhiro okumura and mark young. conflicts of interest the authors have no conflicts of interest to declare. https://data.hrsa.gov/tools/shortage-area/hpsa-find https://data.hrsa.gov/tools/shortage-area/hpsa-find https://www.cdc.gov/vaccines/covid-19/downloads/northern-mariana-islands-jurisdiction-executive-summary.pdf https://www.cdc.gov/vaccines/covid-19/downloads/northern-mariana-islands-jurisdiction-executive-summary.pdf https://www.cdc.gov/vaccines/covid-19/downloads/northern-mariana-islands-jurisdiction-executive-summary.pdf https://www.census.gov/data-tools/demo/idb https://www.census.gov/data-tools/demo/idb https://www.census.gov/newsroom/press-releases/2021/2020-census-cnmi.html https://www.census.gov/newsroom/press-releases/2021/2020-census-cnmi.html https://www.census.gov/data/datasets/2010/dec/cnmi.html https://www.census.gov/data/datasets/2010/dec/cnmi.html https://www.cnmilaw.org/pdf/public_laws/13/pl13-63.pdf https://www.cnmilaw.org/pdf/public_laws/13/pl13-63.pdf wpsar vol 14, no 1, 2023 | doi: 10.5365/wpsar.2023.14.1.965 https://ojs.wpro.who.int/10 davis et alhow cnmi stalled covid-19; managed first outbreaks 16. o’toole á, pybus og, abram me, kelly ej, rambaut a. pango lineage designation and assignment using sars-cov-2 spike gene nucleotide sequences. bmc genomics. 2022;23(1):121. doi:10.1186/ s12864-022-08358-2 pmid:35148677 17. covid-19 confirmed cases and deaths dashboard. geneva: united nations children’s fund; 2022. available from: https://data.unicef. org/resources/covid-19-confirmed-cases-and-deaths-dashboard/, accessed 30 august 2022. 18. twohig ka, nyberg t, zaidi a, thelwall s, sinnathamby ma, aliabadi s, et al. hospital admission and emergency care attendance risk for sars-cov-2 delta (b.1.617.2) compared with alpha (b.1.1.7) variants of concern: a cohort study. lancet infect dis. 2022;22(1):35–42. doi:10.1016/s1473-3099(21)00475-8 pmid:34461056 12. huddleston j, hadfield j, sibley tr, lee j, fay k, ilcisin m, et al. augur: a bioinformatics toolkit for phylogenetic analyses of human pathogens. j open source softw. 2021;6(57):2906. doi:10.21105/ joss.02906 pmid:34189396 13. katoh k, standley dm. mafft multiple sequence alignment software version 7: improvements in performance and usability. mol biol evol. 2013;30(4):772–80. doi:10.1093/molbev/mst010 pmid:23329690 14. minh bq, schmidt ha, chernomor o, schrempf d, woodhams md, von haeseler a, et al. iq-tree 2: new models and efficient methods for phylogenetic inference in the genomic era. mol biol evol. 2020;37(5):1530–4. doi:10.1093/molbev/msaa015 pmid:32011700 15. sagulenko p, puller v, neher ra. treetime: maximum-likelihood phylodynamic analysis. virus evol. 2018;4(1):vex042. doi:10.1093/ ve/vex042 pmid:29340210 https://data.unicef.org/resources/covid-19-confirmed-cases-and-deaths-dashboard https://data.unicef.org/resources/covid-19-confirmed-cases-and-deaths-dashboard https://ojs.wpro.who.int/ 1wpsar vol 14, no 5, 2023 | doi: 10.5365/wpsar.2023.14.5.942 brief report a t the beginning of the coronavirus disease 2019 (covid-19) pandemic, mongolia took early and stringent response measures that were considered successful until early 2021.1,2 following the lifting of a nationwide lockdown in april 2021, there was a rapid resurgence of cases from mid-may to mid-june (fig. 1). by early june, covid-19 hospital bed and intensive care unit (icu) bed occupancy in the capital of ulaanbaatar exceeded total capacity (fig. 2). this impacted both health-care delivery for covid-19 and other essential health services. at its peak, 2746 new cases (18 june 2021) and 17 deaths (3 july 2021) were reported in a single day, totalling 166 145 cases and 812 deaths as of 1 august 2021.3 mongolia is a lower middle-income country with a population of 3.3 million widely distributed across a vast area of over 1.5 million km2. health service delivery is organized into national, provincial and sub-provincial levels. there is an average of 80 beds and 30 medical doctors per 10 000 population, with higher ratios in ulaanbaatar than in the provinces.4 world health organization (who) clinical management guidelines recommend that covid-19 care pathways be established at the national, subnational and local levels to treat patients in the right settings according to disease severity and risk.5 however, the national distribution of covid-19 patients of different disease severity across the health system has rarely been systematically monitored or documented in mongolia. in response to the increasingly overwhelmed health capacity, the ministry of health and who conducted a rapid systems assessment and took action on three key components: influx of patients, care pathway and exit. to manage the influx of new patients into care pathways, more stringent public health and social measures (phsms) such as restrictions on business operation and interprovincial movement were introduced from mid-june 2021. to increase care capacity, 1947 additional beds were mobilized by mid-june including approximately 100 additional icu beds and newly established intermediate facilities and treatment centres in ulaanbaatar. intermediate facilities with oxygen supplies and temporary icu beds accommodated primarily non-severe patients with risk factors for severe disease and severe patients who needed oxygen, while treatment centres provided care for severe and critical patients. severe patients in intermediate facilities were referred to treatment centres as bed availability and their condition allowed. despite these measures, bed occupancy was rapidly overwhelmed. by 14 june, 33 deaths were reported among patients with severe disease monitored at home who rapidly deteriorated. who supported the ministry of health to map cases into a 3x4 table by disease severity and type of facility as per who clinical management guidance in ulaanbaatar and provinces (fig. 3).5 numbers of available beds and patients were reported by each health facility and collated on an online dashboard. a bed management team, comprised of seven members from the ministry of health, national center for communicable diseases and the city health department, was established on 17 june to oversee health-care utilization at different levels of the health system and coordinate admissions and referrals to optimize the use of resources. by assessing the table a ministry of health, ulaanbaatar, mongolia. b world health organization representative office for mongolia, ulaanbaatar, mongolia. c world health organization regional office for the western pacific, manila, philippines. published: 9 september 2022 doi: 10.5365/wpsar.2023.14.5.942 urgent actions to save lives when icu bed needs approach or exceed capacity: lessons from mongolia buyantogtokh batsukh,a bund-ochir khishigsaikhan,a dulamragchaa buyanbaatar,b gerelmaa danzan,b nansalmaa munkhtur,b ariuntuya ochirpurev,b takeshi nishijima,c howard sobelc and masahiro zakojic correspondence to masahiro zakoji (email: zakojim@who.int) wpsar vol 14, no 5, 2023 | doi: 10.5365/wpsar.2022.14.5.942 https://ojs.wpro.who.int/2 batsukh et alurgent actions to save lives fig 1. reported daily cases of covid-19 by ulaanbaatar and provinces, mongolia, november 2020–july 2021 source: covid-19 situation report for mongolia #65: 01 august 2021. manila: who regional office for the western pacific; 2021. available from: https://www.who.int/ mongolia/internal-publications-detail/covid-19-situation-report-for-mongolia-65, accessed 11 november 2021. fig. 2. covid-19 bed and icu occupancy in ulaanbaatar, 21 may–19 july 2021 3x4 table and bed management team fig. 3 comparison 60% 70% 80% 90% 100% 0 100 200 300 400 21 may 28 may 4 june 11 june 18 june 25 june 2 july 9 july 16 july o cc up an cy (% ) n um be r o f i cu b ed s occupied icu beds available icu beds icu occupancy 60% 70% 80% 90% 100% 0 2000 4000 6000 8000 21 may 28 may 4 june 11 june 18 june 25 june 2 july 9 july 16 july o cc up an cy (% ) n um be r o f c o vi d -1 9 be ds occupied covid-19 beds available covid-19 beds covid-19 bed occupancy 0 500 1000 1500 2000 2500 3000 15 30 15 31 15 31 15 28 15 31 15 30 15 31 15 30 15 31 nov dec jan feb mar apr may june july n um be r of c as es date of infection ulaanbaatar provinces 3x4 table and bed management team wpsar vol 14, no 5, 2023 | doi: 10.5365/wpsar.2022.14.5.942https://ojs.wpro.who.int/ 3 urgent actions to save livesbatsukh et al fig 3. patient distribution by severity and facility for two time periods, 22 and 27 june 2021, ulaanbaatar, mongolia of the 75 severe patients occupying icu beds who did not require mechanical ventilation or vasopressor therapy, 26 were transferred to general wards. this increased efficiency in allocating limited critical care resources to patients who most needed them. in the period following these actions, deaths decreased from a peak of 104 during the week of 28 june to 41 during the week of 19 july and further decreased thereafter. through live monitoring of bed occupancy, the covid-19 care pathway continued to be proactively fine-tuned after this initial phase. by improving the efficient use of covid-19 and icu beds, space was made for patients with severe disease or risk factors for severe disease where monitoring was more intense and referral easier. this resulted in immediate reduction of waiting patients. accomplishing this required that a strict definition of disease severity and corresponding care be ensured and applied, such as that in the who clinical management guidelines. fear of deterioration both among the public and clinicians, coupled with a financial incentive for hospitals to admit mild cases, were the main drivers behind inefficient bed management. assuring safe home monitoring and timely admission and updating the reimbursement policy to require approval from bed management teams helped manage conflicting expectations and interests. from highest to lowest disease severity, three urgent actions were identified, agreed upon and implemented within 2 weeks. first, all patients with severe disease who were at home were admitted. as of 22 june, the 3x4 table analysis identified 126 patients with severe disease who were at home waiting for hospitalization. family doctors and district surveillance doctors were monitoring the severity of patients at home via in-person visits or over the phone. between 22 and 27 june, all of these patients were hospitalized or kept at the newly built intermediate triage and treatment centre, which was equipped with temporary critical care resources including mechanical ventilators. second, patients with severe disease or risk factors for severe disease who were in non-icu covid-19 beds in hospitals and intermediate care facilities were closely monitored using pulse oximetry for timely admission to the icu. while severe cases in general wards decreased from 876 to 830 between 22 and 27 june, 33 patients requiring critical care were identified and moved to the icu. third, to create space in the icu, patients who did not require intensive care were discharged. icu patients were reassessed daily for disease severity and were discharged to covid-19 general wards when appropriate. 22 june asymptomatic non-severe (mild/moderate) severe critical icu beds 90.4%/303 0 75 199 covid beds 86.7%/5132 3576 876 0 intermediate facilities 65.9%/1841 1154 59 0 home-based care 19 874 126 0 total 24 604 1136 199 waiting patients 1 23 1. admit severe waiting patients to hospitals. 2. monitor disease severity for timely admission to icu. 3. discharge patients who do not require critical care in icu. 27 june asymptomatic non-severe (mild/moderate) severe critical icu beds 91.5%/307 0 49 232 covid beds 98.3%/5003 4088 830 0 intermediate facilities 79.5%/1702 1294 60 0 home-based care 25 095 (50 pregnant) 0 0 total 30 477 939 232 wpsar vol 14, no 5, 2023 | doi: 10.5365/wpsar.2022.14.5.942 https://ojs.wpro.who.int/4 batsukh et alurgent actions to save lives conflicts of interest the authors have no conflicts of interest to declare. ethics statement no ethical review is needed because only publicly available information was used. funding no specific funding was received to support this work. references 1. erkhembayar r, dickinson e, badarch d, narula i, warburton d, thomas gn, et al. early policy actions and emergency response to the covid-19 pandemic in mongolia: experiences and challenges. lancet glob health. 2020;8(9):e1234–41. doi:10.1016/s2214109x(20)30295-3 pmid:32711684 2. dorjdagva j, batbaatar e, kauhanen j. mass testing for covid-19 in ulaanbaatar, mongolia: “one door-one test” approach. lancet reg health west pac. 2021;9:100149. doi:10.1016/j.lanwpc.2021.100149 pmid:34327444 3. covid-19 situation report for mongolia #65: 01 august 2021. manila: who regional office for the western pacific; 2021. available from: https://www.who.int/mongolia/internal-publicationsdetail/covid-19-situation-report-for-mongolia-65, accessed 11 november 2021. 4. global health observatory. geneva: world health organization; 2022. available from: https://www.who.int/data/gho/data/indicators, accessed 11 november 2021. 5. covid-19 clinical management: living guidance, 25 january 2021. geneva: world health organization; 2021. available from: https:// apps.who.int/iris/handle/10665/338882, accessed 11 november 2021. 6. pasin l, sella n, correale c, boscolo a, rosi p, saia m, et al. regional covid-19 network for coordination of sars-cov-2 outbreak in veneto, italy. j cardiothorac vasc anesth. 2020;34(9):2341–5. doi:10.1053/j.jvca.2020.05.005 pmid:32425461 7. asia pacific strategy for emerging diseases and public health emergencies (apsed iii) : advancing implementation of the international health regulations (2005) : working together towards health security. manila: who regional office for the western pacific; 2017. available from: https://apps.who.int/iris/handle/10665/259094, accessed 18 may 2022. when service capacity is near or exceeding the maximum, urgent actions must be taken to minimize preventable deaths.6 clinical care pathways alone cannot solve the issue; a comprehensive systems approach, including phsms, point-of-entry measures and vaccination, is critical to augment severity-based efficient bed management. the 3x4 table mapping is a simple yet powerful framework to visualize the distribution of patients at different levels across the health system and help policy-makers and facility managers take urgent decisions to save lives. the limitations of this approach include the possible misclassification of disease severity, data inadequacy and lateness, and the additional workload of monitoring in a disaggregated manner. it is also not possible to conclude if and to what extent the improved bed management contributed to minimizing preventable deaths. to safeguard against surges overwhelming health systems and ensuring care for the right patients in the right settings, the hospital-centred covid-19 care pathway needs to be adapted to be more comprehensive, integrating home and intermediate facilities. to that end, safe monitoring, timely referral and optimized bed management are key. for sustained management of covid-19, it is critical to strengthen multi-source surveillance as described in the asia pacific strategy for emerging diseases and public health emergencies (apsed iii), including health-care capacity to inform proactive policy decisions and adaptations to health-care pathways.7 acknowledgements the authors acknowledge the support and guidance of sergey diorditsa, monica fong, erdenechimeg enkhee and altanzagas badrakh, who representative office for mongolia. https://ojs.wpro.who.int/ 1wpsar vol 12, no 4, 2021 | doi: 10.5365/wpsar.2021.12.4.859 perspective t he first case of coronavirus disease 2019 (covid-19) in japan was confirmed on 16 january 2020. the first wave of cases peaked on 10 april 2020 (n = 710) and the second on 7 august 2020 (n = 1595). iwate prefecture in north-eastern japan was the last prefecture to confirm a case of covid-19, on 29 july 2020, 110 days after all other prefectures had confirmed cases. no cases were reported during the first wave.1 as of 21 september 2021, there had been 3469 cases (282.8/100 000 population) and 52 deaths (1.50% fatality rate) in iwate and 1.7 million cases (1333.2/100 000 population) and 17 294 deaths (1.03% fatality rate) in japan overall. this article discusses possible reasons for the low number of covid-19 cases in iwate. geographical characteristics and population movement iwate prefecture is 500 km from tokyo and is bordered by mountains to the west and the sea to the east. it has a low population density (83.8 persons/km2). population movement into and within iwate decreased after the initial covid-19 cases were reported in japan. after a national state of emergency was declared on 16 april 2020, the transient population of morioka city, the capital of iwate, decreased by 30–60%.2 during the national golden week holiday in 2020, held at the end of april, for example, travel on trains to major train stations in iwate was 70-80% lower than in 2019.3 a survey showed that two thirds of iwate residents did not want contact with people from other prefectures,4 and people from other prefectures avoided going to iwate to avoid discrimination. thus, geographical barriers and decreased movement into iwate may have contributed to the low transmission. miyagi prefecture neighbours iwate to the south. although its historical, demographic, socioeconomic and cultural characteristics are similar to those of iwate, it had 149 notifications of covid-19 as of 28 july 2020, while iwate had none. miyagi prefecture is closer to tokyo, at 300 km, and is also the largest prefecture in the tohoku region in terms of population and economy. miyagi prefecture also had to take in covid-19 patients who were infected on board the diamond princess cruise ship without adequate preparation.5 these factors may have contributed to a higher rate of contact between people and more cases. lessons learnt from responding to the 2011 great east japan earthquake and tsunami countermeasures for infectious diseases were established in iwate to respond to the 2011 great east japan earthquake and tsunami. these included use of infection control assistance teams for daily surveillance, training in hand hygiene and providing information on infection control.6 the teams were used in the early response to covid-19 in iwate and provided advice and information to decision-makers for infection control. countermeasures adopted by the iwate prefectural government the iwate prefectural government took appropriate local actions at each stage of the covid-19 pandemic. it established a countermeasure headquarters headed by the governor in february 2020, with the first phase of countermeasures beginning on 23 april when a state of emergency was declared. although there were no local cases during this phase, the strategy was to limit the risk a iwate prefecture government, morioka, iwate, japan. b division of medical education, iwate medical university, iwate, japan. c harvard t.h. chan school of public health, boston, massachusetts, united states of america. published: 27 october 2021 doi: 10.5365/wpsar.2021.12.4.859 how iwate prefecture in japan maintained a low covid-19 infection rate shuko takahashia,b and ichiro kawachic correspondence to shuko takahashi (email: shutakahashi-iwt@umin.ac.jp) wpsar vol 12, no 4, 2021 | doi: 10.5365/wpsar.2021.12.4.859 https://ojs.wpro.who.int/2 takahashi et alhow iwate prefecture in japan maintained a low covid-19 infection rate the pandemic. the unemployment rate in iwate hardly changed (2.1% in 2019 vs 2.4% in 2020).9 cultural characteristics of iwate residents the japanese custom of physical distancing during greetings is often cited as a factor in preventing transmission of infectious diseases.10 another characteristic of iwate residents, which may also prevent transmission of respiratory infections, is that they do not raise their voices during conversation. widespread awareness of being the last prefecture in japan without a confirmed case of covid-19 might also have led to further effort to avoid infection. limited testing early in the response another possible reason for the low number of covid-19 cases in iwate is limited testing, as polymerase chain reaction (pcr) tests were initially used only for patients with symptoms of pneumonia.11 as of 28 july 2020, 1438 diagnostic tests had been conducted in iwate, a rate of 118.4 per 100 000 population, as compared with 515.7 per 100 000 in japan overall and 1297.7 per 100 000 in tokyo (fig. 1).12–14 therefore, asymptomatic cases of covid-19 might have been missed, in particular among younger people.15 as resources for testing increased in japan, tests were conducted not only for symptomatic patients but also for asymptomatic suspected cases.16 by july 2020, japan had acquired sufficient testing capacity. therefore, if cases of infection had been missed due to lack of testing or undetected asymptomatic cases, there should have been a large increase in the number of cases of covid-19 once testing was increased.17 this was not the case. this article summarizes the characteristics of iwate prefecture, its population and local government actions that may have contributed to the delay in cases of covid-19 infection. the extra time allowed the local government to strengthen health-care capabilities and raise residents’ level of awareness. these countermeasures might have contributed to the smaller number of reported covid-19 cases in iwate, which has continued into the second year of the pandemic. of transmission by physical distancing. businesses stayed open, but the government requested people to avoid “unnecessary and non-urgent” outings.7 schools were closed from 2 to 25 march and from 29 april to 6 may. staff were recruited for disaster medical assistance teams to coordinate the work of hospitals. testing and treatment centres and support systems, such as call centres for travellers, were quickly established. during the second phase, from after the state of emergency in iwate was lifted on 14 may to 7 june, the prefectural government continued to prevent transmission while maintaining the local economy. although the national government established restrictions on large-scale events, in iwate, which had still not reported a covid-19 case, all schools and businesses (including bars, night clubs and restaurants) remained open, except between 29 april and 6 may, when all recreational facilities, night clubs or establishments that served food and beverages were closed. the prefectural government requested residents not to travel between prefectures, but this request was relaxed on 1 june. the goal during the third phase was to provide information about the current situation and establish plans for when the first confirmed covid-19 case occurred. as the period with no confirmed cases in iwate became longer, residents feared becoming the first case. the prefectural government promised to provide sufficient contact tracing and isolation and publicly appealed that no blame be placed on cases. strong leadership throughout the response included clear, consistent messaging by government officials about preventive measures, such as avoiding the “three cs” (confined spaces with poor ventilation, gathering in crowded areas and close contact with others), frequent hand-washing and physical distancing.7 the iwate prefectural government also provided direct support to businesses affected by the covid-19 restrictions.8 after declaration of the first national state of emergency in late april 2020, many companies experienced financial difficulties; however, as of late july 2020, only two companies in iwate had closed due to wpsar vol 12, no 4, 2021 | doi: 10.5365/wpsar.2021.12.4.859https://ojs.wpro.who.int/ 3 how iwate prefecture in japan maintained a low covid-19 infection ratetakahashi et al references 1. information on the coronavirus (covid-19) iwate prefecture. iwate: prefectural government; 2021. available from: https://www. pref.iwate.jp/kyouikubunka/kokusai/1006971/1027622/1027623. html, accessed 23 september 2021. 2. comparison of a transient population in the central commercial areas in morioka city during golden week periods between in 2019 and 2020: iwate: prefectural government; 2021. available from: https://www.pref.iwate. jp/_res/projects/default_project/_page_/001/028/231/20200526_011. pdf, accessed 23 september 2021. 3. comparison of population density across consecutive holidays in may in major stations in iwate. iwate: prefectural government; 2021. available from: https://www.pref.iwate.jp/_res/projects/default_project/_page_/001/028/231/20200515_004.pdf, accessed 23 september 2021. 4. [perceptions and behaviours towards covid-19] (in japanese). tokyo: neo marketing; 2020. available from: https://neo-m.jp/investigation/2516/, accessed 23 september 2021. 5. mizumoto k, kagaya k, zarebski a, chowell g. estimating the asymptomatic proportion of coronavirus disease 2019 (covid-19) cases on board the diamond princess cruise ship, yokohama, japan, 2020. euro surveill. 2020;25(10):2000180. doi:10.2807/15607917.es.2020.25.10.2000180 pmid:32183930 6. nohara m. impact of the great east japan earthquake and tsunami on health, medical care and public health systems in iwate prefecture, japan, 2011. western pac surveill response j. 2012;2(4):24– 30. doi:10.5365/wpsar.2011.2.4.002 pmid:23908898 7. tasso t. a message from the governor of iwate about covid-19 (april 3). iwate: prefectural government; 2020. available from: https://www.pref.iwate.jp/kyouikubunka/kokusai/1006971/1027622/1046827/1028829.html, accessed 23 september 2021. acknowledgements this project was conducted with support from the takemi program in international health at the harvard t.h. chan school of public health. conflicts of interest none ethics approval as this research was a secondary analysis of public data from japan, the study was exempt from review by an internal review board. funding this work was supported by jsps kakenhi grant number jp20k18858. the funders had no role in the study design, data collection or analysis, decision to publish or preparation of the manuscript. fig. 1. number of pcr tests conducted and covid-19 cases confirmed in iwate and japan, february–july 2020a 0 200 400 600 800 1000 1200 1400 1600 1800 0 2 4 6 8 10 12 14 16 18 20 feb mar apr may jun jul n um be r of c on fi rm ed c as es n um be r of p c r te st s pe r 10 0 00 0 po pu la ti on pe r da y pcr tests and confirmed cases in iwate cases in tokyo tests in iwate tests in japan7.4 6.6 19.2 phase 1 phase 2 phase 3 a the purple line represents iwate, and the blue line represents all of japan. no cases of covid-19 were confirmed in iwate through 28 july 2020. wpsar vol 12, no 4, 2021 | doi: 10.5365/wpsar.2021.12.4.859 https://ojs.wpro.who.int/4 takahashi et alhow iwate prefecture in japan maintained a low covid-19 infection rate 13. [confirmed cases of the coronavirus (covid-19) in japan] (in japanese. tokyo: ministry of health, labour and welfare; 2021. available from: https://www.mhlw.go.jp/stf/covid-19/kokunainohasseijoukyou.html, accessed 23 september 2021. 14. updates on covid-19 in tokyo. tokyo: tokyo metropolitan government; 2021. available from: https://stopcovid19.metro.tokyo.lg.jp/ en, accessed 23 september 2021. 15. davies ng, klepac p, liu y, prem k, jit m, cmmid covid-19 working group et al. age-dependent effects in the transmission and control of covid-19 epidemics. nat med. 2020;26(8):1205–11. doi:10.1038/s41591-020-0962-9 pmid:32546824 16. [tests for novel coronavirus disease] (in japanese). tokyo: ministry of health, labour and welfare; 2021. available from: https:// www.mhlw.go.jp/stf/seisakunitsuite/bunya/0000121431_00132. html?fbclid=iwar0h7i3ln-tic0uswlk31qvf7qfc1x_ukmis33cyenp4q8aek62pnrcvlpq, accessed 23 september 2021. 17. iwasaki a, grubaugh nd. why does japan have so few cases of covid-19? embo mol med. 2020;12(5):e12481. doi:10.15252/ emmm.202012481 pmid:32275804 8. tasso t. a message from the governor of iwate about covid-19 (23 april). iwate: prefectural government; 2020. available from: https://www.pref.iwate.jp/kyouikubunka/kokusai/1006971/1027622/1046827/1029410.html, accessed 23 september 2021. 9. [summary of labour force survey from 2015 to 2020] (in japanese). tokyo: statistics bureau, ministry of internal affairs and communications; 2021. available from: https://www.stat.go.jp/data/roudou/ pref/zuhyou/lty.xlsx, accessed 23 september 2021. 10. mahbub m, khan m, yamaguchi n, hase r, harada n, tanabe t. japan’s public health and culture, and the ongoing fight against covid-19. j adv biotechnol exp ther. 2020;3(4):42–8. doi:10.5455/jabet.2020.d155 11. legido-quigley h, asgari n, teo yy, leung gm, oshitani h, fukuda k et al. are high-performing health systems resilient against the covid-19 epidemic? lancet. 2020;395(10227):848–50. doi:10.1016/s0140-6736(20)30551-1 pmid:32151326 12. [information on the coronavirus (covid-19)] (in japanese). iwate: iwate prefecture; 2021. available from: https://www.pref.iwate.jp/ kurashikankyou/iryou/covid19/index.html, accessed 23 september 2021. https://ojs.wpro.who.int/ 1wpsar vol 13, no 2, 2022 | doi: 10.5365/wpsar.2022.13.2.871 lessons from the field problem public health responses to outbreaks can involve fieldwork to support outbreak investigation and implementation of control measures (where “fieldwork” means deploying staff to outbreak sites to support the public health response). fieldwork is common in public health, yet little has been published on how to safely conduct it. the emergence and spread of severe acute respiratory syndrome coronavirus 2 (sars-cov-2), the virus responsible for coronavirus disease 2019 (covid-19), highlights the challenges posed by novel viruses for public health authorities coordinating fieldwork. public health practitioners are a vital but scarce resource during pandemic response. beyond workplace obligations, an effective public health response must assess, mitigate and control occupational exposure of fieldwork staff. failure to achieve this can place staff and the community at risk of infection, with potentially serious consequences. fieldwork can be particularly difficult when responding to a condition for which there is an evolving knowledge base. our understanding of sars-cov-2 transmission has changed rapidly over the course of the pandemic (e.g. changing definitions for cases and close contacts of covid-19 in australia’s national guidelines).1 the possibility of asymptomatic and pre-symptomatic transmission and the broad range of clinical symptoms2 can lead to retrospective recognition of infectious exposures during fieldwork, given that new cases may be identified after symptoms develop or following broader testing. a new south wales ministry of health, new south wales, australia. b australian national university, canberra, australia. published: 08 april 2022 doi: 10.5365/wpsar.2022.13.2.871 fieldwork for public health responses during pandemics: lessons from the new south wales health experience with covid-19 laksmi s. govindasamy,a anthony zheng,a ming chen,a debbie chia,a paola garcia,a chaturangi yapaa,b and tara smitha correspondence to laksmi govindasamy (email: lgovindasamy@swin.edu.au) problem: fieldwork is a vital component of public health emergency response, yet little has been published on undertaking fieldwork safely. safety is of particular importance with emerging pandemic viruses, which can pose additional risks to public health fieldwork staff. context: during a pandemic, surge health staff may be drawn from diverse professional backgrounds; they may have limited experience in fieldwork or be unfamiliar with the risks posed by a novel virus. novel pathogens pose dangers to fieldwork staff, particularly when there are global or local shortages of personal protective equipment. action: during the coronavirus disease 2019 (covid-19) pandemic, new south wales (nsw) health’s public health emergency operations centre (pheoc) deployed staff for fieldwork in a range of settings. the pheoc developed a protocol to systematize planning, risk assessment and management for covid-19 fieldwork. the protocol was accompanied by training, discussion exercises and debriefs to support pheoc fieldwork staff. lessons learned: effective fieldwork is an essential component of outbreak investigation and management, including stakeholder management. here, we share and discuss key elements of the nsw health protocol to support fieldwork during outbreak responses for emerging communicable diseases across various resource contexts. limited understanding of novel viruses, particularly in the early phases of a pandemic, must be considered in decisions to deploy fieldwork staff and implement precautionary risk mitigation approaches. planning is essential to protect staff and ensure ethical allocation of resources. through appropriate selection of teams and training, surge staff can be supported to effectively conduct fieldwork. wpsar vol 13, no 2, 2022 | doi: 10.5365/wpsar.2022.13.2.871 https://ojs.wpro.who.int/2 govindasamy et allessons from fieldwork for covid-19 schools, cruise ships, workplaces, airports and hotels. each setting required relationship building through consultation with different stakeholders. fieldwork activities included site assessment to consider potential transmission dynamics and to inform contact tracing; screening to identify individuals at risk of covid-19; collection of samples for sars-cov-2 testing; and ipc assessments. often, fieldwork staff were also required to provide immediate public health advice, support outbreak management decisions and communicate with stakeholders (both onsite and offsite). decisions to deploy staff for fieldwork were generally required urgently, typically within 1–12 hours. the pheoc iteratively developed the protocol to guide and support fieldwork teams as understanding of sars-cov-2 evolved. for example, when the protocol was first drafted, it was not clear whether asymptomatic transmission was possible or was a key driver of transmission. once such transmission was recognized, we strengthened the protocol’s approach to ipc accordingly. issues identified from fieldwork deployment debriefs were used (with reference to the nsw health risk management policy)7 to develop and test the protocol with fieldwork staff, to ensure that solutions were pragmatic and realistic. thus, the protocol was repeatedly piloted, tested and revised, and drew on the lived experiences of deployed staff. additionally, the pheoc operations team facilitated fieldwork training for surge staff, including tabletop discussion exercises, after which the protocol and field kits stocked for deployments were further improved and incorporated into an equipment checklist (fig. 1). incorporating ipc measures was identified as a vital component of risk mitigation, along with the recognition of insufficient capacity within the pheoc to provide ipc training. ipc experts and clinical nurse consultants from the nsw government’s clinical excellence commission (cec) were engaged to provide ipc training and assessment to surge staff. the cec produced guidelines for ipc in clinical settings in nsw health,4 and their staff directly supported pheoc’s public health fieldwork activities, including onsite ipc assessments. the cec delivered tailored ipc training, including certification for fieldwork staff in safe use of ppe requirements for covid-19 (standard, contact, droplet and aerosol precautions)8 and practical guidance on identifying and managing breaches of ppe, and the establishment of field donning and doffing stations. here, we present learnings from the development of the new south wales (nsw) health protocol: preparing for covid-19 fieldwork: protocol for pheoc staff (hereafter, the protocol) and share its framework and checklists to support risk management for other jurisdictions. the protocol was developed for covid-19 fieldwork in nsw, but we believe this approach can be readily adapted for application to other infectious diseases and resource contexts. context responsibility for coordinating fieldwork to support public health investigations and responses during the covid-19 pandemic lay with the nsw ministry of health’s public health emergency operations centre (pheoc) and the public health units (phus) of local health districts. at nsw health, public health fieldwork is typically undertaken by phus. fieldwork supports investigations of infectious disease outbreaks and environmental exposures, implementation of public health management and coordination of response management. however, in the context of a novel virus, there were specific challenges: • pandemic responses often involve surge staff, who may have limited public health or fieldwork experience.3 • experienced public health staff may be unfamiliar with the risks posed by a new virus and the specific infection prevention and control (ipc) procedures required, such as personal protective equipment (ppe).4 although ppe training is routinely provided as part of orientation for new employees in australian health systems, less than half of surveyed providers report annual or regular refresher training.5 for non-clinical public health staff, there may be even fewer opportunities for routine ipc training. • the pandemic context typically requires urgent decision-making and rapid responses, potentially against a background of an overwhelmed health system and resource scarcity that presents ethical challenges.6 action during the nsw health covid-19 pandemic response, the pheoc’s operations team undertook fieldwork in various settings, including residential aged-care facilities, wpsar vol 13, no 2, 2022 | doi: 10.5365/wpsar.2022.13.2.871https://ojs.wpro.who.int/ 3 lessons from fieldwork for covid-19govindasamy et al lessons learned in our experience, effective fieldwork can confer benefits beyond the investigative information gathered in the field to guide outbreak response efforts. importantly, fieldwork plays a crucial role in establishing cooperative relationships with staff at facilities and organizations, which are integral components of successful outbreak management. for example, some residential aged-care facilities experienced a significant increase in workload during outbreaks, with reduced staff, increased ipc requirements, increased reporting demands and media attention. in such cases, fieldwork staff were able to developing the protocol highlighted the importance of preparation, risk assessment and team briefings before fieldwork activities, systematized by the development of an action checklist (fig. 2). a key question posed during the risk assessment process was whether there were any effective alternatives to undertaking fieldwork that would minimize risks to staff (e.g. videoconferencing, using resources such as maps of facilities or using a risk assessment tool). likewise, the opportunities for other staff to learn from the experiences of fieldwork staff and to make further improvements to the protocol were formalized through the development of a structured debrief document (fig. 3). fig. 1. equipment checklist and standard kit contents, nsw health equipment checklist ☐ field kit backpack. contents should be personalised to individual staff. standard kit contents can be viewed in the table below ☐ swabs (number of swabs required will depend on number of pa�ents) ☐ pathology request forms ☐ nsw health id (and human biosecurity officer id, if required) ☐ paperwork (e.g. public health orders, revoca�on le�ers) ☐ mobile phone (pheoc phones are available) ☐ fleet car satchel & keys and/or cab charges ☐ laptop and charger (if required. all staff should ensure their laptops are set up to work remotely before being deployed on fieldwork.) ☐ sim card for laptop if required item quan�ty swabs varies sample collec�on bags varies pathology request forms varies thermometer 1 thermometer covers 200 (1 box) spare ba�eries 4 (aa) hand sani�zer 375 ml 1 hand sani�zer 60 ml 3 surgical mask 1 box (50 units) p2 mask 5 safety spectacles 2 face shield 3 gown 5 gloves (small) 12 (6 pairs) gloves (medium) 12 (6 pairs) gloves (large) 12 (6 pairs) alcohol wipes 1 canister clinnell wipes 1 packet yellow waste bags 5 wpsar vol 13, no 2, 2022 | doi: 10.5365/wpsar.2022.13.2.871 https://ojs.wpro.who.int/4 govindasamy et allessons from fieldwork for covid-19 close contacts, as per national guidelines.1 a risk assessment determined that the likelihood of exposure was relatively low; however, the potential consequences – specifically, further transmission to colleagues in the pheoc – were considered severe. this experience catalysed the prioritization of systematic preparation to reduce the risk of such exposures. anecdotally, a revised protocol that strengthened systematic preparation (e.g. by including checklists of key ppe required) helped to make fieldwork staff feel safer during their deployments. we recommend the routine inclusion of briefings before and after fieldwork as a way to support fieldwork staff. our recommended approach is for a senior public health practitioner to be dedicated to supporting the field develop collaborative relationships that were especially important during prolonged outbreak responses. this was in addition to supporting the investigation of outbreak sources; training, assessment and monitoring of ipc measures; and identification of further cases through collection of sars-cov-2 samples and review of clinical records. onsite deployment of public health fieldwork staff can support residential aged-care facility staff and can expedite outbreak investigation and implementation of effective control measures. fieldwork can pose challenges for the safety of public health staff. during the covid-19 pandemic in nsw, identification of potential exposures to sars-cov-2 required fieldwork staff to self-isolate as fig. 2. checklist of key actions to support fieldwork deployment, nsw health action owner prior to field departure or 1–3 days before fieldwork ☐ conduct risk assessment of fieldwork in consultation with relevant staff members operations ☐ identify authorised medical practitioners or clinical staff to undertake fieldwork operations ☐ identify administrative support staff to undertake fieldwork operations ☐ collate relevant correspondence and calls made to stakeholders for briefing operations ☐ organise briefing with field staff, pheoc deputy controller or delegate, pheoc logistics, legal branch operations prior to field departure or 1 day before fieldwork ☐ prepare the field box to ensure adequate supply of equipment and batteries are working logistics ☐ ensure paperwork is prepared operations, supported by logistics where needed ☐ supply food and water to field staff if practicable logistics ☐ identify a suitable parking area at the location logistics ☐ inform the fieldwork team about location to pick up fleet car keys logistics morning of fieldwork ☐ brief all stakeholders at the location regarding the role of the field staff (e.g. nsw police, hotel staff, healthcare australia medical staff, etc.) operations ☐ identify phoec legal and phoec logistics points of contact operations/logistics on returning from fieldwork ☐ work with logistics team to ensure field kits are restocked field staff/logistics ☐ ensure vehicle (if used) is refilled with petrol as per loan/pool car instructions field staff on day after fieldwork ☐ complete debrief summary and submit to operations team leader field staff ☐ debrief with the operations team leader and/or phoec deputy controller or delegate field staff/logistics wpsar vol 13, no 2, 2022 | doi: 10.5365/wpsar.2022.13.2.871https://ojs.wpro.who.int/ 5 lessons from fieldwork for covid-19govindasamy et al fig. 3. post-fieldwork debrief form, nsw health 1. date and loca�on of site visit: 2. name and role of phoec field team member: 3. purpose of visit: 4. do you feel you were sufficiently briefed and prepared for the visit? ☐ yes ☐ no if no, please specify why: 5. please iden�fy and describe aspects of the visit that went well: 6. please iden�fy and describe aspects of the visit that did not go well (if any): 7. do you have any comments regarding areas of improvement for future site visits? 8. did any incidents occur that may reflect nega�vely on field team staff or future opera�ons? ☐ yes ☐ no if yes, please summarise: 9. did any incidents occur that may reflect posi�vely on field team staff or future opera�ons? ☐ yes ☐ no if yes, please summarise: we recognise some staff, being in unfamiliar situa�ons, may some�mes experience unexpected and delayed reac�ons. please note that support is available through eap [employment assistance programme] or your manager. wpsar vol 13, no 2, 2022 | doi: 10.5365/wpsar.2022.13.2.871 https://ojs.wpro.who.int/6 govindasamy et allessons from fieldwork for covid-19 in case of unexpected requirements for clinical sampling of potential cases or other clinical needs. factors to consider when composing the team include individual scope of practice of team members, and professional and organizational liability for public health decisions, including implementing public health orders and providing clinical care in the field setting. in an ideal setting, there would be physical separation of fieldwork staff from other staff in the workplace, to minimize risk of workplace transmission. however, in practice, the scarcity of public health personnel may preclude ongoing separation. nonetheless, remote work and rostering arrangements could be optimized to reduce the exposure of other public health staff during the incubation period immediately following potential exposure from fieldwork. where this cannot be achieved, it becomes imperative for fieldwork staff to be supported to immediately openly disclose any potential exposures incurred during fieldwork or the evolution of subsequent symptoms. to ensure there are no incentives to avoid open disclosure, we recommend establishing organizational processes, such as access to appropriate paid leave arrangements and support to manage self-isolation. for example, nsw health, alongside other australian jurisdictions, has made alternative accommodation options available to support health-care workers who are required to self-isolate, to reduce the risk of household transmission.9,10 discussion there are currently no publications exploring the benefits and challenges of public health fieldwork and optimal processes for such fieldwork. the nsw health experience highlighted that fieldwork is a crucial component of effective public health responses during the covid-19 pandemic; we are therefore sharing our learnings from fieldwork in pandemic settings. we believe the principles and approach described in the protocol can be readily adapted, implemented and scaled to support fieldwork in response to other outbreaks, including future emerging infectious diseases. these approaches may also be applicable across a wide range of resource and health system contexts. we recognise that in low-resource contexts, safely conducting fieldwork can be especially challenging but it remains crucial, particularly to prevent transmission among limited staff. an important risk mitigation strategy team and facilitating briefings and debriefs. a briefing is an opportunity to convene the fieldwork and support teams; clarify roles, objectives and responsibilities; and confirm risk assessment and mitigation strategies. clear lines of communication were established for fieldwork staff to escalate concerns and obtain decision-making support during deployment. in facilitating the debrief, it is important to create space for open disclosures of challenges encountered, so that learnings from each field visit can be incorporated into institutional knowledge. before the development of the protocol, debrief sessions were (perhaps appropriately) a low priority in the context of an ongoing emergency response. however, after implementing the protocol, debrief sessions became routine and normalized, which facilitated further improvements to staff experience, protocol development, and the reporting of adverse experiences and events. in our view, maintaining the safety of team members must be the primary priority during fieldwork. ipc, onsite risk assessments and requisite modification of activities should be undertaken immediately before and during the field visit to reduce the risk of exposures. ppe should be considered a last line of defence, as a mental prompt for fieldwork staff to first consider other measures to reduce risk (e.g. videoconferencing, using tools such as maps of facilities or risk management matrices, physical distancing and referring sample collection to experienced clinical staff). where there is a need for ppe, fieldwork staff require comprehensive training in the use of ppe well in advance of a proposed field visit. this training should incorporate best practice techniques and pragmatic approaches (e.g. recognizing and appropriately managing ppe breaches). public health decisions for covid-19 generated highly emotive community responses and close media interest, particularly where isolation or travel restrictions were required. we therefore recommend deploying fieldwork staff in teams of at least two for safety and security reasons. pairs of staff can also support identification of ppe breaches and supervise donning and doffing of ppe for each other. we suggest that teams include senior public health practitioners where possible. senior staff can provide important training and support for junior or surge staff, and their experience can facilitate attainment of fieldwork goals. although multidisciplinary public health practitioners can effectively undertake fieldwork, we recommend inclusion of at least one clinical team member wpsar vol 13, no 2, 2022 | doi: 10.5365/wpsar.2022.13.2.871https://ojs.wpro.who.int/ 7 lessons from fieldwork for covid-19govindasamy et al and control efforts, both with covid-19 and other outbreaks. to receive a copy of the protocol, please contact the corresponding author. acknowledgements the authors acknowledge the indefatigable efforts of colleagues in the nsw health ministry of health public health response branch and public health units in the covid-19 response. we particularly acknowledge members of the operations, logistics and planning teams for their work planning, coordinating and undertaking fieldwork for covid-19. conflicts of interest the authors have no conflicts of interest to declare. ethics statement formal ethical approval was not sought as research was not undertaken. fieldwork activities undertaken and described in this paper were part of the emergency public health response under the public health act of nsw, under the delegation of the chief health officer. approval and permission to publish was received through the nsw ministry of health before submission for publication. funding this paper was prepared while authors were employed by nsw health. no specific funding was received to support this work. references 1. communicable diseases network australia. coronavirus disease 2019 (covid-19) cdna national guidelines for public health units. canberra: australian government; 2020. available from: https:// www1.health.gov.au/internet/main/publishing.nsf/content/cdnasong-novel-coronavirus.htm, accessed 25 january 2021. 2. wiersinga wj, rhodes a, cheng ac, peacock sj, prescott hc. pathophysiology, transmission, diagnosis, and treatment of coronavirus disease 2019 (covid-19): a review. jama. 2020;324(8):782– 93. doi:10.1001/jama.2020.12839 pmid:32648899 3. hope k, massey pd, osbourn m, durrheim dn, kewley cd, turner c. senior clinical nurses effectively contribute to the pandemic influenza public health response. australian journal of advanced nursing. 2011;28(3):47. is implementation of ipc measures, including appropriate use of recommended ppe. the global impacts of the covid-19 pandemic have caused significant shortages of ppe, requiring rational use and prioritization.11 however, training in ppe by ipc experts can support judicious and effective use of limited supplies. where possible, we recommend the deployment of senior public health staff whose experience and authority can contribute to effective fieldwork. however, such experienced staff are themselves limited resources in a pandemic context, and ensuring their safety and capacity to continue contributing to the broader pandemic response is essential. it is imperative that health authorities ensure effective risk management of fieldwork, and that fieldwork is considered a part of workplace obligations. we encourage public health practitioners in low-resource contexts to consider the principles discussed in this paper when developing context-specific fieldwork protocols. it is also important to acknowledge the potential impact on staff well-being following fieldwork and especially following occupational exposure. in the early period of the pandemic response, the complications and risks of covid-19 were poorly understood, causing substantial anxiety among health-care workers, particularly regarding the risk of transmission to their families.12 fieldwork may itself involve challenging stakeholder management and other stressors, after which staff may experience a delayed psychological response; hence, they should be supported to obtain formal assistance as required. before fieldwork deployment, managers should consider whether staff have pre-existing medical conditions that may make them more vulnerable to severe illness and, if so, make provisions to mitigate risks. conclusion deploying public health staff to conduct fieldwork in various outbreak settings is an important aspect of the nsw public health response during the covid-19 pandemic. our experience and lessons learned in developing a protocol for effectively equipping staff with the skills, knowledge and expertise to perform fieldwork safely may assist other jurisdictions in their public health response wpsar vol 13, no 2, 2022 | doi: 10.5365/wpsar.2022.13.2.871 https://ojs.wpro.who.int/8 govindasamy et allessons from fieldwork for covid-19 9. $100m support for health workers to fight covid-19. sydney: nsw government; 2020. available from: https://www.nsw.gov.au/media-releases/100m-support-for-health-workers-to-fight-covid-19, accessed 25 january 2021. 10. help and support for healthcare workers – coronavirus (covid-19). melbourne: department of health and human services; 2020. available from: https://www.dhhs.vic.gov.au/helpand-support-healthcare-workers-coronavirus-covid-19, accessed 25 january 2021. 11. rational use of personal protective equipment (ppe) for coronavirus disease (covid-19): interim guidance, 19 march 2020. geneva: world health organization; 2020. available from: https://apps.who. int/iris/handle/10665/331498, accessed 25 january 2021. 12. shanafelt t, ripp j, trockel m. understanding and addressing sources of anxiety among health care professionals during the covid-19 pandemic. jama. 2020;323(21):2133–4. doi:10.1001/ jama.2020.5893 pmid:32259193 4. clinical excellence commission. covid-19 infection prevention and control. sydney: nsw government; 2020. available from: http:// www.cec.health.nsw.gov.au/keep-patients-safe/covid-19/personal-protective-equipment, accessed 25 january 2021. 5. barratt r, shaban rz, gilbert gl. characteristics of personal protective equipment training programs in australia and new zealand hospitals: a survey. infect dis health. 2020;25(4):253–61. doi:10.1016/j.idh.2020.05.005 pmid:32600965 6. ethical considerations in developing a public health response to pandemic influenza. geneva: world health organization; 2007. available from: https://apps.who.int/iris/handle/10665/70006, accessed 25 january 2021. 7. risk management – enterprise-wide risk management policy and framework – nsw health. sydney: nsw government; 2015. available from: https://www1.health.nsw.gov.au/pds/activepdsdocuments/pd2015_043.pdf, accessed 25 january 2021. 8. infection prevention and control during health care when covid-19 is suspected. geneva: world health organization; 2020. available from: https://www.who.int/publications/i/item/10665–331495, accessed 25 january 2021. https://ojs.wpro.who.int/ 1wpsar vol 13, no 4, 2022 | doi: 10.5365/wpsar.2022.13.4.987 regional analysis a vian influenza (ai) viruses are zoonotic but occasionally infect humans through direct or indirect contact with infected animals. in humans, infection ranges from mild to severe illness and death. wild and domestic birds (poultry and captive birds) and other mammalian species play an important role in the emergence, evolution and transmission of different ai subtypes a(hxny) to humans. the hxny subtypes are classified based on the 18 subtypes of haemagglutinin (h1 through h18) and the 11 subtypes of neuraminidase (n1 through n11) on the viral surface.1,2 in the western pacific region (wpr) of the world health organization (who), the strengthening of surveillance systems to identify human infections with ai, along with a coordinated, multisectoral approach under the one health initiative, have been priorities for many years. these actions have been guided by the asia pacific strategy for emerging diseases and public health emergencies (apsed iii).3 global reporting mechanisms are well established to share information on a(hxny) and guide risk assessment. human a(hxny) cases are notifiable under the international health regulations (ihr 2005)4 and animal cases are notifiable to the world organisation for animal health under the terrestrial animal health code.5 in 2018, we published a report of notifications of a(hxny) human cases in the wpr between 1 november 2003 and 30 september 2017.6 of the 1838 human infections with a(hxny) in this report, most were with a(h7n9) (n = 1562, 85%) and a(h5n1) (n = 238, 13%), followed by a(h9n2) (n = 18, 1%) and a(h5n6) (n = 16, 1%).6 this current report provides an update on human cases of a(hxny) notified from 1 november 2003 to 31 july 2022. a world health organization regional office for the western pacific, manila, philippines. b world health organization representative office for china, beijing, people’s republic of china. c world health organization representative office for lao pdr, vientiane, lao people’s democratic republic. d world health organization representative office for cambodia, phnom penh, cambodia. published: 19 december 2022 doi: 10.5365/wpsar.2022.13.4.987 avian influenza subtype a(hxny) viruses are zoonotic and may occasionally infect humans through direct or indirect contact, resulting in mild to severe illness and death. member states in the western pacific region (wpr) communicate and notify the world health organization of any human cases of a(hxny) through the international health regulations (ihr 2005) mechanism. this report includes all notifications in the wpr with illness onset dates from 1 november 2003 to 31 july 2022. during this period, there were 1972 human infections with nine different a(hxny) subtypes notified in the wpr. since the last report, an additional 134 human avian influenza infections were notified from 1 october 2017 to 31 july 2022. in recent years there has been a change in the primary subtypes and frequency of reports of human a(hxny) in the region, with a reduction of a(h7n9) and a(h5n1), and conversely an increase of a(h5n6) and a(h9n2). furthermore, three new subtypes a(h7n4), a(h10n3) and a(h3n8) notified from the people’s republic of china were the first ever recorded globally. the public health risk from known a(hxny) viruses remains low as there is no evidence of person-to-person transmission. however, the observed changes in a(hxny) trends reinforce the need for effective and rapid identification to mitigate the threat of a pandemic from avian influenza if person-to-person transmission were to occur. an epidemiological overview of human infections with hxny avian influenza in the western pacific region, 2003–2022 jozica skufca,a leila bell,a j c pal molino,a dina saulo,a chin-kei lee,b satoko otsu,c kim carmela co,c may chiew,c phetdavanh leuangvilay,c sarika patel,d asheena khalakdina,d vanra ieng,d tamano matsui,a babatunde olowokurea and the wpro health emergencies programme teama correspondence to tamano matsui (email: matsuit@who.int) wpsar vol 13, no 4, 2022 | doi: 10.5365/wpsar.2022.13.4.987 https://ojs.wpro.who.int/2 skufca et alhuman infections with hxny avian influenza in the western pacific region the time of notification for a case fatality rate (cfr) of 41%. most (74 cases, 93%) were exposed to wild birds or backyard poultry prior to illness onset (table 1). the number of cases varied from two to nine per year during 2014–2020, but then increased to 37 cases in 2021. up to the end of july 2022, 14 cases were observed (fig. 1). all but one of the cases (99%) were notified from china, across 15 different provinces. cases were reported from anhui (n = 2), beijing (n = 1), chongqing (n = 3), fujian (n = 2), guangdong (n = 14), guangxi (n = 18), guizhou (n = 1), henan (n = 1), hubei (n = 1), hunan (n = 13), jiangsu (n = 5), jiangxi (n = 2), sichuan (n = 12), yunnan (n = 2) and zhejiang (n = 2). in march 2021, the lao people’s democratic republic notified the western pacific regional office of a(h5n6) virus infection in a child identified through sentinel surveillance. human infection with a(h9n2) virus since the last report, an additional 59 a(h9n2) cases have been notified to who from the wpr (57 from china and two from cambodia). between 2015, when the first a(h9n2) human case was notified to who, and 31 july 2022, 77 laboratory-confirmed cases (including two deaths, cfr: 3%), were notified from the wpr. there were no family clusters reported, although most cases were children. of the total cases (n = 77), 27 (35%) were males. ages ranged from <1 to 39 years (median 3 years) in males and from <1 to 78 years (median 5 years) in females. overall, 71 (92%) were mild infections and 58 (75%) were exposed to bird markets or backyard poultry prior to illness onset (table 1). the number of cases observed varied from four to seven per year during 2015–2019, and increased to 16 cases in 2020, 25 cases in 2021 and eight cases up to the end of july in 2022 (fig. 1). of the total cases, 75 (97%) were notified from china, across 16 different provinces including one from china hong kong special administrative region (sar). cases were reported from anhui (n = 9), beijing (n = 2), fujian (n = 4), gansu (n = 1), guangdong (n = 18), guangxi (n = 3), guizhou (n = 5), henan (n = 2), hubei (n = 5), hunan (n = 11), jiangsu (n = 3), jiangxi (n = 2), shandong (n = 1), shanxi (n = 1), sichuan (n = 5), yunnan (n = 2) and hong kong sar (n = 1). two cases were notified from cambodia in methods human infections with a(hxny) are commonly detected via sentinel surveillance systems, such as influenza-like illness, severe acute respiratory infection, and pneumonia with unknown etiology surveillance or through hospitalbased surveillance. member states of the wpr communicate and notify a(hxny) human cases through the ihr (2005) mechanism to who. the who western pacific regional office has maintained a database of all official notifications of a(hxny) human cases since 2003. this analysis includes all notifications in the wpr with illness onset dates from 1 november 2003 to 31 july 2022. data on human infections with a(hxny) subtypes were summarized by person, place and time and compared with results from the previous report. data were analysed and figures were generated using microsoft excel. results from 1 november 2003 to 31 july 2022, there were 1972 human infections with nine different a(hxny) subtypes notified to who from the wpr. since the last report,6 134 additional human ai infections were notified from 1 october 2017 to 31 july 2022, including three new subtypes notified globally for the first time. in the previous report, human cases with a(h5n1) and a(h7n9) were the predominant subtypes, but the majority of newly notified cases in this report were a(h5n6) (n = 64, 400% increase) and a(h9n2) (n = 59, 328% increase) (table 1, fig. 1). human infection with a(h5n6) virus since the last report, an additional 64 a(h5n6) cases were reported from the wpr – 63 from the people’s republic of china and one from the lao people’s democratic republic. from 2014, when the first a(h5n6) human case was notified, to 31 july 2022, 80 laboratoryconfirmed cases were reported from the wpr. in 2021, a small cluster of two cases was reported in a husband and wife. of the 80 cases, 44 (55%) were males with ages ranging from 3 to 79 years (median 51 years) and 36 (45%) were females with ages ranging from 1 to 81 years (median 47 years). overall, 44 (55%) were severe infections and 33 were reported to have died at wpsar vol 13, no 4, 2022 | doi: 10.5365/wpsar.2022.13.4.987https://ojs.wpro.who.int/ 3 human infections with hxny avian influenza in the western pacific regionskufca et al table 1. demographic, geographic and temporal characteristics of avian influenza virus subtypes notified from the western pacific region, 1 november 2003–31 july 2022 characteristic influenza a virus subtype h5n1 h7n9 h5n6 h9n2 h10n8 h6n1 h7n4 h10n3 h3n8 new cases notified since last report6: from 1 october 2017 to 31 july 2022 new cases, n (% increase) 1 (<1%) 6 (<1%) 64 (400%) 59 (328%) 0 (0%) 0 (0%) 1 (100%) 1 (100%) 2 (100%) total cases notified: from 1 november 2003 to 31 july 2022 total cases, n 239 1568 80 77 3 1 1 1 2 sex male 119 (50%) 1096 (70%) 44 (55%) 27 (35%) 1 (33%) 0 0 1 (100%) 2 (100%) female 120 (50%) 472 (30%) 36 (45%) 50 (65%) 2 (67%) 1 (100%) 1 (100%) 0 0 age, median years (range) 20 (<1–81) 57 (0–91) 50 (1–81) 5 (<1–78) 73 (55–75) 20 68 41 4.5 (4–5) male 23 (<1–81) 58 (1–91) 51 (3–79) 3 (<1–39) 75 nd nd 41 4.5 (4–5) female 18 (<1–75) 56 (0–85) 47 (1–81) 5 (<1–78) 55, 73 20 68 nd nd severity unknown nd 142 (9%) 0 1 (1%) 0 0 0 0 0 mild/stable nd 89 (6%) 3 (4%) 71 (93%) 0 0 0 0 1 (50%) severe nd 721 (46%) 44 (55%) 3 (4%) 3 (100%) 1 (100%) 1 (100%) 1 (100%) 1 (50%) deaths, n (cfr %) 134 (56%) 616 (39%) 33 (41%) 2 (3%) 2 (67%) 0 0 0 0 deaths median age (range), years 19 (<1–69) 60 (3–91) 48 (3–81) 48 (39–57) 74 (73–75) nd nd nd nd exposure to poultry/wild birds yes 146 (61%) 741 (47%) 74 (92%) 58 (75%) 3 (100%) 0 1 (100%) 0 2 (100%) no 7 (3%) 34 (2%) 3 (4%) 10 (13%) 0 1 (100%) 0 1 (100%) 0 unknown 86 (36%) 793 (51%) 3 (4%) 9 (12%) 0 0 0 0 0 countries (% of all cases reported) cambodia (n = 56, 23%), china (n = 53, 22%), lao pdr (n = 3, 1%), viet nam (n = 127, 53%) china (n = 1565, 99.8%), cases with travel to china from canada (n = 2), malaysia (n = 1) china (n = 79, 99%), lao pdr (n = 1, 1%) china including china, hong kong sar (n = 75, 97%), cambodia (n = 2, 3%) china (n = 3, 100%) china (n = 1, 100%) china (n = 1, 100%) china (n = 1, 100%) china (n = 2, 100%) last reported to who 31 october 2020 5 april 2019 13 june 2022 24 june 2022 13 february 2014 may 2013 14 february 2018 31 may 2021 17 may 2022 china: people’s republic of china; cfr: case fatality rate; nd: not determined; pdr: people’s democratic republic; sar: special administrative region; who: world health organization. and two cases of a(h3n8), respectively. all cases recovered after being hospitalized and no close contacts of the cases developed illness. the case of a(h7n4) was a 68-year-old woman with reported comorbidities and a history of exposure to live poultry prior to becoming ill. the case of a(h10n3) was a 41-year-old male with no clear history of exposure to poultry prior to illness onset. a(h10n3) was not detected in environmental samples or poultry within the locality of march 2021 and march 2022, both of which were in children (a 13-month-old girl and a 3-year-old boy) from siem reap province with mild symptoms. human infection with new a(h7n4), a(h10n3) and a(h3n8) the three different ai subtypes documented for the first time globally were from china in 2018, 2021 and 2022 comprising one case of a(h7n4), one case of a(h10n3) wpsar vol 13, no 4, 2022 | doi: 10.5365/wpsar.2022.13.4.987 https://ojs.wpro.who.int/4 skufca et alhuman infections with hxny avian influenza in the western pacific region be an indicator of strong detection, surveillance, case reporting and effective cooperation between different sectors in china. this is exemplified by the decrease in the number of human cases of a(h7n9) since 2018 owing to the united and collaborative response of multiple relevant stakeholders following a one health approach.7 similarly, cambodia11 and the lao people’s democratic republic12 demonstrated strong joint one health investigation and collaboration to control the a(h9n2) and a(h5n6) human cases detected in 2021, respectively. while human infections with a(h9n2) have mostly caused mild clinical disease and have been mostly among children (median age of 5 years), a(h5n6) can generally be more severe. however, although an increase of a(h5n6) cases was observed in 2021, the disease course and cfrs were comparable to previously detected a(h5n6) cases. in 2021, four newly detected h5n6 genotypes were the major causes of increased a(h5n6) infections.13 the observed increase may reflect the spread of this virus in poultry, which is enzootic and circulates in poultry and birds in the region.14 surveillance of live poultry markets in china the case. one case of a(h3n8) was a 4-year-old boy with exposure to live backyard chickens prior to illness onset and the other case was a 5-year-old boy with exposure to a live poultry market (table 1). discussion in recent years, there has been a change in the primary subtypes and frequency of reports of human a(hxny) in the wpr, with a reduction of a(h7n9) and a(h5n1), and an increase of a(h5n6) and a(h9n2). furthermore, new subtypes a(h7n4), a(h10n3) and a(h3n8) were reported from china. the majority of cases and new a(hxny) subtypes in the wpr were reported from china. this is likely due to several factors, including the fact that it is the world’s largest agricultural country; has an extensive human–animal interface with about 30% of the poultry raised in backyard conditions; and that live poultry markets common in china play a major part in sustaining influenza viruses as well as allowing for new reassortments of a(hxny).7–10 however, it could also fig. 1. cases of human infection with avian influenza subtypes a(h5n1), a(h5n6), a(h9n2) and a(h7n9) notified to who from the western pacific region, 1 november 2003–31 july 2022 0 0 0 0 0 0 0 0 0 0 0 0 0 0 0 0 0 0 0 0 0 0 0 0 0 0 0 0 0 0 0 0 0 0 0 0 0 0 0 0 0 100 200 300 400 500 600 700 0 5 10 15 20 25 30 35 40 45 50 55 60 65 70 75 80 2003 2004 2005 2006 2007 2008 2009 2010 2011 2012 2013 2014 2015 2016 2017 2018 2019 2020 2021 2022* n um be r o f ca se s a( h 7n 9) n um be r o f ca se s a( h 5n 1) , a (h 5n 6) , a (h 9n 2) onset of illness (year) (*until 31 july 2022) human infections with avian influenza a(h5n1), a(h5n6), a(h9n2) and a(h7n9) reported from the western pacific region, nov 2003 july 2022 h5n1 h5n6 h9n2 h7n9 n u m b er o f ca se s of a (h 5 n 1 ), a (h 5 n 6 ), a (h 9 n 2 ) n u m b er o f ca se s of a (h 7 n 9 ) wpsar vol 13, no 4, 2022 | doi: 10.5365/wpsar.2022.13.4.987https://ojs.wpro.who.int/ 5 human infections with hxny avian influenza in the western pacific regionskufca et al dures.19 these two sporadic cases were not unexpected since the circulation of ai viruses in poultry increases the risk of sporadic human infections, especially for those with occupational exposure. the first human cases of a(h5n8) were documented in seven workers who were involved in culling operations in a poultry outbreak in the russian federation in 2020.20 there are several limitations in the interpretation of these results as they are based on ihr (2005) notifications. first, the estimated cfrs for a(hxny) should be interpreted with caution since these are calculated from the last update of notifications without any follow-up of severe cases that may have subsequently died. given the lack of updated case information, the true number of deaths may also be skewed. second, the capacity to detect a(hxny) evolved during the covid-19 pandemic when influenza surveillance systems were strengthened with changes in the sources of case detection such as through influenza-like illness surveillance. this detection capacity may vary by geographical location due to differences in surveillance systems. in addition, official notification of cases may be underreported, particularly for subclinical infections. a seroprevalence study conducted in cambodia among poultry workers found an overall prevalence of 4.5% and 1.8% for antibodies against a(h5n1) and a(h9n2), respectively. hence, the true burden of infection is likely higher than that observed.21 despite these limitations, reporting as outlined in the ihr (2005) continues to provide important information about human cases of a(hxny) in the wpr and globally. it enables member states to understand the epidemiological situation of human ai cases, assess the risks and take preventive public health actions. in conclusion, the overall public health risk from known a(hxny) viruses at the human–animal interface remains low as infections have been almost exclusively associated with contact with infected birds, with no evidence of person-to-person transmission. however, the observed changes in a(hxny) trends reinforce the need for early detection and strengthening of human and animal surveillance to detect virological, epidemiological and clinical changes associated with circulating a(hxny). accordingly, continued multi-sectoral collaboration at the human–animal interface is needed for effective mitigation of the pandemic threat of ai. from 2014 to 2016 revealed that a(h5n6) replaced a(h5n1) as the dominant subtype in southern china, especially in ducks.15 additional mammal-adapted mutations were also detected, indicating the viral adaptation process from birds to humans.13 however, although human a(h5n6) cases were reported from china from december 2021 to march 2022, no poultry/ bird outbreaks of a(h5n6) were notified to the world organisation for animal health, which may suggest an underreporting of poultry outbreaks.2 the increase in reported human cases of a(h5n6) may also be due to enhanced diagnostic capacity for respiratory disease surveillance during the covid-19 pandemic in the context of generally increased awareness of respiratory illness across the public health system.14,16 while in china the majority of a(h5n6) cases were reported through pneumonia surveillance systems and identified by chinese national influenza surveillance network laboratories, 15 cases in 2020 and 2021 were first identified through third-party sequencing agencies that then reported to the chinese national influenza surveillance network laboratories for confirmation. more than one third of cases in 2021 were detected by hospitals that sent samples from patients with pneumonia to these third-party sequencing agencies.13 since our last report, notifications of a(h5n1) infections have remained low despite enhanced surveillance, detection, awareness and reporting following the covid-19 pandemic. this may indicate a true decline in a(h5n1) not biased by changes in surveillance. the a(h5n1) viruses detected during late 2021 and 2022 are different from earlier h5n1 bird flu viruses. current viruses are not spreading easily among poultry, are infecting people less easily, and may be less of a risk and cause less severe illness among humans.17 in addition to the three new strains reported from china for the first time globally, the first two human cases of a(h5n1) were reported from europe and the americas in 2022. in january 2022, the first human a(h5n1) case was reported in the united kingdom of great britain and northern ireland in a person who kept birds domestically.18 at the beginning of may 2022, the first a(h5n1) case in the united states of america was reported in a person involved in bird-culling procewpsar vol 13, no 4, 2022 | doi: 10.5365/wpsar.2022.13.4.987 https://ojs.wpro.who.int/6 skufca et alhuman infections with hxny avian influenza in the western pacific region 7. zheng z, lu y, short kr, lu j. one health insights to prevent the next hxny viral outbreak: learning form the epidemiology of h7n9. bmc infect dis. 2019;19(1):138. doi:10.1186/s12879-019-37526 pmid:30744562 8. gao gf. influenza and the live poultry trade. science. 2014;344(6181):235. doi:10.1126/science.1254664 pmid:24744345 9. lam tt, zhou b, wang j, chai y, shen y, chen x, et al. dissemination, divergence and establishment of h7n9 influenze viruses in china. nature. 2015;522(7554):102–5. doi:10.1038/nature14348 pmid:25762140 10. liao q, wu p, lam ww, fang vj, wu jt, leung gm, et al. public risk perception and attitudes towards live poultry markets before and after their closure due to influenza a(h7n9), hong kong, january–february 2014. j public health (oxf). 2016;38(1):34–43. doi:10.1093/pubmed/fdv020 pmid:25717043 11. um s, siegers jy, sar b, chin s, patel s, bunnary s, et al. human infection with avian influenza a(h9n2) virus, cambodia, february 2021. emerg infect dis. 2021;27(10):2742–5. doi:10.3201/ eid2710.211039 pmid:34546164 12. sengkeopraseuth b, co kc, leuangvilay p, mott ja, khomgsamphanh b, somoulay v, et al. first human infection of avian influenza a(h5n6) virus reported in lao people’s democratic republic, february–march 2021. influenza other respir viruses. 2022;16(2):181–5. doi:10.1111/irv.12934 pmid:34761535 13. zhu w, li x, dong j, bo h, liu j, yang j, et al. epidemiologic, clinical, and genetic characteristics of human infections with influenza a(h5n6) viruses, china. emerg infect dis. 2022;28(7):1332–44. doi:10.3201/eid2807.212482 pmid:35476714 14. influenza at the human–animal interface: summary and assessment, from 2 march to 7 april 2022. geneva: world health organization; 2022. available from: https://cdn.who.int/media/docs/ default-source/influenza/human-animal-interface-risk-assessments/ influenza-at-the-human-animal-interface-summary-and-assessment--from-2-march-to-7-april-2022.pdf?sfvrsn=735de0c5_1&do wnload=true, accessed 19 august 2022. 15. bi y, chen q, wang q, chen j, jin t, wong g, et al. genesis, evolution and prevalence of h5n6 avian influenza viruses in china. cell host microbe. 2016;20(6):810–21. doi:10.1016/j. chom.2016.10.022 pmid:27916476 16. wille m, barr ig. resurgence of avian influenza virus. science. 2022;376(6592):459–60. doi:10.1126/science.abo1232 pmid:35471045 17. march 7, 2022 update: h5n1 bird flu poses low risk to the public. atlanta, ga: u.s. centers for disease control and prevention; 2022. available from: https://www.cdc.gov/flu/avianflu/spotlights/2021-2022/ h5n1-low-risk-public.htm, accessed 19 august 2022. 18. influenza a (h5) – united kingdom of great britain and northern ireland. geneva: world health organization; 2022. available from: https://www.who.int/emergencies/disease-outbreak-news/item/ influenza-a-(h5)---united-kingdom-of-great-britain-and-northernireland, accessed 19 august 2022. 19. avian influenza a (h5n1) – united states of america. geneva: world health organization; 2022. available from: https://www. who.int/emergencies/disease-outbreak-news/item/2022-e000111, accessed 19 august 2022. 20. human infection with avian influenza a (h5n8) – russian federation. geneva: world health organization; 2021. available from: https://www.who.int/emergencies/disease-outbreak-news/item/2021don313, accessed 19 august 2022. 21. horm sv, tarantola a, rith s, ly s, gambaretti j, duong v, et al. intense circulation of a/h5n1 and other avian influenza viruses in cambodian live-bird markets with serological evidence of subclinical human infections. emerg microbes infect. 2016;5(7):e70. doi:10.1038/emi.2016.69 pmid:27436362 acknowledgements we would like to thank member states of the who western pacific region for reporting and sharing information on human infections with avian influenza viruses. we acknowledge the tireless efforts of the people who have been part of the who regional office for the western pacific and the health emergencies programme since 2003. we also thank the surveillance officers of the health emergency information team and the risk assessment team for their ongoing support in maintaining regional databases on human a(hxny) cases. conflicts of interest the authors have no conflicts of interest to declare. ethics statement ethical approval was not necessary for this study. funding none. references 1. liu wj, wu y, bi y, shi w, wang d, shi y, et al. emerging hxny influenza a viruses. cold spring harb perspect med. 2022;12(2):a038406. doi:10.1101/cshperspect.a038406 pmid:32928891 2. european food safety authority, european centre for disease prevention and control, european union reference laboratory for avian influenza, adlhoch c, fusaro a, gonzales jl, et al. avian influenza overview december 2021 – march 2022. efsa j. 2022;20(4):e07289. doi:10.2903/j.efsa.2022.7289 pmid:35386927 3. asia pacific strategy for emerging diseases and public health emergencies (apsed iii) : advancing implementation of the international health regulations (2005) : working together towards health security. manila: who regional office for the western pacific; 2017. available from: https://apps.who.int/iris/handle/10665/259094, accessed 19 august 2022. 4. international health regulations (2005), 3rd ed. geneva: world health organization; 2016. available from: https://apps.who.int/ iris/handle/10665/246107, accessed 19 august 2022. 5. terrestrial animal health code (2022). paris: world organisation for animal health; 2021. available from: https://www.woah.org/en/ what-we-do/standards/codes-and-manuals/terrestrial-code-onlineaccess/?id=169&l=1&htmfile=sommaire.htm, accessed 19 august 2022. 6. hamid s, arima y, dueger e, konings f, bell l, lee ck, et al. from h5n1 to hxny: an epidemiologic overview of human infections with avian influenza in the western pacific region, 2003–2017. western pac surveill response j. 2018;9(5 suppl 1):53–67. doi:10.3565/ wpsar.2018.9.2.001 pmid:31832254 https://ojs.wpro.who.int/ 1wpsar vol 13, no 2, 2022 | doi: 10.5365/wpsar.2022.13.2.902 original research v erbal autopsy (va) is a method developed by the world health organization (who) to determine the cause of death when medical certification is not available.1 death without medical certification usually happens at home, and the cause of death is determined by a police officer or the decedent’s caregiver. without medical attention, the cause is often given as “old age” – such an ill-defined cause of death does not provide useful information for mortality surveillance and leads to inaccurate population health assessment.2 in 2016, 47.2% of deaths registered in malaysia were nonmedically certified deaths (nmcds).3 reducing nmcds would strengthen mortality statistics and contribute to better health planning.4 malaysia incorporated va into the death registration system in 2017 to improve mortality data.5 va is conducted via a face-to-face interview between a trained health-care worker and the decedent’s caregiver. the interviewer uses a standardized va questionnaire to collect information on the events that led to the decedent’s death; the questionnaire is then sent to a physician for cause of death determination.6–8 since implementation of va, the number of nmcds reduced from 47.2% in 2016 to 37.2% in 2019.3,9 during the coronavirus disease 2019 (covid-19) pandemic, the face-to-face va process has been delayed due to the physical distancing preventive measures implemented.10 therefore, telephone interviews were trialled as a substitute for the standard face-to-face method because such interviews comply with the physical distancing measures of the ongoing covid-19 pandemic. additional benefits of a telephone interview include cost, a institute for public health, national institutes of health, ministry of health malaysia, selangor, malaysia. b sector for biostatistics & data repository, national institutes of health, ministry of health malaysia, selangor, malaysia. published: 30 june 2022 doi: 10.5365/wpsar.2022.13.2.902 objective: verbal autopsy (va) through face-to-face interviews with caregivers is a way to determine cause of death without medical certification. in malaysia, the use of va has improved mortality statistics. however, during the coronavirus disease 2019 (covid-19) pandemic, face-to-face interviews were delayed, reducing va data collection and affecting data for mortality surveillance. this study aims to investigate the feasibility and acceptability of conducting va interviews via telephone calls, and the quality of the data gathered. methods: the study was conducted in malaysia from september to october 2020 using a cross-sectional design. participants were health-care workers from established va teams across the country. they conducted va interviews via telephone and provided feedback through a customized online form. data collected from the form were used to assess the feasibility, acceptability and quality of the telephone interviews using ibm spss version 23. results: responses were received from 113 participants. there were 74 (65.5%) successful interviews, representing 91% of the 81 cases who were able to be contacted. more than two thirds of health-care workers provided positive feedback on the telephone interview method for themselves and the interviewees. only 10.8% of causes of death were unusable. discussion: this study provides preliminary evidence that va via telephone interview is feasible, acceptable and can be used as an alternative to face-to-face interviews without affecting data quality. during times when face-to-face interviews are not advisable, va telephone interviews can be used for data collection for mortality surveillance. conducting verbal autopsy by telephone interview during the pandemic to support mortality surveillance: a feasibility study in malaysia nur hamizah nasaruddin,a shubash shander ganapathy,a s. maria awaluddin,a mohamad fuad mohamad anuar,b nazirah binti alias,a chan yee manga and khaw wan-feia correspondence to nur hamizah nasaruddin (email: dr_nurhamizah@moh.gov.my, nurhamizah.nasaruddin@gmail.com) wpsar vol 13, no 2, 2022 | doi: 10.5365/wpsar.2022.13.2.902 https://ojs.wpro.who.int/2 nasaruddin et alverbal autopsy telephone interview in their district for cause of death determination as per the usual process. the determined cause of death was then sent to malaysia’s health informatics centre for data coding using the 10th revision of the international classification of diseases and related health problems (icd-10). the health-care workers then provided their feedback on the telephone interview process, and their perception of how the caregivers reacted to being interviewed via telephone, via an online form. the form was a structured questionnaire designed in collaboration with public health experts from the malaysian institute for public health and the disease control division, ministry of health malaysia, and with a who consultant with expertise in mortality statistics, va procedures and va formulation in malaysia. the questionnaire contained 53 items divided into five sections, which included the health-care worker’s characteristics, the deceased individual’s characteristics, the interview settings and outcomes, the caregiver’s characteristics and their reactions towards the telephone interview as perceived by the health-care worker, and the health-care worker’s own assessment of the telephone interview (see supplementary material). this form was subsequently translated into malay and made available online via google forms. consent from the health-care workers was obtained at the top of the online feedback form. consent from the caregivers was only sought for the va interview; it was obtained verbally and documented in the corresponding va questionnaire. further consent for the feasibility study was not warranted. data collection was conducted between september and october 2020, resulting in a recall period of 8–9 months. data collected from the va questionnaire were managed according to malaysia’s va guidelines and procedures by the corresponding healthcare workers. the data from the feedback form and the determined causes of death were compiled for analysis. variable definition and analysis feasibility the feasibility of the telephone interview was determined by the proportion of successful outcomes, defined as a complete va questionnaire and a cause of death determined. data from the va telephone interview feedback form were merged with the cause of death assigned by the physicians to determine the outcome. statistical time–effectiveness and physical anonymity, which may be appropriate given the sensitive nature of the interview questions.11 these benefits, plus any challenges of using telephone interviews and whether the telephone interview method affects the quality of the data obtained from the interview, need to be investigated before implementation. therefore, the aim of this study was to assess the feasibility, acceptability and data quality of the va interviews when conducted via telephone in malaysia in 2020. methods study design and sample selection an exploratory cross-sectional study was conducted to determine the feasibility, acceptability and data quality of performing va interviews via telephone. the participants for this study were health-care workers employed under malaysia’s ministry of health, who were members of the district health office va teams. the sampling frame for this study was deceased individuals who died between 1 and 31 january 2020 and who were on the list of va cases. this list was extracted from the nmcd registry, obtained from the disease control division of malaysia’s ministry of health. the list included the details of the deceased and the contact information of their principal caregivers. the va cases were randomly selected to include cases from both urban and rural areas from across malaysia. because this was a feasibility study, 100 va cases were selected. each va case was assigned to a health-care worker for a telephone-based va interview by the coordinator of the relevant district health office va team. the study team was not involved in the assignment of the va cases to the health-care worker and had no influence on the selection. the health-care workers were identified and approached to be included in the study only after a case had been assigned to them. survey process and survey instrument for each assigned case, the health-care worker contacted the corresponding caregiver and conducted the interview with that person by telephone instead of face-to-face. the va interview was completed according to malaysia’s va guidelines and procedures, using the standardized malaysian va questionnaire.6,7 the health-care worker did not meet the caregiver and only interacted through the telephone call. after the interview, the health-care worker submitted the collected information to a physician wpsar vol 13, no 2, 2022 | doi: 10.5365/wpsar.2022.13.2.902https://ojs.wpro.who.int/ 3 verbal autopsy telephone interviewnasaruddin et al cases from the north-east zone (80.6%) had the highest number of successful outcomes, whereas the borneo zone (45.2%) had the lowest, and the difference was significant. there was no significant difference in interview outcomes between urban and rural localities, or by the health-care workers’ sex, profession, experience with va interviews or whether an office or personal telephone was used (table 1). acceptability the health-care workers rated most caregivers as having “easy” trust towards health-care workers, questionnaire comprehension and interview cooperation (86.5%, 87.8% and 95.9%, respectively) throughout the telephone interview (table 2). a significantly higher proportion of health-care workers rated questionnaire comprehension as “difficult” for caregivers aged 60 years and over (42.9%; p=0.018) (table 2). most health-care workers provided positive feedback towards the va telephone interview. most female health-care workers felt comfortable (83.3%) and found it easy to convey complicated questions (80.6%), and health-care workers from rural areas (85.3%) also felt more comfortable with telephone interviews (table 3). data quality there were eight cases with unusable causes of death (10.8%) that were categorized as garbage codes. the comparison between cases with and without garbage codes showed no difference between the health-care workers’ sex, locality, profession or interview experience (table 3). discussion face-to-face interview has been the standard method of communication for va interviews.1 this study shows that telephone interviews are a feasible alternative when face-to-face interviews are not possible, such as during a pandemic.10 this finding aligns with multiple studies that have shown telephone interviews to be beneficial and comparable to traditional face-to-face interviews.11,14–16 telephone interviews in this study achieved a higher proportion of successful outcomes compared with a malaysian study in 2013 of successful va face-to-face analysis was conducted to assess the association between the interview outcomes and the characteristics of the cases and health-care workers administering the va, and whether the call was completed using an office or personal phone. acceptability acceptability was assessed from the health-care workers’ feedback and their perceived reactions of the caregivers towards the telephone interview process. among the successful outcomes, the caregivers’ perceived reactions were analysed in terms of their trust, question comprehension and cooperation throughout the telephone interview. health-care workers’ feedback was analysed in terms of the limitations, comfort and their perceived ability to convey complicated questions during the telephone interview process. data quality the quality of determined cause of death using icd-10 codes was reviewed based on the proportion of causes of death without garbage code categories (a garbage code being any code that should not be the underlying cause of death, is insufficiently specified12 or is unusable13). associations between the quality of cause of death data and the health-care workers’ background were analysed by chi-square analysis using spss statistics version 23. results a total of 116 deceased cases were selected from across malaysia, among which va telephone interviews were attempted for 113 (97.4%). reasons for non-response from the remaining three cases were not documented. feasibility there were successful outcomes for 74 of 113 cases (65.5%). of the 39 unsuccessful outcomes, seven cases (18.0%) were contactable but failed to complete the interview due to the caregiver’s distrust, disagreement or language barrier issues. among the remaining 32 unsuccessful cases, 46.2% did not answer the call, 20.5% had incorrect telephone numbers and 15.4% did not have an available telephone number. of the 81 cases that were contacted, 74 (91.4%) had successful outcomes. wpsar vol 13, no 2, 2022 | doi: 10.5365/wpsar.2022.13.2.902 https://ojs.wpro.who.int/4 nasaruddin et alverbal autopsy telephone interview table 1. characteristics of cases, health-care workers and telephone type by va telephone interview outcomes (n=113) table 2. caregiver characteristics by health-care worker assessment of caregiver va telephone interview acceptability for interviews with successful outcomes (n=74) characteristics telephone interview outcome p successful, n (%) unsuccessful, n (%) total 74 (65.5) 39 (34.5) cases locality urban 40 (67.8) 19 (32.2) 0.589 rural 34 (63.0) 20 (37.0) zone north-east 29 (80.6) 7 (19.4) 0.002 central-south 26 (74.3) 9 (25.7) borneo 19 (45.2) 23 (54.8) health-care workers sex male 38 (63.3) 22 (36.7) 0.608 female 36 (67.9) 17 (32.1) profession medical officer 34 (63.0) 20 (37.0) 0.589 medical assistant or nurse 40 (67.8) 19 (32.2) va interview experience ≥12 interviews 42 (60.0) 28 (40.0) 0.118 <12 interviews 32 (74.4) 11 (25.6) telephone type office telephone 41 (66.1) 21 (33.9) 0.874 personal telephone 33 (64.7) 18 (35.3) caregiver characteristics health-care worker assessment of caregiver va telephone interview acceptability trust towards health-care worker, n (%) questionnaire comprehension, n (%) interview cooperation, n (%) easy difficult p easy difficult p good poor p total 64 (86.5) 10 (13.5) 65 (87.8) 9 (12.2) 71 (95.9) 3 (4.1) sex male 40 (81.6) 9 (18.4) 0.087 42 (85.7) 7 (14.3) 0.434 46 (93.9) 3 (6.1) 0.207 female 24 (96.0) 1 (4.0) 23 (92.0) 2 (8.0) 25 (100.0) 0 (0.0) age group 18–39 years 21 (77.8) 6 (22.2) 0.195 26 (96.3) 1 (3.7) 0.018 26 (96.3) 1 (3.7) 0.820 40–59 years 36 (90.0) 4 (10.0) 35 (87.5) 5 (12.5) 38 (95.0) 2 (5.0) ≥60 years 7 (100.0) 0 (0.0) 4 (57.1) 3 (42.9) 7 (100.0) 0 (0.0) employment status white collar 17 (94.4) 1 (5.6) 0.321 18 (100.0) 0 (0.0) 0.154 18 (100.0) 0 (0.0) 0.602 blue collar 29 (80.6) 7 (19.4) 31 (86.1) 5 (13.9) 34 (94.4) 2 (5.6) unemployed 18 (90.0) 2 (10.0) 16 (80.0) 4 (20.0) 19 (95.0) 1 (5.0) relationship family 61 (85.9) 10 (14.1) 0.485 62 (87.3) 9 (12.7) 0.511 68 (95.8) 3 (4.2) 0.716 non-family 3 (100.0) 0 (0.0) 3 (100.0) 0 (0.0) 3 (100.0) 0 (0.0) wpsar vol 13, no 2, 2022 | doi: 10.5365/wpsar.2022.13.2.902https://ojs.wpro.who.int/ 5 verbal autopsy telephone interviewnasaruddin et al table 3. health-care worker characteristics by health-care worker feedback on va telephone interview and data quality of cause of death for interviews with successful outcomes (n=74) health-care worker characteristics health-care worker feedback on va telephone interview, n (%) data quality of cause of death, n (%)limitations of telephone interview comfort of telephone interview ability to convey complicated questions no limitation encountered limitation p comfortable not comfortable p easy to convey difficult to convey p nongarbage code garbage code p total 56 (75.7) 18 (24.3) 53 (71.6) 21 (28.4) 50 (67.6) 24 (32.4) 66 (89.2) 8 (10.8) sex male 26 (68.4) 12 (31.6) 0.135 23 (60.5) 15 (39.5) 0.030 21 (55.3) 17 (44.7) 0.020 33 (86.8) 5 (13.2) 0.504 female 30 (83.3) 6 (16.7) 30 (83.3) 6 (16.7) 29 (80.6) 7 (19.4) 33 (91.7) 3 (8.3) locality urban 31 (77.5) 9 (22.5) 0.692 24 (60.0) 16 (40.0) 0.016 26 (65.0) 14 (35.0) 0.609 36 (90.0) 4 (10.0) 0.808 rural 25 (73.5) 9 (26.5) 29 (85.3) 5 (14.7) 24 (70.6) 10 (29.4) 30 (88.2) 4 (11.8) profession medical officer 27 (79.4) 7 (20.6) 0.490 27 (79.4) 7 (20.6) 0.171 26 (76.5) 8 (23.5) 0.131 30 (88.2) 4 (11.8) 0.808 medical assistant or nurse 29 (72.5) 11 (27.5) 26 (65.0) 14 (35.0) 24 (60.0) 16 (40.0) 36 (90.0) 4 (10.0) va interview experience ≥12 interviews 32 (76.2) 10 (23.8) 0.906 28 (66.7) 14 (33.3) 0.279 29 (69.0) 13 (31.0) 0.755 38 (90.5) 4 (9.5) 0.683 <12 interviews 24 (75.0) 8 (25.0) 25 (78.1) 7 (21.9) 21 (65.6) 11 (34.4) 28 (87.5) 4 (12.5) this study did find that older caregivers encountered some difficulty in question comprehension, compared with other age groups. it is not surprising that older people had difficulties in question comprehension because this also occurs in face-to-face settings, especially for medically related questions. around two thirds of health-care workers provided positive feedback about conducting the va by telephone interview. both male and female health-care workers reported being comfortable with telephone interviews, with a higher proportion of females reporting being comfortable. this difference might be influenced by females having a lower preference for travelling and perceived interviewer safety during face-to-face interviews. telephone interviewing reduces travelling and physical encounters with strangers outside the workplace area, which can be an issue for females.15,16,20 health-care workers from rural areas also reported being comfortinterviews (65.5% compared with 53.1%).2,17 that the interview outcomes were similar for both urban and rural localities suggests that telephone coverage is widely distributed across malaysia, which may not be the case in other countries with lower urbanization levels.18 the telephone interviews for va were acceptable in this study, with the health-care workers reporting that the interviewed caregivers showed trust, easily understood complicated questions and were cooperative throughout the interview process. despite the presence of emotional conflicts when talking about a deceased family member, the caregivers trusted the health-care workers and were willing to complete the telephone interview.19 this suggests that va data collection is unaffected by the telephone method. the absence of obtrusive interviewer note-taking that is usually present during a face-to-face interview might have increased the focus and question comprehension of the caregiver being interviewed.16 wpsar vol 13, no 2, 2022 | doi: 10.5365/wpsar.2022.13.2.902 https://ojs.wpro.who.int/6 nasaruddin et alverbal autopsy telephone interview gated and the caregivers’ feedback being only from the perspective of the health-care workers. overall, the study found that the telephone interview method is feasible and accepted by both caregivers and health-care workers and has an acceptable level of data quality. using this method, malaysia could improve the va system by incorporating the use of software for faster data collection and algorithms for automated cause of death determination. such innovations should be explored further in future studies for malaysia.24 conclusion this study provides preliminary evidence that a va telephone interview is feasible and can be used as an alternative to face-to-face interviews without affecting data quality or the flow of data collection. during pandemics or other instances where face-to-face interviews are not possible, the telephone interview method ensures va data collection is not delayed and provides accuracy for mortality data in malaysia. however, before policy decisions can be made regarding the routine use of telephone interviews, a large-scale study is recommended to yield more robust and comprehensive results to better evaluate the efficacy of telephone interviews compared with face-to-face interviews. telephone interviews for va should also be considered when there are transportation, geographical, time and cost limitations, and not just during the current pandemic. when feasible, these recommendations apply to other countries as well. acknowledgements the authors would like to thank the director-general of health, malaysia for his permission to publish this article. we also would like to express our gratitude to the disease control division, ministry of health malaysia for providing the needed data to complete this study. conflict of interest none declared. ethics statement ethical approval for this study was obtained from the medical research and ethics committee, ministry of health malaysia. able with telephone interviews, possibly due to time– and cost–effectiveness, because telephone calls make it easy to reach geographically distant caregivers in rural areas.11,16 poorly collected data from a va interview can influence a physician’s decision when determining the cause of death and lead to an ill-defined underlying cause of death or garbage code. the loss of mortality data due to unusable garbage codes is likely to affect the data quality and accuracy of mortality surveillance.21 in our telephone interview study, 10.8% of cases had garbage codes, an acceptable level when compared with the 30–35% garbage codes found from a local malaysian study involving face-to-face va interviews.2 there was no difference in data quality by the health-care workers’ specific professions and experience, suggesting that a telephone interview is easy to conduct and does not need specific skills or experience requirements. this study highlighted a few problems with conducting va interviews, regardless of the interview modality, such as incorrect or unavailable caregiver contact information.17 a study on va using face-to-face interviews also mentioned issues such as uncontactable caregivers due to change of address and incorrect caregiver contact information, which caused a delay in completing the interview process.2,17 delay between the death and the interview can make it difficult for caregivers to convey accurate information due to recall bias, especially if the delay is for more than 1 year.22 providing contact information for more than one caregiver in the civil registration system might be a potential solution for this persistent problem. also, unanswered telephone calls, caregiver distrust and caregiver disagreement could be reduced by sending a formal letter or text message complete with organizational identification and contact information before the telephone calls to encourage people to respond to the call.23 the results from this study showed that, once a caregiver was contactable, 91% of va interviews were successfully completed. this may be the first time the outcome of a va telephone interview has been assessed. participants were recruited from across all states to ensure equal distribution across the nation, and investigators were blinded from the selection of interviewers to avoid bias. nevertheless, the study had some limitations, including a small sample size, the characteristics of unsuccessful interviews not being thoroughly investiwpsar vol 13, no 2, 2022 | doi: 10.5365/wpsar.2022.13.2.902https://ojs.wpro.who.int/ 7 verbal autopsy telephone interviewnasaruddin et al 11. block es, erskine l. interviewing by telephone: specific considerations, opportunities, and challenges. int j qual methods. 2012;11(4):428–45. doi:10.1177/160940691201100409 12. mikkelsen l, richards n, lopez a. redefining ‘garbage codes’ for public health policy: report on the expert group meeting, 27–28 february 2017. crvs best-practice and advocacy. melbourne, australia: university of melbourne, civil registration and vital statistics improvement, bloomberg philanthropies data for health initiative; 2018. available from: https://crvsgateway.info/file/16948/276, accessed 30 march 2022. 13. murray cjl, lopez ad. the global burden of disease: a comprehensive assessment of mortality and disability from diseases, injuries, and risk factors in 1990 and projected to 2020. geneva: world health organization, world bank & harvard school of public health; 1996. available from: https://apps.who.int/iris/handle/10665/41842, accessed 16 february 2022. 14. holt a. using the telephone for narrative interviewing: a research note. qual res. 2010;10(1):113–21. doi:10.1177/1468794109348686 15. sturges je, hanrahan kj. comparing telephone and face-to-face qualitative interviewing: a research note. qual res. 2004;4(1):107– 18. doi:10.1177/1468794104041110 16. oltmann sm. qualitative interviews: a methodological discussion of the interviewer and respondent contexts. forum qualitative sozialforschung/forum: qualitative social research. 2016;17(2):15. doi:10.17169/fqs-17.2.2551 17. omar a, ganapathy ss, anuar mfm, khoo yy, jeevananthan c, maria awaluddin s, et al. cause-specific mortality estimates for malaysia in 2013: results from a national sample verification study using medical record review and verbal autopsy. bmc public health. 2019;19(1):110. doi:10.1186/s12889-018-6384-7 pmid:30678685 18. population distribution and basic demographic characteristic report 2010. putrajaya: department of statistics malaysia; 2011. available from: https://www.dosm.gov.my/v1/index.php?r=column/ cthemebycat&cat=117&bul_id=mdmxdhzjwtk1sjfztznkrx yzcvzjdz09&menu_id=l0pheu43nwjwrwvszklwdzq4tlhu ut09#, accessed 16 february 2022. 19. allotey pa, reidpath dd, evans nc, devarajan n, rajagobal k, bachok r, et al. let’s talk about death: data collection for verbal autopsies in a demographic and health surveillance site in malaysia. glob health action. 2015;8:28219. doi:10.3402/gha.v8.28219 pmid:26140728 20. elias w, newmark gl, shiftan y. gender and travel behavior in two arab communities in israel. trans res rec. 2008;2067(1):75–83. doi:10.3141/2067-09 21. gonzalez-medina d, phillips d, barber r, atkinson c, naghavi m, lozano r, et al. the state of verbal autopsy: availability and quality measures. rhodes, greece: the global congress on verbal autopsy; 2013. available from: https://scholar.google.com/citations?view_ op=view_citation&hl=en&user=-ariphcaaaaj&citation_for_view=ariphcaaaaj:ufrvopgsrksc, accessed 1 march 2022. 22. serina p, riley i, hernandez b, flaxman ad, praveen d, tallo v, et al. what is the optimal recall period for verbal autopsies? validation study based on repeat interviews in three populations. popul health metr. 2016;14:40. doi:10.1186/s12963-016-0105-1 pmid:27833459 23. cheon k-y, lim sy, park a. caller authentication system and method for phishing prevention. us8290130b2 (patent); 2012. available from: https://patentimages.storage.googleapis. com/45/0a/34/ad24bbc1faafe6/us8290130.pdf, accessed 1 march 2022. 24. zhao y, joshi r, rampatige r, sun j, huang l, chen s, et al. use of smartphone for verbal autopsy: results from a pilot study in rural china. asia pac j public health. 2016;28(7):601–10. doi:10.1177/1010539516667780 funding funding for this study was provided by the ministry of health malaysia. references 1. verbal autopsy standards: the 2016 who verbal autopsy instrument. geneva: world health organization; 2016. available from: https://www.who.int/publications/m/item/verbal-autopsystandards-the-2016-who-verbal-autopsy-instrument, accessed 16 february 2022. 2. a study on determination of cause of deaths in malaysia. kuala lumpur: institute for public health; 2016. available from: https://iku.gov.my/research/iku/cod, accessed 16 february 2022. 3. statistics on causes of death, malaysia, 2017. putrajaya: department of statistics malaysia; 2017. available from: https://www.dosm.gov.my/v1/index.php?r=column/ cthemebycat&cat=401&bul_id=y3psyui2vju0zzrhzu1kcvfm mthgut09&menu_id=l0pheu43nwjwrwvszklwdzq4tlhu ut09, accessed 6 january 2022. 4. rao c, omar ma, ganapathy ss, tamin nsi. strengthening mortality statistics for health programs in malaysia: lessons from the field. dr sulaiman al habib medical journal. 2019;1(3–4):52–4. doi:10.2991/dsahmj.k.191214.003 5. ministry of health malaysia. surat pekeliling ketua pengarah kesihatan malaysia bil 6/2017: perlaksanaan sistem verifikasi data penyebab kematian yang tidak disahkan secara perubatan di malaysia [circular letter of the director-general of health malaysia no. 6/2017: implementation of verbal autopsy in malaysia]. putrajaya: ministry of health malaysia; 2017. available from: https://www. moh.gov.my/index.php/database_stores/store_view_page/10/330, accessed 16 february 2022. 6. nor si, ismawati i, feisul im, omar m, maimunah ar. panduan dan prosedur verifikasi data penyebab kematian yang tidak disahkan secara perubatan di malaysia [guidelines and procedures for verbal autopsy in malaysia]. putrajaya: ministry of health malaysia; 2017. available from: https://www2.moh.gov.my/moh/resources/ penerbitan/rujukan/ncd/kanser/(_buku_saiz_a5_)modul_verifikasi_data_(1).pdf, accessed 1 march 2022. 7. manual penemuramah verifikasi data penyebab kematian yang tidak disahkan secara perubatan [verbal autopsy interviewer guide]. putrajaya: ministry of health malaysia. available from: https://www2. moh.gov.my/moh/resources/penerbitan/rujukan/ncd/kanser/ modul_penceramah_verifikasi_data_penyebab_kematian_yang_tidak_disahkan_secara_perubatan.pdf, accessed 1 march 2022. 8. manual for cause of death assignment. putrajaya: ministry of health malaysia. available from: https://www.moh.gov.my/moh/resources/ penerbitan/rujukan/ncd/kanser/manual_for_cause_of_death_assignment.pdf, accessed 8 march 2022. 9. statistics on causes of death, malaysia, 2020. putrajaya: department of statistics malaysia; 2020. available from: https://www.dosm. gov.my/v1/index.php?r=column/cthemebycat&cat=401&bul_id =qtu5t0dkq1g4mhyxd3zpmzhemzdrdz09&menu_id=l0ph eu43nwjwrwvszklwdzq4tlhuut09, accessed 16 february 2022. 10. who announces covid-19 outbreak a pandemic. geneva: world health organization; 2020. available from: https://www.euro.who. int/en/health-topics/health-emergencies/coronavirus-covid-19/ news/news/2020/3/who-announces-covid-19-outbreak-a-pandemic, accessed 11 february 2022. https://ojs.wpro.who.int/ 1wpsar vol 14, no 1, 2023 | doi: 10.5365/wpsar.2023.14.1.949 original research t he coronavirus disease (covid-19) pandemic continues to have significant negative impacts on health-care services worldwide as a result of the diversion of resources to mitigate the impact of the disease,1,2 which will have immediate and long-term consequences. patients affected by covid-19 are at risk of both medical and psychological long-term health issues. as covid-19 is predominantly a respiratory illness, long-term respiratory problems are expected.3,4 however, a range of adverse outcomes of covid-19 have also been observed involving the immune system (e.g. guillain-barré syndrome and paediatric inflammatory multisystem syndrome), cardiovascular system (e.g. cardiomyopathy and coagulopathy), neurological system (e.g. sensory dysfunction and stroke), cutaneous and digestive manifestations as well as mental health issues.4 patients with mild disease from covid-19 infection who then experienced long-term symptoms5,6 are also of concern. this constellation of non-specific symptoms has been referred to as long covid, chronic covid syndrome or post-covid condition,5,7 with varying definitions between countries and organizations. the world health organization (who) defines post-covid condition as a condition occurring usually 3 months from the onset of covid-19 with symptoms that last for at least 2 months that cannot be explained by an alternative diagnosis.7 the united states centers for disease control and prevention (cdc) defines it as a wide range of new, returning or ongoing health problems for 4 or more weeks after covid-19.8 common symptoms include fatigue, shortness of breath and cognitive dysfunction that generally impact everyday functioning.7 symptoms may begin after a national isolation centre, ministry of health, tutong, brunei darussalam. b department of medicine, raja isteri pengiran anak saleha hospital, bandar seri begawan, brunei darussalam. c pengiran anak puteri rashidah sa’adatul bolkiah institute of health sciences, universiti brunei darussalam, bandar seri begawan, brunei darussalam. published: 18 january 2023 doi: 10.5365/wpsar.2023.14.1.949 objective: patients who recover from coronavirus disease (covid-19) infection are at risk of long-term health disorders and may require prolonged health care. this retrospective observational study assesses the number of health-care visits before and after covid-19 infection in brunei darussalam. methods: covid-19 cases from the first wave with 12 months of follow-up were included. health-care utilization was defined as health-care visits for consultations or investigations. post-covid condition was defined using the world health organization definition. results: there were 132 cases; 59.1% were male and the mean age was 37.1 years. the mean number of health-care visits 12 months after recovery from covid-19 (123 cases, 93.2%; mean 5.0 ±5.2) was significantly higher than the prior 12 months (87 cases, 65.9%, p<0.001; mean 3.2 ±5.7, p<0.001). there was no significant difference when scheduled covid-19 visits were excluded (3.6 ±4.9, p = 0.149). all 22 cases with moderate to critical disease recovered without additional health-care visits apart from planned post-covid-19 visits. six patients had symptoms of post-covid condition, but none met the criteria for diagnosis or had alternative diagnoses. discussion: there were significantly more health-care visits following recovery from covid-19. however, this was due to scheduled post-covid-19 visits as per the national management protocol. this protocol was amended prior to the second wave to omit post-covid-19 follow-up, except for complicated cases or cases with no documented radiological resolution of covid-19 pneumonia. this will reduce unnecessary health-care visits and conserve precious resources that were stretched to the limit during the pandemic. post-covid-19 health-care utilization: one year after the 2020 first wave in brunei darussalam muhammad syafiq abdullah,a,b,c rosmonaliza asli,a,b pui lin chong,a,b babu ivan mani,a natalie raimiza momin,a,b noor affizan rahman,a,b chee fui chonga and vui heng chonga,b,c correspondence to vui heng chong (email: vuiheng.chong@moh.gov.bn) wpsar vol 14, no 1, 2023 | doi: 10.5365/wpsar.2023.14.1.949 https://ojs.wpro.who.int/2 abdullah et alpost-covid-19 health-care utilization in brunei darussalam day 11 post-discharge to document viral clearance, and follow-up appointments with cases who had covid-19 pneumonia as documented on chest radiographs or other unresolved issues directly related to covid-19 (e.g. thrombocytopenia or unresolved symptoms) at discharge. data collection data were retrieved from the database maintained by the nic management team that had been established at the start of the covid-19 outbreak. data collected included age, sex, ethnicity, comorbidities, date of positive rt-pcr test, symptoms at presentation, severity of illness at presentation and daily progress, outcomes and discharge date. data on health-care utilization during the 12 months before and 12 months after covid-19 diagnosis were retrieved from the brunei darussalam health and management system, a national electronic healthcare system that links all government health institutions (hospitals and peripheral clinics). established in 2011, this system captures all patients’ health-care encounters. five categories of disease were defined: (i) asymptomatic; (ii) mild (symptomatic without evidence of pneumonia on chest imaging); (iii) moderate (clinical or imaging evidence of pneumonia); (iv) severe (required oxygen supplementation); and (v) critical (respiratory failure requiring mechanical ventilation with or without other organ failure). these were grouped into two categories: asymptomatic/mild and moderate to critical. data analysis analyses were conducted using ibm® spss version 26.0. mean, standard deviation and range were calculated for continuous variables and frequency and percentage for categorical variables. the number of health-care visits 12 months before and 12 months after covid-19 infection were compared. the mann-whitney u test was used to test the difference between the mean number of healthcare visits for non-parametric continuous variables and the chi-square test was used for categorical variables. a p value of <0.05 was taken as significant. results study population of the 340 covid-19 cases from the first wave, 205 had not resided in brunei darussalam 12 months before and initial recovery from covid-19, or may persist from the initial covid-19 illness, and can fluctuate or relapse over time. the cdc characterized post-covid conditions into three subtypes: new or ongoing symptoms; multiorgan effects of covid-19 (i.e. multisystem inflammatory syndrome); and effects of covid-19 or hospitalization.8 reported risk factors for chronic sequelae of covid-19 include disease severity, older age, sex, ethnicity, comorbidities especially pre-existing respiratory disease, and higher body mass index.5,9 female patients have been associated with a higher likelihood of developing mental and psychological long-term sequelae.9,10 to date, few studies have looked at health-care utilization after recovery from covid-19.11–15 one study reported that 10.3% of covid-19 patients would require re-admission to hospital and an all-cause mortality of 7.9% after recovery from covid-19, with the majority of deaths occurring within the first 30 days after the index admission.12 the assessment of the burden on the healthcare system post-covid-19 infection from earlier waves can assist with health-care utilization planning. this study of covid-19 patients from the first wave in brunei darussalam aims to: (1) compare health-care utilization of covid-19 patients 12 months before and 12 months after their infection; (2) assess if severity of disease, underlying psychiatric disorders and need for counselling during hospitalization affected health-care utilization; and (3) assess the prevalence and characteristics of patients diagnosed with post-covid condition. methods study design this was a retrospective observational study of cases who recovered from covid-19 during the first wave (from 9 march 2020 to 6 august 2021) in brunei darussalam. all covid-19 cases in brunei darussalam diagnosed during the first wave were admitted to the national isolation centre (nic) for isolation and treatment. all covid-19 cases from the first wave who were alive 12 months after their covid-19 recovery and had resided in brunei darussalam 12 months before and 12 months after their recovery from covid-19 were eligible for the study. in order to document recovery, scheduled postcovid-19 health-care visits, as defined in the national post-discharge management protocol, included a reverse transcription polymerase chain reaction (rt-pcr) test on wpsar vol 14, no 1, 2023 | doi: 10.5365/wpsar.2023.14.1.949https://ojs.wpro.who.int/ 3 post-covid-19 health-care utilization in brunei darussalamabdullah et al of health-care visits preand post-covid-19 (n = 470, mean 3.6 ±4.9; p = 0.149). similarly, when scheduled covid-19 visits were excluded, there was no significant difference between the mean number of health-care visits for each characteristic assessed preand post-covid-19, except for patients with abnormal chest radiography (p = 0.019). among non-covid-19 health-care visits, there were 11 for covid-19 vaccinations: five partial (one dose) and three complete (two doses). patients with moderate to severe covid-19 disease there were 22 (16.7%) cases with covid-19 pneumonia (moderate to critical disease) including two who required mechanical ventilation. eleven had radiological resolutions documented at discharge and 11 had complete resolutions documented at follow-up. all were cleared of any residual respiratory issues. none had any further health-care visits for respiratory or other problems related to covid-19 other than their scheduled post-covid-19 visits. psychiatric encounters during hospitalizations for covid-19, six patients required counselling or psychiatric treatment (table 3), four of whom were diagnosed with underlying mild psychiatric disorders during admission but did not have prior encounters with public or mental health-care services. one case was referred due to concern about prolonged hospitalization and because their family members had recovered much earlier. four patients were given treatment. post-discharge, four had follow-up appointments, of whom two were already known to the service and two were new. both cases 5 and 6 had improved when they were reviewed. one was seen once before missing her scheduled follow-up appointment, and the other patient continued routine follow-up (table 3). post-covid condition six patients had some symptoms of post-covid condition but none met the criteria for diagnosis. four of these patients had hospital encounters within 60 days and two after 8 months following their initial covid-19 infection (table 4). three patients had pre-existing psychiatric 12 months after their recovery from covid-19 and three had died, leaving 132 cases eligible for the study. the mean age of the study population was 37.1 ±17.2 years with more males (59.1%) than females. the ethnic breakdown was consistent with the national distribution. a total of 39 patients (29.5%) had underlying comorbidities, the most common being hypertension and dyslipidaemia (table 1). nearly half (46.3%) were overweight or obese. symptoms were reported by 69.7% of cases at admission with the most common being cough (39.0%), fever (26.5%) and rhinorrhoea (23.5%). the majority of cases (83.3%; n = 110) had asymptomatic/mild disease and 16.7% (n = 22) had moderate to critical disease (table 1). four cases were admitted to the intensive care unit with two needing mechanical ventilation. the mean length of hospitalization was 20.2 ±8.7 days. health-care utilization most cases (64.4%) visited health-care facilities 12 months before and 12 months after recovering from covid-19 (table 2). figure 1 shows the breakdown in the number of health-care visits before and after covid-19 (unrelated and related to covid-19). this shows scheduled covid-19-related visits ranging from one to six visits, most with one visit, mainly for postdischarge testing for severe acute respiratory syndrome coronavirus 2 (sars-cov-2) to document viral clearance following our management protocol at the time. overall, there were significantly more health-care visits (n = 660, mean 5.0 ±5.2 visits) in the 12 months after covid-19 compared to the 12 months before (n = 431, mean 3.2 ±5.7; p < 0.001). there was a significant increase in the mean number of visits observed between each characteristic assessed except for chinese ethnicity (table 1). cases with comorbidities (diabetes mellitus, hypertension, dyslipidaemia, ischaemic heart disease and respiratory disorders) had more health-care visits compared to those without comorbidities. however, there was no significant increase in health-care visits post-covid-19. there were 190 scheduled post-covid-19 visits, with a mean of 1.4 ±1.3 per case (range 1–6). when scheduled post-covid-19 visits were excluded, there was no significant difference between the mean number wpsar vol 14, no 1, 2023 | doi: 10.5365/wpsar.2023.14.1.949 https://ojs.wpro.who.int/4 abdullah et alpost-covid-19 health-care utilization in brunei darussalam a the first wave lasted from 9 march 2020 to 6 august 2021. b comparison between health-care visits 12 months before covid-19 and overall health-care visits 12 months after covid-19. c comparison between health-care visits 12 months before covid-19 and non-covid-19 health-care visits 12 months after covid-19. d nine cases (children) did not undergo chest radiography. table 1. characteristics of covid-19 cases by mean number of health-care visits 12 months before and 12 months after covid-19 illness during the first wave,a brunei darussalam (n = 132) characteristic n (%) health-care visits 12 months before covid-19 (mean ±sd) overall health-care visits 12 months after covid-19 (mean ±sd) pb non-covid-19 healthcare visits 12 months after covid-19 (mean ±sd) pc sex female 54 (40.9) 3.7 ±6.1 5.3 ±5.9 <0.001 3.9 ±5.5 0.204 male 78 (59.1) 3.2 ±5.2 4.7 ±4.7 <0.001 3.3 ±4.5 0.400 nationality malay 107 (81.1) 3.7 ±6.1 5.3 ±5.6 <0.001 3.8 ±5.2 0.340 chinese 5 (3.8) 1.0 ±0.7 2.2 ±1.9 0.310 1.0 ±1.7 0.548 other 20 (15.2) 1.7 ±2.9 4.1 ±3.1 0.003 2.9 ±3.0 0.081 age group (years) <30 48 (36.4) 3.1 ±6.4 3.7 ±5.8 0.039 2.6 ±5.8 0.589 30–50 47 (35.6) 2.8 ±5.7 5.0 ±5.3 <0.001 3.4 ±4.8 0.160 >50 37 (28.0) 4.1 ±4.5 6.7 ±3.8 0.001 5.0 ±3.3 0.089 comorbidities yes 39 (29.5) 5.2 ±6.8 7.1 ±5.7 0.014 5.5 ±5.4 0.294 no 93 (70.5) 2.5 ±4.9 4.1 ±4.7 <0.001 2.7 ±4.4 0.202 diabetes yes 9 (6.8) 9.0 ±10.5 9.1 ±8.8 0.666 8.1 ±8.6 0.931 no 123 (93.2) 2.8 ±4.9 4.7 ±4.8 <0.001 3.2 ±4.4 0.137 hypertension yes 22 (16.7) 6.4 ±7.3 8.0 ±6.4 0.134 6.6 ±6.1 0.502 no 110 (83.3) 2.6 ±5.1 4.4 ±4.8 <0.001 2.9 ±4.4 0.147 dyslipidaemia yes 20 (15.2) 5.9 ±7.8 6.7 ±3.9 0.063 5.5 ±3.7 0.289 no 112 (84.5) 2.8 ±5.1 4.7 ±5.4 <0.001 3.2 ±5.0 0.229 ischaemic heart disease yes 5 (3.8) 4.2 ±3.8 4.4 ±4.4 1.000 3.8 ±4.3 0.841 no 127 (96.2) 3.2 ±5.7 5.0 ±5.3 <0.001 3.6 ±4.9 0.128 respiratory disease yes 7 (5.3) 2.0 ±2.8 6.4 ±5.2 0.073 4.6 ±4.5 0.535 no 125 (94.7) 3.3 ±5.8 4.9 ±5.2 <0.001 3.5 ±4.9 0.192 reported symptoms at admission yes 92 (69.7) 3.5 ±6.4 5.3 ±5.3 <0.001 3.7 ±4.9 0.131 no 40 (30.3) 2.7 ±3.4 4.4 ±5.1 0.020 3.2 ±4.9 0.741 abnormal chest radiographyd yes 22 (17.9) 3.8 ±4.9 9.6 ±6.1 0.001 6.5 ±6.1 0.019 no 101 (82.1) 3.1 ±5.9 4.2 ±4.6 <0.001 3.1 ±4.6 0.387 disease severity asymptomatic/mild 110 (83.3) 3.0 ±5.7 4.0 ±4.5 <0.001 2.9 ±4.6 0.471 moderate to critical 22 (16.7) 4.7 ±5.5 10.0 ±5.8 0.001 7.0 ±6.0 0.062 wpsar vol 14, no 1, 2023 | doi: 10.5365/wpsar.2023.14.1.949https://ojs.wpro.who.int/ 5 post-covid-19 health-care utilization in brunei darussalamabdullah et al a the first wave lasted from 9 march 2020 to 6 august 2021. a the first wave lasted from 9 march 2020 to 6 august 2021. table 2. proportion of cases during the first wavea with health-care visits 12 months before and 12 months after covid-19 illness, brunei darussalam (n = 132) fig. 1. distribution of covid-19 cases during the first wavea by number of health-care visits 12 months before illness, and number of health-care visits unrelated and related to covid-19 in the 12 months after recovery, brunei darussalam (n = 132) health-care visits before / after covid-19 illness n (%) no / no 7 (5.3) no / yes 38 (28.8) yes / no 2 (1.5) yes / yes 85 (64.4) final case had transient localized musculoskeletal chest pain (tietze syndrome) (table 4). discussion our study showed a significantly higher mean number of health-care visits among recovered covid-19 cases from the first wave in brunei darussalam 12 months after recovery compared with the 12 months prior to infection. however, this increase in health-care visits was mainly due to scheduled post-covid-19 healthcare visits as per the national management protocol at the time. although some cases had symptoms of post-covid condition, none fulfilled the who criteria for diagnosis7 or they had alternate diagnoses, and their symptoms were self-limiting. none of the cases with covid-19 pneumonia had long-term respiratory effects during the 12 months after recovering from covid-19. post-covid condition is a well-recognized disorder,7,8 with varying definitions regarding symptoms and duration. although there were cases with some symptoms of post-covid condition, all had alternative diagnoses to account for their symptoms, either due to disorders, which were exacerbated by covid-19 illness in two of these patients. the third patient had transient forgetfulness which the patient described as brain fog. psychometric evaluations for this patient were normal. one case developed palpitations 54 days after discharge and investigations revealed idiopathic supraventricular tachycardia. coronary angiography assessment prior to diagnosis of covid-19 was normal. another case developed non-specific symptoms which resolved, although they were later diagnosed with bulimia, and the 0 10 20 30 40 50 60 70 80 0 1 2 3 4 5 6 7 8 9 10 11–15 16–20 >20 before covid-19 after covid-19 (unrelated) after covid-19 (related) no. of health-care visits n o. o f p at ie nt s wpsar vol 14, no 1, 2023 | doi: 10.5365/wpsar.2023.14.1.949 https://ojs.wpro.who.int/6 abdullah et alpost-covid-19 health-care utilization in brunei darussalam table 3. encounters with psychiatric counselling services 12 months before covid-19 infection, during hospitalization and 12 months after recovery during the first wave,a brunei darussalam (n = 132) table 4. cases with symptoms of post-covid condition during the first wave,a brunei darussalam (n = 6) 12 months before covid-19 during hospitalization for covid-19 12 months after covid-19 encounters, n (%) 4 (2.9) 6 (4.4) 4 (2.9) case no.: disorder 1: psychotic depression 2: learning disability 3: autism spectrum disorder (paediatric) 4: autism spectrum disorder (paediatric) 2: learning disability (risk of impulsivity/aggression) 5: anxiety and panic attacks 6: anxiety and panic attacks 7: anxiety disorder (reactive anxiety and insomnia) 8: attention deficit hyperactivity disorder 9: concern of staff 1: psychotic depression 2: learning disability (lost to follow-up) 5: anxiety and panic attacks 6: anxiety and panic attacks a the first wave lasted from 9 march 2020 to 6 august 2021. a the first wave lasted from 9 march 2020 to 6 august 2021. case no. sex/age (years) disease severity length of hospitalization (days) pre-existing condition symptoms outcomes last consult days between discharge and first health-care visit 5 female/23 mild 14 yes: anxiety anxiety, palpitation, insomnia, nightmares resolved discharged 20 6 female/23 mild 17 yes: anxiety and panic anxiety attacks resolved discharged 18 8 male/39 mild 23 yes: attention deficit hyperactivity disorder forgetfulness/ unable to find words, unable to concentrate resolved discharged 255 10 male/43 moderate 20 no localized chest pain and itchy rash resolved discharged 36 11 male/62 moderate 33 no palpitation diagnosed with supraventricular tachycardia cardiology follow-up 54 12 female/19 mild 35 no atypical chest pain, cramps, choking sensation bulimia still on follow-up 284 wpsar vol 14, no 1, 2023 | doi: 10.5365/wpsar.2023.14.1.949https://ojs.wpro.who.int/ 7 post-covid-19 health-care utilization in brunei darussalamabdullah et al respiratory department, cleared of any long-term pulmonary issues and eventually discharged to their primary care doctors. none had further health-care visits for pulmonary issues. in the first wave, only chest radiography was used for imaging as computed tomography, which is superior in detecting respiratory changes due to covid-19, was not available.19 if it had been available and used, this would have likely resulted in more unnecessary scheduled post-covid-19 visits. one study has reported persistent air exchange dysfunction after recovering from covid-19.20 it is uncertain if symptoms will become apparent after a much longer period and, therefore, longer follow-up studies are required. the mental wellbeing of covid-19 patients is likely to be impacted either directly due to their covid-19 infection or as a psychological impact of implemented restrictive measures.4,10 six of our patients needed counselling during their hospitalizations. common indications for counselling were anxiety-related issues that were exacerbated by covid-19 illness. this was not surprising, given that at the time covid-19 was a novel viral illness without effective treatment. furthermore, our management protocol required all covid-19 cases to be admitted for isolation in single isolation rooms or warded with strangers for a minimum duration of 14 days.21 movement was also restricted to the wards or rooms. this was further compounded by frequent medical investigations (blood draws, radiological imaging and nasopharyngeal swabbing). all these can incur anxiety and fear in addition to stressors brought on by the covid-19 illness itself. however, this did not translate to additional health-care visits. this study of the first wave of covid-19 in brunei darussalam showed that most patients recovered without further issues and significant post-covid conditions were uncommon. covid-19 remains a novel infectious disease, especially with new sars-cov-2 variants of concern appearing. however, the knowledge gained has resulted in a better understanding of covid-19, as reflected in changes to our national management protocols. after the peak of the first wave in 2020, postdischarge testing was omitted as it was shown that the number of cases re-testing positive after discharge was not insignificant.22–24 longer follow-up for non-resolving symptoms or laboratory monitoring also stopped and instead cases were directed to their primary care clinics. exacerbations of pre-existing conditions, chest musculoskeletal pain similar to tietze syndrome or cardiac arrhythmias that were unrelated to covid-19. some of our cases did meet the definition of other diagnostic criteria, including the cdc criteria.5,8 fortunately, most cases recovered without further consultations or treatment, indicating that post-covid-19 symptoms were mild and self-limiting. however, it remains to be seen if post-covid condition will be a significant problem in our setting with a larger number of patients affected by covid-19 in subsequent waves. our findings differ from other studies reported in the literature. a meta-analysis of 91 studies showed a prevalence of hospital readmissions during the first 30 days, 90 days and 1 year post-discharge of 8.97%, 9.79% and 10.34%, respectively.12 most cases of hospital readmissions occurred within 30 days after discharge.12 a study from switzerland of 385 patients with covid-19, 81 of whom required hospitalization during initial illness, reported that at 6–8 months after illness, 26% (n = 111) had not fully recovered, 40% (n = 170) reported at least one visit to the general practitioner and 10% (n = 81) of those hospitalized were re-hospitalized.11 individuals who had not fully recovered or suffered from fatigue, dyspnoea or depression were more likely to have further health-care contacts. however, a third of individuals (37/111) who had not fully recovered did not seek further care.11 this indicated that despite residual symptoms persisting, they may not have been significant enough to require health-care visits. the difference between our findings and those of other studies may be due to the small total number of patients affected by covid-19 in brunei darussalam during the first wave, including those categorized as severe. however, it is possible that the difference is due to factors such as vulnerability or susceptibility to postcovid-19 illness, and is influenced by social, cultural and religious factors.16,17 other factors may also be at play and will require further study. there are many reasons why patients may have physiological or psychological issues after recovery from covid-19.4–9 apart from patients with covid-19 pneumonia and a case of transient thrombocytopenia, none of the cases from this study had any other symptoms. as previously reported, cases in this cohort with moderate to critical covid-19 all had abnormal chest radiography.18 all cases were reviewed by the wpsar vol 14, no 1, 2023 | doi: 10.5365/wpsar.2023.14.1.949 https://ojs.wpro.who.int/8 abdullah et alpost-covid-19 health-care utilization in brunei darussalam conflict of interest the authors have no conflicts of interest to declare. ethics statement this study was conducted in accordance with the ethical standards set out in the declaration of helsinki (october 2013). permission was obtained from the ministry of health, brunei darussalam, to conduct this study using aggregated, anonymized data. funding none. references 1. pei s, yamana tk, kandula s, galanti m, shaman j. burden and characteristics of covid-19 in the united states during 2020. nature. 2021;598(7880):338–41. doi:10.1038/s41586-02103914-4 pmid:34438440 2. koontalay a, suksatan w, prabsangob k, sadang jm. healthcare workers’ burdens during the covid-19 pandemic: a qualitative systematic review. j multidiscip healthc. 2021;14:3015–25. doi:10.2147/jmdh.s330041 pmid:34737573 3. han x, fan y, alwalid o, li n, jia x, yuan m, et al. six-month followup chest ct findings after severe covid-19 pneumonia. radiology. 2021;299(1):e177–86. doi:10.1148/radiol.2021203153 pmid:33497317 4. leung tym, chan ayl, chan ew, chan vky, chui csl, cowling bj, et al. shortand potential long-term adverse health outcomes of covid-19: a rapid review. emerg microbes infect. 2020;9(1):2190– 9. doi:10.1080/22221751.2020.1825914 pmid:32940572 5. nalbandian a, sehgal k, gupta a, madhavan mv, mcgroder c, stevens js, et al. post-acute covid-19 syndrome. nat med. 2021;27(4):601–15. doi:10.1038/s41591-021-01283-z pmid:33753937 6. lopez-leon s, wegman-ostrosky t, perelman c, sepulveda r, rebolledo pa, cuapio a, et al. more than 50 long-term effects of covid-19: a systematic review and meta-analysis. sci rep. 2021;11(1):16144. doi:10.1038/s41598-021-95565-8 pmid:34373540 7. a clinical case definition of post covid-19 conditions by a delphi consensus. geneva: world health organization; 2021. available from: https://www.who.int/publications/i/item/who-2019-ncovpost_covid-19_condition-clinical_case_definition-2021.1, accessed 24 february 2022. 8. long covid or post-covid conditions. atlanta, ga: u.s. centers for disease control and prevention; updated 1 september 2022. available from: https://www.cdc.gov/coronavirus/2019-ncov/longterm-effects/index.html, accessed 17 september 2022. 9. sudre ch, murray b, varsavsky t, graham ms, penfold rs, bowyer rc, et al. attributes and predictors of long covid. nat med. 2021;27(4):626–31. doi:10.1038/s41591-021-01292-y pmid:33692530 the current management protocols require follow-up for patients with unresolved chest radiography findings with moderate to severe covid-19 or for those who had a complicated illness. there are several limitations that need to be considered when interpreting our findings. using encounters from government health-care institutions based on the electronic record system excluded encounters with private clinics. however, the demographics of our study patients are consistent with patients whose health-care needs are usually met by the public sector. furthermore, encounters with the private sector are likely to be minor and considered non-significant, as in brunei darussalam specialty services are only available from public healthcare institutions. the sample size was small, and further studies with larger cohorts would be useful and should be considered. prior to the second wave, there were only 340 patients with covid-19 in brunei darussalam and, of these, the majority were excluded as they were expatriates who had just entered brunei darussalam or did not have 12 months of follow-up. despite these limitations, the study population was representative of the situation in brunei darussalam. the small number of cases may account for differences between our study and other literature with higher re-admission rates. studies on post-covid condition would likely capture more cases by survey rather than electronic records, as patients with milder conditions may self-manage and not present at a health-care facility. however, our study is unique in that our findings are representative of the whole country as all covid-19 cases were admitted to a single designated centre. in conclusion, our study showed that there were significantly more health-care visits 12 months after recovery from covid-19 compared with the 12 months prior to infection. however, most post-covid-19 healthcare utilization was due to scheduled covid-19 healthcare visits. post-covid condition was not officially diagnosed, and related symptoms were mild and selflimiting. however, our sample size was small and this is a limitation that needs to be taken into account. further studies are required with a larger sample size. the larger cohort of patients affected by the second wave in brunei darussalam would be ideal for further study. wpsar vol 14, no 1, 2023 | doi: 10.5365/wpsar.2023.14.1.949https://ojs.wpro.who.int/ 9 post-covid-19 health-care utilization in brunei darussalamabdullah et al 17. mccullough me, willoughby bl. religion, self-regulation, and self-control: associations, explanations, and implications. psychol bull. 2009;135(1):69–93. doi:10.1037/a0014213 pmid:19210054 18. tamin n, ahmed n, othman ie, md salleh na, nadeem t, mani bi, et al. imaging (chest radiographs) abnormalities in patients with covid-19 infection in brunei darussalam. brunei int med j. 2020;16:141–9. 19. axiaq a, almohtadi a, massias sa, ngemoh d, harky a. the role of computed tomography scan in the diagnosis of covid-19 pneumonia. curr opin pulm med. 2021;27(3):163–8. doi:10.1097/ mcp.0000000000000765 pmid:33560673 20. li h, zhao x, wang y, lou x, chen s, deng h, et al. damaged lung gas exchange function of discharged covid-19 patients detected by hyperpolarized 129xe mri. sci adv. 2021;7(1):eabc8180. doi:10.1126/sciadv.abc8180 pmid:33219111 21. chong vh, chong pl, metussin d, asli r, momin rn, mani bi, et al. conduction abnormalities in hydroxychloroquine add on therapy to lopinavir/ritonavir in covid-19. j med virol. 2020;92(11):2322– 4. doi:10.1002/jmv.26004 pmid:32401368 22. ren x, ren x, lou j, wang y, huang q, shi y, et al. a systematic review and meta-analysis of discharged covid-19 patients retesting positive for rt-pcr. eclinicalmedicine. 2021;34:100839. doi:10.1016/j.eclinm.2021.100839 pmid:33898952 23. abrokwa sk, müller sa, méndez-brito a, hanefeld j, el bcheraoui c. recurrent sars-cov-2 infections and their potential risk to public health – a systematic review. plos one. 2021;16(12):e0261221. doi:10.1371/journal.pone.0261221 pmid:34882750 24. abdullah ms, chong pl, asli r, momin rn, mani bi, metussin d, et al. post discharge positive re-tests in covid-19: common but clinically non-significant. infect dis (lond). 2020;52(10):743–5. doi:10.1080/23744235.2020.1780309 pmid:32579420 10. kim y, kim sw, chang hh, kwon kt, bae s, hwang s. significance and associated factors of long-term sequelae in patients after acute covid-19 infection in korea. infect chemother. 2021;53(3):463– 76. doi:10.3947/ic.2021.0022 pmid:34405592 11. menges d, ballouz t, anagnostopoulos a, aschmann he, domenghino a, fehr js, et al. burden of post-covid-19 syndrome and implications for healthcare service planning: a population-based cohort study. plos one. 2021;16(7):e0254523. doi:10.1371/ journal.pone.0254523 pmid:34252157 12. ramzi zs. hospital readmissions and post-discharge all-cause mortality in covid-19 recovered patients; a systematic review and meta-analysis. am j emerg med. 2022;51:267–79. doi:10.1016/j. ajem.2021.10.059 pmid:34781153 13. lemhöfer c, sturm c, loudovici-krug d, best n, gutenbrunner c. the impact of post-covid-syndrome on functioning – results from a community survey in patients after mild and moderate sarscov-2-infections in germany. j occup med toxicol. 2021;16(1):45. doi:10.1186/s12995-021-00337-9 pmid:34620202 14. iqbal a, iqbal k, arshad ali s, azim d, farid e, baig md, et al. the covid-19 sequelae: a cross-sectional evaluation of post-recovery symptoms and the need for rehabilitation of covid-19 survivors. cureus. 2021;13(2):e13080. doi:10.7759/cureus.13080 pmid:33680620 15. jennings g, monaghan a, xue f, mockler d, romero-ortuño r. a systematic review of persistent symptoms and residual abnormal functioning following acute covid-19: ongoing symptomatic phase vs. post-covid-19 syndrome. j clin med. 2021;10(24):5913. doi:10.3390/jcm10245913 pmid:34945213 16. eckersley rm. culture, spirituality, religion and health: looking at the big picture. med j aust. 2007;186(s10):s54–6. doi:10.5694/j.1326-5377.2007.tb01042.x pmid:17516885 https://ojs.wpro.who.int/ 1wpsar vol 14, no 1, 2023 | doi: 10.5365/wpsar.2023.14.1.973 regional analysis t he global burden of dengue, an emerging and reemerging mosquito-borne disease, increased from 2000 to 2019.1 an estimated 70% of dengue virus infections are thought to occur in asia.2 it has previously been reported that in the world health organization’s (who’s) western pacific region, the number of dengue cases increased from approximately 200 000 in 2008 to more than 450 000 in 2015.3 during this period, several countries and areas in the region experienced large-scale outbreaks.4–6 dengue is a public health threat because it is associated with large outbreaks in communities, severe disease and mortality.1 host immunity factors, such as serotype interaction, antibody-dependent enhancement and cross-immunity, complicate the clinical course, which leads to challenges in managing severe cases.1,7 additionally, socioeconomic and environmental factors, including climate change, drive disease transmission and complicate prevention and control activities. in response to these challenges, a revised western pacific regional action plan for dengue prevention and control was developed and endorsed at the 67th meeting of the regional committee for the western pacific in october 2016.3 the plan has guided countries and areas in the region on improving the laboratory diagnosis of dengue, and the clinical management, surveillance and sustainable vector management for the disease to reduce morbidity and mortality, and decrease impacts on health systems. sharing information and data about dengue helps countries and areas better understand transmission patterns and supports the implementation of dengue prevention and control measures.2 as a continuation of a health emergencies programme, world health organization regional office for the western pacific, manila, the philippines. b world health organization representative office for lao people’s democratic republic, vientiane, lao people’s democratic republic. c division of programmes for disease control, world health organization regional office for the western pacific, manila, the philippines. d world health organization representative office for viet nam, hanoi, viet nam. e world health organization representative office for china, beijing, china. f world health organization representative office for cambodia, phnom penh, cambodia. g world health organization representative office for the philippines, manila, the philippines. h division of pacific technical support, world health organization, suva, fiji. i world health organization representative office for malaysia, cyberjaya, malaysia. published: 22 march 2023 doi: 10.5365/wpsar.2023.14.1.973 the global burden of dengue, an emerging and re-emerging mosquito-borne disease, increased during the 20-year period ending in 2019, with approximately 70% of cases estimated to have been in asia. this report describes the epidemiology of dengue in the world health organization’s western pacific region during 2013–2019 using regional surveillance data reported from indicator-based surveillance systems from countries and areas in the region, supplemented by publicly available dengue outbreak situation reports. the total reported annual number of dengue cases in the region increased from 430 023 in 2013 to 1 050 285 in 2019, surpassing 1 million cases for the first time in 2019. the reported case-fatality ratio ranged from 0.19% (724/376 972 in 2014 and 2030/1 050 285 in 2019) to 0.30% (1380/458 843 in 2016). the introduction or reintroduction of serotypes to specific areas caused several outbreaks and rare occurrences of local transmission in places where dengue was not previously reported. this report reinforces the increased importance of dengue surveillance systems in monitoring dengue across the region. epidemiology of dengue reported in the world health organization’s western pacific region, 2013–2019 eri togami,a may chiew,b christopher lowbridge,a viema biaukula,a leila bell,a aya yajima,c anthony eshofonie,a dina saulo,a do thi hong hien,d satoko otsu,d tran cong dai,d mya sapal ngon,d chin-kei lee,e reiko tsuyuoka,b luciano tuseo,f asheena khalakdina,f vannda kab,f rabindra romauld abeyasinghe,g rajendra prasad yadav,g princess esguerra,g sean casey,h chun paul soo,i munehisa fukusumi,a tamano matsuia and babatunde olowokurea correspondence to babatunde olowokure (email: olowokureb@who.int) wpsar vol 14, no 1, 2023 | doi: 10.5365/wpsar.2023.14.1.973 https://ojs.wpro.who.int/2 togami et alepidemiology of dengue in the who western pacific region, 2013-2019 where c is the total dengue notification case count in a given year and p is the population estimate for the region in a given year. united nations population estimate data were used for calculations. population data for the pitcairn islands were not included in the united nations population database.12 therefore, we used the closest population estimates based on the pitcairn islands’ government website. in this report, an outbreak is defined as the “occurrence of cases of disease in excess of what would normally be expected in a defined community, geographical area or season”.13 results in the region, the total number of annual dengue cases reported increased from 430 023 cases from 22 countries and areas in 2013 to 1 050 285 cases from 18 countries and areas in 2019 (data not shown). the lowest annual number of cases during these 7 years was reported in 2014, with 376 972 cases. in 2019, the total number of reported dengue cases surpassed 1 million for the first time. from 2013 to 2019, the case-fatality ratio (cfr) fluctuated between 0.19% (724/376 972 reported in 2014 and 2030/1 050 285 in 2019) and 0.30% (1380/458 843 reported in 2016) (fig. 1). the number of cases reported from the pics did not show a clear trend, with more cases reported in 2013 and 2014 compared with 2015 and 2016 (fig. 2). there were challenges in calculating the cfrs for some countries due to limited reporting on dengue cases or deaths associated with dengue, or both. from 2013 to 2018, the crude annual case notification rates in the region ranged from a low of 19.82/100 000 population per year (95% confidence interval [ci]: 19.76–19.89) in 2014 to a high of 26.84/100 000 population per year (95% ci: 26.77–26.92) in 2015. in 2019, the case notification rate increased two-fold to 53.71/100 000 population per year (95% ci: 53.61– 53.81) (table 2). from 2013 to 2019, large-scale outbreaks with notable increases in the number of cases were reported in multiple countries. outbreaks were reported from the pics every year from 2013 to 2019. there were two notable years, 2017 and 2019, when multiple outbreaks were reported across the region, including in the pics, with seven countries reporting outbreaks. all dengue serotypes (denv-1, denv-2, denv-3 and denv-4) previous regional dengue epidemiology updates in 2010, 2011 and 2012,8–10 this analysis reports data collated by the who regional office for the western pacific to describe the epidemiology of dengue in the region from 2013 to 2019 using regional surveillance data. data from 2020 to 2021 were excluded due to changes in reporting practices, population movement and people’s behaviours as a result of the covid-19 pandemic. methods regional dengue data from 2013 to 2019 were collated from indicator-based surveillance systems from countries and areas in the region. information was also collected about laboratory sampling schemes and the confirmation methods used by each country and area. data were either sent to who by ministries of health or collected from official websites where they were publicly available. additional data – including serotype information, case definitions, and the numbers of clinically confirmed cases, laboratoryconfirmed cases and imported cases and deaths – were provided by australia, cambodia, japan, the republic of korea, malaysia, new zealand, pacific island countries and areas (pics), the philippines, singapore and viet nam. information was reported based on the standard dengue case definitions used in each country or area (table 1). missing data were supplemented by using official dengue outbreak situation reports published on reliefweb (https:// reliefweb.int/), manuscripts identified through pubmed using keywords [“dengue” and “outbreak” and “(country/ area name)”], yearly aggregated data collected from all countries and areas in the region through international health regulations (2005) channels, and who regional biweekly dengue reports.11 table 1 summarizes the dengue surveillance systems, case definitions, laboratory sampling methods and serotype data. it was not possible to compare trends between countries and areas due to the differences in surveillance methods and reporting practices. the crude regional case notification rate per 100 000 population per year was calculated using the number of cases and deaths reported to who and standard calculation methods: case notification rate per 100 000 population per year = (c/p) × 100 000 and 95% confidence interval = (100 000/p) (c ± 1.96 × √c), https://reliefweb.int/ https://reliefweb.int/ wpsar vol 14, no 1, 2023 | doi: 10.5365/wpsar.2023.14.1.973https://ojs.wpro.who.int/ 3 epidemiology of dengue in the who western pacific region, 2013-2019togami et al table 1. dengue clinical case definitions, and laboratory sampling and testing methods used for surveillance in countries, who western pacific region, 2019 country case definitiona laboratory sampling and testing method surveillance and case reportingclinically confirmed case laboratory confirmation required australia46 fever, headache, arthralgia, myalgia, rash, nausea or vomiting yes ns1, igg seroconversion, igm detection, nucleic acid or virus isolation. all clinically diagnosed cases have laboratory testing. all confirmed cases require both laboratorydefinitive evidence and clinical evidence. both confirmed and probable cases are nationally notifiable. cambodia47 suspected dengue: high fever (39–40 °c) for 2–7 days (usually 3–4 days), with two or more of the following signs: flushed face, headache, retroorbital pain, myalgia or arthralgia, cutaneous rash, haemorrhagic signs (e.g. petechiae, positive tourniquet test) and leucopoenia probable dengue: signs of suspected dengue plus laboratory test results (right column) or a case that occurred in an area where a dengue case has been confirmed no data are collected for the cambodia laboratory information system, composed of 32 hospital laboratories where ns1 detection is conducted. laboratory testing: antibody haemagglutination inhibition ≥1/1280 or igmor igg-positive by elisa in convalescent serum. suspected cases are reported from all national hospitals and all provincial hospitals, but not from private clinics. chinab more than two of the following symptoms: acute onset fever, severe headache, orbital pain, myalgia, arthralgia, fatigue, a history of travel in a dengue-endemic area during the 15 days before symptom onset or cohabitation with an individual with confirmed dengue, or no travel history but with a rash or positive tourniquet test and leucopoenia or thrombocytopenia or serum igm positivity no real-time pcr, ns1 in acute-phase serum or virus isolation from an acutely infected patient’s serum. both clinically confirmed and laboratory-confirmed cases are notified as an infectious disease. japan48 symptoms including acute onset of fever lasting for 2–7 days (commonly biphasic), headache, retro-orbital pain, arthralgia, myalgia, fatigue, conjunctivitis or rash and laboratory confirmation (right column) yes all clinically diagnosed cases have laboratory testing. laboratory confirmation requires at least one of the following: a positive pcr test, ns1 detection, serology (igm, seroconversion) and/or virus isolation. all reported cases have laboratory testing. lao people's democratic republic22 who 2009 dengue case classificationc no laboratory testing is conducted by rdt and pcr on a subset of specimens referred to the laboratories. serotyping is also conducted on a subset of specimens. clinically confirmed cases (dengue with and without warning signs and severe dengue cases) are reported. malaysia49 who 2009 dengue case classificationc yes all suspected cases are tested by the rapid combo test for ns1, igm and igg; elisa for the dengue antigen and serology, real-time pcr for detecting viral rna, or by viral isolation. all reported cases have laboratory testing. new zealand31,50 acute onset of fever; headache, particularly retro-orbital; myalgia and arthralgia; and a fine rash, which may be itchy and usually begins on the extremities but spares the palms and soles. other symptoms include weakness, depression, anorexia, abnormal taste, sore throat, coughing, vomiting and abdominal pain. no at least one of the following tests is required for laboratory confirmation: viral isolation, dengue virus (denv) nucleic acid amplification, igm or igg seroconversion, a significant increase in antibodies (four-fold or greater) by serological test. both clinically confirmed and laboratory-confirmed cases are reported. wpsar vol 14, no 1, 2023 | doi: 10.5365/wpsar.2023.14.1.973 https://ojs.wpro.who.int/4 togami et alepidemiology of dengue in the who western pacific region, 2013-2019 fig. 1. number of dengue cases and case-fatality ratios reported to who from the western pacific region, 2013–2019 elisa: enzyme-linked immunosorbent assay; igg: immunoglobulin g; igm: immunoglobulin m; mac-elisa: dengue igm capture elisa; ns1: rapid antigen diagnostic test to detect dengue virus non-structural protein; pcr: polymerase chain reaction; rdt: rapid diagnostic test. a only the minimum criteria required for fulfilling a clinical definition of dengue are included here; any additional signs and symptoms required for more severe forms are not listed. b data sourced from who internal communications. c in the who 2009 dengue classification system, a probable case is any case with fever and two or more of the following: nausea, vomiting, rash, aches and pains, positive tourniquet test, leucopoenia or any warning sign. a case with warning signs is defined as a clinically diagnosed case if they have any of the following: abdominal pain or tenderness, persistent vomiting, clinical fluid accumulation, mucosal bleeding, lethargy, restlessness, liver enlargement >2 cm, or increase in haematocrit concurrent with rapid decrease in platelet count. severe dengue is defined as severe plasma leakage leading to any of the following: shock, fluid accumulation with respiratory distress or severe bleeding as evaluated by clinician or severe organ involvement of the liver (i.e. aspartate amino transferase or alanine amino transferase ≥1000 units/l), central nervous system (i.e. impaired consciousness), heart or other organs. philippines51–53 who 2009 dengue case classificationc in addition, suspected cases are those who were previously well but have acute febrile illness for 2–7 days with clinical signs and symptoms of dengue. no a subset of suspected cases have laboratory testing. confirmed dengue is defined as a suspected case with positive viral culture isolation and/or pcr. probable dengue cases are ns1or igm-positive. suspected cases are reported. republic of korea54 acute onset of fever, headache, arthralgia, myalgia, leucopoenia, thrombocytopenia or bleeding and laboratory confirmation (right column) yes all clinically diagnosed cases have laboratory testing by real-time pcr or elisa (igm). all reported cases have laboratory testing. singapore55 a clinical case meets the criteria of fever, headache, backache, myalgia, rash, abdominal discomfort and thrombocytopenia. yes samples are tested by the laboratory as ordered by the physician. laboratory confirmation is done by dengue ns1 antigen testing, igm or pcr. all reported cases have laboratory testing. viet nam56 acute onset of fever lasting 2–7 days and at least two of the following: haemorrhagic manifestation or presentation, headache, loss of appetite, nausea, vomiting, rash, muscle pain, joint pain, orbital pain, lethargy, abdominal pain no mac-elisa is conducted for at least 7% of clinical cases and virus isolation is conducted for at least 3% of clinical cases. in an outbreak, at least 5–10 suspected cases are tested. both clinically confirmed and laboratory-confirmed cases are reported. � ���� ��� ���� ��� ���� ��� ���� ��� �������� �������� �������� �������� ��������� ��������� ���� ���� ���� ���� ���� ���� ���� �� �� ��� �� ��� �� �� ��� ��� � � �� �� ��� ��� �� �� �� �� �� � ���� ������� ���� �������� ������������������ ���� wpsar vol 14, no 1, 2023 | doi: 10.5365/wpsar.2023.14.1.973https://ojs.wpro.who.int/ 5 epidemiology of dengue in the who western pacific region, 2013-2019togami et al liver enlargement and increase in haematocrit with a rapid decrease in platelet count; and (iii) severe dengue, which is characterized by severe plasma leakage, severe haemorrhage and severe organ impairment. other countries used other case definitions (table 1). some countries and areas in the region report all identified cases of dengue, whereas others report only dengue cases at sentinel sites. in addition, some countries and areas conduct active surveillance or vector surveillance, or both (table 1). reporting by country and area data for dengue cases were available from 35 countries and areas during this study period, including eight with complete case and death data for all years of this study (table 3). data were not available for three countries and areas: the northern mariana islands, the pitcairn islands and tokelau. were reported in the region during the review period. concurrent infections with two serotypes were reported in some countries. while some countries reported the same predominant serotype from 2016 to 2018, others reported changes in the predominant serotype. additionally, there were reports of the introduction of a new serotype or switch in the predominant serotype, which was subsequently followed by outbreaks. rare cases of autochthonous transmission were reported in countries where most previously reported cases had been imported. laboratory sampling schemes and confirmation methods varied by country and area. some countries in this report were using the 2009 who dengue case classification system:14 (i) dengue without warning signs; (ii) dengue with warning signs that include abdominal pain or tenderness, persistent vomiting, clinical fluid accumulation, mucosal bleeding, lethargy or restlessness, the data included in this figure are a subset of the data presented in fig. 1. fig. 2. number of dengue cases reported to who from pacific island countries and areas, western pacific region, 2013–2019 n u m b er o f d en gu e ca se s year 40 000 35 000 30 000 25 000 20 000 15 000 10 000 5 000 2013 2014 2015 2016 2017 2018 2019 0 wpsar vol 14, no 1, 2023 | doi: 10.5365/wpsar.2023.14.1.973 https://ojs.wpro.who.int/6 togami et alepidemiology of dengue in the who western pacific region, 2013-2019 china during 2013–2019, china annually reported from 2050 to 46 864 cases (including both clinically and laboratoryconfirmed cases) and from 0 to 6 deaths. the highest number of cases and deaths were reported in 2014, with 46 864 cases and 6 deaths (cfr: 0.01%). several outbreaks were reported from the southern and central regions of china. yunnan province in 2013 reported 1245 cases with 136 that were laboratoryconfirmed, no deaths, and a predominant serotype of denv-3;17 henan province in 2013 reported 106 suspected cases, 73 confirmed cases and no deaths, with the predominant serotype being denv-3;18 guangdong province in 2014 accounted for more than 40 000 cases, including 1942 cases that were laboratory-confirmed and hospitalized and 2 deaths, where the predominant serotype among cases was denv-1.6 the introduction of a new serotype in china in 2017 caused an outbreak of 1138 autochthonous cases after multiple clades of denv-2 were introduced to hangzhou, zhejiang province, in a short period.19 during 2013–2019, hong kong special administrative region, china, annually reported between 102 and 163 cases. during 2013–2019, taiwan, china, annually reported between 10 and 43 467 cases, with the highest number of cases reported in 2015. during 2013–2018, asia subregion brunei darussalam brunei darussalam reported to who 2025 cases in 2013 and 436 cases and 2 deaths (cfr: 0.46%) in 2014. reports for other years were not available. cambodia during 2013–2019, cambodia annually reported from 6372 to 68 597 suspected cases and from 3 to 59 deaths. the highest number of cases was reported during an outbreak in 2019 that peaked between june and august, with more than 5000 cases reported in epidemiological week 26.15,16 the highest number of deaths (59) was reported in 2013 (cfr: 0.34%). in cambodia, serotyping was conducted from sentinel laboratory surveillance at five sentinel sites. the predominant serotype reported from 2013 to 2015 was denv-1, and in 2016, it switched to denv-2. from the end of 2017 to the end of 2019, the predominant serotype switched back to denv-1. this latter serotype switch preceded the large-scale outbreak in 2019, during which 73% (details on numerators and denominators are not available) of all serotyped samples between january and july 2019 were denv-1, and the next most common serotype was denv-2 (25%), followed by denv-4 (2.2%) and denv-3 (0.3%). table 2. crude regional case notification rates for dengue reported to who from the western pacific region, 2013–2019 year number of cases reported in the region population in the regiona case notification / 100 000 population per yearb 95% confidence interval 2013 430 023 1 889 727 401 22.76 22.69–22.82 2014 376 972 1 901 609 413 19.82 19.76–19.89 2015 513 574 1 913 189 733 26.84 26.77–26.92 2016 458 843 1 924 437 124 23.84 23.77–23.91 2017 454 231 1 935 317 876 23.47 23.40–23.54 2018 479 263 1 945 715 729 24.63 24.56–24.70 2019 1 050 285 1 955 495 216 53.71 53.61–53.81 a population data were extracted from united nations population estimates.12 b crude notification rates in the region should be interpreted with caution, considering that the risks of disease and population sizes vary substantially across the region, as well as the surveillance systems used to determine cases of dengue. wpsar vol 14, no 1, 2023 | doi: 10.5365/wpsar.2022.14.1.973https://ojs.wpro.who.int/ 7 epidemiology of dengue in the who western pacific region, 2013-2019togami et al table 3. number of dengue cases (including imported cases), number of dengue-attributed deaths and case-fatality ratios reported to who from the western pacific region, 2013–2019a country or area year 2013 2014 2015 2016 2017 2018 2019 no. of cases no. of deaths cfr (%) no. of cases no. of deaths cfr (%) no. of cases no. of deaths cfr (%) no. of cases no. of deaths cfr (%) no. of cases no. of deaths cfr (%) no. of cases no. of deaths cfr (%) no. of cases no. of deaths cfr (%) asia subregion brunei darussalam 2025 – – 436 2 0.46 – – – – – – – – – – – – – – – cambodia 17 533 59 0.34 3684 21 0.57 15 412 – – 12 843 – – 6372 3 0.05 24 684 23 0.09 68 597 48 0.07 china 4663 0 0.00 46 864 6 0.01 3858 0 0.00 2050 0 0.00 5893 2 0.03 5136 1 0.02 22 188 3 0.01 china, hong kong special administrative region 103 0 0.00 112 0 0.00 114 0 0.00 124 – – 102 – – 163 – – 198 – – china, macao special administrative region 9 – – 17 0 0.00 3 0 0.00 11 – – 17 – – 18 – – – – – china, taiwan 596 – – 15 509 0 0.00 43 467 0 0.00 381 – – 10 – – 183 – – 100 – – japan 249 0 0.00 341 0 0.00 293 0 0.00 338 1 0.30 245 0 0.00 201 0 0.00 463 0 0.00 lao people's democratic republic 44 250 95 0.21 1716 0 0.00 1959 0 0.00 5618 10 0.18 11 067 14 0.13 6446 19 0.29 39 091 76 0.19 malaysia 43 346 92 0.21 108 698 215 0.20 120 836 336 0.28 109 037 237 0.22 89 487 177 0.20 81 360 147 0.18 130 101 147 0.11 mongolia 0 0 na 0 0 na 0 0 na – – – – – – – – – – – – philippines 204 906 660 0.32 113 485 425 0.37 213 930 647 0.30 220 518 1092 0.50 152 224 811 0.53 216 190 1083 0.50 437 563 1689 0.39 republic of korea 251 0 0.00 164 0 0.00 259 0 0.00 313 0 0.00 171 0 0.00 159 0 0.00 273 0 0.00 singapore 22 170 8 0.04 18 326 6 0.03 11 294 6 0.05 13 085 12 0.09 2767 2 0.07 3283 6 0.18 15 999 3 0.02 viet nam 66 322 42 0.06 31 848 30 0.09 97 484 62 0.06 91 609 28 0.03 172 232 40 0.02 131 447 27 0.02 320 702 54 0.02 total for subregion 406 423 956 0.24 341 200 705 0.21 508 909 1051 0.21 455 927 1380 0.30 440 587 1049 0.24 469 270 1306 0.28 1 035 275 2020 0.20 pacific subregion american samoa – – – – – – 479 4 0.84 0 0 0.00 – – – – – – – – – australia 1841 0 0.00 1721 0 0.00 1716 0 0.00 2237 0 0.00 1132 1 0.09 917 0 0.00 1463 1 0.07 cook islands – – – 946 0 0.00 765 0 0.00 0 – – 0 – – 0 – – 126 0 0.00 fiji 352 0 0.00 26 595 16 0.06 – – – 398 0 0.00 2699 9 0.33 4000 9 0.23 2500 0 0.00 french polynesia 1523 0 0.00 2155 0 0.00 – – – – – – – – – – – – 2400 0 0.00 guam – – – – – – – – – – – – – – – – – – 23 – – kiribati – – – – – – – – – 0 – – 0 – – 1899 2 0.11 – – – marshall islands – – – – – – – – – – – – – – – – – – 1635 1 0.06 micronesia (federated states of) 217 0 0.00 14 0 0.00 1 0 0.00 90 0 0.00 0 – – 0 – – 1464 1 0.07 nauru – – – 251 – – – – – 0 – – 964 3 0.31 114 0 0.00 – – – new caledonia 9958 4 0.04 – – – – – – – – – 4200 11 0.26 1997 0 0.00 3916 2 0.05 new zealand 106 0 0.00 179 0 0.00 125 0 0.00 191 0 0.00 161 0 0.00 294 0 0.00 224 0 0.00 niue – – – – – – – – – 0 – – 2 – – – – – – – – northern mariana islands – – – – – – – – – – – – – – – – – – – – – palau 9 0 0.00 13 2 15.38 20 0 0.00 – – – 440 5 1.14 570 2 0.35 737 3 0.41 papua new guinea – – – 6 – – – – – – – – – – – – – – – – – pitcairn islands – – – – – – – – – – – – – – – – – – – – – samoa – – – – – – – – – – – – 2724 5 0.18 – – – – – – solomon islands 9500 8 0.08 1872 1 0.05 – – – – – – – – – – – – – – – tokelau – – – – – – – – – – – – – – – – – – – – – tonga – – – 51 0 0.00 1559 0 0.00 – – – 100 0 0.00 – – – – – – tuvalu – – – 408 – – – – – – – – – – – – – – 522 2 0.38 vanuatu – – – 1561 – – – – – – – – >1000 – – – – – – – – wallis and futuna 94 – – – – – – – – – – – 222 0 0.00 202 – – – – – total for subregion 23 600 12 0.05 35 772 19 0.05 4665 4 0.09 2916 0 0.00 13 644 34 0.23 9993 13 0.13 15 010 10 0.05 total 430 023 968 0.23 376 972 724 0.19 513 574 1055 0.21 458 843 1380 0.30 454 231 1083 0.24 479 263 1319 0.28 1 050 285 2030 0.19 cfr: case-fatality ratio; na: cannot be calculated a the – symbol indicates that no data were available. wpsar vol 14, no 1, 2023 | doi: 10.5365/wpsar.2023.14.1.973 https://ojs.wpro.who.int/8 togami et alepidemiology of dengue in the who western pacific region, 2013-2019 malaysia during 2013–2019, malaysia annually reported between 43 346 and 130 101 laboratory-confirmed cases and 92 to 336 deaths. no imported cases were reported from 2016 to 2018. malaysia launched the web-based e-notification system and e-dengue system in 2014, and all registered dengue cases since january 2014 have been laboratory-confirmed. more than 100 000 cases were reported in 2014, 2015, 2016 and 2019. all four serotypes were reported in malaysia, with the predominant serotype differing each year from 2016 to 2018, with significant cocirculation. in 2016, the predominant serotype was denv-1 (40%, 2211/5482), followed by denv-3 (32%, 1745/5482), denv-2 (25%, 1381/5482) and denv-4 (3%, 145/5482). in 2017, the predominant serotype was denv-3 (41%, 2200/5420), followed by denv-2 (35%, 1887/5420), denv-1 (23%, 1245/5420) and denv-4 (2%, 88/5420). in 2018, the predominant serotype was denv-2 (47%, 2608/5544), followed by denv-3 (33%, 1833/5544), denv-1 (19%, 1055/5544) and denv-4 (1%, 48/5544). mongolia during 2013–2015, mongolia reported no dengue cases and no deaths. data for 2016–2019 were not available. the philippines during 2013–2019, the philippines annually reported between 113 485 and 437 563 suspected dengue cases and 425 to 1689 deaths. among these suspected cases, 1488 cases in 2016, 1333 cases in 2017 and 998 cases in 2018 were laboratory-confirmed. the highest number of cases and deaths were reported during a large-scale outbreak in 2019, with 437 563 cases and 1689 deaths (cfr: 0.39%). all four serotypes were reported from the philippines. in 2016, the predominant serotype among 1488 cases tested was denv-1 (44%, 659/1488), followed by denv-3 (26%, 384/1488), denv-2 (24%, 349/1488) and denv-4 (6%, 95/1488); 1 case tested positive for both denv-1 and denv-2 (0.1%, 1/1488). in 2017, the predominant serotype among 1333 cases tested was denv-3 (60%, 795/1333), followed by denv-1 (24%, 318/1333), denv-2 (12%, 164/1333) and denv-4 (4%, macao special administrative region, china, annually reported between 3 and 18 cases. japan during 2013–2019, japan annually reported between 201 and 463 laboratory-confirmed cases, with 1 death reported in 2016. in 2014, an outbreak of 162 autochthonous dengue cases was reported for the first time in nearly 70 years, of which more than 90% (148/160, from available data) had visited or worked near parks in central tokyo, and the dominant serotype was denv1.5,20,21 all cases reported from 2016 to 2018 were imported. the predominant serotype was denv-2 (36% [61/172] of cases in 2016, 35% [39/113] in 2017, 42% [34/81] in 2018), followed by denv-3 (23% [39/172] of cases in 2016, 27% [31/113] in 2017, 31% [25/81] in 2018), denv-1 (31% [54/172] of cases in 2016, 27% [31/113] in 2017, 24% [19/81] in 2018) and denv-4 (11% [18/172] of cases in 2016, 11% [12/113] in 2017, 4% [3/81] in 2018). in 2019, 17% (78/463) of serotyped cases were denv-1, 16% (74/463) were denv-2, 9% (40/463) were denv-3 and 3% (16/463) were denv-4. lao people’s democratic republic during 2013–2019, the lao people’s democratic republic annually reported between 1716 and 44 250 clinically confirmed cases and 0 to 95 deaths. in 2013, the country reported the largest dengue outbreak in its history,22 with 44 250 cases and 95 deaths reported nationwide. in the southern part of the country alone, 4638 cases and 32 deaths were reported, among which denv-2, denv-3 and chikungunya virus were detected, as were concurrent infections with more than one serotype of denv, or denv and chikungunya virus.23 more than 90% (numerator not available) of 537 samples serotyped in 2013 were denv-3.24 in 2015, an outbreak was reported as predominantly due to denv-1.24 in 2019, there was a dengue outbreak with 39 091 cases reported and 76 deaths (cfr: 0.19%), and 65% (numerator not available) of 1178 specimens collected and serotyped were found to be denv-2.24 the predominant serotypes during outbreaks in 2013, 2015 and 2019 were attributed to three different serotypes, indicating two serotype switches.24 wpsar vol 14, no 1, 2023 | doi: 10.5365/wpsar.2023.14.1.973https://ojs.wpro.who.int/ 9 epidemiology of dengue in the who western pacific region, 2013-2019togami et al and denv-1 (20%, 240). denv-4 was reported from 2% (n = 67) of cases in 2016, 10% (77) in 2017 and 4% (47) in 2018. viet nam during 2013–2019, viet nam annually reported between 66 322 and 320 702 cases (including both clinically and laboratory-confirmed cases) and 27 to 62 deaths. more than 100 000 cases were reported in 2017, 2018 and 2019; notably, 320 702 cases were reported in 2019. during the outbreak in 2017, more than 59 000 cases were reported in northern viet nam, eight times higher than the number of cases in 2016.26 all four serotypes were reported from viet nam during 2016–2018. in 2016, the predominant serotype was denv-1 (61%, 1104/1803), followed by denv-4 (25%, 453/1803), denv-2 (13%, 240/1803) and denv-3 (0.3%, 6/1803). in 2017, the predominant serotype was denv-1 (72%, 2057/2870), followed by denv-2 (21%, 607/2870), denv-4 (7%, 204/2870) and denv-3 (0.1%, 2/2870). in 2018, the predominant serotype changed to denv-2 (50%, 988/1980), followed by denv-1 (33%, 661/1980), denv-4 (17%, 328/1980) and denv-3 (0.2%, 3/1980). pacific subregion australia during 2013–2019, australia annually reported between 917 and 2237 laboratory-confirmed cases and 0 to 1 death. more than 1700 cases were reported annually in 2013, 2014, 2015 and 2016; in 2016, 2237 cases were reported. during 2016–2018, more than 98% of reported cases were imported (2204/2237 in 2016, 1113/1132 in 2017 and 907/917 in 2018). in australia, dengue cases occur each year in north queensland, generally originating from an imported case, although in 2019 an outbreak associated with 13 locally acquired cases was reported for the first time in decades in the rockhampton region, queensland.27,28 all four serotypes were reported from australia, with the predominant serotype being denv-2 (44% [468/1052 of known and serotyped cases] in 2016, 56% [246/436] in 2017, 43% [120/282] in 2018), followed in 2016 by denv-3 (24%, 257/1052), denv-1 (19%, 47/1333); 2 cases tested positive for denv-1 and denv2 (0.2%, 2/1333), 5 cases tested positive for denv-1 and denv-3 (0.4%, 5/1333) and 2 cases tested positive for denv-2 and denv-3 (0.2%, 2/1333). in 2018, the predominant serotype among 998 cases tested was denv-3 (60%, 598/998), followed by denv-1 (22%, 223/998), denv-2 (15%, 149/998) and denv-4 (3%, 25/988); 2 cases tested positive for denv-1 and denv3 (0.2%, 2/988) and 1 case tested positive for denv-2 and denv-3 (0.1%, 1/988). in 2019, the predominant serotype among the 100 cases with serotype data available was denv-3 (64%), followed by denv-2 (18%), denv-1 (15%) and denv-4 (3%).25 republic of korea during 2013–2019, the republic of korea annually reported between 164 and 313 laboratory-confirmed cases and no deaths. the highest number of cases was reported in 2016. all cases reported from 2016 to 2018 were imported, comprising all four serotypes. in 2016, the predominant serotype was denv-1 (38%, 57/149), followed by denv-2 (35%, 52/149), denv-3 (20%, 30/149) and denv-4 (7%, 10/149). in 2017, the predominant serotype among imported cases was denv1 (44%, 38/86), followed by denv-3 (23%, 20/86), denv-2 (19%, 16/86) and denv-4 (14%, 12/86). in 2018, the predominant serotype among imported cases was denv-2 (37%, 35/96), followed by denv-1 (33%, 32/96), denv-3 (28%, 27/96) and denv-4 (2%, 2/96). singapore during 2013–2019, singapore annually reported between 2767 and 22 170 laboratory-confirmed cases and 2 to 12 deaths. large numbers of cases were reported during outbreaks in 2013, 2014, 2015 and 2019. the numbers of reported cases were low in 2017 and 2018. among the 20 deaths reported during 2016–2018, 14 were autochthonous cases and the rest were imported cases. all four serotypes were reported from singapore; however, denominators were not available, so the percentage for each serotype is reported along with the number of positive cases. the predominant serotypes from 2016 to 2018 were denv-2 (51% [2257 positive cases] in 2016, 45% [361] in 2017 and 52% [637] in 2018), followed by in 2016 denv-1 (29%, 278 positive cases) then denv3 (18%, 806), and in 2017 denv-3 (24%, 192) then denv-1 (21%, 171), and in 2018 denv-3 (25%, 305) wpsar vol 14, no 1, 2023 | doi: 10.5365/wpsar.2023.14.1.973 https://ojs.wpro.who.int/10 togami et alepidemiology of dengue in the who western pacific region, 2013-2019 cook islands the cook islands reported clinically confirmed cases to who using the 2009 who dengue case classification system. in 2014, the cook islands reported 946 cases and no deaths, and in 2015 the islands reported 765 cases and no deaths (cfr: 0%). no cases were reported to who during 2016–2018. in 2019, a dengue outbreak was declared in february, with 41 confirmed cases and 85 probable, 48 hospitalizations and no deaths.32 the predominant serotype in 2019 was denv-1, accounting for 93% (35/38) of cases with available serotype information. additionally, 3 cases who were tourists with a history of travelling to french polynesia were confirmed with denv-2 in october 2019.33 fiji during 2013–2018, fiji annually reported between 352 and 26 595 cases and 0 to 16 deaths. fiji reported clinically confirmed cases to who using the 2009 who dengue case classification system. samples from different health divisions were tested using rt-pcr, an antigen rapid diagnostic test (ns1) and an enzymelinked immunosorbent assay (elisa). an outbreak was reported in 2014 of at least 26 595 cases (more than 27 000 reported according to some sources) and 16 deaths (cfr: 0.06%). from 2017 to 2018, an outbreak was reported, for which the predominant serotype was denv-2.34 french polynesia french polynesia used the 2009 who dengue case classification system, and the laboratory method for confirmation was rt-pcr. in 2013, french polynesia reported 1523 dengue cases associated with an outbreak, with 258 being laboratory-confirmed; during the outbreak, 70% (170/244) of cases with the serotype identified had denv-1 infections, 30% (73/244) had denv-3 infections (genotype iii) and 0.4% (1/244) had coinfection with both serotypes.35 denv-3 was reported to have been introduced from south america.35 in 2014, 2155 confirmed and 34 000 suspected cases were reported in french polynesia, and outbreaks were also reported in 2016 and 2017. in 2016 and 2017, denv-1 was reported, and in 2018, denv-2 was reported. in april 2019, an outbreak of denv-2 was declared, with 2400 autochthonous cases reported.36 202/1052) and denv-4 (12%, 125/1052); in 2017 by denv-1 (20%, 88/436), denv-3 (13%, 57/436) and denv-4 (10%, 45/436); and in 2018 by denv-1 (30%, 86/282), denv-3 (20%, 55/282) and denv-4 (7%, 21/282). in addition to these serotyped cases, concurrent infection with two serotypes was reported in 2016 and 2017. in 2016, concurrent infections were reported with denv-1 and denv-2 (1 case), denv-2 and denv-3 (1 case), and denv-3 and denv-4 (4 cases); in 2017, concurrent infection with denv-1 and denv-4 was reported in 1 case; in 2019, concurrent infection with denv-3 and denv-4 was reported in 1 case. new zealand during 2013–2019, new zealand annually reported between 106 and 294 cases (including both clinically confirmed and laboratory-confirmed cases, although most are laboratory-confirmed); during 2016–2019, no deaths were reported. among reported cases, 98% (158/161) were laboratory-confirmed in 2017, 95% (280/294) in 2018 and 98% (219/224) in 2019.29–31 the largest number of cases was reported in 2018, at 294 cases. in 2016, two dengue fever outbreaks were reported that involved 12 cases. during 2013–2019, all cases reported in new zealand were imported (information on travel history was not available for 1 case in 2015 and 2 cases in 2019). all four serotypes were reported from new zealand. in 2016, the predominant serotype was denv-3 (63%, 59/93), followed by denv-2 (20%, 19/93), denv-1 (11%, 10/93) and denv-4 (5%, 5/93). in 2017 and 2018, the predominant serotype was denv-2 (83% [82/99] and 84% [167/200], respectively), followed by denv-1 (10% [10/99] and 9% [18/200], respectively), denv-3 (6% [6/99] and 5% [9/200], respectively) and denv-4 (1% [1/99] and 3% [6/200], respectively). american samoa american samoa reported clinically confirmed cases to who using the 2009 who dengue case classification system. laboratory confirmation is conducted to confirm outbreaks using reverse transcription polymerase chain reaction (rt-pcr) or an antigen rapid diagnostic test (ns1). in 2015, american samoa reported 479 cases and 4 deaths (cfr: 0.84%). outbreaks were also reported in 2017 and 2018, but the total numbers of cases are not available. wpsar vol 14, no 1, 2023 | doi: 10.5365/wpsar.2023.14.1.973https://ojs.wpro.who.int/ 11 epidemiology of dengue in the who western pacific region, 2013-2019togami et al nauru nauru reported clinically confirmed cases to who using the 2009 who dengue case classification system. laboratory testing to confirm outbreaks uses rt-pcr or an antigen rapid diagnostic test (ns1). nauru reported 251 cases in 2014, no cases in 2016, 964 cases and 3 deaths in 2017 and 114 cases and no deaths in 2018. in 2017, denv-2 was reported and in 2018, denv-1 was reported. new caledonia new caledonia reported cases to who using the 2009 who dengue case classification system and rt-pcr for laboratory confirmation. in 2013, new caledonia reported 9958 cases including 4 deaths during an outbreak in which the predominant serotype was denv-1.39 based on available information, an outbreak was also reported in 2014. in 2017, 4200 cases and 11 deaths were reported, with denv-1, denv-2 and denv-3 detected. from november 2018 to september 2019, a dengue outbreak was declared. from 1 january to 31 december 2019, 3916 cases, 368 hospitalizations and 2 deaths were reported. among the 316 cases with serotype information available, the predominant serotype was denv-2. two cases of denv-1 and 1 case of denv4 were imported from french polynesia and indonesia, respectively.40 niue niue reported clinically confirmed cases to who. in niue, 2 cases were reported in 2017. in 2018, denv-2 was reported, but information on the number of cases was not available. palau palau reported cases to who using the 2009 who dengue case classification system and rt-pcr or an antigen rapid diagnostic test (ns1) for laboratory testing to confirm outbreaks. during 2013–2017, palau annually reported between 9 and 737 cases and 0 to 5 deaths. outbreaks were reported in 2016 and again in 2017, the latter comprising 440 cases and 5 deaths, with a predominant serotype of denv-2. in 2018, 570 cases and 2 deaths were reported, and in 2019, there were guam guam reported clinically confirmed cases to who: 23 cases were reported in 2019, with no further information available. kiribati kiribati reported clinically confirmed cases to who using the 2009 who dengue case classification system. laboratory testing to confirm outbreaks is conducted using rt-pcr or an antigen rapid diagnostic test (ns1). in kiribati, outbreaks were reported in 2013 and 2014, and no cases were reported in 2016 and 2017. in 2018, 1899 cases and 2 deaths were reported, with denv-2 detected. republic of the marshall islands in the republic of the marshall islands, outbreaks were reported in 2013 and 2014. in 2019, a denv-3 outbreak was reported with at least 1395 cases of dengue-like illness, including 431 laboratory-confirmed cases and 1 death.37 a health emergency was declared in relation to this event; internal movement restrictions were imposed between the affected and unaffected islands; and emergency medical teams were deployed to support the dengue response. federated states of micronesia the federated states of micronesia reported clinically confirmed cases to who using the 2009 who dengue case classification system. laboratory methods used to confirm outbreaks include rt-pcr and an antigen rapid diagnostic test (ns1). there were 217 cases reported to who in 2013, associated with an outbreak of 729 suspected dengue cases and no deaths in kosrae from september 2012 to march 2013. denv-4 was detected from 3 specimens collected during this period; 11% (728/6600) of kosrae residents met the case definition for suspected dengue, and almost 4% (242/6600) were hospitalized.38 in 2018, denv-4 was reported. in 2019, 1464 dengue cases including 1 death were reported from yap state, and the predominant serotype was denv-3. the dengue outbreak in 2019 coincided with a concurrent leptospirosis outbreak in yap state, and an executive order determining a public health crisis was issued. wpsar vol 14, no 1, 2023 | doi: 10.5365/wpsar.2023.14.1.973 https://ojs.wpro.who.int/12 togami et alepidemiology of dengue in the who western pacific region, 2013-2019 tuvalu tuvalu reported cases to who using the 2009 who dengue case classification system. in tuvalu, 408 cases were reported in 2014. in march 2019, a dengue outbreak was declared. in 2019, 522 cases were reported, including at least 21 hospitalizations and 2 deaths in children. the predominant serotype in the 2019 outbreak was denv-1. vanuatu vanuatu reported clinically confirmed cases to who. in vanuatu, 1561 cases were reported in 2014 and more than 1000 cases were reported in 2017; denv-2 was reported in 2018. wallis and futuna wallis and futuna reported cases to who using the 2009 who dengue case classification system. in wallis and futuna, 94 cases were reported in 2013. in 2017, an outbreak was declared in november, with 222 cases and no deaths, and denv-1 was identified from 2 samples. in 2018, 202 cases and denv-1 were reported. in november 2019, an outbreak was declared in wallis and futuna, and 30 confirmed cases were reported from february to december 2019, with the predominant serotype being denv-2.43 discussion dengue continued to pose a health burden in the region during 2013–2019, with the number of annually reported cases ranging from a little more than 430 000 to more than 1 million and with the annual number of reported deaths ranging from 724 to 2025. outbreaks were reported from the region every year during the study period. the introduction or reintroduction of serotypes to specific areas caused several outbreaks and rare occurrences of local transmission in places where dengue had not been previously reported. with support from countries and areas, who continued to share timely information during the study period through its biweekly dengue epidemiological reports for the region11 and conducted regional and country-specific risk assessments to inform dengue prevention and control efforts. 737 cases including 3 deaths. from december 2018 to september 2019, 160 cases were confirmed as denv-3. two serotypes were reported from palau; denv-2 was reported in 2016 and 2017, and denv-3 was reported in 2018. papua new guinea in 2014, papua new guinea reported 6 cases. further information was not available. samoa samoa reported cases to who using the 2009 who dengue case classification system and rt-pcr or an antigen rapid diagnostic test (ns1) to confirm outbreaks. in samoa, outbreaks were reported in 2015 and 2016. in 2017, 2724 cases and 5 deaths were reported, with the predominant serotype being denv-3. in 2018, denv-2 was reported. solomon islands the solomon islands reported cases to who using the 2009 who dengue case classification system. in the solomon islands in 2013, 9500 cases and 8 deaths (cfr: 0.10%) were associated with an outbreak in honiara. denv-3 genotype i was isolated from specimens collected during this outbreak, suggesting introduction from south-east asia after 18 years of dengue absence in the pics.35 in 2014, 1872 cases and 1 death (cfr: 0.05%) were reported. the introduction of denv-2 to the solomon islands resulted in outbreaks in 2016 and 2017.41,42 from september 2016 to april 2017, an outbreak of denv-2 was reported in 9 of 10 provinces in the solomon islands, with 12 329 suspected cases, including 1510 cases positive by dengue rapid diagnostic test, and 16 deaths.42 an outbreak was also reported in 2019. tonga tonga reported cases to who using the 2009 who dengue case classification system. in tonga, 51 cases and no deaths were reported in 2014; 1559 cases and no deaths were reported in 2015; and more than 100 cases were reported in 2017. wpsar vol 14, no 1, 2023 | doi: 10.5365/wpsar.2023.14.1.973https://ojs.wpro.who.int/ 13 epidemiology of dengue in the who western pacific region, 2013-2019togami et al whether the infection was locally acquired or imported. these details will also support risk assessments for and responses to events with new epidemiological patterns, such as outbreaks associated with the introduction or reintroduction of serotypes to specific areas, as well as rare occurrences of local transmission in places where it was not previously reported. furthermore, in some settings, the capacities for surveillance, outbreak response, clinical management and diagnosis may be limited. several approaches could fill these gaps, including strengthening laboratory capacity and laboratory networks, institutionalizing active surveillance to detect dengue cases who are self-managed and inapparent, and implementing integrated vector surveillance. although several countries and areas have adopted the 2009 who dengue case classification system,14 there are differences in countries and areas across the region in surveillance methodology, including whether universal or sentinel reporting is used; laboratory sampling schemes and confirmation methods; and reporting practices. these differences are a limitation of this report, indicating why comparison across countries should be avoided and comparisons within one country should be informed by the local reporting practices, which may change over time. as a result of differences in case definitions and other factors, there is likely to be underreporting and, thus, an underestimation of the true regional burden in terms of the number of cases, cfrs and incidence.1,2 despite these limitations, continued reporting of dengue in line with the regional action plan is important to guide public health authorities in their national and subnational response efforts. the burden of dengue, including the increased risks of dengue outbreaks, will continue amid other public health emergencies. disaggregating data by age and sex at all levels will enable public health authorities to implement improved and targeted response measures. additional information about cases, including their travel history and serotype, should also be routinely collected and reported. the region’s capacity to mitigate the impact of dengue can be strengthened by making a shift in its management, from a reactive, acute outbreak response to one that reduces fatalities through undertaking activities, including sustainable implementation of mosquito control measures, engaging communities to raise their awareness about the risk of dengue and to communicate the increases in reported cases and regional case incidence may be attributed to several factors. first, a true increase in dengue incidence may have occurred due to expanding urbanization and increasing population size and density, particularly in settings with increased exposure to competent dengue vectors and mosquito breeding grounds.44 shifts in ecological factors due to climate change, such as intensified rainy seasons and higher ambient temperatures, have expanded the geographical range of aedes mosquitos globally during the past 50 years and led to intensified dengue transmission.45 second, increased international travel and trade have led to the importation of cases with different serotypes and the introduction of mosquito eggs through the importation of goods to areas where the population is susceptible and competent mosquitos exist.44,45 third, reports to national health authorities likely increased due to strengthened surveillance systems and diagnostic capacities, including laboratory networks that supported confirmatory diagnosis in the pics, as well as an emphasis on risk communication activities to improve the awareness of dengue among the public.3 the range of cfrs may be associated with differences in case reporting, the timing of the case presentation to health-care facilities and clinical management. the number of cases reported in 2019 was higher than in the years from 2013 to 2018, and the cfr was relatively low. this increase in 2019 included at least 14 countries and areas that reported dengue outbreaks in the region, including large-scale outbreaks; during 2019, four countries and areas in the asia subregion and three in the pacific subregion reported their highest number of cases of the 7-year study. it is possible that case detection and reporting increased due to improved awareness of dengue among health-care professionals and the public because of the large outbreaks. these outbreaks may have also increased health-care-seeking behaviour, leading to fewer deaths, thereby decreasing the cfr. our findings show that there is a substantial burden of dengue in the region and that it continues to increase over time. however, dengue surveillance practices throughout the region are inconsistent and require strengthening. to inform national and regional risk assessments and actions, information is required not only on the time, place and demographics of a case, such as age and sex, but also on the denv serotype and wpsar vol 14, no 1, 2023 | doi: 10.5365/wpsar.2023.14.1.973 https://ojs.wpro.who.int/14 togami et alepidemiology of dengue in the who western pacific region, 2013-2019 6. zhao h, zhang fc, zhu q, wang j, hong wx, zhao lz, et al. epidemiological and virological characterizations of the 2014 dengue outbreak in guangzhou, china. plos one. 2016;11(6):e0156548. doi:10.1371/journal.pone.0156548 pmid:27257804 7. aguas r, dorigatti i, coudeville l, luxemburger c, ferguson nm. cross-serotype interactions and disease outcome prediction of dengue infections in vietnam. sci rep. 2019;9(1):9395. doi:10.1038/ s41598-019-45816-6 pmid:31253823 8. arima y, chiew m, matsui t; emerging disease surveillance and response team, division of health security and emergencies. epidemiological update on the dengue situation in the western pacific region, 2012. western pac surveill response j. 2015;6(2):82-9. doi:10.5365/wpsar.2014.5.4.002 pmid:26306221 9. arima y, edelstein zr, han hk, matsui t. epidemiologic update on the dengue situation in the western pacific region, 2011. western pac surveill response j. 2013;4(2):47–54. doi:10.5365/wpsar.2012.3.4.019 pmid:24015372 10. arima y, matsui t. epidemiologic update of dengue in the western pacific region, 2010. western pac surveill response j. 2011;2(2):4– 8. doi:10.5365/wpsar.2011.2.2.005 pmid:23908882 11. surveillance – dengue. manila: who regional office for the western pacific; 2022. available from: https://www.who.int/westernpacific/ emergencies/surveillance/dengue, accessed 17 june 2022. 12. world population prospects 2022. new york: united nations department of economic and social affairs; 2022. available from: https://population.un.org/wpp/, accessed 30 october 2022. 13. disease outbreaks. cairo: who regional office for the eastern mediterranean; 2022. available from: http://www.emro.who.int/healthtopics/disease-outbreaks/index.html, accessed 15 july 2022. 14. dengue guidelines for diagnosis, treatment, prevention and control: new edition. geneva: world health organization; 2009. available from: https://apps.who.int/iris/handle/10665/44188, accessed 17 june 2022. 15. dengue increase likely during rainy season: who warns. manila: who regional office for the western pacific; 2019. available from: https://www.who.int/westernpacific/news/detail/11-06-2019dengue-increase-likely-during-rainy-season-who-warns, accessed 17 june 2022. 16. dengue situation update number 585. manila: who regional office for the western pacific; 2020. available from: https://apps. who.int/iris/bitstream/handle/10665/330698/dengue-20200102. pdf?sequence=1, accessed 17 june 2022. 17. zhang fc, zhao h, li lh, jiang t, hong wx, wang j, et al. severe dengue outbreak in yunnan, china, 2013. int j infect dis. 2014;27:4– 6. doi:10.1016/j.ijid.2014.03.1392 pmid:25107464 18. huang xy, ma hx, wang hf, du yh, su j, li xl, et al. outbreak of dengue fever in central china, 2013. biomed environ sci. 2014;27(11):894–7. doi:10.3967/bes2014.125 pmid:25374022 19. yu h, kong q, wang j, qiu x, wen y, yu x, et al. multiple lineages of dengue virus serotype 2 cosmopolitan genotype caused a local dengue outbreak in hangzhou, zhejiang province, china, in 2017. sci rep. 2019;9(1):7345. doi:10.1038/s41598-019-43560-5 pmid:31089152 20. kutsuna s, kato y, moi ml, kotaki a, ota m, shinohara k, et al. autochthonous dengue fever, tokyo, japan, 2014. emerg infect dis. 2015;21(3):517–20. doi:10.3201/eid2103/141662 pmid:25695200 21. [cases of domestic infection with dengue fever: 38th report]. tokyo: japan ministry of health, labour and welfare; 2014. available from: http://www.mhlw.go.jp/bunya/kenkou/kekkaku-kansenshou19/ dl/20141031-01.pdf, accessed 17 june 2022 (in japanese). relevant behavioural changes, and strengthening diagnostics and case management. enhancing collaboration and coordination within and beyond the health sector is key to carrying out these activities successfully. acknowledgements we thank the who member states in the western pacific region for collecting and sharing data, as well as the who country office staff in the region for supporting surveillance activities for dengue. we also thank the who regional health emergencies programme country office focal points, and the regional division for disease control focal points for their contributions to this report. conflicts of interest mc, lb, so, ckl, rra, sc and tm are associate editors and bo is executive editor of the western pacific surveillance and response journal. they were not involved in the editorial decision to publish the manuscript. all other authors have no conflicts of interest to declare. ethics statement ethical clearance was not required because this report used routinely available data and no personal identifying information was collected. funding none. references 1. dengue and severe dengue: key facts. geneva: world health organization; 2022. available from: https://www.who.int/news-room/ fact-sheets/detail/dengue-and-severe-dengue, accessed 17 june 2022. 2. bhatt s, gething pw, brady oj, messina jp, farlow aw, moyes cl, et al. the global distribution and burden of dengue. nature. 2013;496(7446):504–7. doi:10.1038/nature12060 pmid:23563266 3. western pacific regional action plan for dengue prevention and control (2016). manila: who regional office for the western pacific; 2017. available from: https://apps.who.int/iris/handle/10665/258651, accessed 17 june 2022. 4. lao m, caro v, thiberge jm, bounmany p, vongpayloth k, buchy p, et al. co-circulation of dengue virus type 3 genotypes in vientiane capital, lao pdr. plos one. 2014;9(12):e115569. doi:10.1371/ journal.pone.0115569 pmid:25551768 5. arima y, matsui t, shimada t, ishikane m, kawabata k, sunagawa t, et al. ongoing local transmission of dengue in japan, august to september 2014. western pac surveill response j. 2014;5(4):27–9. doi:10.5365/wpsar.2014.5.3.007 pmid:25685602 https://www.who.int/westernpacific/emergencies/surveillance/dengue https://www.who.int/westernpacific/emergencies/surveillance/dengue https://www.who.int/westernpacific/news/detail/11-06-2019-dengue-increase-likely-during-rainy-season-who-warns https://www.who.int/westernpacific/news/detail/11-06-2019-dengue-increase-likely-during-rainy-season-who-warns https://apps.who.int/iris/bitstream/handle/10665/330698/dengue-20200102.pdf?sequence=1 https://apps.who.int/iris/bitstream/handle/10665/330698/dengue-20200102.pdf?sequence=1 https://apps.who.int/iris/bitstream/handle/10665/330698/dengue-20200102.pdf?sequence=1 http://www.mhlw.go.jp/bunya/kenkou/kekkaku-kansenshou19/dl/20141031-01.pdf http://www.mhlw.go.jp/bunya/kenkou/kekkaku-kansenshou19/dl/20141031-01.pdf https://www.who.int/news-room/fact-sheets/detail/dengue-and-severe-dengue https://www.who.int/news-room/fact-sheets/detail/dengue-and-severe-dengue https://apps.who.int/iris/handle/10665/258651 wpsar vol 14, no 1, 2023 | doi: 10.5365/wpsar.2023.14.1.973https://ojs.wpro.who.int/ 15 epidemiology of dengue in the who western pacific region, 2013-2019togami et al 34. dengue fever [website]. suva: fiji ministry of health and medical services; 2020. available from: http://www.health.gov.fj/denguefever/, accessed 2 october 2020. 35. cao-lormeau vm, roche c, musso d, mallet hp, dalipanda t, dofai a, et al. dengue virus type 3, south pacific islands, 2013. emerg infect dis. 2014;20(6):1034–6. doi:10.3201/eid2006.131413 pmid:24856252 36. dengue situation update number 584. manila: who regional office for the western pacific; 2019. available from: https://apps. who.int/iris/bitstream/handle/10665/279856/dengue-20191219. pdf?sequence=25&isallowed=y, accessed 17 june 2022. 37. dengue-3 outbreak in republic of the marshall islands, june 25–december 1 2019. situation report date: december 1, 2019. majuro: government of the marshall islands; 2019. available from: https://reliefweb.int/report/marshall-islands/dengue-3-outbreakrepublic-marshall-islands-june-25-december-1-situation, accessed 17 june 2022. 38. dengue outbreak – federated states of micronesia, 2012– 2013. mmwr morb mortal wkly rep. 2013;62(28):570–3. pmid:23863704 39. dupont-rouzeyrol m, aubry m, o’connor o, roche c, gourinat ac, guigon a, et al. epidemiological and molecular features of dengue virus type-1 in new caledonia, south pacific, 2001–2013. virol j. 2014;11:61. doi:10.1186/1743-422x-11-61 pmid:24684835 40. la dengue, le chikungunya et le zika [dengue, chikungunya and zika]. nouméa: government of new caledonia, directorate of health and social affairs; 2020. available from: https://dass.gouv. nc/votre-sante-maladies/la-dengue-le-chikungunya-et-le-zika, accessed 2 october 2020 (in french). 41. darcy aw, kanda s, dalipanda t, joshua c, shimono t, lamaningao p, et al. multiple arboviral infections during a denv-2 outbreak in solomon islands. trop med health. 2020;48:33. doi:10.1186/ s41182-020-00217-8 pmid:32435149 42. craig at, joshua ca, sio ar, teobasi b, dofai a, dalipanda t, et al. enhanced surveillance during a public health emergency in a resource-limited setting: experience from a large dengue outbreak in solomon islands, 2016–17. plos one. 2018;13(6):e0198487. doi:10.1371/journal.pone.0198487 pmid:29879179 43. agence de santé du territoire des îles wallis et futuna: bulletin de surveillance épidémiologique 02/2020 (semaines 3–4) [health agency of the islands of wallis and futuna: epidemiological surveillance bulletin 02/2020 (weeks 3–4)]. mata utu: wallis and futuna; 2020. available from: https://reliefweb.int/report/wallisand-futuna-france/agence-de-sant-du-territoire-des-les-wallis-etfutuna-bulletin-de-20, accessed 17 june 2022 (in french). 44. gubler dj. dengue, urbanization and globalization: the unholy trinity of the 21st century. trop med health. 2011;39(4 suppl.):3–11. doi:10.2149/tmh.2011-s05 pmid:22500131 45. ebi kl, nealon j. dengue in a changing climate. environ res. 2016;151:115–23. doi:10.1016/j.envres.2016.07.026 pmid:27475051 46. dengue virus infection – surveillance case definition. canberra: australian government department of health and aged care; 2018. available from: https://www.health.gov.au/resources/publications/ dengue-virus-infection-surveillance-case-definition, accessed 17 june 2022. 47. 2018 national guideline for clinical management of dengue. phnom penh: cambodia ministry of health; 2018. available from: https:// niph.org.kh/niph/uploads/library/pdf/gl055_national_guideline_ for_clm_dengue.pdf, accessed 17 june 2022. 22. khampapongpane b, lewis hc, ketmayoon p, phonekeo d, somoulay v, khamsing a, et al. national dengue surveillance in the lao people’s democratic republic, 2006-2012: epidemiological and laboratory findings. western pac surveill response j. 2014;5(1):7– 13. doi:10.5365/wpsar.2014.5.1.001 pmid:24734212 23. phommanivong v, kanda s, shimono t, lamaningao p, darcy aw, mishima n, et al. co-circulation of the dengue with chikungunya virus during the 2013 outbreak in the southern part of lao pdr. trop med health. 2016;44:24. doi:10.1186/s41182-016-0020-y pmid:27524929 24. calvez e, pommelet v, somlor s, pompon j, viengphouthong s, bounmany p, et al. trends of the dengue serotype-4 circulation with epidemiological, phylogenetic, and entomological insights in lao pdr between 2015 and 2019. pathogens. 2020;9(9):728. doi:10.3390/pathogens9090728 pmid:32899416 25. epidemiology bureau, public health surveillance. philippine integrated disease surveillance and response (pidsr): morbidity week no. 52. manila: philippines department of health, epidemiology bureau; 2019. available from: https://doh.gov.ph/sites/default/files/ statistics/pidsr%20weekly%20surveillance%20report%20 no.%2052%202019.pdf, accessed 17 june 2022. 26. nguyen hv, than pqt, nguyen th, vu gt, hoang cl, tran tt, et al. knowledge, attitude and practice about dengue fever among patients experiencing the 2017 outbreak in vietnam. int j environ res public health. 2019;16(6):976. doi:10.3390/ijerph16060976 pmid:30889912 27. dengue: virus, fever and mosquitos. brisbane: queensland health; 2021. available from: https://www.health.qld.gov. au/clinical-practice/guidelines-procedures/diseases-infection/ diseases/mosquito-borne/dengue/virus-fever, accessed 28 october 2022. 28. walker j, pyke a, florian p, moore f, smoll n, adegbija o, et al. reemergence of dengue virus in regional queensland: 2019 dengue virus outbreak in rockhampton, central queensland, australia. commun dis intell. 2018;45:10.33321/cdi.2021.45.31. doi:10.33321/ cdi.2021.45.31 29. institute of environmental science and research. notifiable diseases in new zealand: annual report 2017. porirua (new zealand): institute of environmental science and research; 2019. available from: https:// surv.esr.cri.nz/pdf_surveillance/annualrpt/annualsurv/2017/2017a nnualndreport_final.pdf, accessed 28 october 2022. 30. institute of environmental science and research. notifiable diseases in new zealand: annual report 2018. porirua (new zealand): institute of environmental science and research; 2020. available from: https://surv.esr.cri.nz/pdf_surveillance/annualrpt/ annualsurv/2018/2018annualndreport_final.pdf, accessed 28 october 2022. 31. institute of environmental science and research. notifiable diseases in new zealand: annual report 2019. porirua (new zealand): institute of environmental science and research; 2021. available from: https://surv.esr.cri.nz/pdf_surveillance/annualrpt/ annualsurv/2019/2019annualndreport_final.pdf, accessed 28 october 2022. 32. dengue-1 outbreak in the cook islands: situation report 8: ending 31 december 2019. reporting date: 15 january 2020. rarotonga: cook islands ministry of health; 2020. available from: https:// reliefweb.int/report/cook-islands/dengue-1-outbreak-cook-islandssituation-report-8-ending-31-december-2019, accessed 17 june 2022. 33. dengue-1 outbreak in the cook islands: situation report 7: ending 30 november 2019. reporting date: 06 december 2019. rarotonga: cook islands ministry of health; 2019. available from: https://reliefweb.int/ report/cook-islands/dengue-1-outbreak-cook-islands-situation-report-7ending-30-november-2019, accessed 17 june 2022. http://www.health.gov.fj/dengue-fever/ http://www.health.gov.fj/dengue-fever/ https://apps.who.int/iris/bitstream/handle/10665/279856/dengue-20191219.pdf?sequence=25&isallowed=y https://apps.who.int/iris/bitstream/handle/10665/279856/dengue-20191219.pdf?sequence=25&isallowed=y https://apps.who.int/iris/bitstream/handle/10665/279856/dengue-20191219.pdf?sequence=25&isallowed=y https://dass.gouv.nc/votre-sante-maladies/la-dengue-le-chikungunya-et-le-zika https://dass.gouv.nc/votre-sante-maladies/la-dengue-le-chikungunya-et-le-zika https://reliefweb.int/report/wallis-and-futuna-france/agence-de-sant-du-territoire-des-les-wallis-et-futuna-bulletin-de-20 https://reliefweb.int/report/wallis-and-futuna-france/agence-de-sant-du-territoire-des-les-wallis-et-futuna-bulletin-de-20 https://reliefweb.int/report/wallis-and-futuna-france/agence-de-sant-du-territoire-des-les-wallis-et-futuna-bulletin-de-20 https://www.health.gov.au/resources/publications/dengue-virus-infection-surveillance-case-definition https://www.health.gov.au/resources/publications/dengue-virus-infection-surveillance-case-definition https://niph.org.kh/niph/uploads/library/pdf/gl055_national_guideline_for_clm_dengue.pdf https://niph.org.kh/niph/uploads/library/pdf/gl055_national_guideline_for_clm_dengue.pdf https://niph.org.kh/niph/uploads/library/pdf/gl055_national_guideline_for_clm_dengue.pdf https://doh.gov.ph/sites/default/files/statistics/pidsr%20weekly%20surveillance%20report%20no.%2052%202019.pdf https://doh.gov.ph/sites/default/files/statistics/pidsr%20weekly%20surveillance%20report%20no.%2052%202019.pdf https://doh.gov.ph/sites/default/files/statistics/pidsr%20weekly%20surveillance%20report%20no.%2052%202019.pdf https://www.health.qld.gov.au/clinical-practice/guidelines-procedures/diseases-infection/diseases/mosquito-borne/dengue/virus-fever https://www.health.qld.gov.au/clinical-practice/guidelines-procedures/diseases-infection/diseases/mosquito-borne/dengue/virus-fever https://www.health.qld.gov.au/clinical-practice/guidelines-procedures/diseases-infection/diseases/mosquito-borne/dengue/virus-fever https://surv.esr.cri.nz/pdf_surveillance/annualrpt/annualsurv/2017/2017annualndreport_final.pdf https://surv.esr.cri.nz/pdf_surveillance/annualrpt/annualsurv/2017/2017annualndreport_final.pdf https://surv.esr.cri.nz/pdf_surveillance/annualrpt/annualsurv/2017/2017annualndreport_final.pdf https://surv.esr.cri.nz/pdf_surveillance/annualrpt/annualsurv/2018/2018annualndreport_final.pdf https://surv.esr.cri.nz/pdf_surveillance/annualrpt/annualsurv/2018/2018annualndreport_final.pdf https://surv.esr.cri.nz/pdf_surveillance/annualrpt/annualsurv/2019/2019annualndreport_final.pdf https://surv.esr.cri.nz/pdf_surveillance/annualrpt/annualsurv/2019/2019annualndreport_final.pdf https://reliefweb.int/report/cook-islands/dengue-1-outbreak-cook-islands-situation-report-7-ending-30-november-2019 wpsar vol 14, no 1, 2023 | doi: 10.5365/wpsar.2023.14.1.973 https://ojs.wpro.who.int/16 togami et alepidemiology of dengue in the who western pacific region, 2013-2019 52. revised dengue clinical case management guidelines 2011. manila: philippines department of health; 2012. available from: https:// psbimannualreview.weebly.com/uploads/4/5/4/5/45454099/ revised_dengue_clinical_case_management_guidelines_2011-doh. pdf, accessed 18 july 2022. 53. dengue. manila: philippines department of health; 2020. available from: https://doh.gov.ph/health-advisory/dengue, accessed 17 june 2022. 54. [2019 viral mosquito-borne disease management guidelines]. cheongju: korea disease control and prevention agency; 2019. available from: http://www.cdc.go.kr/board.es?mid=a20507020 000&bid=0019&act=view&list_no=143975, accessed 17 june 2022 (in korean). 55. rajarethinam j, ang lw, ong j, ycasas j, hapuarachchi hc, yap g, et al. dengue in singapore from 2004 to 2016: cyclical epidemic patterns dominated by serotypes 1 and 2. am j trop med hyg. 2018;99(1):204-10. doi:10.4269/ajtmh.17-0819 56. [circular no. 54/2015/tt-byt: guidelines and report information to declare the disease, infectious disease]. hanoi: viet nam ministry of health; 2015. available from: http://vbpl.yte.gov.vn/van-ban-phapluat/thong-tu-542015tt-byt.6.1508.html, accessed 17 june 2022 (in vietnamese). 48. [dengue fever]. tokyo: ministry of health, labour and welfare; 2019. available from: https://www.mhlw.go.jp/bunya/kenkou/ kekkaku-kansenshou11/01-04-19.html, accessed 17 june 2022 (in japanese). 49. case definitions for infectious diseases in malaysia, third edition. putrajaya: ministry of health; 2017. available from: https:// www2.moh.gov.my/moh/resources/penerbitan/garis%20panduan/ pengurusan%20kesihatan%20&%20kawalan%20pykit/case_ definition_of_infectious_disease_3rd_edition_2017.pdf, accessed 17 june 2022. 50. arboviral diseases: part of the communicable disease control manual. wellington: ministry of health new zealand; 2012. available from: https://www.health.govt.nz/our-work/diseasesand-conditions/communicable-disease-control-manual/arboviraldiseases, accessed 17 june 2022. 51. guidelines for the national implementation of dengue rapid diagnostic test (rdt). manila: philippines department of health; 2016. available from: https://www.scribd.com/document/459819595/ guidelines-for-the-national-implementation-of-dengue-rapiddiagnostic-test-rdt, accessed 18 july 2022. https://psbimannualreview.weebly.com/uploads/4/5/4/5/45454099/revised_dengue_clinical_case_management_guidelines_2011-doh.pdf https://psbimannualreview.weebly.com/uploads/4/5/4/5/45454099/revised_dengue_clinical_case_management_guidelines_2011-doh.pdf https://psbimannualreview.weebly.com/uploads/4/5/4/5/45454099/revised_dengue_clinical_case_management_guidelines_2011-doh.pdf https://psbimannualreview.weebly.com/uploads/4/5/4/5/45454099/revised_dengue_clinical_case_management_guidelines_2011-doh.pdf http://www.cdc.go.kr/board.es?mid=a20507020000&bid=0019&act=view&list_no=143975 http://www.cdc.go.kr/board.es?mid=a20507020000&bid=0019&act=view&list_no=143975 https://www2.moh.gov.my/moh/resources/penerbitan/garis%20panduan/pengurusan%20kesihatan%20&%20kawalan%20pykit/case_definition_of_infectious_disease_3rd_edition_2017.pdf https://www2.moh.gov.my/moh/resources/penerbitan/garis%20panduan/pengurusan%20kesihatan%20&%20kawalan%20pykit/case_definition_of_infectious_disease_3rd_edition_2017.pdf https://www2.moh.gov.my/moh/resources/penerbitan/garis%20panduan/pengurusan%20kesihatan%20&%20kawalan%20pykit/case_definition_of_infectious_disease_3rd_edition_2017.pdf https://www2.moh.gov.my/moh/resources/penerbitan/garis%20panduan/pengurusan%20kesihatan%20&%20kawalan%20pykit/case_definition_of_infectious_disease_3rd_edition_2017.pdf https://www.health.govt.nz/our-work/diseases-and-conditions/communicable-disease-control-manual/arboviral-diseases https://www.health.govt.nz/our-work/diseases-and-conditions/communicable-disease-control-manual/arboviral-diseases https://www.health.govt.nz/our-work/diseases-and-conditions/communicable-disease-control-manual/arboviral-diseases https://www.scribd.com/document/459819595/guidelines-for-the-national-implementation-of-dengue-rapid-diagnostic-test-rdt https://www.scribd.com/document/459819595/guidelines-for-the-national-implementation-of-dengue-rapid-diagnostic-test-rdt https://www.scribd.com/document/459819595/guidelines-for-the-national-implementation-of-dengue-rapid-diagnostic-test-rdt https://www.mhlw.go.jp/bunya/kenkou/kekkaku-kansenshou11/01-04-19.html https://ojs.wpro.who.int/ 1wpsar vol 14, no 5, 2023 | doi: 10.5365/wpsar.2023.14.5.967 lessons from the field problem from april to september 2021, fiji experienced its second and largest wave of coronavirus disease (covid-19), peaking in july 2021 at 1405 cases in one day. the country’s health system was overstretched by covid-19 testing and triage, with up to 300 hospital admissions per day, reinforcing the need for infection prevention and control measures and resources to treat critical patients. the situation challenged health facilities’ ability to regularly report on hospital census data and management of covid-19 cases. lack of timely hospital information made it difficult to monitor adherence to preparedness and response plans and clinical management guidelines developed by the fiji ministry of health and medical services (mhms); it was also difficult to adapt to suit the changing situation at the divisional and national levels.1 it became evident that there was a need to strengthen existing covid-19 hospitalization reporting systems and data analysis. in addition, visualization of the data in real time could help clinicians and public health staff to respond promptly to the unfolding situation.2 context before the covid-19 pandemic, the fiji mhms used an electronic health information system known as the patient information system (patis)3 to monitor health a world health organization division of pacific technical support, suva, fiji. b menzies health institute queensland, griffith university, nathan, queensland, australia. c college of nursing and health sciences, flinders university, adelaide, south australia, australia. d world health organization regional office for the western pacific, manila, philippines. e school of population health, university of new south wales, sydney, new south wales, australia. f lautoka hospital, lautoka, fiji. g ministry of health and medical services, suva, fiji. h office of the pacific islands, united nations office for the coordination of humanitarian affairs, suva, fiji. published: 22 february 2023 doi: 10.5365/wpsar.2023.14.5.967 problem: from april to september 2021, fiji experienced a second wave of coronavirus disease (covid-19) precipitated by the delta variant of concern, prompting a need to strengthen existing data management of positive covid-19 cases. context: with covid-19 cases peaking at 1405 a day and many hospital admissions, the need to develop a better way to visualize data became clear. action: the fiji ministry of health and medical services, the world health organization and the united nations office for the coordination of humanitarian affairs collaborated to develop an online clinical dashboard to support better visualization of case management data. outcome: the dashboard was used across fiji at national, divisional and local levels for covid-19 management. at the national level, it provided real-time reports describing the surge pattern, severity and management of covid-19 cases across the country during daily incident management team meetings. at the divisional level, it gave the divisional directors access to timely information about hospital and community isolation of cases. at the hospital level, the dashboard allowed managers to monitor trends in isolated cases and use of oxygen resources. discussion: the dashboard replaced previous paper-based reporting of statistics with delivery of trends and real-time data. the team that developed the tool were situated in different locations and did not meet physically, demonstrating the ease of implementing this online tool in a resource-constrained setting. the dashboard is easy to use and could be used in other pacific island countries and areas. implementation and use of a national electronic dashboard to guide covid-19 clinical management in fiji karen hammad,a,b,c sean casey,d,e rigamoto taito,f,g sara w demas,a mohita joshi,h rashmi ritah and anaseini maisemag correspondence to karen hammad (email: hammadk@who.int) wpsar vol 14, no 5, 2023 | doi: 10.5365/wpsar.2023.14.5.967 https://ojs.wpro.who.int/2 hammad et alimplementation and use of an electronic dashboard in fiji age covid-19 cases, then dynamic data captured daily numbers of covid-19 cases being monitored in hospitals and daily use of resources. the data collection fields captured hospital information, available beds, beds in use, patient occupancy, covid-19 admissions (disaggregated using who clinical severity guidelines), covid-19 deaths, oxygen availability and oxygen use. the process of data collection replicated existing processes, with staff appointed by the health facilities or mhms uploading information about covid-19 cases isolating in health facilities and in the community to a google form each day. access to the google form link was limited to users verified by the teams at who or mhms, to streamline data entry and prevent errors. the process was piloted in two major hospitals before being expanded to include all health facilities in fiji. in september 2021, data management officers were recruited at the national level to oversee data quality and assist in monitoring covid-19 hospital analysis for imt reporting. end users were given a link to view the dashboard; this allowed them to view current data from their own device. in this context, end users were nursing and medical heads of hospital departments and public health managers at the fiji mhms. as end users became more familiar with the dashboard and the data required to inform clinical and care pathway decision-making, further changes were made to the dashboard. these changes included the addition of home isolation in september 2021, with data on the number of covid-19 cases isolating at home, their risk for severe disease (high, moderate or low) and recovered cases and deaths. in october 2021, the tool was expanded to track the monitoring and visits to covid-19 patients in home isolation. once the consultation period had finished and the dashboard was in consistent use, a nationwide webinar was convened on interpretation of the dashboard and ongoing online support was provided for users. the dashboard complemented other tools and platforms used during the pandemic response such as daily morning briefs, standard operating procedures and clinical guidelines to inform and support decisionmaking in the overall response. the dashboard replaced a paper-based system that required time and expertise, and it made visualization of the data easier for the fiji mhms. whereas the paper-based approach to reporting data was punctuated by delays and inconsistencies in service delivery in major hospitals and health centres. however, data from patis are summarized manually3 and reported monthly from the subdivision level, which prompted each division (regional area) to develop its own method for covid-19 hospitalization monitoring and reporting.3–5 the various methods were largely paper based and involved increased data entry and analysis so that they could be presented in a powerpoint format at daily national incident management team (imt) meetings. the greater workload for health-care workers and the limited capacity for data extraction and analysis meant that a better covid-19 case management reporting system was needed to enable timely information on covid-19 admissions from the facility to the national level. action in august 2021, the fiji mhms, the world health organization (who) and the united nations office for the coordination of humanitarian affairs (un ocha) collaborated to create an electronic covid-19 clinical management dashboard to track covid-19 case severity, bed occupancy, availability of medical oxygen and oxygen delivery equipment, and management of cases isolating at home. a dashboard is defined as a singlescreen visual representation of data from several sources that uses graphics and tables to display qualitative and quantitative indicators.6 a multidisciplinary team that included clinicians, data experts and epidemiologists from different organizations (including fiji mhms, who and un ocha) collaborated remotely to develop the dashboard. key objectives of the covid-19 clinical dashboard were to track the isolation and case management of confirmed covid-19 cases, monitor the application of the clinical care pathway and manage clinical care resources to sustain the country’s existing health-care capacity. an initial prototype of the dashboard was developed using sample data. the prototype was reviewed by the health facilities before further refining the data collection form to facilitate its daily use. to ensure that a technology is usable and achieves its intended purpose, end users must be involved throughout the design process.6 the literature on dashboard conception and design suggests a timeline of 6–12 months;7 however, our dashboard was implemented within 4 weeks. data collection was a twofold process: baseline data captured existing health facility capacity to manwpsar vol 14, no 5, 2023 | doi: 10.5365/wpsar.2023.14.5.967https://ojs.wpro.who.int/ 3 implementation and use of an electronic dashboard in fijihammad et al application at the divisional (regional) level the dashboard allowed clinical and public health managers or leaders to view trends such as increases in covid-19 cases in health facilities across the country in real time. thresholds on ward occupancy and oxygen use provided by the dashboard supported decisions to activate surge-capacity plans in anticipation of an increase in demand for resources. application at the national level at the national level, the dashboard was part of incident management reporting and covid-19 technical planning meetings. fiji’s imt reviewed the dashboard together with covid-19 surveillance data to monitor and manage the response strategy. community surveillance data provided information on the scope of the outbreak, while the dashboard highlighted the impact of the outbreak on health-care demand. at the height of the second wave, health facilities quickly reached maximum bed capacity and fiji’s health-care resources were overstretched. at the national level, this triggered imt to adapt the national clinical care pathway to prioritize hospitalization of critical and severe covid-19 cases and introduce home isolation for mild and moderate cases. the dashboard was used to monitor this shift in response strategy, and an overall decline in hospital admissions was seen. as covid-19 patient admissions declined, facilities could dedicate resources back to non-covid-19 health-care needs, and the health workforce was better equipped to meet demand. the dashboard also helped to strengthen communication between the community and health facilities to identify opportunities for improving response mechanisms. capturing covid-19 deaths in the dashboard – disaggregated by community, hospital and death before arrival – highlighted where covid-19 deaths were occurring. an observed rise in deaths before arrival at health facilities led to a mortality review. the review found there were potential delays in seeking care and emphasized the need for increased community engagement and communication on when and how to access care. the introduction of the dashboard into national covid-19 reporting and planning provided evidence to guide decision-makers on the necessary interventions to counteract the adverse effects of covid-19 in reporting, this real-time mode of the dashboard allowed more immediate actions in response to the data. outcome the current iteration of the fiji dashboard presents information on number of new covid-19 hospital admissions, positive covid-19 cases by symptom severity and place of isolation (hospital, non-hospital or home), number of covid-19-related deaths, use and availability of oxygen resources, and monitoring of the status of positive cases in home isolation. the dashboard is customizable to geographical location, facility type and facility name, enabling all users at local, divisional and national levels to use the same dashboard to meet their needs and inform their response. application at the local level the dashboard was used by hospitals across the country to guide case management. it provided real-time visibility of covid-19 patients in hospital and non-hospital isolation. divisional hospitals could use the dashboard to monitor severe and critical cases at lower-level facilities (e.g. subdivisional hospitals or intermediate care facilities), and identify cases that might require transfer to higher-level care, supporting resource planning. the dashboard provided further visibility of positive covid-19 cases in home isolation, which triggered discussions in daily morning briefs about monitoring and management of high-risk patients in home isolation, and assisted in planning home monitoring and referrals. such discussions helped to identify service gaps such as lack of transport or staff; they also provided the opportunity to assist teams challenged with logistics and other resources. the dashboard informed the allocation of important resources. for example, disease severity informed the skill mix of hospital staff to match clinical care demands. oxygen-use data allowed hospital management to source and allocate supplies and necessary equipment to ensure that oxygen was available to patients when needed. information on disease severity included on the dashboard helped in allocating patients to the most appropriate health facility for the level of care required. such decisions help facilities and health authorities to make the best use of existing resources. wpsar vol 14, no 5, 2023 | doi: 10.5365/wpsar.2023.14.5.967 https://ojs.wpro.who.int/4 hammad et alimplementation and use of an electronic dashboard in fiji by tracking their level of risk and the date on which the mhms had last been in contact to check their clinical status. communication is critical to an effective and successful pandemic response. sharing information on the progress of the pandemic helps to inform key stakeholders, for example, by assisting clinical staff with patient care, and helping hospital management and support staff with surge-capacity plans and forecasting logistics, supplies and human resource deployment. forums such as head of department meetings, executive management meetings and local task force meetings are used to share clinical dashboard trends. also, ibrahim et al.8 found that the development and implementation of an electronic dashboard in their health facility enabled physicians to efficiently assess patient volumes and case severity to prioritize clinical care and appropriately allocate services. there are several important limitations to our dashboard. the first is that we focused on the development and implementation of an electronic dashboard in fiji. in comparison to other pacific island countries, fiji has a relatively large health system that makes it difficult to transfer this online dashboard directly to other country contexts. however, we believe that fiji’s experience and associated challenges are useful to consider when implementing an electronic dashboard elsewhere. interpretation of this real-time dashboard also requires a thorough understanding of the dashboard’s data fields, fiji’s covid-19 situation and overall response strategy. for instance, an increase in covid-19 hospitalization seen in june and july 2022 may be due to increased testing, awareness of covid-19 diagnosis and referral to health facilities. for accurate interpretation, the dashboard should be reviewed in collaboration with other covid-19 information. additional limitations included the many hours required to develop the dashboard, incomplete and inconsistent data (particularly following a resurgence of covid-19), misunderstandings about how the information was collected and efforts to twist the messages that the dashboard presents.2,15 the dashboard is a simple online tool that is easy to use and has applications across different facets of clinical outbreak response. the availability of real-time information via the dashboard facilitates a quick response. owing to its ease of use, the dashboard can be altered to meet users’ data needs, making this a cost-effective and relatively simple solution for data management and fiji. examples of data visualization from the electronic dashboard that helped to guide monitoring and clinical management were the number of new cases (fig. 1) and the number of severe and critical cases in hospitals (fig. 2). challenges development of the dashboard included some challenges. the development phase involved many hours of discussion between the development team and the health facilities to clarify understanding. there were also challenges related to human resources, with overstretched health facilities expressing difficulty in identifying available staff to collect and enter data. until processes were established, this led to gaps in data that the development team needed to regularly return to and complete. another challenge was incorrect interpretation of the dashboard, which occurred when screenshots of the dashboard were used in presentations or the media without context or appropriate interpretation. to address this issue, a short webinar on how to interpret the dashboard correctly was presented to end users, and it was recommended that the dashboard be used only at an operational level. discussion since 2020, many dashboards have been created around the world to track and present information on the covid-19 pandemic; these dashboards have been pivotal in guiding decisions and health system responses.6–9 however, much of the literature pertaining to clinical dashboards was published before the pandemic and is fragmented, reporting on different types of dashboards at strategic, tactical and operational levels.6,10 one key benefit of an electronic dashboard is that information can be consolidated at a glance to improve decisionmaking.6,7,10 electronic dashboards present a variety of information including patient data such as age, vital signs and oxygen requirements, severity of illness and risk of deterioration (taken from electronic health records); and overall hospital data such as critical care resources, test positivity rate, covid-19-related bed occupancy and mortality.6,11–14 the online dashboard we created allowed key decision-makers to visualize case numbers and place of isolation in real time. additionally, with many cases isolating at home having risk factors for severe disease, the dashboard provided oversight of this vulnerable group wpsar vol 14, no 5, 2023 | doi: 10.5365/wpsar.2023.14.5.967https://ojs.wpro.who.int/ 5 implementation and use of an electronic dashboard in fijihammad et al fig. 1. dashboard interface wpsar vol 14, no 5, 2023 | doi: 10.5365/wpsar.2023.14.5.967 https://ojs.wpro.who.int/6 hammad et alimplementation and use of an electronic dashboard in fiji references 1. health workforce policy and management in the context of the covid-19 pandemic response: interim guidance, 3 december 2020. geneva: world health organization; 2020. available from: https://apps.who.int/iris/handle/10665/337333, accessed 22 august 2022. 2. ruggiero s. hospitals in chaos as fiji battles covid-19 hell. al jazeera; 2022. available from: https://www.aljazeera.com/ news/2021/7/30/patients-turned-away-as-fiji-battles-covid-19-hell, accessed 21 april 2022. 3. soar j, gow j, caniogo v. sustainability of health information systems in developing countries: the case of fiji. health inf manag. 2012;41(3):13–9. doi:10.1177/183335831204100302 pmid:23087079 4. the fiji islands health system review. manila: who regional office for the western pacific; 2011. available from: https://apps.who.int/ iris/handle/10665/207503, accessed 22 august 2022. 5. communicable disease surveillance and outbreak response guidelines. suva, fiji: ministry of health and medical services; 2016. available from: https://www.health.gov.fj/wp-content/uploads/2018/08/ fiji-communicable-disease-surveillance-and-outbreak-responseguidelines-2016-1.pdf, accessed 22 august 2022. 6. laurent g, moussa md, cirenei c, tavernier b, marcilly r, lamer a. development, implementation and preliminary evaluation of clinical dashboards in a department of anesthesia. j clin monit comput. 2021;35(3):617–26. doi:10.1007/s10877-020-00522-x pmid:32418147 7. martinez da, kane em, jalalpour m, scheulen j, rupani h, toteja r, et al. an electronic dashboard to monitor flow at the johns hopkins hospital: communication of key performance indicators using the donabedian model. j med syst. 2018;42(8):133. doi:10.1007/ s10916-018-0988-4 pmid:29915933 8. ibrahim h, sorrell s, nair sc, al romaithi a, al mazrouei s, kamour a. rapid development and utilization of a clinical intelligence dashboard for frontline clinicians to optimize critical resources during covid-19. acta inform med. 2020;28(3):209–13. doi:10.5455/ aim.2020.28.209-213 pmid:33417660 9. peeples l. lessons from the covid data wizards. nature. 2022;603(7902):564−7. doi:10.1038/d41586-022-00792-2 pmid:35322256 visualization across low-resource settings. it is hoped that the dashboard can be used beyond covid-19 to track hospital census data and other infectious disease outbreaks. acknowledgements the authors would like to acknowledge the clinicians and divisional and subdivisional health staff across fiji who, alongside their significant clinical duties at the peak of the covid-19 outbreak in fiji, diligently collected and entered clinical data on a daily basis to inform public health decision-making and to track and analyse the patterns of covid-19 cases. the authors would also like to acknowledge the support of the fiji ministry of health and medical services, the united nations office for the coordination of humanitarian affairs and the world health organization. conflicts of interest the authors have no conflicts of interest to declare. ethics statement this manuscript describes the implementation and use of an electronic dashboard; hence, there are no patient identifiers or impacts to patient populations from publishing this article. funding none fig. 2. data capture of hospitalized cases with severe or critical disease severity https://www.aljazeera.com/news/2021/7/30/patients-turned-away-as-fiji-battles-covid-19-hell https://www.aljazeera.com/news/2021/7/30/patients-turned-away-as-fiji-battles-covid-19-hell https://apps.who.int/iris/handle/10665/207503 https://apps.who.int/iris/handle/10665/207503 https://www.health.gov.fj/wp-content/uploads/2018/08/fiji-communicable-disease-surveillance-and-outbreak-response-guidelines-2016-1.pdf https://www.health.gov.fj/wp-content/uploads/2018/08/fiji-communicable-disease-surveillance-and-outbreak-response-guidelines-2016-1.pdf https://www.health.gov.fj/wp-content/uploads/2018/08/fiji-communicable-disease-surveillance-and-outbreak-response-guidelines-2016-1.pdf wpsar vol 14, no 5, 2023 | doi: 10.5365/wpsar.2023.14.5.967https://ojs.wpro.who.int/ 7 implementation and use of an electronic dashboard in fijihammad et al 13. grange es, neil ej, stoffel m, singh ap, tseng e, resco-summers k, et al. responding to covid-19: the uw medicine information technology services experience. appl clin inform. 2020;11(2):265–75. doi:10.1055/s-0040-1709715 pmid:32268390 14. fazaeli s, khodaveisi t, vaklizadeh ak, yousefi m, ariafar a, shokoohizadeh m, et al. development, implementation, and user evaluation of covid-19 dashboard in a third-level hospital in iran. appl clin inform. 2021;12(5):1091–100. doi:10.1055/s-0041-1740188 pmid:34879405 15. heaton ha, russi cs, monroe rj, thompson km, koch ka. telehealth dashboard: leverage reporting functionality to increase awareness of high-acuity emergency department patients across an enterprise practice. bmj health care inform. 2019;26(1):e100093. doi:10.1136/bmjhci-2019-100093 pmid:31843765 10. pace a, buttigieg sc. can hospital dashboards provide visibility of information from bedside to board? a case study approach. j health organ manag. 2017;31(2):142–61. doi:10.1108/jhom-11-20160229 pmid:28482770 11. merkel mj, edwards r, ness j, eriksson c, yoder s, gilliam s, et al. statewide real-time tracking of beds and ventilators during coronavirus disease 2019 and beyond. crit care explor. 2020;2(6):e0142. doi:10.1097/cce.0000000000000142 pmid:32696005 12. mayo clinic covid-19 predictive analytics task force, pollock bd, carter re, dowdy sc, dunlay sm, habermann eb, et al. deployment of an interdisciplinary predictive analytics task force to inform hospital operational decision-making during the covid-19 pandemic. mayo clin proc. 2021;96(3):690–8. doi:10.1016/j. mayocp.2020.12.019 pmid:33673920 https://ojs.wpro.who.int/ 1wpsar vol 14, no 2, 2023 | doi: 10.5365/wpsar.2023.14.2.999 original research c oronavirus disease (covid-19), caused by severe acute respiratory syndrome coronavirus 2 (sarscov-2), was first documented in wuhan, hubei province, china in december 2019.1 according to the world health organization (who), as of april 2023, there have been 762 million covid-19 cases with over 6.8 million deaths worldwide. in the philippines, there have been over 4 million confirmed cases with over 66 000 deaths.2 the global incidence has steadily declined in 2023 after a peak in december 2022.2 however, severe and critical disease remains a concern; in one study from the united states of america, 5.3% of cases infected with the omicron variant were hospitalized, with 3% requiring oxygen.3 internationally4 and in the philippines,5 severe and critical infections usually affect older patients and those with multiple comorbidities. respiratory viral infections are a risk factor for bacterial coinfections, which may increase disease severity and mortality.6 bacterial coinfections are defined as suspected bacterial pneumonia in addition to covid-19 within 48–72 hours of hospital admission for covid-19,7 and are relatively common in patients with severe and critical disease.8 secondary bacterial infections are defined as suspected bacterial pneumonia after 72 hours of hospitalization for covid-19,7 and are diagnosed when patients present with the symptoms and signs of pneumonia and a pathogen is isolated from sputum, blood, endotracheal aspirate or bronchoalveolar lavage cultures following admission.1 there are limited cues for differentiating bacterial and viral respiratory infections. despite the viral origin of covid-19, physicians tended to start treatment with antibiotics since cough, a saint louis university hospital of the sacred heart, baguio city, philippines. published: 24 june 2023 doi: 10.5365/wpsar.2023.14.2.999 objective: the ongoing coronavirus disease (covid-19) pandemic is exacerbating optimal antibiotic stewardship and the promotion of bacterial resistance due to the over-prescribing of antibiotics for patients with covid-19. this study aimed to determine the prevalence of antibiotic therapy in patients with covid-19 infection and explore the association of antibiotic prescribing with patients’ demographics and clinical characteristics. methods: a retrospective analytical cross-sectional study was conducted at a tertiary hospital and training institution in baguio city, the philippines from march 2020 to march 2021. univariate and multivariable logistic regression was used to compare covid-19 patients who were prescribed antibiotics with those who were not. results: of the 157 patients hospitalized with covid-19 infection, 90 (57.3%) received antibiotics, with only three (1.9%) having confirmed bacterial coinfection. among those prescribed antibiotics, azithromycin was the most frequently prescribed antibiotic (43.3%), followed by ceftriaxone (33.1%), piperacillin-tazobactam (15.3%), ceftazidime (5.1%), moxifloxacin (1.3%), amikacin (0.6%), ampicillin and sulbactam (0.6%), cefuroxime (0.6%), metronidazole (0.6%) and penicillin (0.6%). antibiotic use was associated with factors such as having bilateral infiltrates on chest x-ray, the severity of covid-19 infection and high white blood cell counts. discussion: antibiotic use was high among patients with confirmed covid-19 despite a low prevalence of confirmed bacterial coinfection. this may be due to the similarities in the clinical manifestations of both viral and bacterial infections. judicious use of antibiotics in the treatment of covid-19, as well as other viral infections (for example, influenza), is required to prevent antibiotic resistance in accordance with the principles of antimicrobial stewardship. antimicrobial use in patients with confirmed covid-19 infection in the philippines: a cross-sectional study roanne j dominguez,a nicole a domingo-cerenoa and rosemarie t josue-domingueza correspondence to roanne j dominguez (email: roannedominguezmd@gmail.com) wpsar vol 14, no 2, 2023 | doi: 10.5365/wpsar.2023.14.2.999 https://ojs.wpro.who.int/2 dominguez et alantimicrobial use in patients with confirmed covid-19 infection data collection charts of confirmed covid-19 patients who met the inclusion criteria were reviewed. data collected were: antibiotic usage (use or non-use, type of antibiotic); age (19–59 years old or ≥60 years old); presence or absence of comorbidities; disease severity (mild, moderate, severe or critical); results of chest x-ray (normal, unilateral infiltrates or bilateral infiltrates); white blood cell count (<5000, 5000–10 000 or >10 000); differential count (neutrophilia or lymphocytosis); procalcitonin (≤2 ng/ml or >2 ng/ml); and blood, sputum and/or endotracheal aspirate cultures (with or without growth) (table 1). the severity classification of patients with covid-19 was based on the unified covid-19 algorithms (table 2).13 the comorbidities included were diabetes, hypertension, coronary artery disease, rheumatic heart disease, asthma, chronic obstructive pulmonary disease, chronic kidney disease, cancer, arrhythmia and stroke. patients were diagnosed with a bacterial coinfection if there was growth in culture samples conducted within the first 48 hours of admission to hospital. data analysis data were encoded and analysed using spss v24 (ibm corp., armonk, ny, united states of america). frequencies and percentages were used to describe the prevalence of antibiotic use in patients with covid-19. to determine the association between antibiotic use and the variables of interest (age, sex, comorbidities, severity of covid-19 infection, chest x-ray findings, white blood cell count, differential count, procalcitonin, blood culture, and sputum and endotracheal aspirate culture), univariate and multivariable logistic regression was used. imputation of missing variables for some patients at hospital admission was considered if <20% of values were missing, and imputation based on the expectation−maximization algorithm method was used to replace missing values. a p value of <0.05 was considered statistically significant. results the charts were reviewed of all 157 hospitalized covid-19 patients, of whom 90 (57.3%) received fever and infiltrates on chest imaging are markers of bacterial community-acquired pneumonia requiring antibiotics.9 the uncertainty of the covid-19 pandemic and the absence of antiviral treatments with proven efficacy probably also contributed to the widespread and excessive use of antibiotics,10 especially in the first year of the pandemic. this prescriber behaviour threatens antimicrobial stewardship, which is defined as “an organizational or healthcare-system-wide approach to promoting and monitoring judicious use of antimicrobials to preserve their future effectiveness.”11 who recommends that antimicrobials be used for severe covid-19 cases at increased risk for secondary bacterial infection and death.12 the main objective of this study is to describe antibiotic use in patients with confirmed covid-19 infection at a tertiary hospital in baguio city, philippines. more specifically, the study aims to: (1) determine the prevalence of antibiotic use in patients with confirmed covid-19 infection; (2) verify the prevalence of bacterial coinfection; (3) ascertain the most frequently prescribed antibiotics; and (4) explore the associations of variables with antibiotic use, specifically, age, sex, comorbidities, severity of covid-19 infection, chest x-ray findings, white blood cell count, differential count, procalcitonin, blood culture, and sputum and endotracheal aspirate culture. methods study design a retrospective analytical cross-sectional study was conducted at a tertiary hospital and training institution in baguio city, philippines. study population all adult patients (≥19 years old) with mild, moderate, severe and critical confirmed covid-19 infection who were seen, diagnosed and eventually hospitalized from march 2020 to march 2021 were included in the study. patients who were asymptomatic, regardless of the presence or absence of comorbidities, as well as patients who developed hospital-acquired infection during the course of their hospital stay, were excluded. wpsar vol 14, no 2, 2023 | doi: 10.5365/wpsar.2023.14.2.999https://ojs.wpro.who.int/ 3 antimicrobial use in patients with confirmed covid-19 infectiondominguez et al table 1. characteristics of hospitalized covid-19 cases at a tertiary hospital in baguio city, the philippines, march 2020 to march 2021 (n = 157) table 2. severity classification of covid-19 cases, the philippines, 2020 characteristic number % age (years) 19–59 106 67.5 ≥60 51 32.5 sex male 96 61.1 female 61 38.9 comorbiditiesa yes 97 61.8 no 46 29.3 severity mild 64 40.8 moderate 36 22.9 severe 50 31.8 critical 7 4.5 chest x-ray normal 80 51 unilateral 20 12.7 bilateral 57 36.3 white blood cell counta <5000 28 17.8 5000–10 000 99 63.1 >10 000 26 16.6 differential counta neutrophilia 149 94.9 lymphocytosis 4 2.5 procalcitonin ≤2 ng/ml 77 49 >2 ng/ml 5 3.2 not requested 75 47.8 bacterial coinfection yes 3 1.9 no 77 49 not requested 77 49 a values are missing from some patients for comorbidities (n = 14), white blood cell count (n = 4) and differential count (n = 4). antibiotics and three (1.9%) had confirmed bacterial coinfection. among the 90 patients who were given antibiotics, azithromycin was the most frequently prescribed antibiotic (43.3%), followed by ceftriaxone (33.1%) and piperacillin-tazobactam (15.3%) (fig. 1). classification signs and symptoms mild fever, cough, diarrhoea, change in taste or smell, or fatigue; no signs of hypoxia on pulse oximetry or arterial blood gas, or pneumonia on physical examination and chest x-ray moderate symptomatic with clinical or radiographic evidence of lower respiratory tract disease (infiltrates on chest xray, presence of crackles) and oxygen saturation >94% on room air severe symptomatic with oxygen saturation ≤94% on room air and lung infiltrates on chest x-ray critical respiratory failure not fully explained by cardiac failure or fluid overload (acute respiratory distress syndrome), septic shock or multiple organ dysfunction there were 106 patients (67.5%) aged 19–59 years and 51 (32.5%) aged ≥60 years. there were more males (61.1%) than females (38.9%). comorbidities were reported for 97 patients (61.8%). they included diabetes mellitus, hypertension, cancer, chronic kidney disease, coronary artery disease, bronchial asthma and chronic obstructive pulmonary disease. with regards to the severity of covid-19 infection, 64 patients (40.8%) were mild, 36 (22.9%) were moderate, 50 (31.8%) were severe and seven (4.5%) were critical (table 1). eighty patients (51.0%) had a normal chest x-ray, 20 (12.7%) had unilateral infiltrates and 57 (36.3%) had the presence of bilateral infiltrates on chest x-ray. twenty-eight patients (17.8%) had white blood cell counts of <5000, 99 (63.1%) had counts of 5000–10 000 and 26 (16.6%) had counts of >10 000. regarding differential counts, neutrophilia was noted in 149 patients (94.9%), while only four patients (2.5%) had lymphocytosis. of the 157 patients, procalcitonin was measured in only 82 patients, of whom 77 (49%) had results of ≤2 ng/ml and five (3.2%) of >2 ng/ml (table 1). factors significantly associated with antibiotic use in multivariable analysis were: having bilateral chest x-ray infiltrates (odds ratio [or] 48.11, 95% confidence interval [ci] 11.24–205.88, p < 0.001); severity of covid-19 infection (moderate: or 8.98, source: unified covid-19 algorithms.13 wpsar vol 14, no 2, 2023 | doi: 10.5365/wpsar.2023.14.2.999 https://ojs.wpro.who.int/4 dominguez et alantimicrobial use in patients with confirmed covid-19 infection in a 2020 global survey of antibiotic-prescribing practices for patients with covid-19, respondents reported that their decision to use antibiotics was based more on clinical presentation and less on laboratory or radiologic markers.22 many of these studies were from 2020, early in the covid-19 pandemic, when antiviral treatments for covid-19 were not available. almost half of the patients included in this study had mild covid-19 infection and, therefore, as per local practice guidelines, sputum and bacterial cultures were not indicated.23 this could account for the low prevalence of bacterial coinfection in this study. rates of bacterial coinfection in patients with covid-19 have been low, as confirmed by several studies.14–17,24 in contrast, a study from wuhan, china revealed a higher bacterial coinfection rate of 25.5% in patients admitted for covid-19.25 in a study from a secondary-care setting in the united kingdom of great britain and northern ireland, blood cultures were positive in 3.2% of patients during the first 5 days of admission; after 5 days of confinement, the positivity rate increased to 6.1%. the same study revealed that pathogenic bacteria were identified at a higher rate (34.8%) from respiratory samples.26 azithromycin, ceftriaxone, piperacillin-tazobactam and ceftazidime were the most commonly used antibi95% ci 2.833–28.477, p < 0.001; severe: or 4.81, 95% ci 1.38–16.71, p = 0.014; critical: or 0.24, 95% ci 0.07–0.81, p = 0.021); and having elevated white blood cell count (5000–10 000: or 7.85, 95% ci 1.28–48.29, p = 0.026; >10 000: or 7.12, 95% ci 1.48–34.36, p = 0.015) (table 3). discussion the prevalence of empiric antimicrobial use at this tertiary hospital in baguio city, the philippines was 57.3%, which is high considering that the prevalence of bacterial coinfection was 1.9%. however, similar studies have reported higher antibiotic use in patients with covid-19 from rates of 70–90%.14–17 in a cohort study from wuhan, china in 2020,1 all patients with laboratory-confirmed covid-19 were given empiric antibiotic therapy. prescribing antibiotics for covid-19 patients was based on the who interim guidelines to treat for possible bacterial infection.18,19 in two smaller studies from jiangsu and wuhan, antibiotics were prescribed to almost all patients.20,21 in a study conducted by rawson et al.,14 72% of patients with covid-19 received antimicrobial therapy, though only 8% of patients were reported to have bacterial coinfection. this may be due to difficulty ruling out bacterial coinfection during patients’ admission since viral and bacterial pneumonia have similar clinical manifestations. fig. 1. frequency of antibiotics prescribed to hospitalized covid-19 patients at a tertiary hospital in baguio city, the philippines, march 2020 to march 2021 (n = 90) wpsar vol 14, no 2, 2023 | doi: 10.5365/wpsar.2023.14.2.999https://ojs.wpro.who.int/ 5 antimicrobial use in patients with confirmed covid-19 infectiondominguez et al table 3. factors associated with antibiotic use in hospitalized covid-19 cases at a tertiary hospital in baguio city, the philippines, march 2020 to march 2021a factors univariate multivariable or (95% ci) p or (95% ci) p age (years) 19–59 ref ref ≥60 2.0 (1.0–4.0) 0.049 0.3 (0.1–1.2) 0.116 sex male ref ref female 0.8 (0.4–1.6) 0.644 1.7 (0.3–8.8) 0.507 comorbidities no ref ref yes 0.5 (0.2–1.0) 0.069 0.4 (0.7–3.0) 0.438 severity of covid-19 infection mild ref ref moderate 22.5 (9.7–52.0) <0.001 8.9 (2.8–28.4) <0.001 severe 10.7 (4.4–25.9) <0.001 4.8 (1.3–16.7) 0.014 critical 0.1 (0.0–0.2) <0.001 0.2 (0.0–0.8) 0.021 chest x-ray normal ref ref unilateral 3.1 (0.5–17.2) 0.180 1.9 (0.3–11.8) 0.454 bilateral 57.7 (16.2–206.0) <0.001 48.1 (11.2–205.8) <0.001 white blood cell count <5000 ref ref 5000–10 000 8.8 (2.1–36.3) 0.003 7.8 (1.2–48.2) 0.026 >10 000 6.6 (1.8–23.6) 0.003 7.1 (1.4–34.3) 0.015 differential count neutrophilia ref ref lymphocytosis 0.2 (0.0–2.2) 0.209 0.1 (0.0–1.8) 0.149 procalcitonin ≤2 ng/ml ref ref >2 ng/ml 1.5 (0.1–14.2) 0.724 0.6 (0.0–11.9) 0.794 bacterial coinfection no ref ref yes 3.7 (0.3–45.9) 0.297 4.8 (0.1–127.6) 0.346 a statistically significant p values (<0.05) are in bold. otics in this study. the distribution of antibiotics used follows the philippine clinical practice guidelines on the management of community-acquired pneumonia27 and the antibiogram of the hospital. this finding was similar to that of a retrospective cohort study done at a covid-19 referral hospital in the philippines by abad et al.28 in contrast, a study from a german university hospital revealed that the most commonly used antibiotics were fluoroquinolones, carbapenems and third-generation cephalosporins;6 however, this may be due to different antibiotic protocols in europe. the presence of bilateral pulmonary infiltrates on chest x-ray was the most significant predictor of antibiotic use in this study. such radiologic findings increase the probability of bacterial infection. cheng wpsar vol 14, no 2, 2023 | doi: 10.5365/wpsar.2023.14.2.999 https://ojs.wpro.who.int/6 dominguez et alantimicrobial use in patients with confirmed covid-19 infection a larger and more diverse sample size that could include other provinces in the country to obtain a better understanding of trends in antimicrobial use in patients with confirmed covid-19 infection. antibiotic use was high among patients with confirmed covid-19 in the tertiary hospital in the philippines during the first year of the pandemic despite a low prevalence of confirmed bacterial coinfection. similarly, the high rates of prescribing antibiotics for covid-19 patients were observed globally, especially in the first year of the pandemic, for both severe and non-severe cases. factors associated with antibiotic use were radiologic evidence of bilateral infiltrates, severity of covid-19 pneumonia and leucocytosis. the similarities in the clinical manifestations of both viral and bacterial infections may have contributed to the increased use of antimicrobials during this period, as well as there being no antiviral treatment for covid-19 available at that time. judicious use of antibiotics in the treatment of covid-19, as well as other viral infections (e.g. influenza), is required to prevent antibiotic resistance in accordance with the principles of antimicrobial stewardship. acknowledgements the authors express their sincere gratitude to mr norbert angalan, ms angela j dominguez and the authors’ families for their unending support. conflicts of interest the authors have no conflicts of interest to declare. ethics approval permission to conduct this study at the hospital was obtained from the medical director and vice president for hospital affairs. research ethics approval was obtained from the university research ethics committee. all charts were identified by code number and did not contain the names of the participants. all data were coded and were kept confidential and anonymous. charts were reviewed within the hospital premises. funding none. et al.24 reported a similar finding in a hospital in hong kong special administrative region (china). this study also showed that the severity of illness was associated with antibiotic use, suggesting that disease severity had a potential role in the decision to prescribe antibiotics to covid-19 patients. patients who are severely to critically ill develop a systemic inflammatory response that may lead to lung injury and organ dysfunction, ultimately increasing the risk of bacterial coinfection. a study by nasir et al.29 showed that patients with severe to critical covid-19 infection on admission had 4.42 times higher risk of bacterial infection. langford et al.30 reported that the percentage of antibiotic use was especially high in patients in the intensive care unit and for those requiring mechanical ventilation. however, in a scoping review of the first 6 months of the pandemic, antibiotics were prescribed to covid-19 patients regardless of severity of illness, with similar proportions prescribed to patients with severe or critical illness (75.4%) and patients with mild or moderate illness (75.1%).31 chedid et al.32 suggested that although antibiotic treatment was more prevalent in more severe patients, half of the patients who received antibiotics were not severe, suggesting a tendency to extend indications of antibiotic therapy to non-severe patients. antibiotic use was also influenced by elevated white blood cell counts in the present study. covid-19 patients usually have normal white blood cell counts. a study by huang et al.18 reported that white blood cell counts in patients with covid-19 on admission indicated leucopenia (25%) with lymphocytic predominance (64%). leucocytosis with neutrophilic predominance alerts physicians to the presence of bacterial coinfection. a study by he et al.33 showed that antibiotic prescription was significantly more common in patients with leucocytosis. in contrast, the study by cheng et al.24 demonstrated that antibiotics were commonly ordered even if routine blood tests showed normal white blood cell count. the limited number of patients in this study restricts the generalization of the results to a broader population, as does the lack of a comparison group, such as antibiotic prescription rates prior to the covid-19 pandemic, to determine if antibiotic-prescribing habits changed or increased during the covid-19 pandemic. therefore, we recommend that a similar study be conducted with wpsar vol 14, no 2, 2023 | doi: 10.5365/wpsar.2023.14.2.999https://ojs.wpro.who.int/ 7 antimicrobial use in patients with confirmed covid-19 infectiondominguez et al 15. vaughn vm, gandhi tn, petty la, patel pk, prescott hc, malani an, et al. empiric antibacterial therapy and communityonset bacterial coinfection in patients hospitalized with coronavirus disease 2019 (covid-19): a multi-hospital cohort study. clin infect dis. 2021;72(10):e533–41. doi:10.1093/cid/ciaa1239 pmid:32820807 16. garcia-vidal c, sanjuan g, moreno-garcia e, puerta-alcalde p, garcia-pouton n, chumbita m, et al. incidence of co-infections and superinfections in hospitalized patients with covid-19: a retrospective cohort study. clin microbiol infect. 2021;27(1):83–8. doi:10.1016/j.cmi.2020.07.041 pmid:32745596 17. langford bj, so m, raybardhan s, leung v, soucy j-p, westwood d, et al. antibiotic prescribing in patients with covid-19: rapid review and meta-analysis. clin microbiol infect. 2021;27(4):520–31. doi:10.1016/j.cmi.2020.12.018 pmid:33418017 18. huang c, wang y, li x, ren l, zhao j, hu y, et al. clinical features of patients infected with 2019 novel coronavirus in wuhan, china. lancet. 2020;395(10223):497–506. doi:10.1016/s01406736(20)30183-5 pmid:31986264 19. piva s, filippini m, turla f, cattaneo s, margola a, de fulviis s, et al. clinical presentation and initial management critically ill patients with severe acute respiratory syndrome coronavirus 2 (sarscov-2) infection in brescia, italy. j crit care. 2020;58:29–33. doi:10.1016/j.jcrc.2020.04.004 pmid:32330817 20. wu j, liu j, zhao x, liu c, wang w, wang d, et al. clinical characteristics of imported cases of coronavirus disease 2019 (covid-19) in jiangsu province: a multicenter descriptive study. clin infect dis. 2020;71(15):706–12. doi:10.1093/cid/ciaa199 pmid:32109279 21. zhou p, liu z, chen y, xiao y, huang x, fan x-g. bacterial and fungal infections in covid-19 patients: a matter of concern. infect control hosp epidemiol. 2020;41(9):1124–5. doi:10.1017/ ice.2020.156 pmid:32317036 22. beovic b, dousak m, ferreira-coimbra j, nadrah k, rubulotta f, belliato m, et al. antibiotic use in patients with covid-19: a ‘snapshot’ infectious diseases international research initiative (idiri) survey. j antimicrob chemother. 2020;75(11):3386–90. doi:10.1093/jac/dkaa326 pmid:32766706 23. philippine covid-19 living recommendations: 2023 update. quezon city: philippine society for microbiology and infectious diseases; 2023. available from: https://www.psmid.org/philippine-covid 19-living-recommendations-3/, accessed 14 april 2023. 24. cheng ls, chau sk, tso ey, tsang sw, li iy, wong bk, et al. bacterial co-infections and antibiotic prescribing practice in adults with covid-19: experience from a single hospital cluster. ther adv infect dis. 2020;7:2049936120978095. doi:10.1177/2049936120978095 pmid:33335724 25. zhang g, hu c, luo l, fang f, chen y, li j, et al. clinical features and short-term outcomes of 221 patients with covid-19 in wuhan, china. j clin virol. 2020;127:104364. doi:10.1016/j. jcv.2020.104364 pmid:32311650 26. hughes s, troise o, donaldson h, mughal n, moore ls. bacterial and fungal coinfection among hospitalized patients with covid-19: a retrospective cohort study in a uk secondary-care setting. clin microbiol infect. 2020;26(10):1395–9. doi:10.1016/j. cmi.2020.06.025 pmid:32603803 27. philippine clinical practice guidelines. diagnosis, empiric management and prevention of community-acquired pneumonia in immunocompetent adults: 2016 update. quezon city: philippine society for microbiology and infectious diseases; 2016. available from: http://thepafp.org/website/wp-content/uploads/2017/05/2016cap-by-psmid.pdf, accessed 26 february 2021. references 1. zhou f, yu t, du r, fan g, liu y, liu z, et al. clinical course and risk factors for mortality of adult inpatients with covid-19 in wuhan, china: a retrospective cohort study. lancet. 2020;395(10229):1054– 62. doi:10.1016/s0140-6736(20)30566-3 pmid:32171076 2. who coronavirus (covid-19) dashboard. geneva: world health organization; 2020. available from: https://covid19.who.int/, accessed 14 april 2023. 3. wrenn jo, pakala sb, vestal g, shilts mh, brown hm, strickland ba, et al. covid-19 severity from omicron and delta sars-cov-2 variants. influenza other respir viruses. 2022;16(5):832–6. doi:10.1111/irv.12982 pmid:35415869 4. lansbury l, lim b, baskaran v, lim ws. co-infections in people with covid-19: a systematic review and meta-analysis. j infect. 2020;8(2):266–75. doi:10.1016/j.jinf.2020.05.046 pmid:32473235 5. covid-19 and the older filipino population: how many are at risk? quezon city: university of the philippines population institute and demographic research and development foundation, inc.; 2020. available from: https://www.uppi.upd.edu.ph/research/covid-19/ rb1, accessed 30 december 2020. 6. rothe k, feihl s, schneider j, wallnöfer f, wurst m, lukas m, et al. rates of bacterial co-infections and antimicrobial use in covid-19 patients: a retrospective cohort study in light of antibiotic stewardship. eur j clin microbiol infect dis. 2021;40(4):859–69. doi:10.1007/s10096-020-04063-8 pmid:33140176 7. sieswerda e, de boer mg, bonten mm, boersma wg, jonkers re, aleva rm, et al. recommendations for antibacterial therapy in adults with covid-19 – an evidence based guideline. clin microbiol infect. 2021;27(1):61–6. doi:10.1016/j.cmi.2020.09.041 pmid:33010444 8. chen x, liao b, cheng l, peng x, xu x, li y, et al. the microbial coinfection in covid-19. appl microbiol biotechnol. 2020;104(18):7777–85. doi:10.1007/s00253-020-10814-6 pmid:32780290 9. chen l, zhou f, li h, xing x, han x, wang y, et al. disease characteristics and management of hospitalised adolescents and adults with community-acquired pneumonia in china: a retrospective multicentre survey. bmj open. 2018;8(2):e018709. doi:10.1136/ bmjopen-2017-018709 pmid:29449294 10. huttner bd, catho g, pano-pardo jr, pulcini c, schouten j. covid-19: don’t neglect antimicrobial stewardship principles. clin microbiol infect. 2020;26(7):808–10. doi:10.1016/j.cmi.2020.04.024 pmid:32360446 11. antimicrobial stewardship: systems and processes for effective antimicrobial medicine use. london: national institute for health and care excellence; 2015. available from: https://www.nice.org.uk/ guidance/ng15, accessed 5 january 2021. 12. hsu j. how covid-19 is accelerating the threat of antimicrobial resistance. bmj. 2020;369:m1983. doi:10.1136/bmj.m1983 pmid:32423901 13. healthcare professionals alliance against covid-19. unified covid-19 algorithms. quezon city: philippine society for microbiology and infectious diseases; 2022. available from: https://www.psmid. org/unified-covid-19-algorithms-5/, accessed 31 may 2023. 14. rawson tm, moore ls, zhu n, ranganathan n, skolimowska k, gilchrist m, et al. bacterial and fungal coinfection in individuals with coronavirus: a rapid review to support covid-19 antimicrobial prescribing. clin infect dis. 2020;71(9):2459–68. doi:10.1093/cid/ ciaa530 pmid:32358954 https://www.uppi.upd.edu.ph/research/covid-19/rb1 https://www.nice.org.uk/guidance/ng15 https://www.psmid.org/unified-covid-19-algorithms-5/ wpsar vol 14, no 2, 2023 | doi: 10.5365/wpsar.2023.14.2.999 https://ojs.wpro.who.int/8 dominguez et alantimicrobial use in patients with confirmed covid-19 infection 31. cong w, poudel an, alhusein n, wang h, yao g, lambert h. antimicrobial use in covid-19 patients in the first phase of the sarscov-2 pandemic: a scoping review. antibiotics. 2021;10(6):745. doi:10.3390/antibiotics10060745 pmid:34205440 32. chedid m, waked r, haddad e, chetata n, saliba g, choucair j. antibiotics in treatment of covid-19 complications: a review of frequency, indications, and efficacy. j infect public health. 2021;14(5):570–6. doi:10.1016/j.jiph.2021.02.001 pmid:33848886 33. he s, liu w, jiang m, huang p, xiang z, deng d, et al. clinical characteristics of covid-19 patients with clinically diagnosed bacterial coinfection: a multi-center study. plos one. 2021;16(4):e0249668. doi:10.1371/journal.pone.0249668 pmid:33819304 28. abad cl, sandejas jc, poblete jb, malundo af, salamat ms, alejandria mm. bacterial coinfection and antimicrobial use among patients with covid-19 infection in a referral center in the philippines: a retrospective cohort study. ijid reg. 2022;4:123–30. doi:10.1016/j.ijregi.2022.07.003 pmid:35822190 29. nasir n, rehman f, omair sf. risk factors for bacterial infections in patients with moderate to severe covid-19: a case-control study. j med virol. 2021;93(7):4564–9. doi:10.1002/jmv.27000 pmid:33822390 30. langford bj, so m, raybardhan s, leung v, soucy j-p, westwood d, et al. antibiotic prescribing in patients with covid-19: rapid review and meta-analysis. clin microbiol infect. 2021;27(4):520–31. doi:10.1016/j.cmi.2020.12.018 pmid:33418017 https://ojs.wpro.who.int/ 1wpsar vol 14, no 2, 2023 | doi: 10.5365/wpsar.2023.14.2.989 lessons from the field problem graduates and fellows of the field epidemiology training programme of papua new guinea (fetpng) were part of the national coronavirus disease (covid-19) response. however, the specific activities and challenges experienced by fetp fellows in the field were not known. given the important role of field epidemiologists in emergency response, the fetp faculty conducted a review to understand what worked well, what worked less well, the scope of activities undertaken by fellows during the covid-19 response, how prepared fellows felt, their confidence in performing key field epidemiology tasks during the response and what fetpng could do better to prepare fellows for future infectious disease emergencies. context the covid-19 pandemic has tested public health emergency response capacity across the world. the first case of covid-19 was confirmed in papua new guinea (png) a hunter new england health, new lambton, new south wales, australia. b university of newcastle, newcastle, new south wales, australia. c national department of health, port moresby, papua new guinea. d world health organization representative office for papua new guinea, port moresby, papua new guinea. e department of health, autonomous bougainville government, autonomous region of bougainville, papua new guinea. f western highlands provincial health authority, western highlands province, papua new guinea. published: 24 june 2023 doi: 10.5365/wpsar.2023.14.2.989 problem: fellows of the papua new guinea field epidemiology training programme (fetp) were part of the national coronavirus disease (covid-19) response. however, the specific activities and challenges experienced by fellows in the field were unknown. context: the advanced fetp cohort commenced just prior to the covid-19 pandemic and all fellows were involved in the response. the advanced fellows participating in this review represented a cross-section of the country’s public health workforce. action: a review was conducted to better understand the scope of activities undertaken by fetp fellows, identify the challenges experienced and assess how well the programme prepared fellows for their covid-19 response roles. a facilitated discussion based on the world health organization covid-19 intra-action review methodology and an online survey was conducted with advanced fetp fellows. outcome: the fellows made important contributions to the national covid-19 response by assuming leadership positions at all levels of government, leading training activities and applying core field epidemiology competencies in surveillance and response activities. the programme had prepared them well for the response, giving them the confidence and skills to undertake a diverse range of response roles. discussion: the fetp review of the covid-19 response in papua new guinea highlighted the role and influence of the fellows during the pandemic response. fellows were able to apply core field epidemiology competencies across a range of roles. the recommendations derived from this review will be instructive for the fetp specifically and the covid-19 response generally. involvement and readiness of fellows from papua new guinea’s field epidemiology training programme in the covid-19 response, 2020–2021 james a flint,a,b joanne taylor,a,b tambri housen,b barry ropa,c bernnie smaghi,d laura macfarlane-berry,b celeste marsh,b alois pukienei,e mathias baurif and david n durrheima,b correspondence to james a flint (email: james.flint@health.nsw.gov.au) wpsar vol 14, no 2, 2023 | doi: 10.5365/wpsar.2023.14.2.989 https://ojs.wpro.who.int/2 flint et alpapua new guinea’s fetp covid-19 readiness, 2020-2021 action facilitated discussion a 1-day review was held with afetpng fellows during their second face-to-face training workshop. we adapted the world health organization (who) covid-19 intraaction review methodology,11 framing discussions with fetp fellows around who’s emergency response pillars which were used to guide a country’s covid-19 response.12 the pillars we focused on were: • risk communications and community engagement (pillar 2); • surveillance, case investigation, laboratory (pillars 3 and 5); • case management and infection prevention and control (pillars 6 and 7); and • operational support and logistics (pillar 8). facilitated discussions identifying what went well and what went less well during the covid-19 response were held, which included a root cause analysis.11,13 findings from the root cause analysis were used to develop recommendations for action. online survey understanding the contribution of afetpng fellows during the covid-19 response, their role, how well prepared they felt and their confidence in performing key field epidemiology tasks during the response was carried out through an online survey.13 the survey also asked how fetpng could better prepare fellows for future infectious disease emergency responses. outcome facilitated discussion the findings from the facilitated discussion and key recommendations derived from root cause analysis were organized into four groups based on the who pillars (table 1). online survey fifteen (88%) afetpng fellows responded to the survey. all 15 (100%) were involved in the covid-19 response in on 6 march 2020 and the country has experienced multiple waves since that time, relying heavily on international and domestic border control measures as well as contact tracing, quarantine and isolation to suppress transmission and preserve health systems.1,2 as of 22 august 2022, 44 861 confirmed cases of covid-19, including 664 deaths, were reported in png.3 fetps are supervised, on-the-job, competencybased training programmes for public health professionals. they train field epidemiologists to collect, analyse and interpret public health information, using evidence to take action and save lives. the skills of locally trained field epidemiologists are well suited to support public health emergency response activities.4 as health security concerns have grown globally, fetps have become increasingly recognized in global, regional and national preparedness and response mechanisms.5 field epidemiologists are identified as important human resource requirements for implementation of the international health regulations (2005), or ihr (2005).6,7 the global health security agenda, launched in 2014 to support ihr (2005) implementation, highlights workforce training as a key element in strengthening health security.8 fetps are a key part of training this health security workforce. regionally, the asia pacific strategy for emerging diseases (apsed iii) has identified the importance of fetps in progressing ihr (2005).9 png has been running an intermediate level (9-month) fetp since 201310 and recently initiated an extended 18-month programme, known as the advanced fetpng (afetpng). as of july 2022, there were 94 intermediate fetp graduates working across all 22 provinces of the country and 17 fellows enrolled in afetpng. the afetpng cohort commenced in 2019 just prior to the covid-19 pandemic, and work in 13 of png’s 22 provinces (59%). they represent all levels of the government’s public health workforce, with fellows recruited from district (n = 7), provincial (n = 9) and national levels (n = 1). the substantive roles of fellows included surveillance officers, health extension officers, district health managers, disease programme managers, provincial disease control officers, the fetp convenor and a provincial deputy director of public health. wpsar vol 14, no 2, 2023 | doi: 10.5365/wpsar.2023.14.2.989https://ojs.wpro.who.int/ 3 papua new guinea’s fetp covid-19 readiness, 2020-2021flint et al table 1. summary of what worked well, what worked less well and key recommendations for the advanced field epidemiology training programme of papua new guinea, based on root cause analysis, april 2022 risk communications and community engagement worked well worked less well recommendations • using established systems and community structures • partnerships with key stakeholders • community leaders trained and engaged in covid-19 awareness • risk communications training for health-care workers (hcws) at provincial and district levels • good political influence in the community • other partners helped develop information, education and communication (iec) materials that were easy to understand by the community • misinformation about covid-19 vaccination and the impact this has on covid-19 vaccination and routine immunization • hcws spreading false rumours about the virus and covid-19 vaccination • lack of established partnerships with communities affected communication and engagement efforts • provincial communication officers not always available • limited use of local languages in iec materials • establish and maintain strong working relationships with community leaders and partners • establish high-quality training-oftrainers strategies to ensure hcws at all levels are knowledgeable across response needs • establish recruitment strategy at provincial level to ensure adequate professional health staff to raise public health awareness alongside risk communication experts • continue to work with and build relationships with partners surveillance, case investigation, laboratory worked well worked less well recommendations • roll out of rapid antigen test kits • provincial-level management support for surveillance activities • opportunities afforded to field epidemiology training programme (fetp) fellows to apply surveillance skills • purchase of two-way radios for surveillance teams • training of health extension officers at district level to collect specimens • capitalizing on covid-19 surveillance to strengthen other reporting systems • proactive response supported by appropriate legislation • turnaround time for polymerase chain reaction (pcr) results (2–4 weeks) • turnaround time for whole genome sequencing • lack of training in data management • no dedicated data management officers at provincial or district levels for covid-19 • roll out covid-19 rapid antigen tests at all facilities, including aid posts • ensure supply of rapid antigen tests is adequate • develop a sensitization programme to highlight the value of surveillance to management within the province ing to support them in their covid-19 response roles. almost all fellows (93%; n = 14) were involved in training others in support of the covid-19 response, with fellows conducting an average of four training activities (range 1–15) in 2021. the 14 fellows collectively trained over 700 individuals. core fetp competencies, such as disease surveillance, outbreak response and data analysis, were all highlighted as being useful in preparing fellows for the covid-19 response. fellows also identified that the png. when asked about their involvement in covid-19 throughout 2021, just over half (53%; n = 8) reported working full time on the response. of those not in a fulltime role, 13% (n = 2) worked on the response 3–4 days per week and 33% (n = 5) 1–2 days per week. the most common covid-19 response roles undertaken included leading surveillance activities, providing advice to stakeholders, leading rapid response teams (rrts), contact tracing and conducting training. the majority (80%; n = 12) of fellows received specific trainwpsar vol 14, no 2, 2023 | doi: 10.5365/wpsar.2023.14.2.989 https://ojs.wpro.who.int/4 flint et alpapua new guinea’s fetp covid-19 readiness, 2020-2021 case management and infection prevention and control worked well worked less well recommendations • when available, rapid antigen tests helped with timely case detection/ diagnosis • improved health facilities (e.g. construction of new wards and isolation facilities, instalment of incinerators, etc.) • creation and dissemination of treatment protocols • engagement of mental health counsellors • limited or no patient transport available • no expertise to deal with mental health problems • standard treatment protocols not always available, confusion around the use of ivermectin • insufficient human resources for case management and infection prevention and control • poor coordination and cooperation between clinical and public health response • poor compliance with case isolation • direct funding and resources to boost health-care workforce • provide staff incentives for additional responsibilities • target educational resources to promote vaccination among hcws • build new isolation facilities or separate covid-19 wards with dedicated staff to work in them • ensure resources are allocated to home isolation monitoring • strengthen and invest in sustainability of call centres in all provinces (for example, integrate the call centre with the disaster office) • offer staff incentive packages and infection prevention and control training for those who work with covid-19 patients response, operational support and logistics worked well worked less well recommendations • integration of covid-19 response with other programmes • establishment of rapid response teams (rrts) to support the response • strengthened emergency operations centres at the provincial level • coordination of funding available for covid-19 response • involvement of partners/ commercial properties to support response needs • staff shortage – inadequate staffing resulted in multi-tasking, exhaustion and mental stress • waste management issues (e.g. non-functional incinerators) • delay in receiving funds for the response • disruption to routine services, including routine childhood immunization • funding impacts on other programmes • poor compliance with control measures (mask wearing, physical distancing, isolation, quarantine, vaccination) • establish and allocate funding for a rrt in every province; use existing workforce to formulate rrts • ensure there is a provincial budget for covid-19 response and outbreaks with programme-based budgeting • establish processes at provincial level to facilitate rapid mobilization of financial and human resources in response to public health emergencies (with minimal impact on routine services) • provide targeted education and incentives to promote vaccination of hcws at all levels “there is recognition of fetp grads who are identified to take lead roles in the response.” “from the fetp training – we could actively participate as a team lead in rrt, conduct contact tracing, case investigation and surveillance – across all areas of response.” fellows felt most confident supporting or leading case investigation and contact tracing activities, and least confident supporting or leading risk communication, community engagement, specimen handling and fetp provided them with confidence, enabling them to fill leadership roles, conduct public speaking and influence decision-makers. “decision makers have confidence in me presenting analysed data on covid-19.” “as an fetp fellow, i have been appointed incident manager – i took a lead in surveillance, contact tracing, risk communication and community engagement.” “there is respect for the [fetp] course.” wpsar vol 14, no 2, 2023 | doi: 10.5365/wpsar.2023.14.2.989https://ojs.wpro.who.int/ 5 papua new guinea’s fetp covid-19 readiness, 2020-2021flint et al based on the findings from the facilitated discussion and the online survey, the faculty prioritized the following actions: • revise the intermediate and advanced fetpng curricula to include additional training on areas highlighted by fellows, especially risk communication and community engagement; • develop supplementary training, tools and resources to enable fellows and graduates to master core fetp competencies; fellows identified elearning modules (provided in both offline and online formats), further refresher training opportunities, and a written technical manual with png examples; • develop mechanisms to support graduates in the ongoing application of fetp knowledge and skills in the workplace through activities such as individual and group-based projects for graduates and ongoing mentorship (including during outbreak response activities); • develop and deliver a sensitization training programme for senior management to promote the best utilization of field epidemiology graduates in the workplace; and • advocate for the creation of designated field epidemiology positions within the public health service, providing a clear career pathway for graduates. this fetp covid-19 review was limited to fellows enrolled in the advanced fetp and did not include feedback from fellows or graduates of the intermediate fetp. thus, these findings are not representative of all fetp fellows and graduates and cannot be generalized to the whole fetpng population. this covid-19 review supports a culture of ongoing reflection and evaluation. the recommendations are instructive for fetpng specifically and the covid-19 response generally. findings from this review support previous work focusing on workforce issues during emergency responses.4,14,15 this review has highlighted the important contribution of the fetp fellows during the covid-19 response, and the need for the programme to adapt to better prepare png’s field epidemiology workforce for future challenges. shipping, and infection prevention and control activities (supplementary table 1). areas for strengthening the response capacity of graduates included further training on tools to support surveillance, data management, analysis and interpretation, risk communications and community engagement, psychological first aid, management and leadership during public health emergencies, and the establishment of rrts. fellows highlighted a need for more careful consideration and inclusion of gender issues when responding to emergencies and commented on connectivity challenges associated with virtual training. most fellows (93%; n = 14) reported that the intermediate and advanced fetps were very helpful in preparing them for the covid-19 response, while one respondent (7%) indicated the programmes were moderately helpful. half (n = 7) of the fellows indicated that their manager was very aware of their skills as a field epidemiologist, 36% (n = 5) of managers were somewhat aware and 14% (n = 2) were not aware. most of the fellows (79%; n = 11) indicated that their skills in field epidemiology were well utilized by their managers during the covid-19 response. when asked what could be done to improve the use of fetp graduates and fellows by management, the following themes emerged: (i) the need for management to recognize the potential of field epidemiologists and make use of them in leadership positions; (ii) the creation of designated field epidemiology positions within the public service; (iii) fetp sensitization training for managers; and (iv) the need for fetp fellows and graduates to appropriately manage up, including proactively presenting their surveillance and project findings to management. discussion the covid-19 review highlighted the role and influence of afetpng fellows during the pandemic response. fellows were able to apply core field epidemiology competencies across a range of roles. the diversity of their roles highlights the value and versatility of field epidemiologists in public health emergencies. while the majority of fellows found the fetp training very helpful in preparing them for a pandemic response, they identified areas for improvement. wpsar vol 14, no 2, 2023 | doi: 10.5365/wpsar.2023.14.2.989 https://ojs.wpro.who.int/6 flint et alpapua new guinea’s fetp covid-19 readiness, 2020-2021 6. international health regulations (2005), 3rd ed. geneva: world health organization; 2016. available from: https://apps.who.int/ iris/handle/10665/246107, accessed 31 august 2022. 7. joint external evalaution tool: international health regulations (2005): jee reporting template. geneva: world health organizaton; 2016. available from: https://apps.who.int/iris/handle/10665/252754, accessed 31 august 2022. 8. jones ds, dicker rc, fontaine re, boore al, omolo jo, ashgar rj, et al. building global epidemiology and response capacity with field epidemiology training programs. emerging infect dis. 2017;23(13):s158–65. doi:10.3201/eid2313.170509 pmid:29155658 9. asia pacific strategy for emerging diseases and public health emergencies (apsed iii) : advancing implementation of the international health regulations (2005) : working together towards health security. manila: who regional office for the western pacific; 2017. available from: https://apps.who.int/iris/handle/10665/259094, accessed 31 august 2022. 10. ropa b, flint j, o’reilly m, pavlin bi, dagina r, peni b, et al. lessons from the first 6 years of an intervention-based field epidemiology training programme in papua new guinea, 2013–2018. bmj glob health. 2019;4(6):e001969. doi:10.1136/bmjgh-2019-001969 pmid:31908873 11. guidance for conducting a country covid-19 intra-action review (iar), 23 july 2020. geneva: world health organization; 2020. available from: https://apps.who.int/iris/handle/10665/333419, accessed 31 august 2022. 12. covid-19 strategic preparedness and response plan: operational planning guideline: 1 february 2021 to 31 january 2022. geneva: world health organization; 2021. available from: https://apps.who. int/iris/handle/10665/340073, accessed 31 august 2022. 13. flint j. field epidemiology training program of papua new guinea (fetpng): advanced fetpng fellows involvement and readiness for covid-19 response – a fetpng intra action review protocol, version 1.0, february 2022: annex a. workshop 2: covid review. facilitator guide for intra-action review. newcastle (nsw): hunter new england health / university of newcastle; 2022. available from: https://static1.squarespace.com/ static/5fb4723e225bcb20d28f0f76/t/62e9e24de578d76daf9d3 89b/1659494990414/afetpng+intra+action+review+covid++protocol.pdf, accessed 22 march 2023. 14. parry ae, kirk md, durrheim dn, olowokure b, colquhoun s, housen t. emergency response and the need for collective competence in epidemiological teams. bull world health organ. 2021;99(5):351–8. doi:10.2471/blt.20.276998 pmid:33958823 15. parry ae, kirk md, durrheim dn, olowokure b, colquhoun sm, housen t. shaping applied epidemiology workforce training to strengthen emergency response: a global survey of applied epidemiologists, 2019–2020. hum resour health. 2021;19(1):58. doi:10.1186/s12960-021-00603-1 pmid:33926469 acknowledgements the authors acknowledge the technical expertise and coordination support of the png national department of health, fetpng and who. conflicts of interest the authors have no conflicts of interest to declare. ethics statement this activity met the university of newcastle’s requirements for a quality assurance project and did not require review by the human research ethics committee. funding fetpng is funded by the who representative office for papua new guinea, field epidemiology in action (university of newcastle / hunter new england heath) and the indo-pacific centre for health security (australian department of foreign affairs and trade). references 1. smaghi bs, collins j, dagina r, hiawalyer g, vaccher s, flint j, et al. barriers and enablers experienced by health care workers in swabbing for covid-19 in papua new guinea: a multi-methods cross-sectional study. int j infect dis. 2021;110:s17–24. doi:10.1016/j.ijid.2021.04.077 pmid:33991678 2. covid-19 response in papua new guinea. port moresby: who representative office for papua new guinea; 2021. available from: https://www.who.int/papuanewguinea/emergencies/covid-19-inpapuanewguinea, accessed 15 july 2022. 3. coronavirus disease 2019 (covid-19) health situation report #137, 08 august 2022, papua new guinea. port moresby: papua new guinea national department of health; 2022. 4. parry ae, kirk md, colquhoun s, durrheim dn, housen t. leadership, politics, and communication: challenges of the epidemiology workforce during emergency response. hum resour health. 2022;20(1):33. doi:10.1186/s12960-022-00727-y pmid:35410336 5. hilmers a. on the first world field epidemiology day, honoring our disease detectives on the front lines. int j infect dis. 2021;110(suppl 1):s1–2. doi:10.1016/j.ijid.2021.08.070 pmid:34481071 https://apps.who.int/iris/handle/10665/246107 https://apps.who.int/iris/handle/10665/340073 https://static1.squarespace.com/static/5fb4723e225bcb20d28f0f76/t/62e9e24de578d76daf9d389b/1659494990414/afetpng+intra+action+review+covid+-+protocol.pdf oseltamivir resistance among influenza viruses: surveillance in northern viet nam, 2009–2012 original research hoang vu mai-phuong,a nguyen co thach,a nguyen le khanh hang,a nguyen thi kim phuonga and le quynh maia a national influenza center, national institute of hygiene and epidemiology, hanoi, vietnam. b military hospital 108, hanoi, vietnam. correspondence to hoang vu mai-phuong (e-mail: lom9@nihe.org.vn or hoangmp9906@gmail.com). to cite this article: hoang vu mp et al. oseltamivir resistance among influenza viruses: surveillance in northern viet nam, 2009–2012. western pacific surveillance and response journal, 2013, 4(2):25–29. doi:10.5365/wpsar.2013.4.1.010 abstract introduction: antiviral resistance has been reported in seasonal influenza a viruses and avian influenza a(h5n1) viruses in viet nam, raising concerns about the efficacy of treatment. methods: we analysed specimens from two sources during the period 2009–2012: influenza-positive samples from influenza-like illness patients at sentinel clinics in northern viet nam and isolates from patients with confirmed a(h5n1) infections. pyrosequencing was used to detect mutations: h275y [for a(h1n1) and a(h5n1)], e119v [for a(h3n2)] and i117v [for a(h5n1)]. a neuraminidase inhibition assay was used to determine the inhibitory concentration 50 (ic50) values for all influenza a and b isolates. results: there were 341 influenza a positive samples identified; influenza a(h1n1)pdm09 was identified most frequently (n = 215). in 2009, oseltamivir resistance was observed in 100% (19 of 19) of seasonal a(h1n1) isolates and 1.4% (3/215) of a(h1n1)pdm09 isolates. this h275y mutation was not found in influenza subtypes a(h5n1) or a(h3n2) isolates. discussion: in viet nam, seasonal and a(h5n1) influenza vaccines are not currently available; thus, effective treatment is required. the presence of oseltamivir-resistant viruses is therefore a concern. active surveillance for oseltamivir resistance among influenza viruses circulating in viet nam should be continued. introduction influenza infection causes annual epidemics throughout the world. there are two common types of influenza viruses that cause human infection – influenza a and influenza b. influenza a viruses caused several influenza pandemics in the 20th century, and a pandemic caused by the influenza a(h1n1)pdm09 virus occurred in 2009.1 national influenza surveillance was initiated in viet nam in 2006, and the data collected so far have shown that influenza viruses circulate year-round with similar peaks and subtypes observed across all surveillance regions.2 between 2003 and 2012, 123 human cases of a(h5n1) infection were confirmed from 40 of the 63 provinces in viet nam, with 81 cases (66%) from northern viet nam.3 although influenza vaccines that protect against a(h1n1)pdm09 or influenza a(h5n1) are being developed in viet nam, they are currently only available through private market purchase. the neuraminidase inhibitors oseltamivir and zanamivir are the primary antiviral agents recommended for the treatment of influenza infections,4,5 yet antiviral resistance to influenza a viruses is increasingly being reported.6,7 oseltamivir is currently recommended as the first-line option by the viet nam ministry of health for treating suspected infections of a(h5n1) and a(h1n1)pdm09. the emergence of oseltamivir resistance of clinical isolates of influenza a virus has been associated with substitution at residue v116, i117, e119, q136, k150, d151, d199, i223, h275 and n295 in the neuraminidase active site.8 for influenza b there have been two main substitutions: residues r152 and d198.8,9 in viet nam, oseltamivir-resistant strains harboring mutations at positions i117v, h275y and n295s were reported for a(h5n1) in 2005,6 a(h1n1) in 200710 and a(h1n1)pdm09 in 2009.7,11 the limitations of other antiviral drugs, as well as the risk of oseltamivir resistance, have raised concerns about the efficacy of oseltamivir for influenza infection treatment. we report here on a pilot study for the establishment of a routine antiviral resistance surveillance programme in northern viet nam. materials and methods as an initial step in establishing a surveillance programme for antiviral resistance in northern viet nam, genetic analysis was conducted for both clinical specimens and isolates collected through sentinel sites and isolates of influenza a(h5n1). neuraminidase activity was measured using a phenotypic method for viral isolates of influenza a and b. pyrosequencing assays were then applied to detect the common mutations related to reducing susceptibility or resistance of influenza a viruses to oseltamivir – i117v, e119v and h275y. data from the national influenza surveillance system in viet nam were also analysed for the period 2009–2012. source of samples throat swabs were collected as part of the sentinel surveillance system for influenza-like illness in northern viet nam between 2009 and 2012 and were screened using standard methodology (conventional reverse transcriptase polymerase chain reaction, rt–pcr) at the national influenza center of the national institute of hygiene and epidemiology in hanoi.2 influenza isolates were then cultured from throat swabs positive for influenza a and b.2,6 in addition, isolates from throat swabs, pharyngeal swabs or tracheal swabs collected from a(h5n1)-infected patients admitted to intensive care units of general hospitals in northern viet nam between 2009 and 2012 were obtained. madin-darby canine kidney (mdck) cells, obtained from the american type culture collection, were used to culture viruses. swabs positive for influenza a(h5n1) by rt–pcr were inoculated biosafety level iii culture facilities. viruses were harvested and stored at −80 ˚c for further analysis. all influenza isolates with a minimum of eight haemagglutination units by haemagglutination inhibition assay were selected for neuraminidase inhibition assay.6,8,10,11 pyrosequencing assay pyrosequencing assays were used to further characterize all rt–pcr influenza-positive samples (n = 341) and influenza isolates (n = 67). viral rna was extracted directly from clinical specimens or from supernatants of isolates propagated in mdck cells by using a viral rna extraction kit (qiagen, usa) according to the manufacturer’s instructions. rt–pcr amplification was conducted using the qiagen pyromark pcr kit with specific primer sets for a(h1n1)pdm09, seasonal a(h1n1), a(h3n2) and a(h5n1).12,13 three sets of rt–pcr primers were used to generate corresponding amplicons of the neuraminidase gene segment covering the sequences encoding the target residues 117, 119 and 275 according to procedures described previously.14 the pyrosequencing reactions and data analysis were performed using a pyromark q24 id platform (qiagen, usa). briefly, biotinylated pcr products were washed through a series of buffers, and single-stranded dna was generated and used as a template for hybridization to residue-specific sequencing primers, which were used at a concentration of 100 µm.11,15 neuraminidase inhibition (nai) assay oseltamivir carboxylate (gs4071) and its active form (gs4104) were provided by roche laboratories, inc, basel, switzerland. the reference influenza viruses were provided by the world health organization (who) collaborating centre for reference and research on influenza, melbourne, australia. influenza a(h5n1) isolates were inactivated by 1% formalin for 24 hours before the nai assay. the nai assay was performed according to procedures described previously.8 results during the period 2009–2012, there was year-round circulation of seasonal influenza viruses with frequent co-circulation of influenza a and influenza b (figure 1). a total of 341 influenza a positive samples were identified by rt–pcr (table 1). of these, influenza a(h1n1)pdm09 was identified most frequently (n = 215) throughout the whole study period; 100 were a(h3n2) and seven were a(h5n1). seasonal a(h1n1) was isolated only in 2009 (n = 19). figure 1. percentage of influenza viruses by subtype, northern viet nam, 2009 to 2012 click to download figure 1. jpg, 475kb table 1. influenza a subtypes and resistance mutations identified by year, northern viet nam, 2009 to 2010 click to download table 1. jpg, 335kb oseltamivir resistance, as determined by detection of h275y in the neuraminidase gene, was observed in 100% (19 of 19) of seasonal a(h1n1) isolates in 2009 and was identified in 1.4% (3/215) of a(h1n1)pdm09 isolates collected in 2009. this h275y mutation was not found in influenza subtypes a(h5n1) or a(h3n2) isolates. i117v was not observed in any of the isolates of subtypes a(h1n1), a(h5n1) or a(h1n1)pdm09; i119v also was not found in any a(h3n2) isolates (table 1). there were 67 isolates that underwent nai assay; six seasonal a(h1n1), 14 a(h3n2), seven a(h5n1), 27 a(h1n1)pdm09 and 13 influenza b. all of the seasonal a(h1n1) isolates (n = 6) had inhibitory concentration 50 (ic50) values that ranged from 541.61 to 703.48 nm higher than the reference virus (a/mississippi/3/2001, oseltamivir-resistant) and reached 1000-fold higher than the reference wild-type virus (a/mississippi/3/2001, oseltamivir-sensitive). among the 27 viruses of a(h1n1)pdm09, ic50 values ranged from 118.59 to 127.91 nm and reached 250-fold higher than the reference wild type virus. the ic50 values obtained from non-mutant viruses [a(h1n1)pdm09, a(h3n2), a(h5n1) or influenza b] had median ic50 ranging from 1.07 nm [a(h1n1)pdm09] to 8.56 nm [a(h5n1)] and 24.79 nm (b), i.e. sensitive to oseltamivir (table 2). table 2. the ic50 of oseltamivir carboxylate of non-mutant and mutant influenza viruses (h275y) by subtype, northern viet nam, 2009 to 2012 click to download table 2. jpg, 456kb ic50 – inhibitory concentration 50 discussion our study of oseltamivir-resistant influenza viruses in northern viet nam shows that seasonal a(h1n1) isolates circulating in 2009 were oseltamivir-resistant by virtue of having the h275y mutation and ic50 values indicative of resistance. this finding is consistent with reports from japan, the united states of america and europe of high rates of resistance (100%) during the 2008 to 2009 season.12,13,15 who also reported the spread of resistant a(h1n1) strains worldwide during that time. the a(h1n1)pdm09 virus was first detected in june 2009 in viet nam and was the predominant virus during the 2009 and 2011 influenza seasons. however, in this study, the oseltamivir-resistent mutation (h275y) was identified in only two specimens in 2009 and one in 2011, a rate of 1.5% in 2009. a separate cluster of seven cases of oseltamivir-resistant a(h1n1)pdm09 was also reported from viet nam in july 2009.5 the rate from this study is consistent with that collected through the who global influenza surveillance and response system of 1.7% frequency of resistance of a(h1n1)pdm09 in the first two years of the pandemic (2009–2010).16,17 similar data reported elsewhere ranged from 0.5% in the united states of america to 0.8% in the united kingdom and 1.1% in the asia-pacific.12,14,18–20 in our study, a(h5n1), a(h3n2) and b viruses were determined to be oseltamivir-sensitive by genotypic and phenotypic testing. these results are reassuring for future treatment of a(h5n1) infections in viet nam with oseltamivir, as the a(h5n1) influenza vaccine is not available. however, an oseltamivir-resistant a(h5n1) virus was reported in human isolates in 2005, and the emergence of mutations associated with reducing susceptibility (i117v) to oseltamivir was also determined among a(h5n1) isolates from both human and poultry in 2009–2010. thus, continuing oseltamivir-resistance surveillance is critical for public health as oseltamivir is the most widely used antiviral medication for h5n1 infection.16 this study is subject to several limitations. the main limitation is the sample size of both biological and viral isolates, as we experienced difficulty in growing influenza a(h3n2) and a(h1n1)pdm09 and the quality of samples caused a reduced number of viral isolates to be tested. also, it should be noted that phenotypic data (and sequencing) can only indicate that a virus is resistant: a direct relationship between ic50 values and actual clinical resistance is yet to be proven. our data represent northern viet nam only and might not provide an accurate picture of the prevalence of oseltamivir-resistant viruses in the whole country. the data collected from the national influenza surveillance system did not report periodic antiviral use, and therefore it is difficult to assume that any resistance found in our study was due to transmitted resistance. active surveillance in the future should be expanded to include data on oseltamivir use in hospitals and private clinics. in conclusion, phenotypic and sequencing data indicated that oseltamivir resistance was present in seasonal a(h1n1) and a(h1n1)pdm09 subtypes in viet nam during the period 2009–2012. an increase of antiviral-resistant influenza viruses might occur in viet nam in the future. enhancing active surveillance by expanding this pilot study to different regions, monitoring the use of oseltamivir, analysing more specimens and reviewing more epidemiological information is recommended for viet nam. conflicts of interest none of declared. funding this study was supported by a grant from the korea center for diseases control. acknowledgements we are grateful the national institute of hygiene and epidemiology for their continued support for our works, we would like to thank technical support from who viet nam and who collaborating center, melbourne, australia. references: dawood fs et al. novel swine-origin influenza a (h1n1) virus investigation team. emergence of a novel swine-origin influenza a (h1n1) virus in humans. the new england journal of medicine, 2009, 360:2605–2615. doi:10.1056/nejmoa0903810 pmid:19423869 nguyen ht et al.; vietnam national influenza surveillance and evaluation team. national influenza surveillance in vietnam, 2006–2007. vaccine, 2009, 28:398–402. doi:10.1016/j.vaccine.2009.09.139 pmid:19853073 cumulative number of avian influenza a(h5n1) cases reported to who. geneva, world health organization, 2012. available from: http://www.who.int/influenza/ human_animal_interface/h5n1_cumulative_table_archives/en/ [accessed 31 december 2012]. hurt ac, ho ht, barr i. resistance to anti-influenza drugs: adamantanes and neuraminidase inhibitors. expert review of anti-infective therapy, 2006, 4:795–805. doi:10.1586/14787210.4.5.795 pmid:17140356 an v et al. molecular characterization of influenza a(h1n1)pdm09 virus circulating during the 2009 outbreak in thua thien hue, vietnam. journal of infection in developing countries, 2013, 7:235–242. doi:10.3855/jidc.2883 pmid:23493002 le qm et al. avian flu: isolation of drug-resistant h5n1 virus. nature, 2005, 437:1108. doi:10.1038/4371108a pmid:16228009 le qm et al. vietnam h1n1 investigation team. a community cluster of oseltamivir-resistant cases of 2009 h1n1 influenza. the new england journal of medicine, 2010, 362:86–87. doi:10.1056/nejmc0910448 pmid:20007549 gubareva lv, webster rg, hayden fg. detection of influenza virus resistance to neuraminidase inhibitors by an enzyme inhibition assay. antiviral research, 2002, 53:47–61. doi:10.1016/s0166-3542(01)00192-9 pmid:11684315 sheu tg et al. surveillance for neuraminidase inhibitor resistance among human influenza a and b viruses circulating worldwide from 2004 to 2008. antimicrobial agents and chemotherapy, 2008, 52:3284–3292. doi:10.1128/aac.00555-08 pmid:18625765 nguyen, lkh. study on influenza infections in northern viet nam during the early years of 2000s [in vietnamese]. viet nam, 2010, 66–68. hurt ac et al. increased detection in australia and singapore of a novel influenza a(h1n1)2009 variant with reduced oseltamivir and zanamivir sensitivity due to a s247n neuraminidase mutation. euro surveillance: european communicable disease bulletin, 2011, 16(23):19884. pmid:21679678 hurt ac et al. emergence and spread of oseltamivir-resistant a(h1n1) influenza viruses in oceania, south east asia and south africa. antiviral research, 2009, 83:90–93. doi:10.1016/j.antiviral.2009.03.003 pmid:19501261 meijer a et al.; european influenza surveillance scheme. oseltamivir-resistant influenza virus a (h1n1), europe, 2007–08 season. emerging infectious diseases, 2009, 15:552–560. doi:10.3201/eid1504.081280 pmid:19331731 lackenby a et al. continued emergence and changing epidemiology of oseltamivir-resistant influenza a(h1n1) 2009 virus, united kingdom, winter 2010/11. euro surveillance: european communicable disease bulletin, 2011, 16(5):19784. pmid:2135056 deyde vm et al.detection of molecular markers of drug resistance in 2009 pandemic influenza a (h1n1) viruses by pyrosequencing. antimicrobial agents and chemotherapy, 2010, 54:1102–1110. doi:10.1128/aac.01417-09 pmid:20028826 mckimm-breschkinjlet al.reduced sensitivity of influenza a (h5n1) to oseltamivir. emerging infectious diseases, 2007, 13:1354–1357. doi:10.3201/eid1309.07-0164 pmid:18252107 summary of influenza antiviral susceptibility surveillance findings, september 2010 – march 2011. geneva, world health organization, 2011. available from: http://www.who.int/influenza/gisrs_laboratory/updates/antiviral_susceptibility/en/ [accessed 31 december 2011]. storms ad et al.; us antiviral resistance surveillance working group. oseltamivir-resistant pandemic (h1n1) 2009 virus infections, united states, 2010–11. emerging infectious diseases, 2012, 18:308–311. doi:10.3201/eid1802.111466 pmid:22305467 dharan nj et al. oseltamivir-resistance working group. infections with oseltamivir-resistant influenza a(h1n1) virus in the united states. jama: journal of the american medical association, 2009, 301:1034–1041. doi:10.1001/jama.2009.294 pmid:19255110 influenza a(h1n1) virus resistance to oseltamivir – 2008/2009 influenza season, northern hemisphere, 18 march 2009. geneva, world health organization, 2009. available from: http://www.who.int/influenza/resources/documents/ h1n1webupdate20090318_ed_ns.pdf [accessed 31 may 2010]. https://ojs.wpro.who.int/ 1wpsar vol 14, no 1, 2023 | doi: 10.5365/wpsar.2023.14.1.974 field investigation report t he coronavirus disease (covid-19) pandemic has impacted people’s well-being globally; cambodia was no exception.1 the first case of covid-19 in cambodia was detected on 27 january 2020. by 31 december 2021, the country had recorded 120 487 cases and 3012 deaths, with a case–fatality rate of 2.5%.2 during the 305 days after the first case of infection with severe acute respiratory syndrome coronavirus 2 (sars-cov-2) was detected, there were only 308 cases, the majority of which were imported, and there were no deaths.2 this suggests that sars-cov-2 was contained early on during the pandemic in cambodia. experts believed that this low number of cases was due to the early implementation of stringent public health and social measures, such as border and school closures, the cancellation of public events and gatherings, extensive mass testing and intensive contact tracing.3 with the arrival of the sars-cov-2 vaccine in february 2021, cambodia was among the few countries to achieve more than 90% vaccination coverage (i.e. two doses or a complete series of doses) of its population aged 12 years and older by september 2021.2 the mission of cambodia’s national institute of public health (niph) is to be the leading public health institute in the country. during the past 10 years, prior to the covid-19 pandemic, niph committed to building its workforce to fulfil this mission by providing opportunities a national institute of public health, phnom penh, cambodia. b university of newcastle, newcastle, new south wales, australia. c australian national university, canberra, australian capital territory, australia. d institute of tropical medicine, antwerp, belgium. published: 22 march 2023 doi: 10.5365/wpsar.2023.14.1.974 objective: this paper examines the contributions made by the national institute of public health to cambodia’s response to the coronavirus disease (covid-19) pandemic during 2020–2021. methods: the activities conducted by the institute were compared with adaptations of the nine pillars of the world health organization’s 2020 covid-19 strategic preparedness and response plan. to gather relevant evidence, we reviewed national covid-19 testing data, information about covid-19-related events documented by institute staff, and financial and technical reports of the institute’s activities. results: the main contributions the institute made were to the laboratory pillar and the incident management and planning pillar. the institute tested more than 50% of the 2 575 391 samples for severe acute respiratory syndrome coronavirus 2 (sars-cov-2) testing and provided technical advice about establishing 18 new laboratories for sars-cov-2 testing in the capital city of phnom penh and 11 provinces. the institute had representatives on many national committees and coauthored national guidelines for implementing rapid covid-19 testing, preventing transmission in health-care facilities and providing treatment. the institute contributed to six other pillars, but had no active role in risk communication and community engagement. discussion: the institute’s support was essential to the covid-19 response in cambodia, especially for laboratory services and incident management and planning. based on the contributions made by the institute during the covid-19 pandemic, continued investment in it will be critical to allow it to support responses to future health emergencies in cambodia. a descriptive assessment of the national institute of public health’s contribution to the covid-19 response in cambodia, 2020–2021 srean chhim,a wuddhika in vong,a kimsorn pa,a chanboroth chhorn,a tambri housen,b,c amy elizabeth parry,c wim van damme,d por ira and chhorvann chheaa correspondence to srean chhim (email: srean168@gmail.com) wpsar vol 14, no 1, 2023 | doi: 10.5365/wpsar.2023.14.1.974 https://ojs.wpro.who.int/2 chhim et alnational institute of public health’s role in covid-19 response we conducted a desk review of covid-19 policies and guidelines developed during the pandemic to identify those authored by niph and reviewed training reports related to covid-19 that were obtained from niph’s accounting team to assess the number of people trained and the topics of the trainings. therefore, the findings reflect an internal audit of the roles of and activities conducted by niph staff and should be interpreted with this in mind. results this descriptive assessment of the roles of and activities conducted by niph staff as part of the covid-19 response showed that niph was involved in actions that supported all but one of the pillars – that is, niph was not involved in risk communication and community engagement (table 1). pillar i: incident management and planning during cambodia’s covid-19 response, the prime minister was the lead incident manager, with high-level committees providing advice. the high-level committees included the provincial covid-19 committee, chaired by the provincial governors, which monitored responses in each province; the high-level ministry of health task force, which mobilized resources; and the technical working group, led by cambodia’s cdcd with technical support from governmental and nongovernmental stakeholders, which provided technical advice about all aspects of the covid-19 emergency response. the covid-19 response in cambodia was flexible and continually evolving. to manage the increase in covid-19 cases in 2021, the prime minister issued six strategies: • strategy 1 – prevent imported cases of delta variant sars-cov-2; • strategy 2 – decrease the number of areas considered to be at high risk (as defined by the cambodian government) and prevent new infections; • strategy 3 – improve recovery rates and reduce the case–fatality rate; • strategy 4 – strengthen the identification of cases and contacts; for staff to lead research projects and facilitating staff attendance at shortand long-term capacity-building training activities abroad. more recently, niph provided opportunities for staff to be directly involved in responding to the covid-19 pandemic. niph has three specialized technical units: the school of public health, the health systems research and policy support center and the national reference laboratory. the school of public health was founded in 2007 and offers master’s degrees in public health, epidemiology, human nutrition, hospital administration, and health and community development. the health systems research and policy support center promotes evidence-based health systems policies and governance by conducting research and translating findings into policies or actions. the national reference laboratory promotes and strengthens the quality of laboratory services for public health, as well as housing a biosafety level 2-plus facility that is capable of conducting molecular surveillance, using methods such as polymerase chain reaction (pcr)-based amplification and next-generation sequencing, to detect pathogenic or infectious organisms posing moderate health hazards. niph was involved in many aspects of the covid-19 response in cambodia, and this descriptive assessment documents its contributions. methods this descriptive assessment examines the contributions made by niph to the covid-19 response in cambodia between 1 january 2020 and 31 december 2021 by comparing it with the country’s adaptations of the nine pillars of the world health organization’s (who’s) 2020 covid-19 strategic preparedness and response plan.4 the nine pillars were adapted and used in cambodia’s master plan for its covid-19 response as (i) incident management and planning, (ii) laboratory services, (iii) surveillance, (iv) points of entry, (v) rapid response teams, (vi) infection prevention and control, (vii) case management and continuity of essential services, (viii) logistics, procurement and supply management and (ix) risk communication and community engagement (table 1).4 we conducted secondary analyses of national covid-19 testing data owned by the inter-ministerial committee to combat covid-19 that was managed by the communicable disease control department (cdcd). wpsar vol 14, no 1, 2023 | doi: 10.5365/wpsar.2023.14.1.974https://ojs.wpro.who.int/ 3 national institute of public health’s role in covid-19 responsechhim et al table 1. the nine pillars of the world health organization’s 2020 covid-19 strategic preparedness and response plan1 as adapted by the cambodia national institute of public health and how the institute supported each pillar pilar description roles of niph i. incident management and planning ability of the government to provide guidance and planning assumptions, and make appropriate modifications to laws or regulations at all levels and sectors to enable an effective response niph had representation on six national subcommittees, as well as on ministry of health committees; provided technical advice and coauthored four national guidelines and policies addressing rapid testing for covid-19, conducting vaccination campaigns, preventing transmission in health-care facilities and providing treatment. ii. laboratory services ability to perform sars-cov-2 testing rapidly without the need to ship specimens overseas niph’s laboratory tested 50% of all samples for sars-cov-2 and provided technical advice to help establish 18 new laboratories for this testing. iii. surveillance ability to detect cases and report to global surveillance databases niph tested 4636 samples for the national severe acute respiratory infection and influenza-like illness surveillance systems, collaborated to establish covid-19 testing sites throughout phnom penh and produced 31 reports that used epidemiological and laboratory data and that were distributed to stakeholders. iv. points of entry ability to detect cases, isolate them and quarantine contacts properly at the points of entry (international borders) niph collected specimens at the phnom penh international airport and trained 238 trainers in specimen collection, covid-19 case management and the fundamentals of isolation and quarantine. v. rapid response teams teams were created to investigate suspected covid-19 cases and initiate treatment, if appropriate niph trained 504 rapid response team trainers in covid-19 responses and contact tracing. vi. infection prevention and control ensure health-care workers are protected from infection with sars-cov-2 during amplification events in health-care facilities, such as while providing testing and care niph coauthored the standard operating procedures for covid-19 vaccination and also information about prevention and control of covid-19 transmission at health facilities and clinics in cambodia. vii. case management and continuity of essential services designate referral facilities to care for patients with sars-cov-2 and ensure that essential services for other patients are continued niph in collaboration with its partners, trained 1497 trainers, including health-care staff and volunteers, to build capacity to care for covid-19 patients. viii. logistics, procurement and supply management ability to communicate rapidly, regularly and transparently with the population in 2021, niph prepared testing packages for mobile testing teams that were used to collect 735 396 specimens in phnom penh. ix. risk communication and community engagement niph did not play a role in supporting activities associated with this pillar. niph did not play a role in supporting activities associated with this pillar. covid-19: coronavirus disease; niph: national institute of public health; sars-cov-2: severe acute respiratory syndrome coronavirus 2. to aid in incident management and planning, niph provided technical advice and developed guidelines and policies. niph experts took part in several subcommittees, including the subcommittees for: • evaluation, planning and strategy; • management at points of entry and quarantine; • rapid response and investigation; • strategy 5 – improve the handling of the bodies of those who died from covid-19 while transferring them for cremation; and • strategy 6 – boost the vaccination rate. the government created 10 subcommittees to implement these strategies, which were chaired by the inter-ministerial committee. wpsar vol 14, no 1, 2023 | doi: 10.5365/wpsar.2023.14.1.974 https://ojs.wpro.who.int/4 chhim et alnational institute of public health’s role in covid-19 response management system to ensure that results could be appropriately recorded and reported to the ministry of health; and providing guidance to provincial laboratory staff to ensure that the pcr testing process was verified correctly. pillar iii: surveillance the cdcd managed the covid-19 surveillance system with support from niph and other institutions. to support this pillar, niph undertook three activities. first, niph tested the specimens collected through the national severe acute respiratory infection (sari) and influenza-like illness (ili) surveillance systems.6 these specimens were tested for sars-cov-2 and influenza. between 1 january 2020 and 31 december 2021, niph tested a total of 6706 of these specimens: 4636 (69.1%) were sari and sars-cov-2 specimens and 2070 (30.9%) were ili and sars-cov-2 specimens. second, niph collaborated with the samdech techo voluntary youth doctor association (tyda) to establish covid-19 testing sites throughout phnom penh. in 2020 and 2021, these sites collected 852 137 specimens, accounting for 33.1% of all specimens collected in the country. last, niph formed a covid-19 data team that produced weekly reports for timely dissemination to several key stakeholders involved in the response. these reports included epidemiological data (i.e. the numbers of cases and deaths, specifying person, place and time); laboratory data (i.e. the number of samples tested and positivity rates, by district and commune); and other dynamic content (i.e. vaccine effectiveness rates, case forecasts, case reproduction numbers [the estimated number of secondary cases caused by a primary case] and proportions of different covid-19 strains among positive samples). niph had produced 31 reports by 30 april 2022. pillar iv: points of entry up until 31 december 2021, niph in collaboration with tyda collected specimens from travellers at phnom penh international airport and trained 238 trainers in border management for covid-19. the training covered specimen collection, infection prevention, and fundamentals of isolation and quarantine. • technical advice and treatment; • laboratory services; and • education, training and public affairs. niph was also an active member of the high-level ministry of health task force, the technical working group and the committee for vaccination. as a member of these committees, niph contributed to shaping the national covid-19 response. niph experts coauthored four national guidelines. the policies and guidelines coauthored by niph included the: • guideline for the prevention and control of covid-19 transmission in health facilities and clinics in cambodia (july 2020); • guidelines for the use of rapid tests for covid-19 in private health services (may 2021); • standard operating procedures for covid-19 vaccination (june 2021); and • fourth version of the clinical treatment protocol for covid-19 (jan 2022). pillar ii: laboratory services at the beginning of the pandemic, cambodia heavily relied on the nongovernmental testing capacity available at the institut pasteur du cambodge. niph’s laboratory had to be set up and scaled up rapidly. of the 2 575 391 covid-19 tests conducted in cambodia during 2020 and 2021, niph conducted 1 294 016 (50.2%; fig. 1), while the institut pasteur conducted 827 613 (32.1%) and the other 18 laboratories conducted 453 762 (17.6%). niph also provided technical advice during the establishment of 18 additional laboratories in phnom penh and 11 other provinces about nucleic acid amplification tests (e.g. pcr, cepheid’s genexpert platform and the roche cobas test).5 niph supported five essential elements under pillar ii: assessing provincial laboratories’ quality management systems to ensure that all target laboratories could maintain good-quality testing services; providing training for provincial laboratory staff in pcr testing (i.e. training between 3 and 10 staff in pcr techniques and approximately 5 more staff to conduct related work, such as data entry and basic data management); providing guidance to provincial laboratory staff to ensure that appropriate infrastructure, equipment and supplies for performing pcr testing were available; establishing each provincial laboratory’s information wpsar vol 14, no 1, 2023 | doi: 10.5365/wpsar.2023.14.1.974https://ojs.wpro.who.int/ 5 national institute of public health’s role in covid-19 responsechhim et al fig. 1. number of samples tested daily for covid-19 at the national institute of public health, cambodia, 2020–2021a pillar vii: case management and continuity of essential services in 2020, niph in collaboration with other partners provided 26 trainings to 1497 trainers, both health centre staff and volunteers, about caring for and treating patients with covid-19. training partners included the ministry of health’s department of hospital service, the cdcd, the university of health sciences, calmette hospital, khmer–soviet friendship hospital and the cambodia–china friendship preah kossamak hospital. pillar viii: logistics, procurement and supply management in cambodia, this pillar focused on (a) strengthening supply chains and the distribution of covid-19 commodities, pillar v: rapid response teams by the time cambodia detected its first covid-19 case on 27 january 2020, the cdcd had enlisted more than 2000 rapid response team members.7 between april and july 2020, niph in collaboration with the cdcd trained 504 trainers in covid-19 responses and contact tracing (additional staff were also trained, but niph was not involved). pillar vi: infection prevention and control niph experts were coauthors of two guidelines about infection prevention and control: the standard operating procedures for covid-19 vaccination and the guidelines for prevention and control of covid-19 transmission at health facilities and clinics. a on 21 october 2021, the government reduced active surveillance, advising that testing teams should no longer be sent into communities to collect specimens and only passive surveillance would be maintained (e.g. at hospitals or sentinel sites). wpsar vol 14, no 1, 2023 | doi: 10.5365/wpsar.2023.14.1.974 https://ojs.wpro.who.int/6 chhim et alnational institute of public health’s role in covid-19 response pcr tests per day. in september 2021, during a few extreme days, niph performed 10 000 pcr tests per day. investing in a network of high-quality governmental laboratories was vital to address the current covid-19 crisis, and these will be important assets for future emergency responses. niph participated in policy development and provided advice by having representation on six national covid-19 response subcommittees, as well as on the high-level ministry of health task force, the technical working group and the committee for vaccination. niph’s health systems research and policy support center and the school of public health had increased the institute’s capabilities in research and policy development prior to the pandemic, which enabled it to make contributions to the subcommittees. investments in niph should be sustained to consolidate and further strengthen public health capacities and readiness in the country. this is the only report that describes niph’s contribution to the covid-19 response in cambodia from the perspective of those from the institute who implemented the response. however, the report has limitations. first, as most authors are niph staff, the report may be biased toward the institute. second, the contributions made by other institutions to the covid-19 response, such as those of the institut pasteur du cambodge and the cdcd, have not been included. finally, the overall governance and collaboration of all relevant institutions during the covid-19 response was also not assessed. the role of niph was essential to the covid-19 response in cambodia, particularly in providing laboratory services and technical advice and in contributing to policy development through membership of its staff on national committees. based on the contributions made by niph during the covid-19 pandemic, continued investment in the institute is critical to enable it to provide support during future health emergencies in cambodia. acknowledgements the authors thank the cdcd for providing data, the patients who provided specimens for sars-cov-2 testing, and the staff who collected and entered data into the database. the authors also thank the niph staff who verified the accuracy of information in this article. test kits and other material for testing; and (b) mobilizing resources from both domestic and development partners. in 2020, niph estimated the need for materials and developed distribution strategies using a covid-19 emergency loan and grants from the world bank, the global fund and other agencies. in july 2020, niph successfully applied for a world bank grant of more than us$ 1 million to purchase equipment and materials to set up the new laboratories for pcr testing in phnom penh and 11 provinces. after the laboratories were set up, niph received reports on the usage of the test kits and materials, as well as requests for additional kits and materials. for the ministry of health, the niph also estimated the need for test kits and materials among all public laboratories. in 2021, niph also prepared testing packages for mobile testing teams that were used to collect 735 396 specimens in phnom penh. pillar ix: risk communication and community engagement niph did not contribute to any risk communication and community engagement activities. these were coordinated through the subcommittee for education, training and public affairs, with strong organizational and financial support from partners.8 discussion during the first 2 years of the covid-19 response in cambodia, niph contributed to eight of the nine pillars adapted from who’s 2020 strategic preparedness and response plan. niph’s main contributions were to support laboratory services and incident management and planning. the niph laboratory tested half of the total 2 575 391 covid-19 samples collected in cambodia during 2020 and 2021 and provided technical advice for the establishment of 18 additional laboratories for sars-cov-2 testing across the country. niph’s laboratories did not expect to do so much of the testing. before the pandemic, niph tested only a few hundred sari and ili specimens per week. by july 2021, niph had increased its capacity from 100 pcr tests per day in april 2020 to 6000 wpsar vol 14, no 1, 2023 | doi: 10.5365/wpsar.2023.14.1.974https://ojs.wpro.who.int/ 7 national institute of public health’s role in covid-19 responsechhim et al 3. nit b, samy al, tan sl, vory s, lim y, nugraha rr, et al. understanding the slow covid-19 trajectory of cambodia. public health pract (oxf). 2021;2:100073. doi:10.1016/j.puhip.2020.100073 pmid:33521738 4. 2019 novel coronavirus (2019-ncov): strategic preparedness and response plan. geneva: world health organization; 2020. available from: https://www.who.int/publications/i/item/strategic-preparedness-and-response-plan-for-the-new-coronavirus, accessed 26 april 2022. 5. you v, man s, keo k, tam n, chhea c. a lesson learnt from setting up covid-19 testing services at provincial hospital laboratories during the pandemic in cambodia. cambodia j public health. 2021;2(14):2–7. 6. influenza surveillance in cambodia [online database]. phnom penh: communicable disease control department, ministry of health; 2022. available from: http://www.cdcmoh.gov.kh/surveillance/ influenza-surveillance, accessed 26 april 2022. 7. the first 100 days of the covid-19 response: past investments in health security system pay off, and learning lessons for the future. phnom penh: who representative office for cambodia; 2020. available from: https://www.who.int/cambodia/news/feature-stories/detail/the-first-100-days-of-the-covid-19-response-past-investments-in-health-security-system-pay-off-and-learning-lessons-forthe-future, accessed 26 april 2022. 8. review of risk communication and community engagement initiative for covid-19: prevention behaviours in cambodia. phnom penh: unicef cambodia; 2020. available from: https://www.unicef.org/ cambodia/media/3856/file/finalreport.pdf, accessed 29 october 2022. conflicts of interest sc, ivw, pk, c chhorn, pi and c chhea work at niph. these authors may have positive bias toward niph. ap is an associate editor of western pacific surveillance and response. she was not involved in the editorial decision to publish this manuscript. ethics statement not applicable. funding none. references 1. covid-19 strategic preparedness and response plan: 1 february 2021 to 31 january 2022. geneva: world health organization; 2021. available from: https://apps.who.int/iris/handle/10665/340072, accessed 18 april 2022. 2. who coronavirus (covid-19) dashboard: cambodia [online database]. geneva: world health organization; 2022. available from: https://covid19.who.int/region/wpro/country/kh, accessed 18 april 2022. http://www.cdcmoh.gov.kh/surveillance/influenza-surveillance https://www.unicef.org/cambodia/media/3856/file/finalreport.pdf