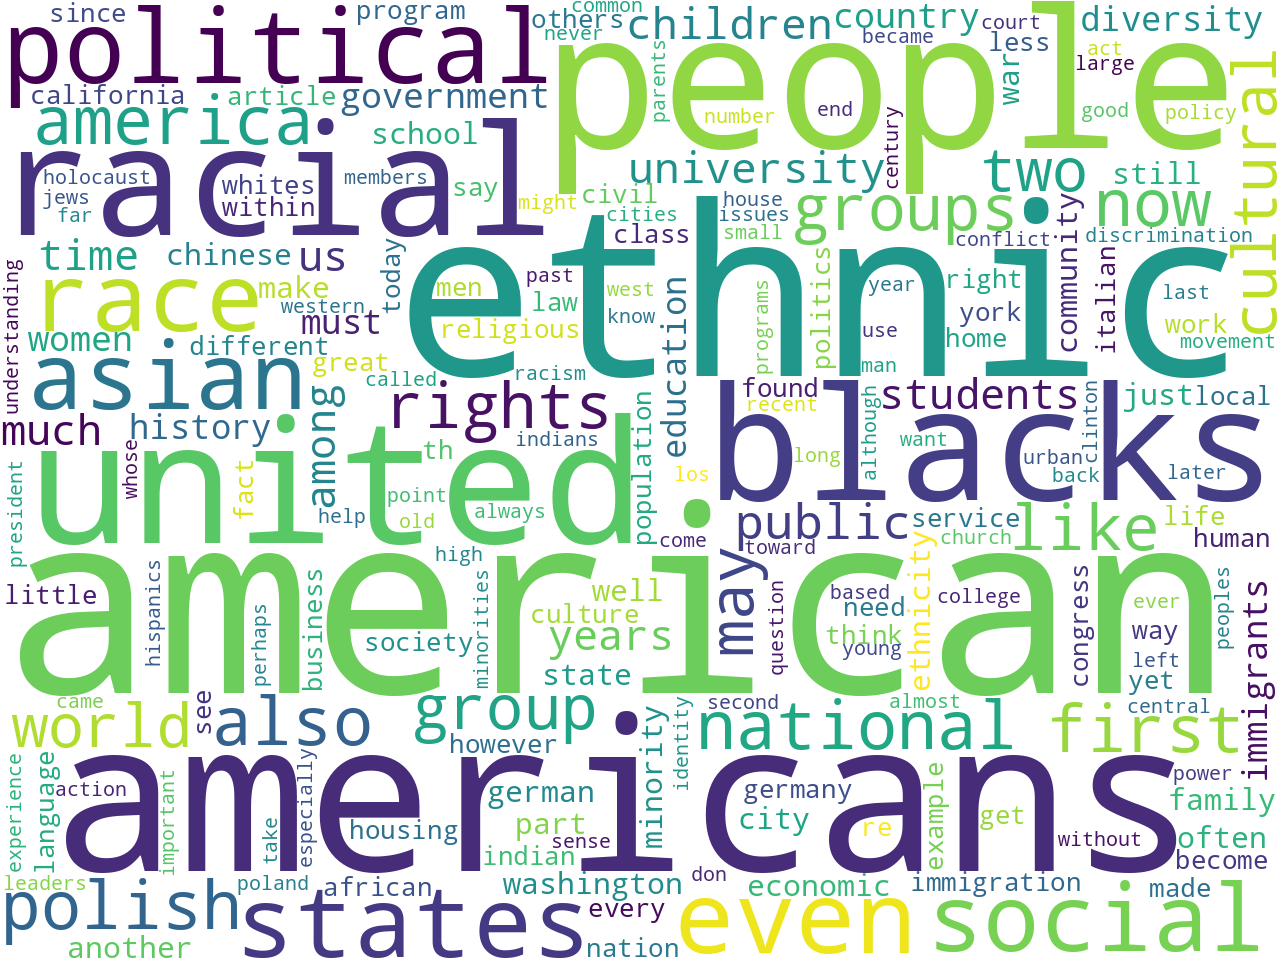
unigrams
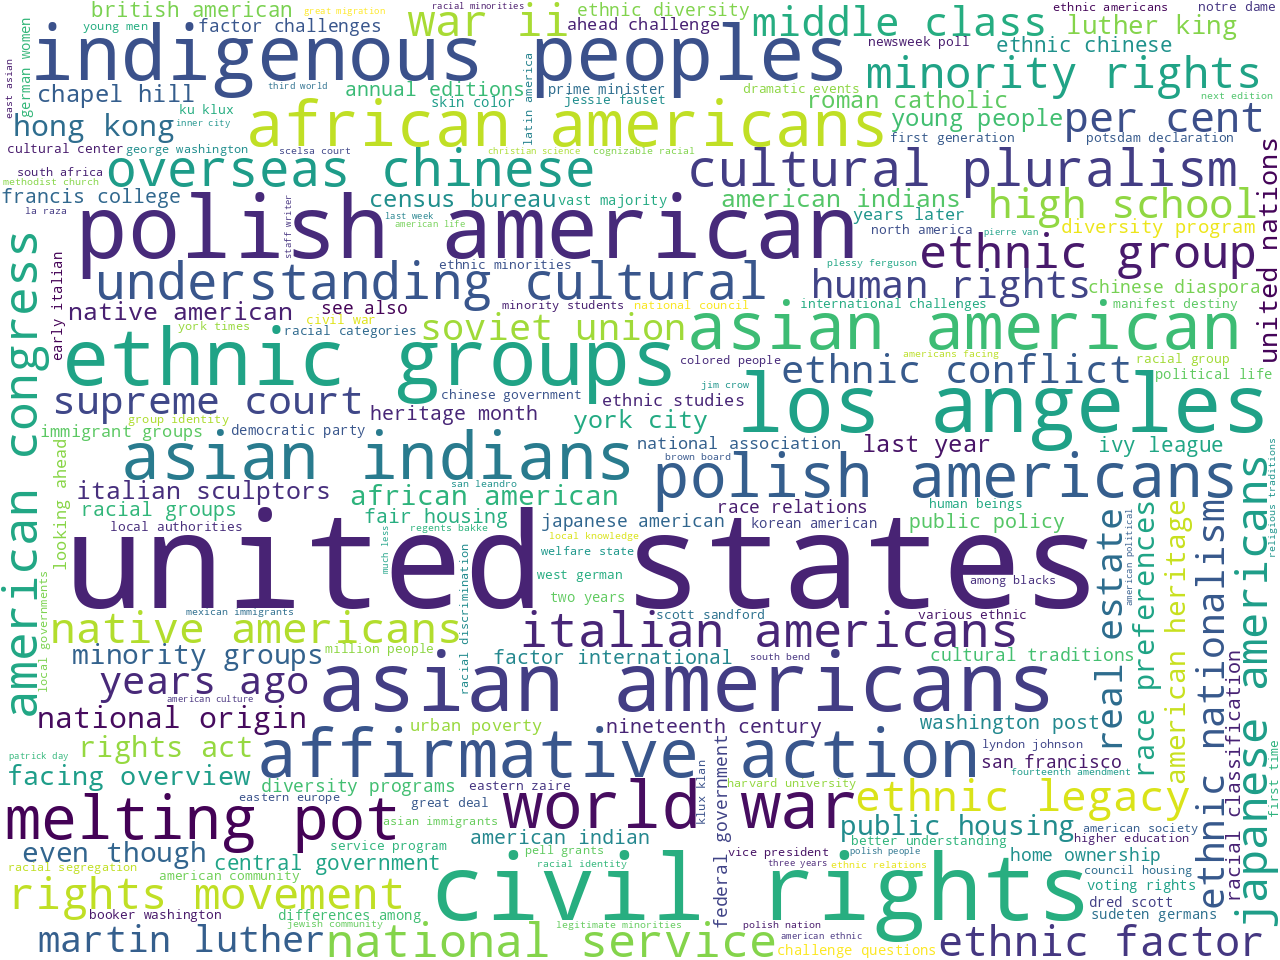
bigrams
I applied bits of text mining, natural langauge processing, and data science to a pair of annual editions of Race and Ethnic Relations, and below is a summary of what I learned.
I was given two editions of Race and Ethnic Relations dated 1994/95 and 1997/98. Each edition is about 275 pages long, and they are comprised of about 50 articles each. I proceeded to digitize each edition, and then I divided each one into 50 segments in an effort to approximate each article.
Once I got this far, I created a data set from the corpus and was able to glean a number of different descriptive statistics. For example, the two works comprise a total of 190,000 thousand words. (The Bible is about 800,000 words long, and Moby Dick is about 250,000 words long.) Word clouds illustrating the frequency of one-word and two-word phrases as well as statistically significant keywords allude to the aboutness of the corpus:
 unigrams |
 bigrams |
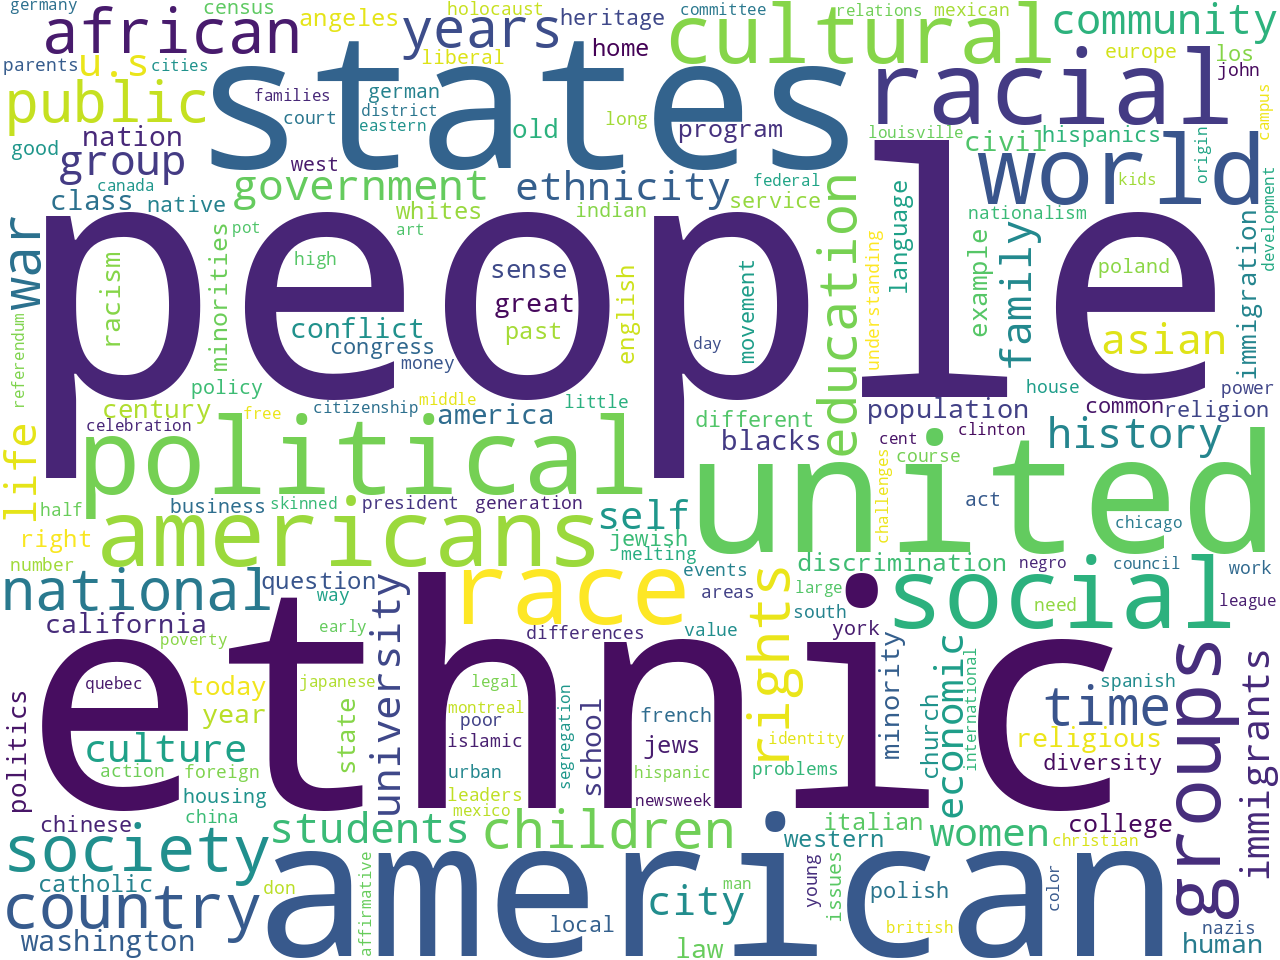 keywords |
A more complete set of desciptive statistics, visualizations, and rudimentary bibligraphics complete with keywords and summaries are availble from a computed summary page.
In an effort to learn more regarding the aboutness of the collection, I applied a technique called "topic modeling" to the whole. Given an integer (T), a topic modeling process divides a corpus into T clusters of words, and each cluster is expected to connote a theme or sub-topic. There is no correct answer for the value of T, after all, "How many things are the works of Shakespeare about?" That said, I denoted T to equal 9 because each edition is dividied into nine thematic units. In the end, the following themes/topics presented themselves:
       themes  weights                                           features
       people  0.91732  people american racial political race groups e...
        asian  0.10205  asian americans american immigrants immigratio...
       blacks  0.09501  blacks diversity university service program wh...
       polish  0.09472  polish poland american church holocaust congre...
       ethnic  0.07865  ethnic housing german cities local education s...
        women  0.07279  blacks women children men simpson african faus...
    ethnicity  0.07120  ethnic ethnicity italian american america cera...
   blumenbach  0.06106  blumenbach quebec montreal referendum french e...
      chinese  0.05595  chinese ethnic germany german china nationalis...
After visualizing the result as a pie chart, the illustdration ought not be too surprising, but on the other hand, the results probably re-enforce and elaborate upon expectations. The editions are about people:
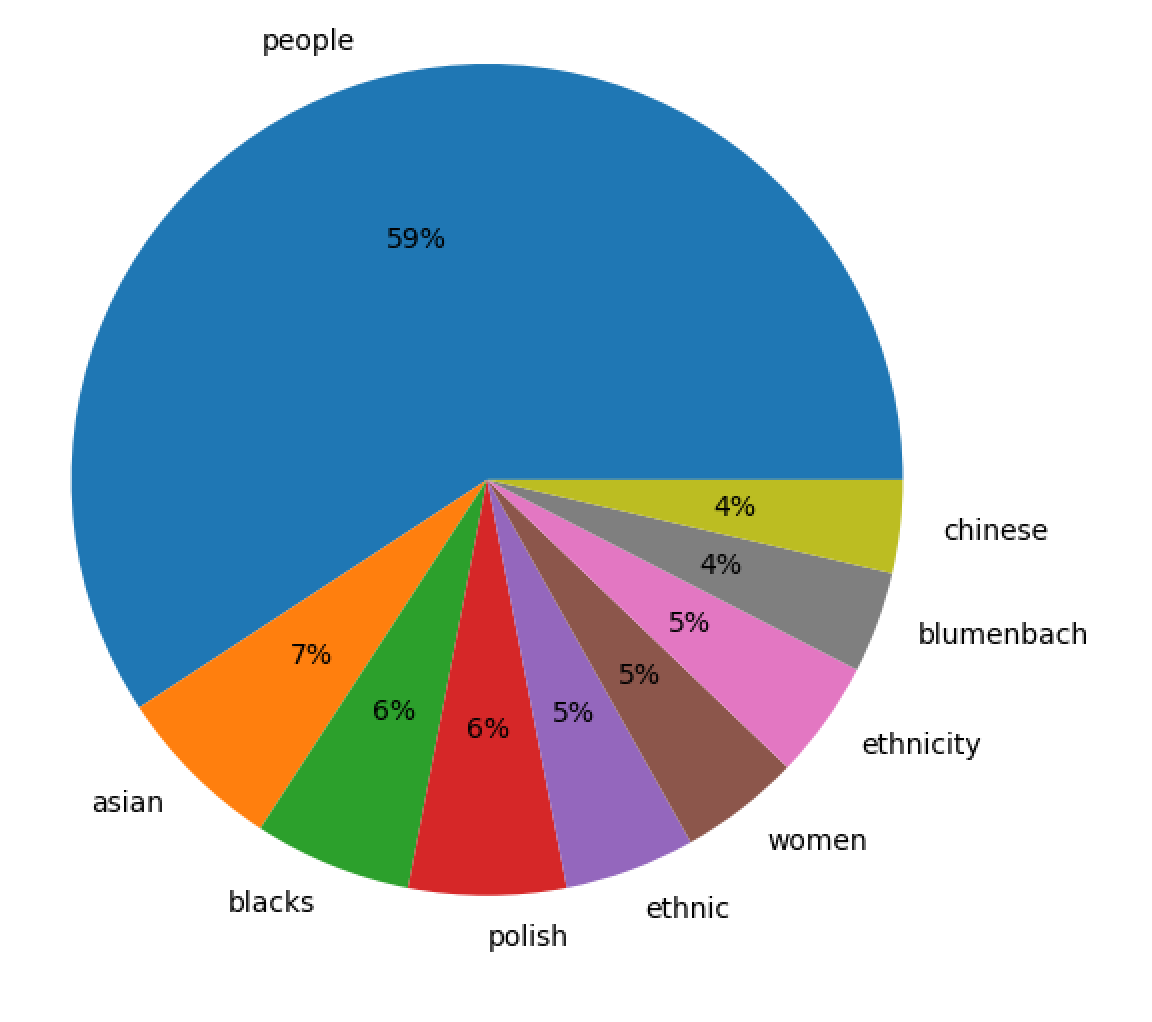 topics |
I then wanted to know, "To what degree are the two editions different when it comes to these themes? Does one edition discuss the themes differently than the other edition?" After suplementing the underlying model with date values and pivoting the result, I can see that both editions are very similar:
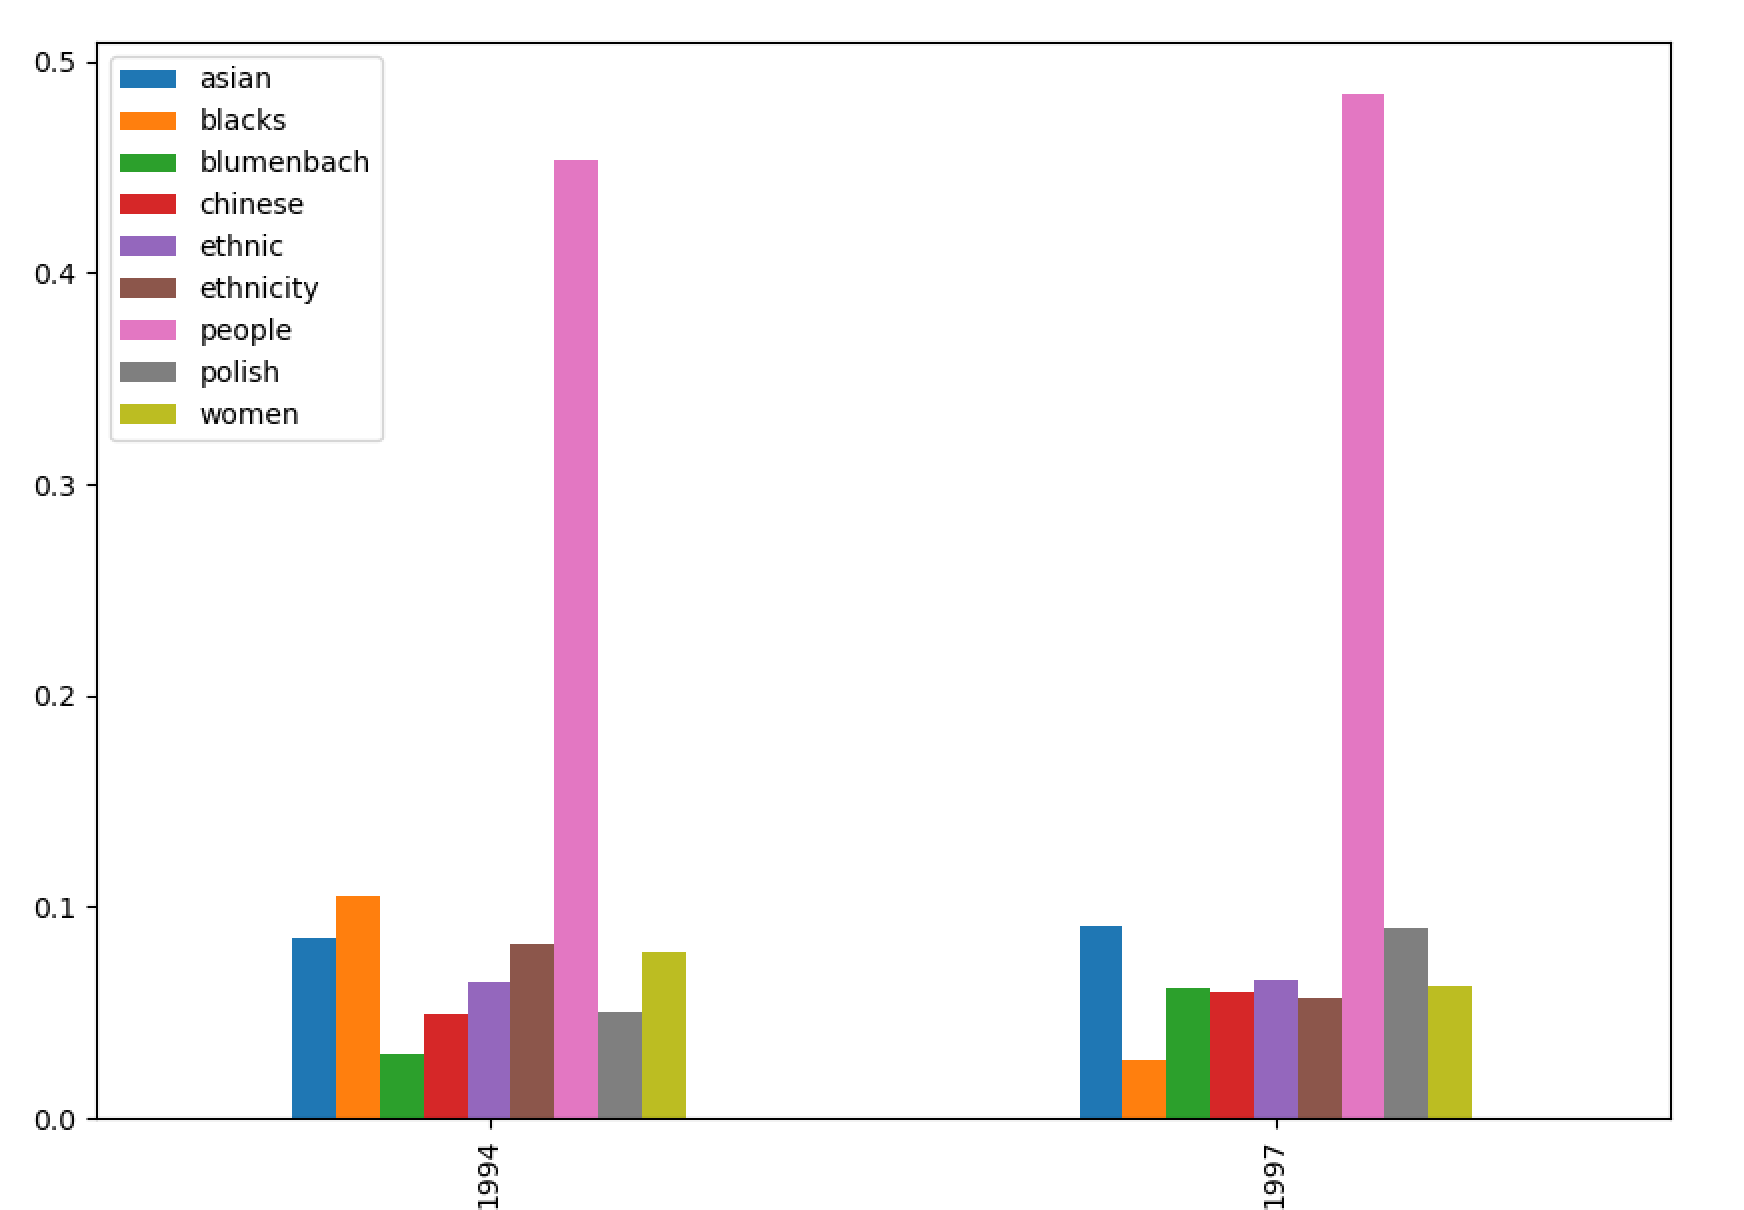 topics by date |
To paraphrase a famous linguist named Firth, "You shall know a word by the company it keeps." With that in mind, I wondered what words were associated with some of the statistically significant keywords (american, race, black, asian, ethnic). To this end I output bigrams containing the given keywords and their frequencies. I then visualized the result as a network diagram. When one of the keywords is mentioned, a set of additional words are mentioned as well:
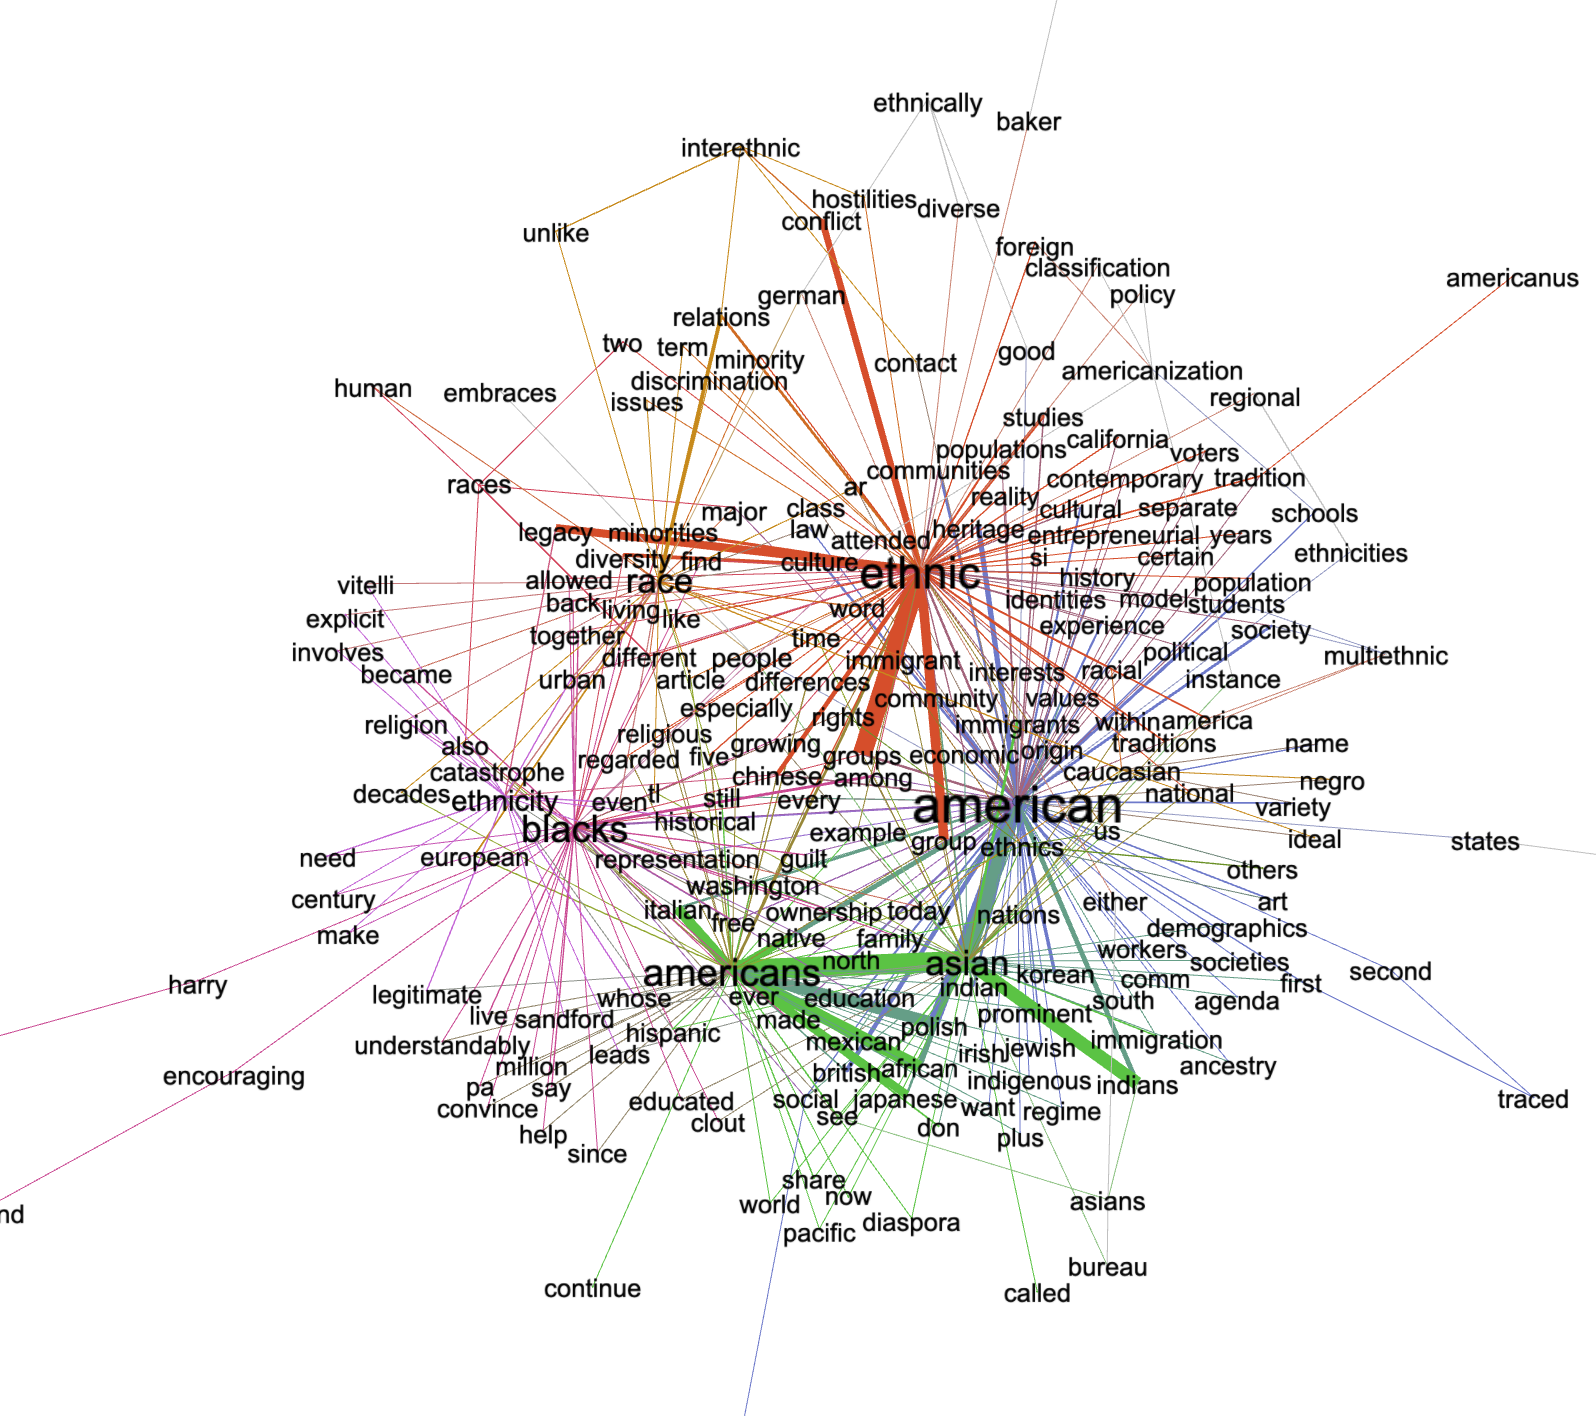 |
Finally, I applied question/answer modeling techniques to the an item in the corpus. More specifically, I identified an item which was deemed about blacks, whites, and americans. I then used a technqiue to: 1) extract a list of questions the item may be able to answer, and 2) list answers to the aforementioned questions. Some of the more interesting question/answer pairs are below, and the complete list has been saved locally:
Given a set of documents, it is possible to automatically extract useful as well as interesting information, but the process can be greatly improved in a number of ways:
The text mining, natural language processing, and data science techniques outlined above are never intended to replace traditional reading. Instead, these processes are intended to suppliement traditional reading. These processes are scalable and reproducable, but they only output obsevations. It is up to people to interpret the observations and generate knowledge.
This data set, in its entirety, ought to be available for downloading at http://carrels.distantreader.org/curated-race_relations-2023/index.zip.
Eric Lease Morgan <emorgan@nd.edu>
Navari Family Center for Digital Scholarship
University of Notre Dame
Date created: February 7, 2023
Date updated: June 1, 2024